

Crypto World
Cardano Price Breakout Failed Despite $340 Million Whale Buying

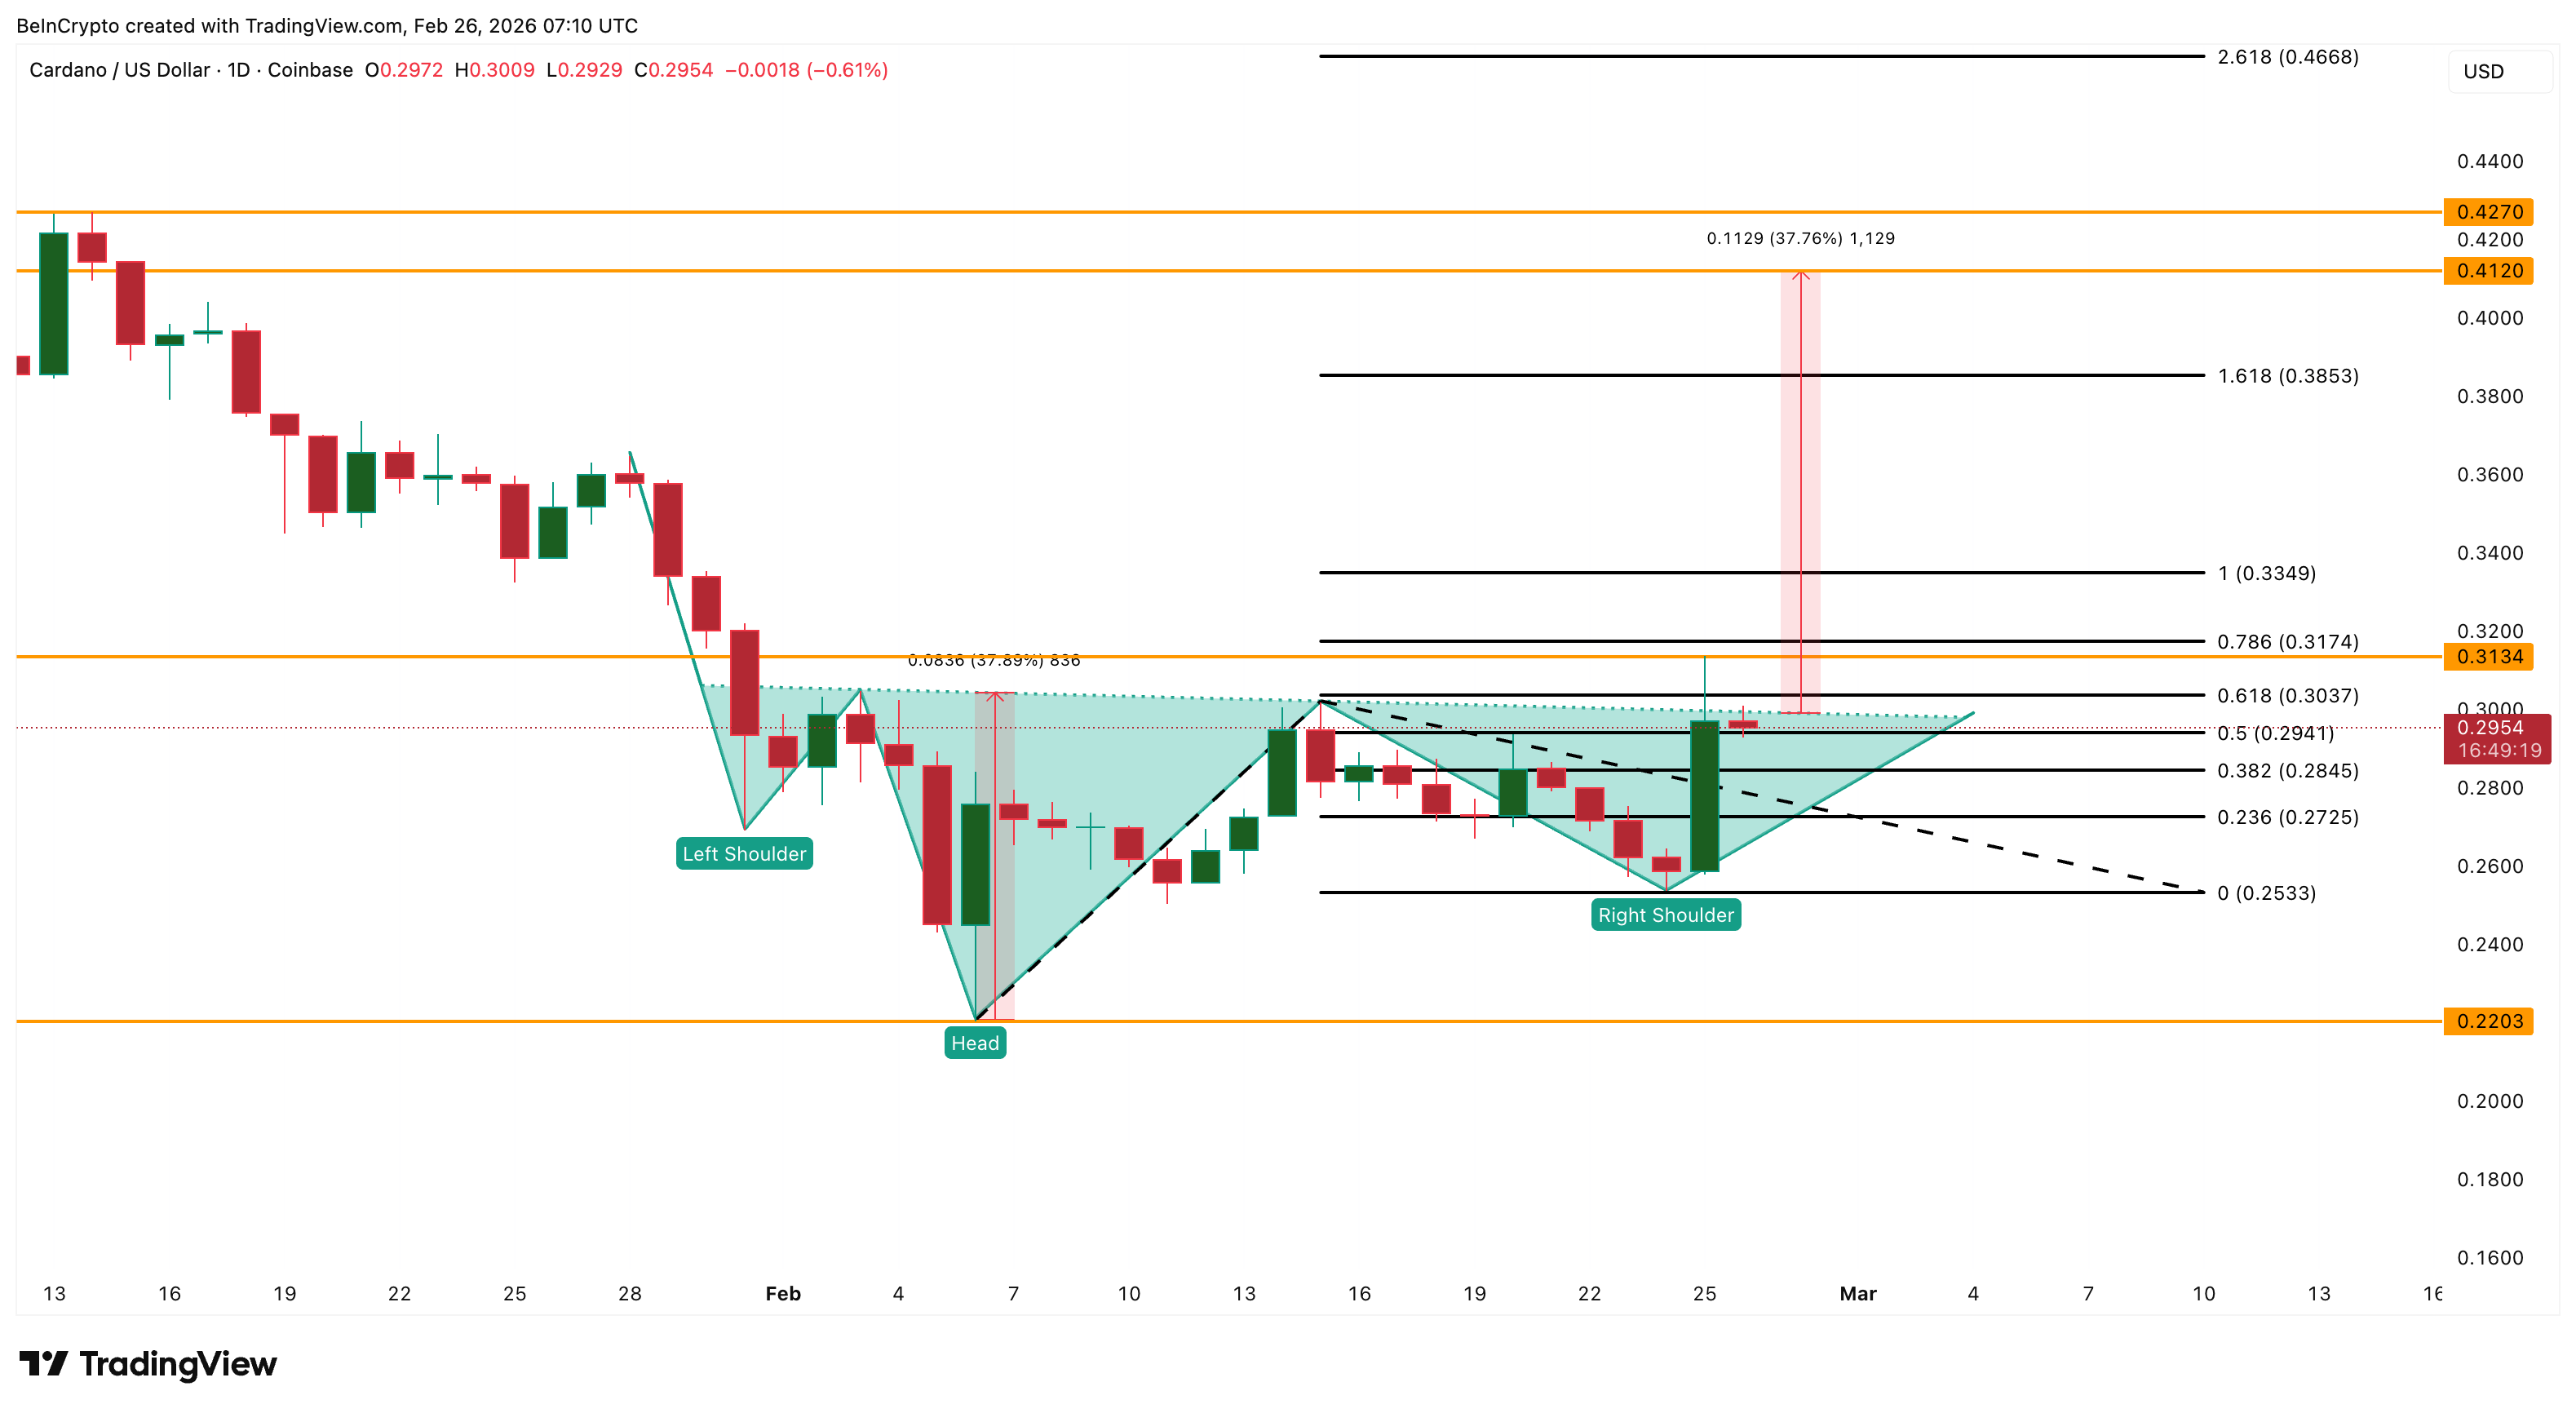
The Cardano price is still up nearly 12% over the past 24 hours, holding near $0.29 after rebounding from its recent lows. On the surface, this looks like the start of a larger recovery. The price even attempted a breakout that projected a roughly 38% rally toward $0.41. But that breakout has failed so far.
The rejection was not sudden. It happened despite massive whale buying worth about $340 million. The real story is deeper. Multiple hidden forces, including conflicting whale activity and liquidation risk, quietly blocked the rally.
Bullish Divergence And Breakout Setup Initially Pointed To A 38% Rally
The recovery setup began forming weeks earlier. Between January 31 and February 24, the Cardano price formed a lower low. This means the price dropped to a new bottom compared to the previous swing. Normally, that signals weakness. But at the same time, the Relative Strength Index (RSI) formed a higher low.
RSI is a momentum indicator that measures buying and selling strength. When RSI rises while price falls, it creates a bullish divergence, a reversal cue. This usually signals that selling pressure is weakening, even as the price continues to decline.
This exact pattern appeared within an inverse head-and-shoulders structure, a classic bullish reversal pattern. When Cardano approached the neckline level on February 25, it appeared ready to break out. The projected upside from this pattern was about 38%.
Want more token insights like this? Sign up for Editor Harsh Notariya’s Daily Crypto Newsletter here.
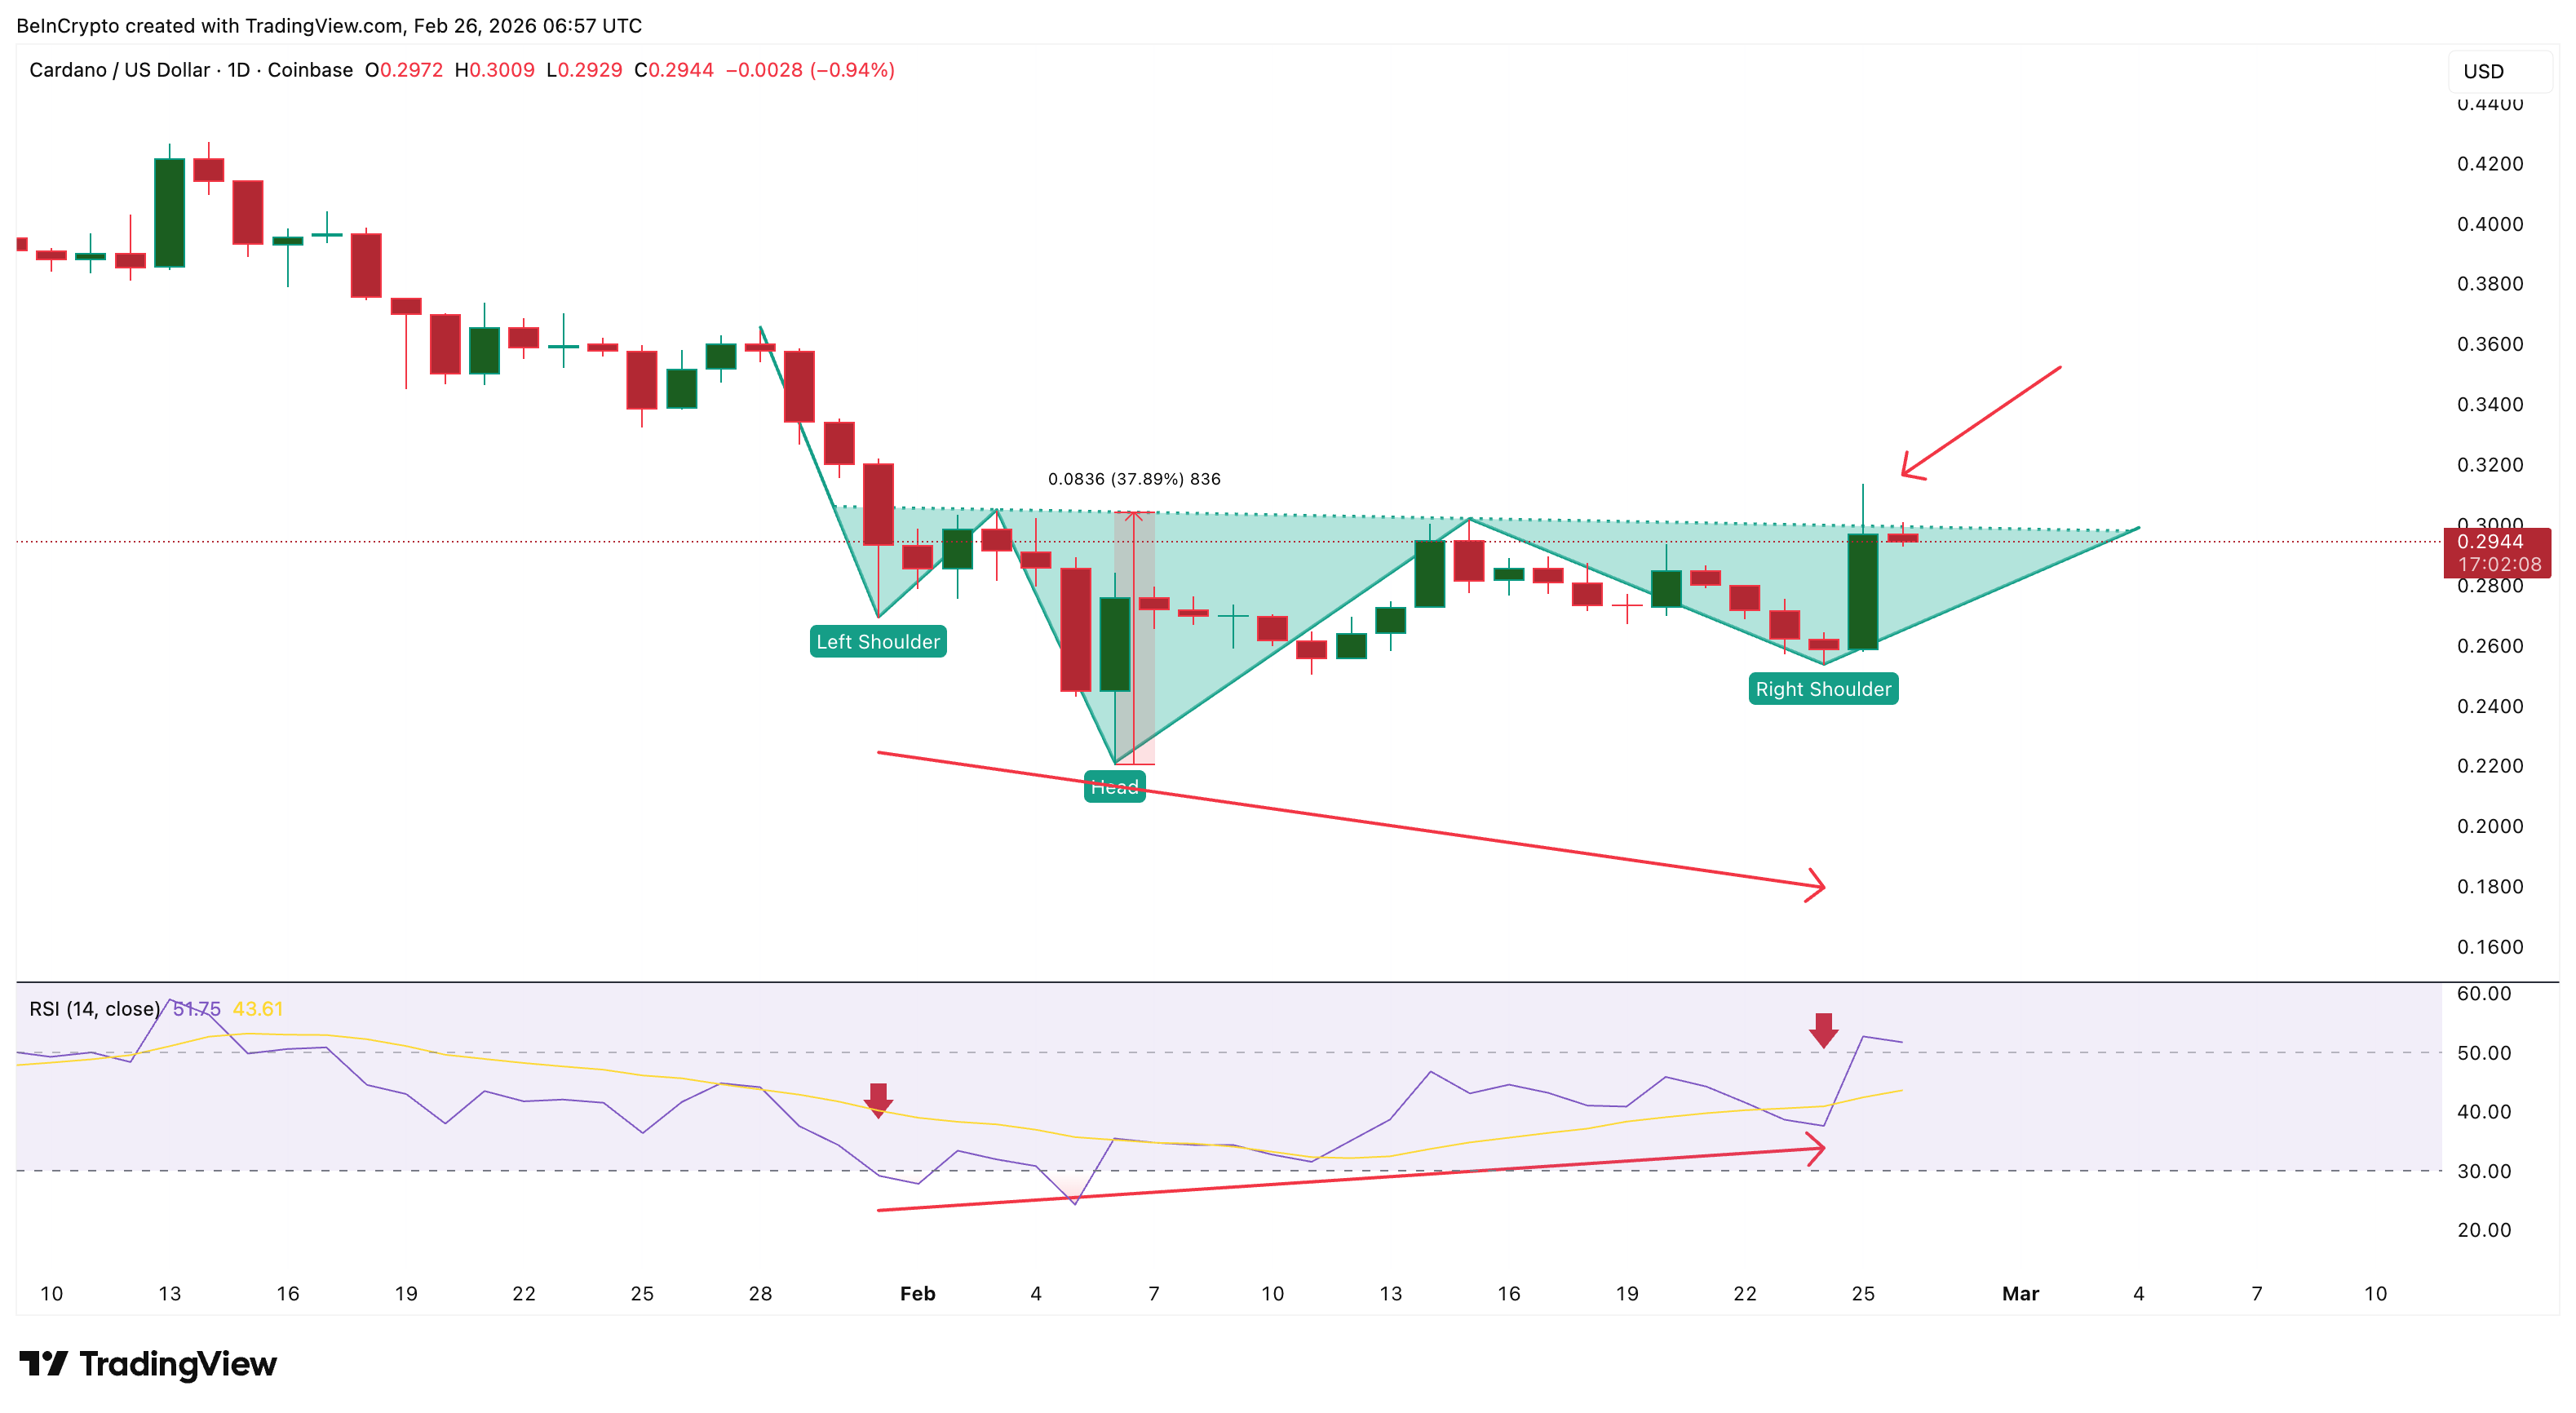
But instead of breaking cleanly, Cardano formed a long upper wick and fell back. This long wick shows sellers entered aggressively and absorbed the buying pressure before the breakout could be confirmed. At this point, the breakout failed.
The failed breakout did not happen without warning. Right after the rejection on February 25, another dangerous signal appeared on the chart — a hidden bearish divergence.
Between January 21 and February 25, the Cardano price formed a lower high. This means the recent peak was still weaker than the previous rally peak. But during the same period, the Relative Strength Index (RSI) formed a much higher high.
This is called a hidden bearish divergence. It happens when momentum rises faster than price, but price still fails to break key resistance. This usually signals that the rally is running out of strength and that sellers are preparing to regain control.
The timing makes this signal even more important. The divergence as Cardano printed the long upper wick on February 25 and failed to break above $0.31.
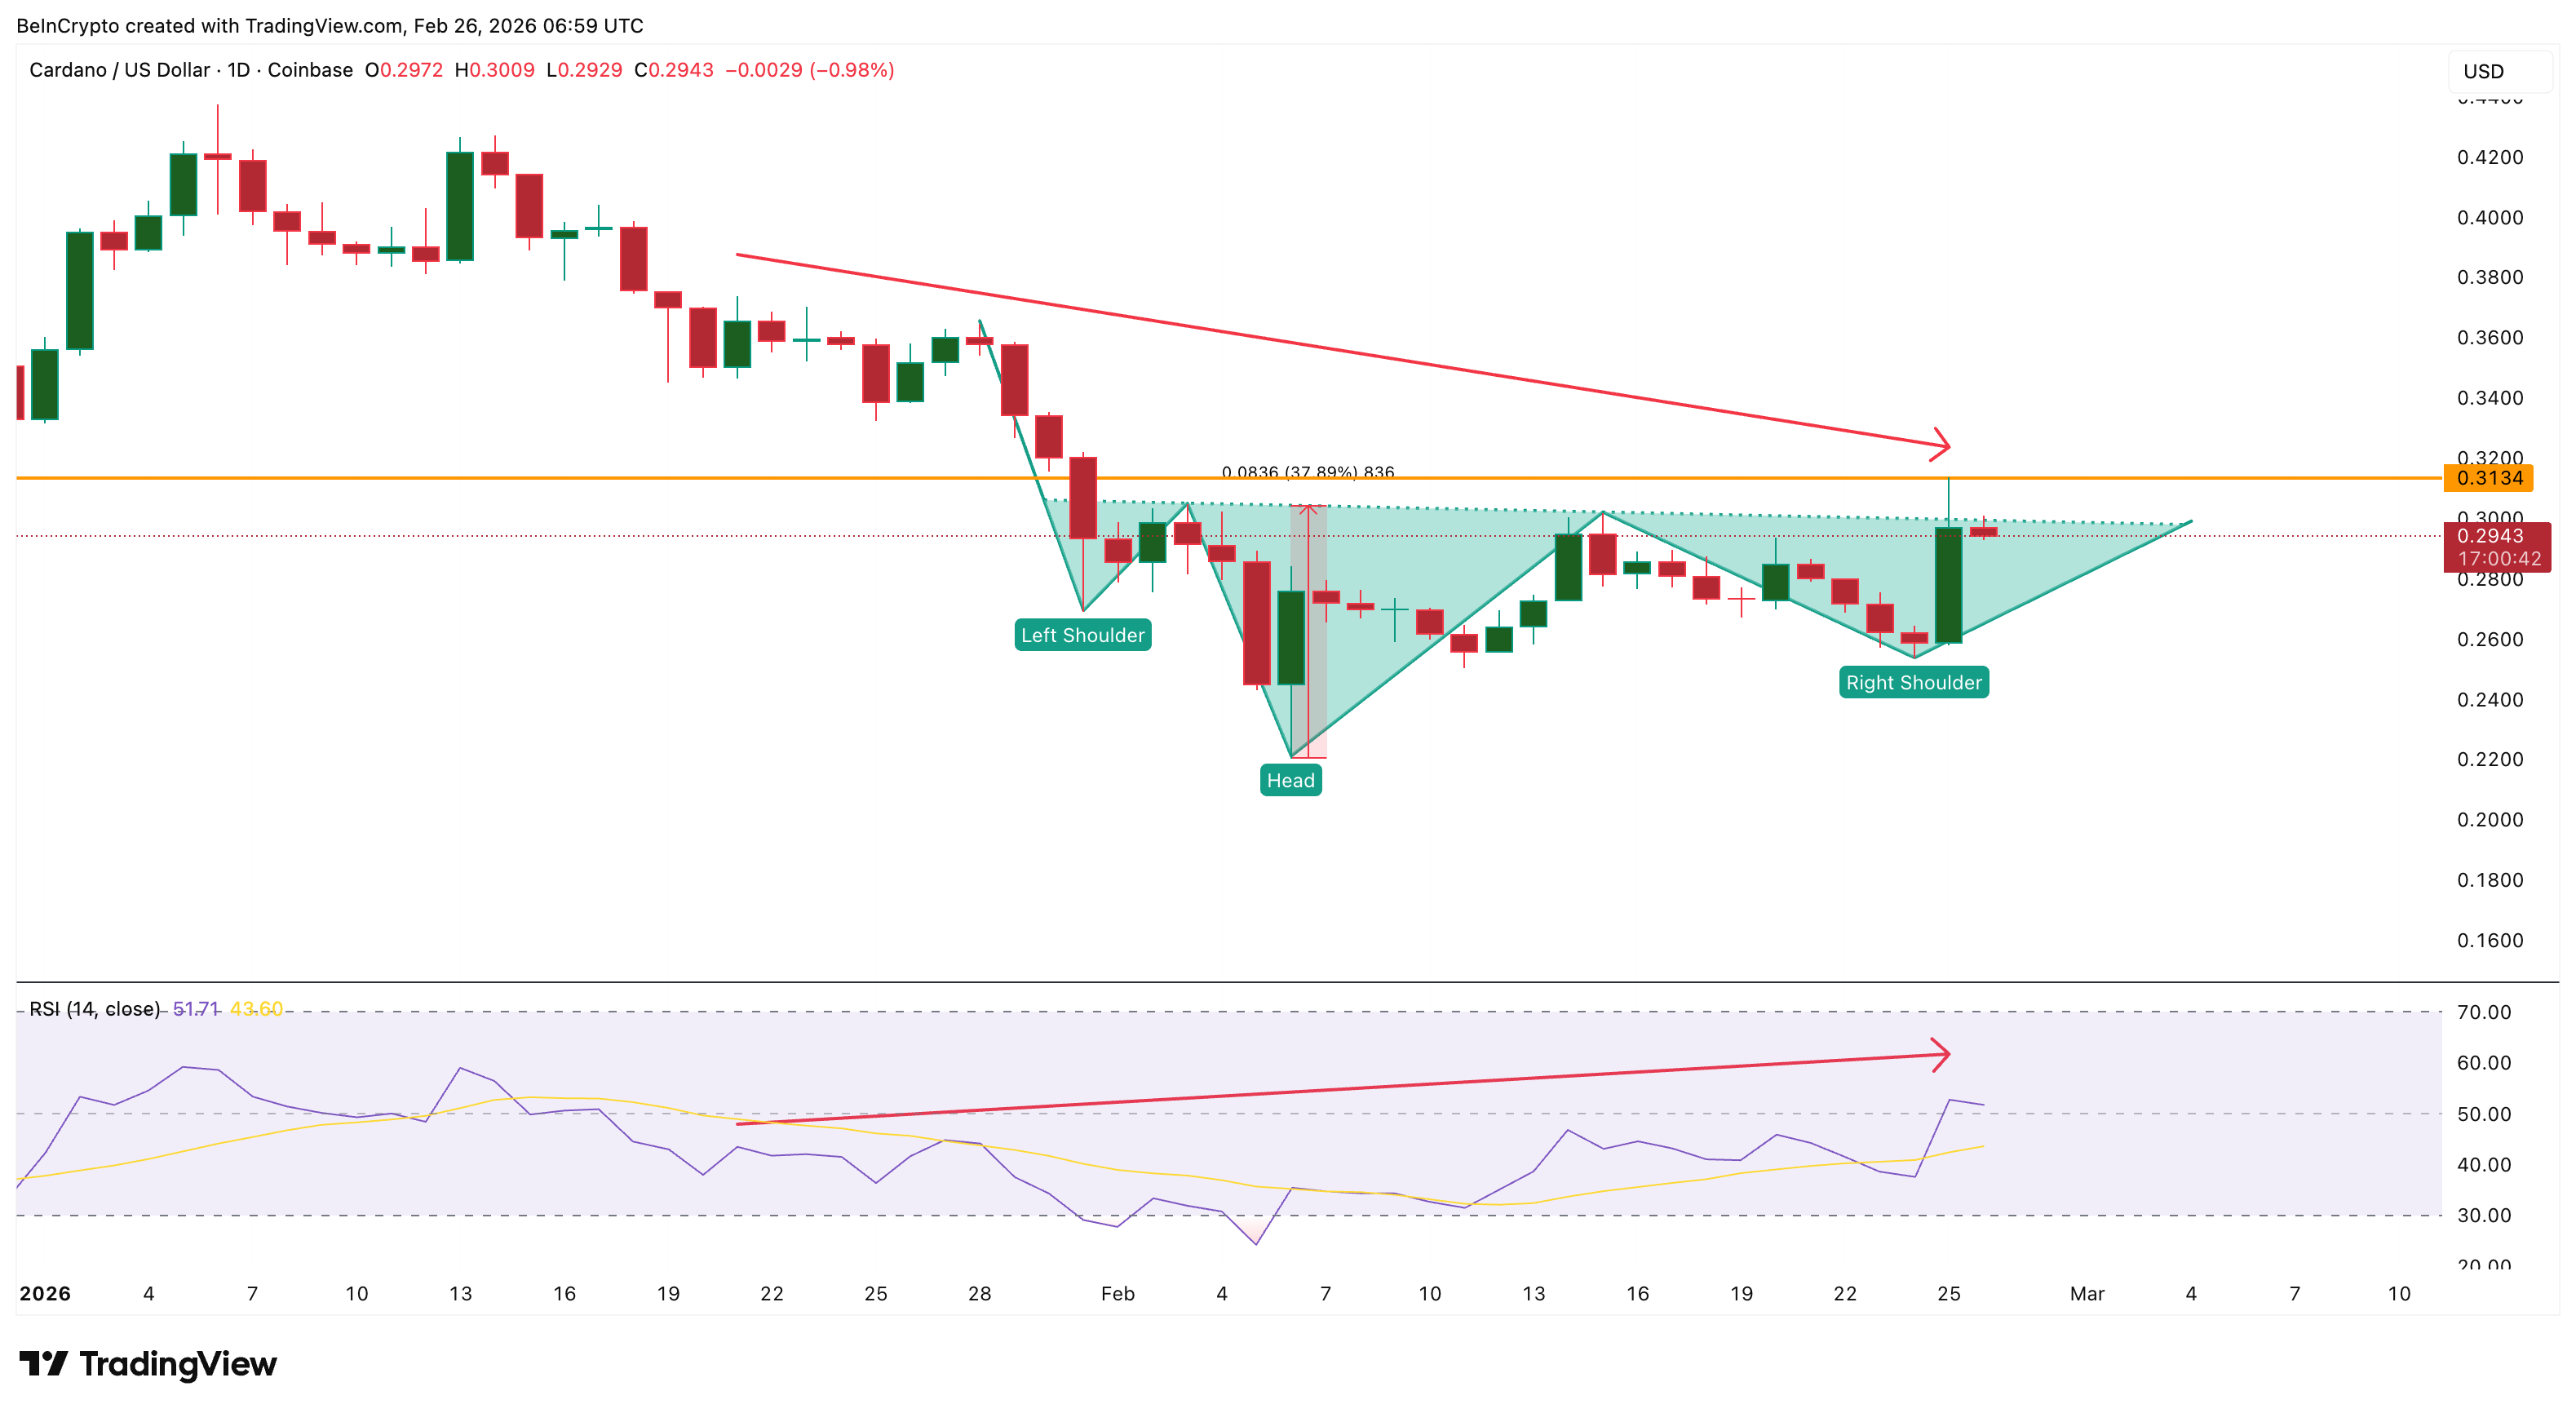
This confirms that the breakout rejection was not just random profit-taking. It was a structural rejection backed by weakening price strength beneath rising momentum. Hidden bearish divergences often lead to pullbacks. That pullback now appears to have already started, with Cardano slipping back below its breakout level.
This creates a risky situation. The bullish breakout structure is still technically alive, but only if the pullback remains limited. A deeper decline would confirm that sellers have fully regained control.
$340 Million Whale Buying Happened — But Larger Whales Quietly Sold Much More
At first glance, whale data looked extremely bullish. Wallets holding between 100 million and 1 billion ADA increased their holdings from 2.33 billion ADA to 3.47 billion ADA. This means they bought 1.14 billion ADA, worth about $340 million. This is the buying activity most traders possibly saw.
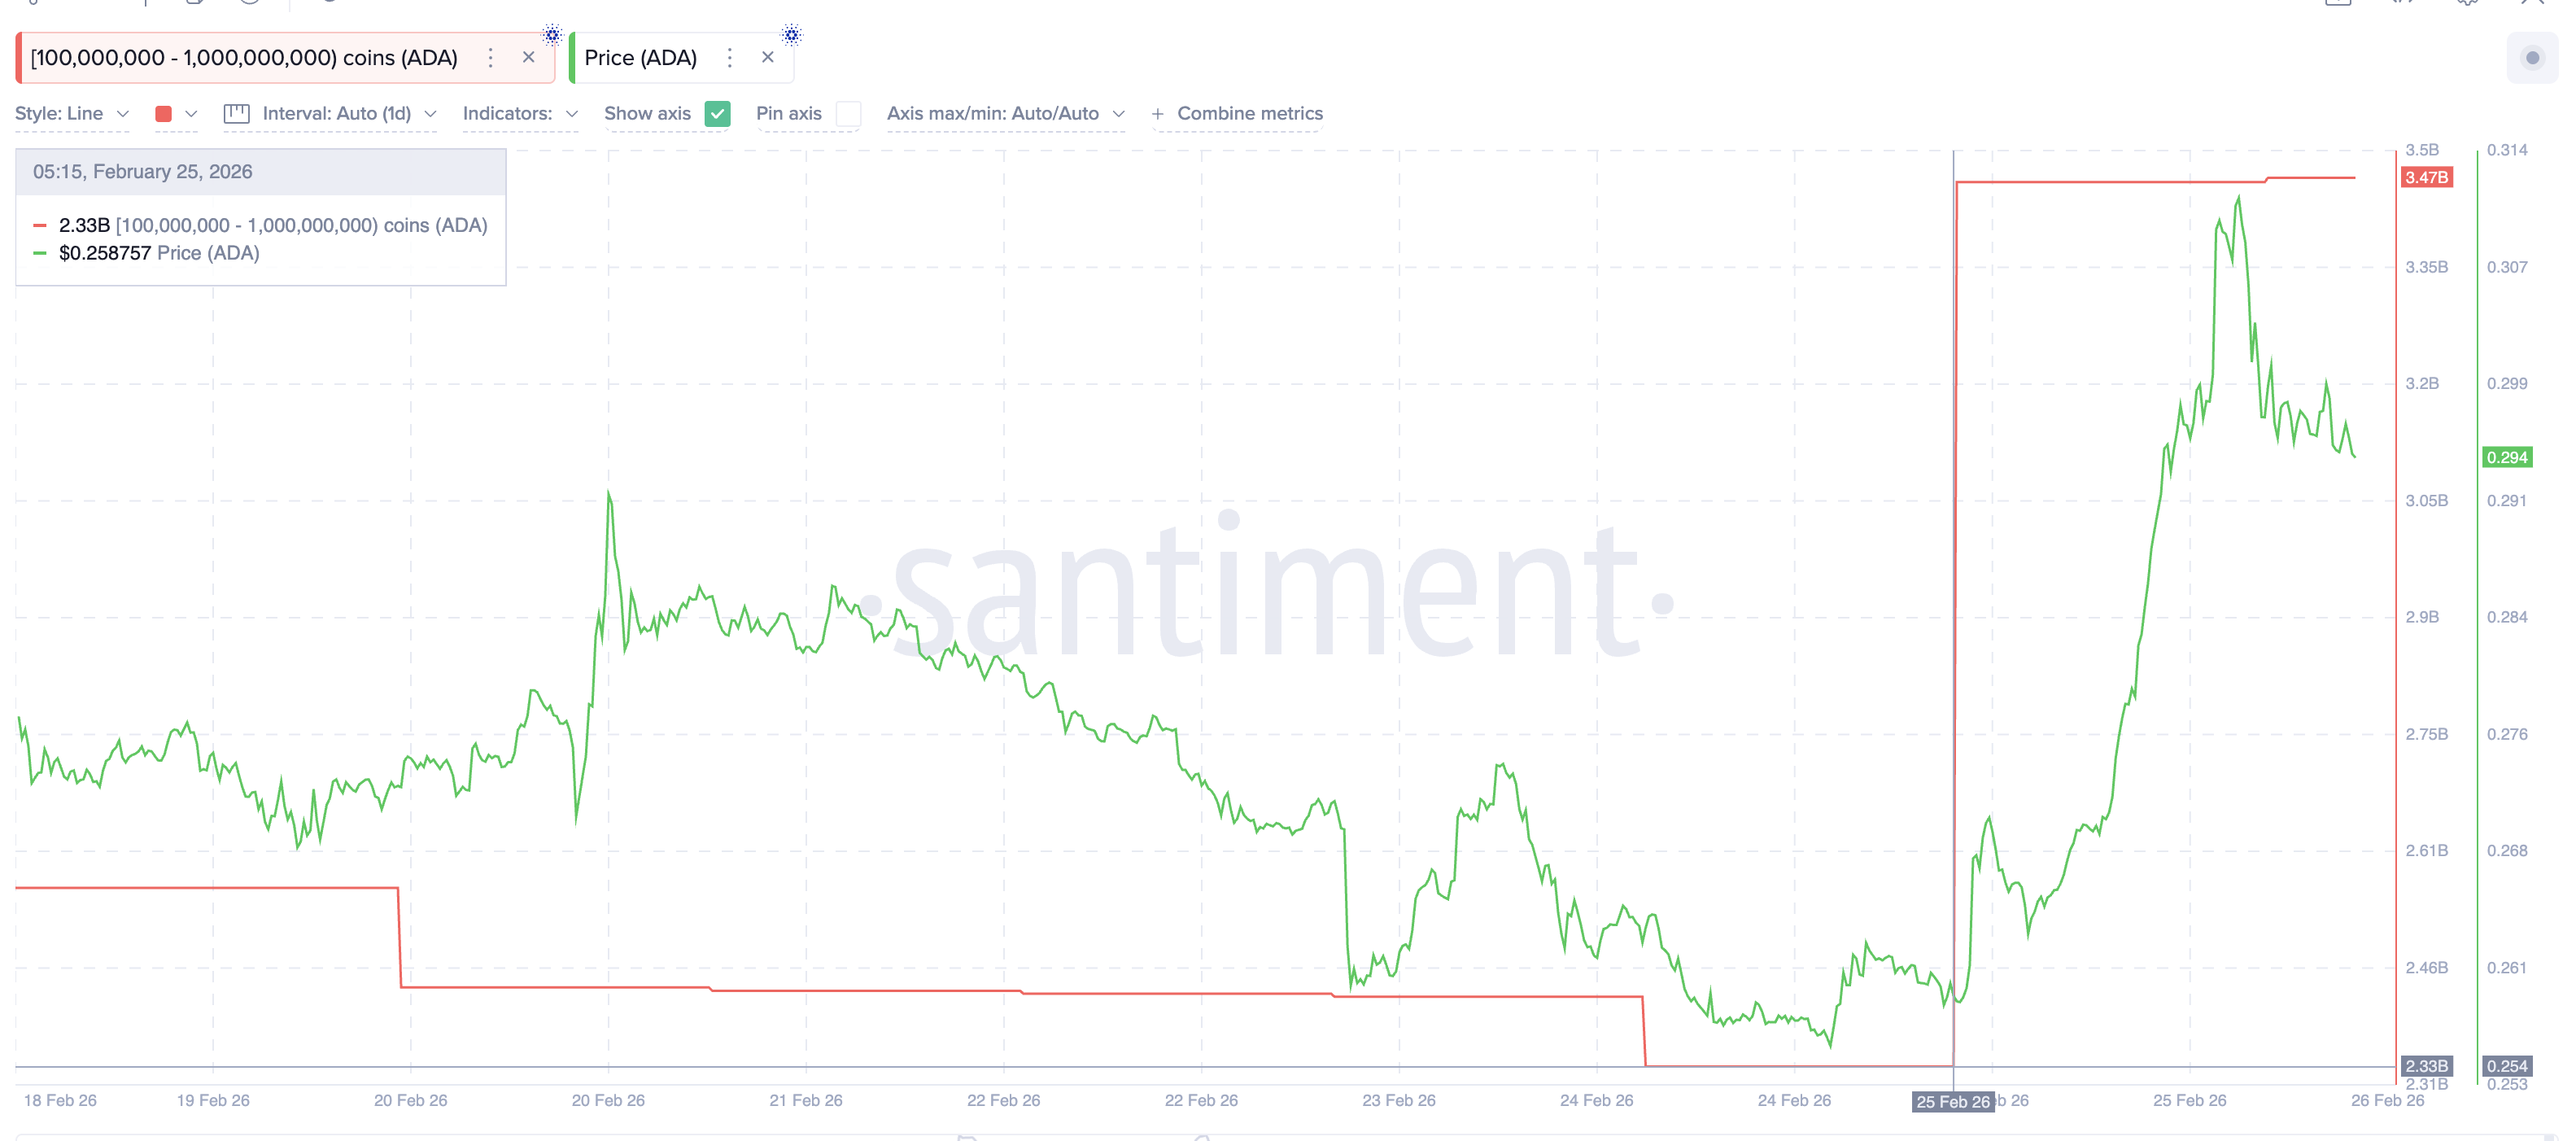
But this was only part of the picture. Other whale groups were selling heavily at the same time. The largest whales, holding over 1 billion ADA, reduced their holdings from 2.89 billion to 1.88 billion ADA. This equals 1.01 billion ADA sold, worth about $297 million.
Mid-size whales holding 10 million to 100 million ADA sold 70 million ADA, worth about $21 million. Smaller whales holding 1 million to 10 million ADA sold 3.41 billion ADA, worth about $1.0 billion.
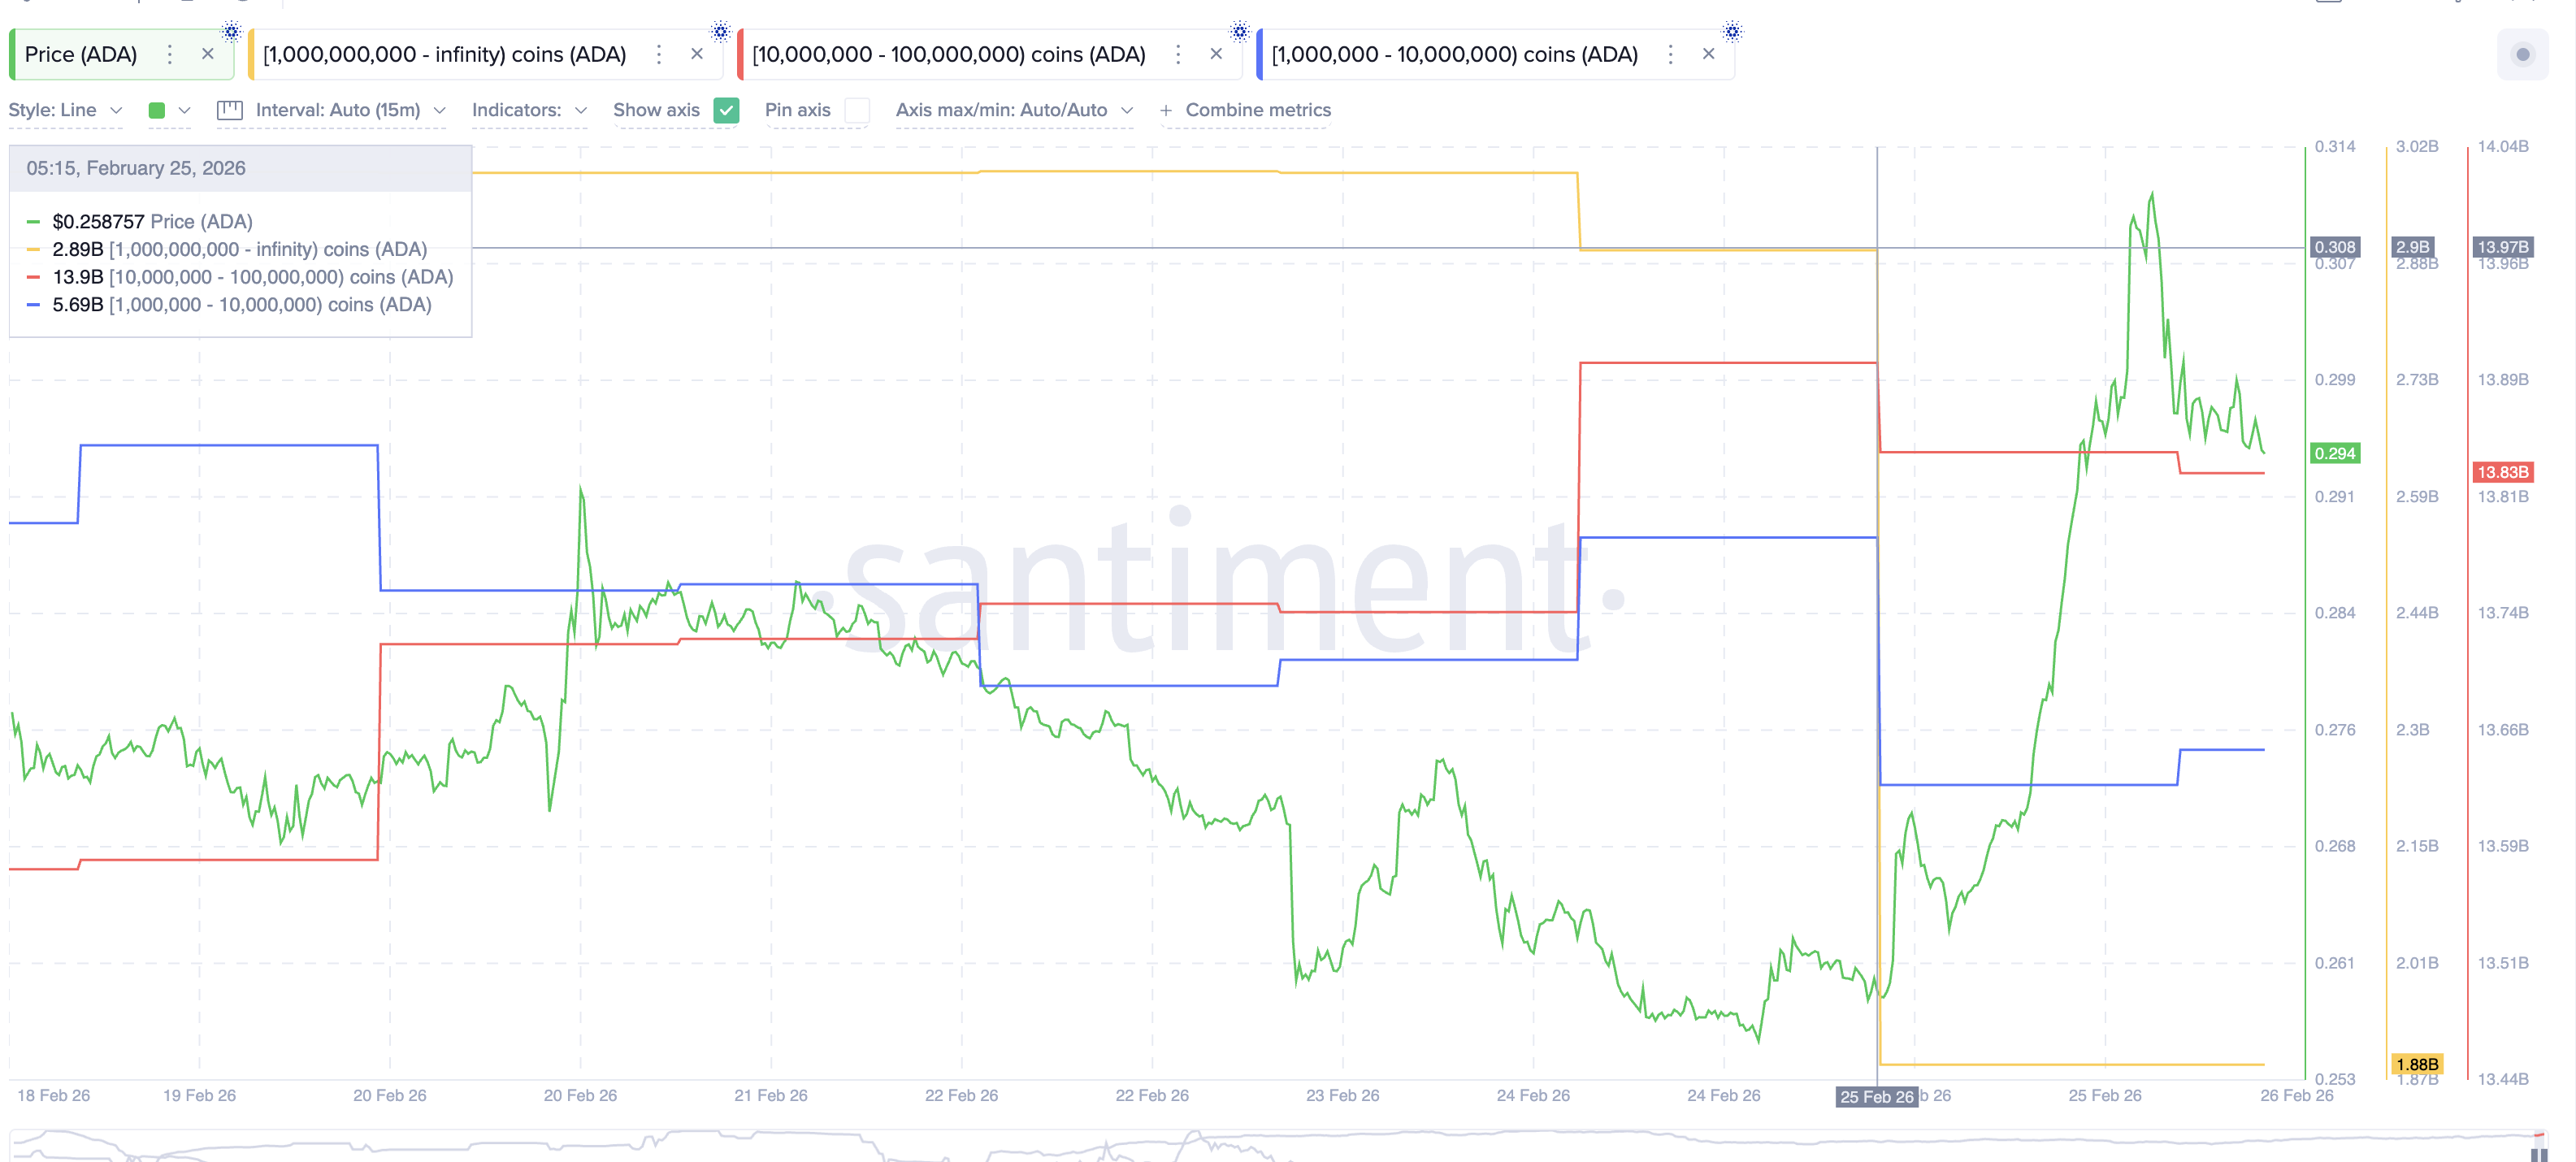
In total, selling reached about $1.32 billion. Compare this to the $340 million bought. That creates a net whale selling imbalance of roughly $980 million.
This explains the failure, including the long upper wick. The visible whale buying created optimism, but the larger, hidden whale selling completely overwhelmed it. This silent distribution blocked the breakout.
Derivatives Traders Took The Bait — Now Liquidation Risk Is Rising
Derivatives traders reacted exactly as expected. They saw a breakout forming, so they opened long positions expecting the rally to continue.
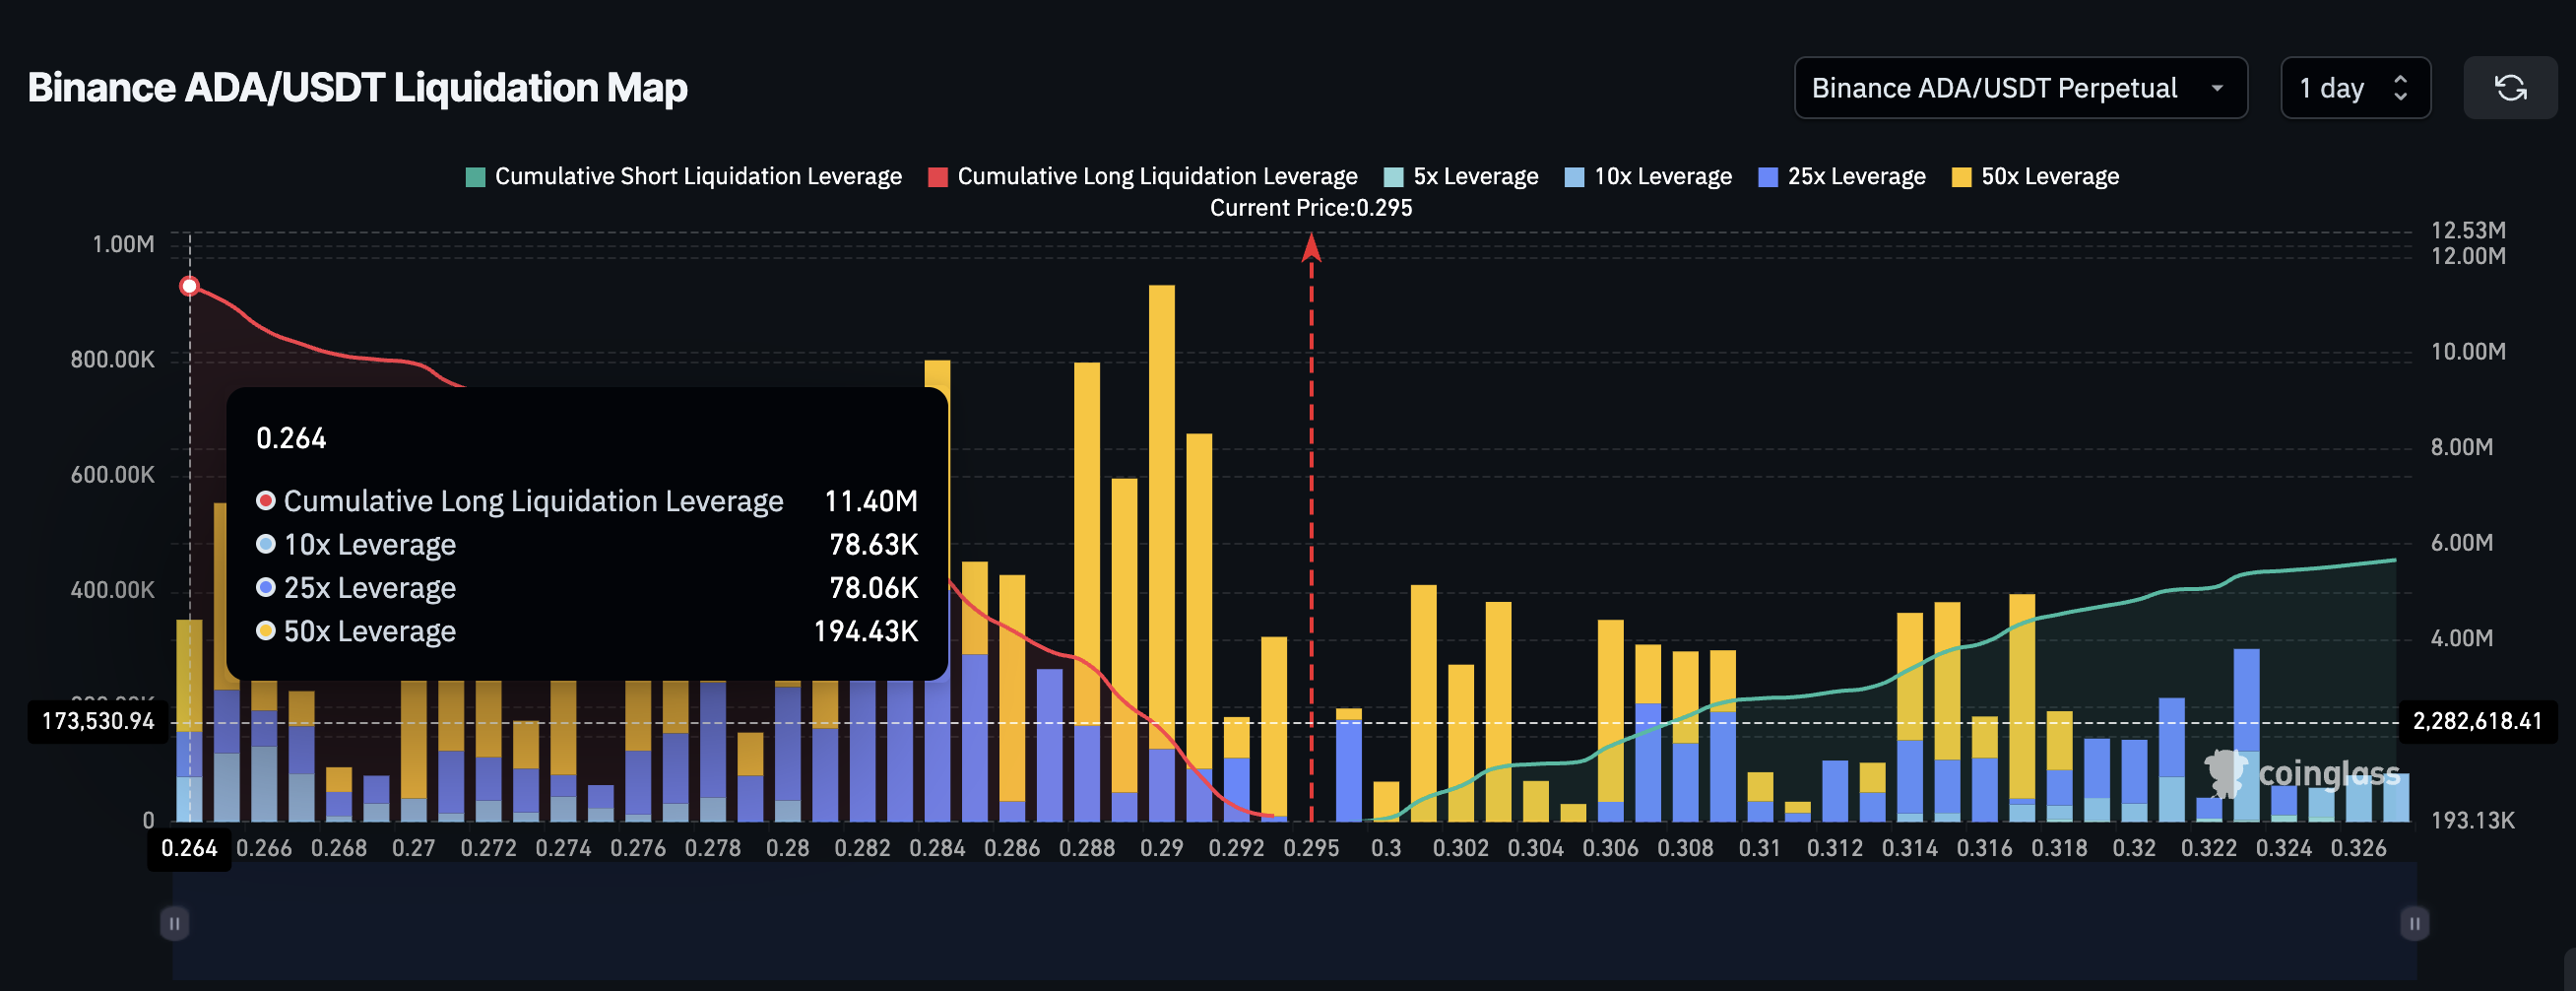
Liquidation data, on Binance alone, shows $11.40 million in long liquidations sitting below current price levels, while short liquidations are only $5.67 million. This means bullish traders are far more exposed to downside risk.
If the Cardano price falls, long positions will be forced to close. This creates a long squeeze. A long squeeze happens when falling prices force bullish traders to exit, and their forced selling pushes the price even lower. This is how failed breakouts often accelerate into deeper corrections.
Cardano Price Now Faces A Critical Breakdown Risk Toward $0.22
The ADA price structure now sits at a critical point. For the bullish breakout to remain valid, Cardano must reclaim and hold above $0.30. This would restart the path toward the $0.41 target.
But downside risks are growing. If Cardano falls below $0.27, the pullback strengthens. If it falls below $0.25, the bullish structure becomes invalid. This level is especially dangerous because it aligns with heavy, long liquidation exposure.
A break below $0.25 could trigger cascading liquidations, which could likely push the price toward $0.22, the full pattern breakdown possibility.
Right now, Cardano’s failed breakout (at press time) is not just a technical rejection. It is the result of nearly $1 billion in hidden whale selling. This imbalance is quietly turning into a high-probability breakout into a trap, and until buying fully outweighs selling, the recovery remains wishful.


The crypto market has faced sustained pressure in February, with prices struggling to build momentum amid declining stablecoin exchange reserves.
Summary
- CryptoQuant reports USDT reserves fell from $60B to $51.1B in two months, reducing market liquidity.
- Daily trading volumes are modest and active on-chain wallets have been declining.
- Analysts are split: VanEck calls it orderly deleveraging, while others warn of deeper losses if support breaks.
Bitcoin (BTC) has dropped by nearly 50% from its peak in October 2025 and by roughly 30% since the year began. Alongside the decline, there has been slower stablecoin growth, cautious interest rate signals from the Federal Reserve, and weaker U.S. manufacturing data.
Total market capitalization has fallen to around $2.3 trillion. At the same time, the Fear and Greed Index has slipped to cycle lows. Continued exchange-traded fund outflows have added to investor caution and reduced fresh capital entering the market.
Liquidity drain raises downside risks
On Feb. 26, CryptoQuant analyst TopNotchYJ warned that shrinking stablecoin reserves are becoming a major risk factor. Data shows that Tether (USDT) exchange balances fell from $60 billion to $51.1 billion in two months, a $9 billion decline that has tightened trading liquidity since January.
TopNotchYJ described the drop in USDT reserves as clear evidence of capital moving out of crypto markets. Stablecoins are the main source of trading activity, and falling balances usually signify a drop in investor confidence. Moving below $50 might put more selling pressure on major assets like XRP, ETH, and BTC.
The number of active wallet addresses has also rapidly decreased, from about 376,000 to 263,000. This shows that retail investors and institutional investors are taking a backseat. Price rebounds typically lose strength when there are fewer market participants, as demand naturally softens.
A similar pattern is visible in trading behavior. The daily volume has dropped by more than 6% to roughly $339 million. This indicates little speculative activity in the market, but it does not suggest widespread panic selling.
Short-term outlook and analyst views
Analysts remain divided, although most expect high volatility in the near term. Some warn that Bitcoin could slide another 20% to 30% if economic pressure continues, especially if support near $60,000 breaks. The $70,000 level continues to act as a major barrier to recovery.
Matthew Sigel of VanEck has described the recent decline as “orderly deleveraging.” He argues that leverage has cooled and that the market is adjusting rather than entering a full collapse.
Researchers at K33 Research see parallels with the late-2022 bottom. They point to fragile economic conditions and stagnant stablecoin supply as limits on short-term upside.
More positive views come from Bitwise Asset Management, which manages more than $15 billion. Their analysts continue to highlight Bitcoin’s long-term potential and see recent pullbacks as possible accumulation opportunities.
Several technical levels remain are now in focus. Support lies between $64,000 and $66,000, followed by $60,000 and the $50,000–$55,000 zone. Resistance is clustered near $70,000 and $80,000.
Until stablecoin reserves recover and user activity improves, analysts expect the market to stay vulnerable, with downside risks likely to persist in the coming weeks.
A bipartisan group of lawmakers in the US House of Representatives has introduced legislation aimed at halting prosecution of software developers who do not have custody or control of others’ crypto assets.
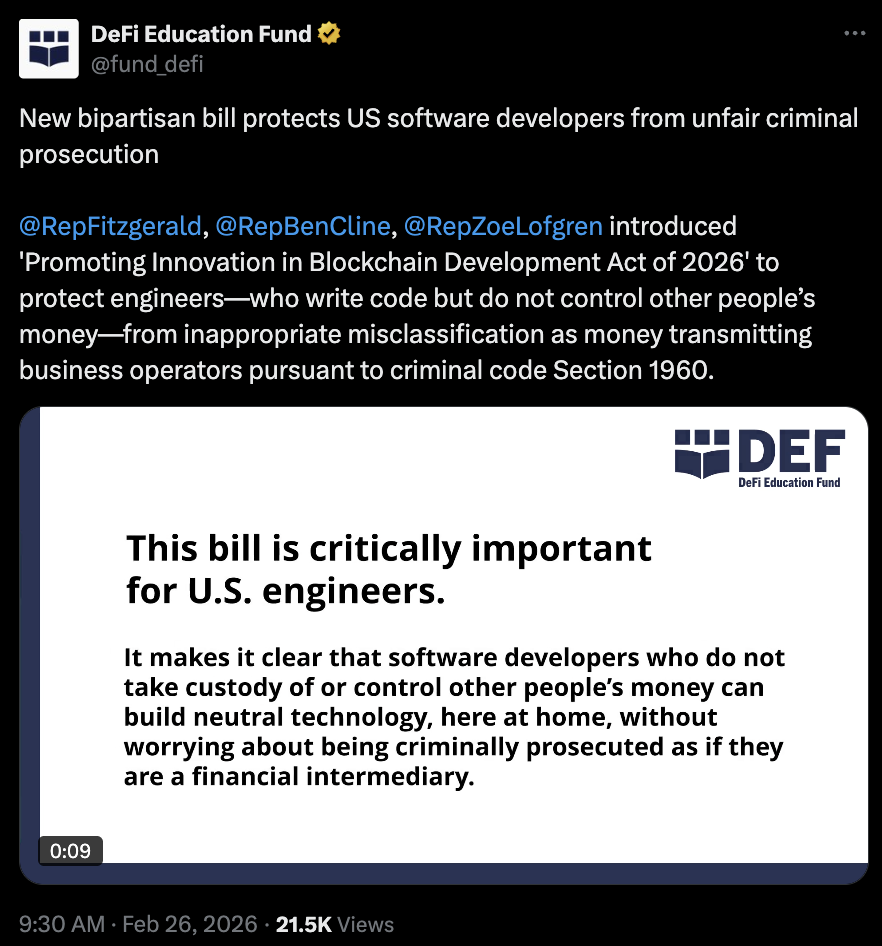
In a Thursday notice, Representatives Scott Fitzgerald, Ben Cline and Zoe Lofgren said that they would be sponsoring the Promoting Innovation in Blockchain Development Act in an effort to change how to handle criminal cases potentially involving blockchain developers.
The bill would clarify that Section 1960 under US federal law, on the “prohibition of illegal money transmitting businesses,” would apply only to actors with control of others’ digital assets.
At least two crypto advocacy organizations publicly supported the bill. The Blockchain Association called it a “critical step” to encourage US-based developers. The DeFi Education Fund (DEF) said the legislation would likely put a stop to prosecutions similar to those of Tornado Cash developer Roman Storm or the creators of the Samourai Wallet.
“[The bill] makes it clear software developers who do not take custody of or control other people’s money can build neutral technology, here at home, without worrying about being criminally prosecuted as if they are a financial intermediary,” said DEF.

It’s unclear whether the bill, if signed into law, would put a stop to previously filed cases against developers. Storm was found guilty of running an unlicensed money transmitter business in August 2025, while Samourai Wallet founders Keonne Rodriguez and Will Lonergan Hill pleaded guilty to similar charges in July and were later sentenced to five and four years in prison, respectively.
Related: US ‘crypto capital’ claim tested by developer prosecutions
As of Thursday, Storm had yet to be sentenced or face a possible retrial for two other charges.
US Senate to potentially address blockchain bill
Lawmakers in the US Senate have already pitched their own bill for developer protection. In January, Senators Cynthia Lummis and Ron Wyden introduced the Blockchain Regulatory Certainty Act, to clarify that developers writing code or maintaining networks don’t meet the requirements for being criminally liable as an unlicensed money transmitter.
In the meantime, the Senate has been considering how to move forward with a comprehensive digital asset market structure bill sent from the House in July 2025.
The CLARITY Act passed the Senate Agriculture Committee in January, but has yet to be addressed with a markup in the Senate Banking Committee. It’s unclear whether the final bill potentially passed by the full chamber could address developer protections, which face pushback from some lawmakers.
Magazine: Clarity Act risks repeat of Europe’s mistakes, crypto lawyer warns


A serial hacker is targeting DeFi lending protocols, with approximately $3.5 million stolen so far. In the latest incident, they exploited an oracle misconfiguration in lending platform Ploutos Money, leading to a loss of almost $400,000.
Crypto security firm CertiK noted that the project appears to have deleted its website and social media presence.
Read more: YieldBlox lending pool hit by $10M hack on Stellar
According to analysis by blockchain auditor BlockSec, Ploutos Money used Chainlink’s bitcoin (BTC)/USD feed as an oracle for USDC price. “The attacker was able to borrow 187 ether (ETH) by posting only eight USDC as collateral,” the post explains.
BlockSec also points to the timing of the exploit, just one block after the misconfiguration was confirmed. While the firm suggests “the attacker closely monitored and acted on the configuration change,” many of the replies to CertiK and BlockSec’s posts suspect insider involvement.
Pseudonymous blockchain investigator Tanuki42 linked the exploiter to at least four other hacks, including two million-dollar losses for Moonwell.
Last week, Moonwell was left with $1.8 million of bad debt when a misconfigured oracle returned a cbETH price of $1.12 instead of approximately $2,200. The code change which caused the loss had been co-authored by Claude Opus 4.6, alongside a Moonwell contributor.
Read more: DeFi, meet Claude: Moonwell’s ‘vibe-coded’ oracle in $1.8M blowup
The (bad) luck of the draw
Also today, in an apparently unconnected attack, Ethereum-based “private ZK lottery,” FOOM CASH, lost $1.6 million when its “broken ZK verifier” was compromised.
According to blockchain security firm QuillAudits, the project lost $1.3 million on Ethereum and $316,000 on Base. The firm’s analysis explains that the project’s use of its ZK verifier was flawed.
In setting two constants to the same value, “anyone can compute it [the verification equation], no secret needed.”
A similar attack affected Veil.Cash, a privacy protocol on Base, last week. However, losses were small at only 4.5 ETH, of which 2 ETH were recovered by white hats Decurity.
Got a tip? Send us an email securely via Protos Leaks. For more informed news and investigations, follow us on X, Bluesky, and Google News, or subscribe to our YouTube channel.

Bitrue reported a 212% surge in spot buying for XRP on February 26, with buy orders more than doubling sell pressure.
Bitrue said on February 26 that it recorded a 212% jump in XRP spot buying as institutional investors continued allocating capital through newly launched XRP exchange-traded funds (ETFs).
The exchange linked the spike to roughly $1.1 billion in cumulative ETF inflows, arguing that steady demand from funds and retail traders could tighten available supply in the months ahead.
Spot Buying Jumps as ETF Inflows Build
In a post on X, Bitrue said XRP buy orders on its platform outpaced sell orders by more than two to one.
“We recorded a 212% increase in XRP spot purchase volumes, outpacing the sell side by over 2x,” the exchange posted on X.
It attributed the imbalance to sustained institutional accumulation since the debut of XRP ETFs, which it claims have drawn $1.1 billion in net assets, even though data from SoSoValue showed there have been muted ETF flows in recent days.
However, the derivatives market tells a different story. According to CryptoQuant, XRP futures open interest has fallen across major platforms over the past 90 days, with Binance recording a decrease of 7.7 million XRP and Bybit showing a larger reduction of around 12 million tokens. Furthermore, the three-month moving average for XRP futures volume has dropped to its lowest level since November 2024, settling at approximately $87 billion.
Looking at XRP’s broader market structure, it was trading around $1.44 at the time of writing, up nearly 5% in the last 24 hours and about 2% during the week. Even so, the token is still down more than 23% over the past month and almost 38% across the past year, far below its July 2025 all-time high of $3.65.
Cooling Leverage Meets Steady Spot Demand
The divergence between spot accumulation and falling derivatives activity suggests a shift in market composition rather than uniform bullish momentum. Open interest now stands near $2.37 billion per CoinGlass figures, and the contraction in leveraged positions may reflect traders reducing risk after months of volatility.
You may also like:
From a price standpoint, XRP remains range-bound between $1.38 and $1.48 over the past 24 hours. One market watcher, CasiTrades, flagged resistance around $1.40 and $1.65, with support near $1.11 and $0.87. According to them, a sustained move above those resistance levels would likely require stronger follow-through from ETF inflows and broader market participation.
As such, considering the broader data, Bitrue’s reported spike in spot buying highlights firm exchange-level demand, but the wider data show a market that is rebalancing rather than accelerating.
Nonetheless, the crypto exchange is predicting that growing retail and corporate support could lead to a supply deficit that may push up the Ripple token’s performance enough to beat major rivals this year.
“With support increasing from retail and institutional levels, Bitrue is forecasting a potential supply squeeze, which will likely result in XRP outperforming key competitors over Q2 2026,” wrote Bitrue.
Binance Free $600 (CryptoPotato Exclusive): Use this link to register a new account and receive $600 exclusive welcome offer on Binance (full details).
LIMITED OFFER for CryptoPotato readers at Bybit: Use this link to register and open a $500 FREE position on any coin!
Ether (ETH) price reached a weekly high of $2,150 on Thursday, which is a key level for large ETH holders, but volatility in the crypto and stock markets continues to catalyze corrections below $2,000.
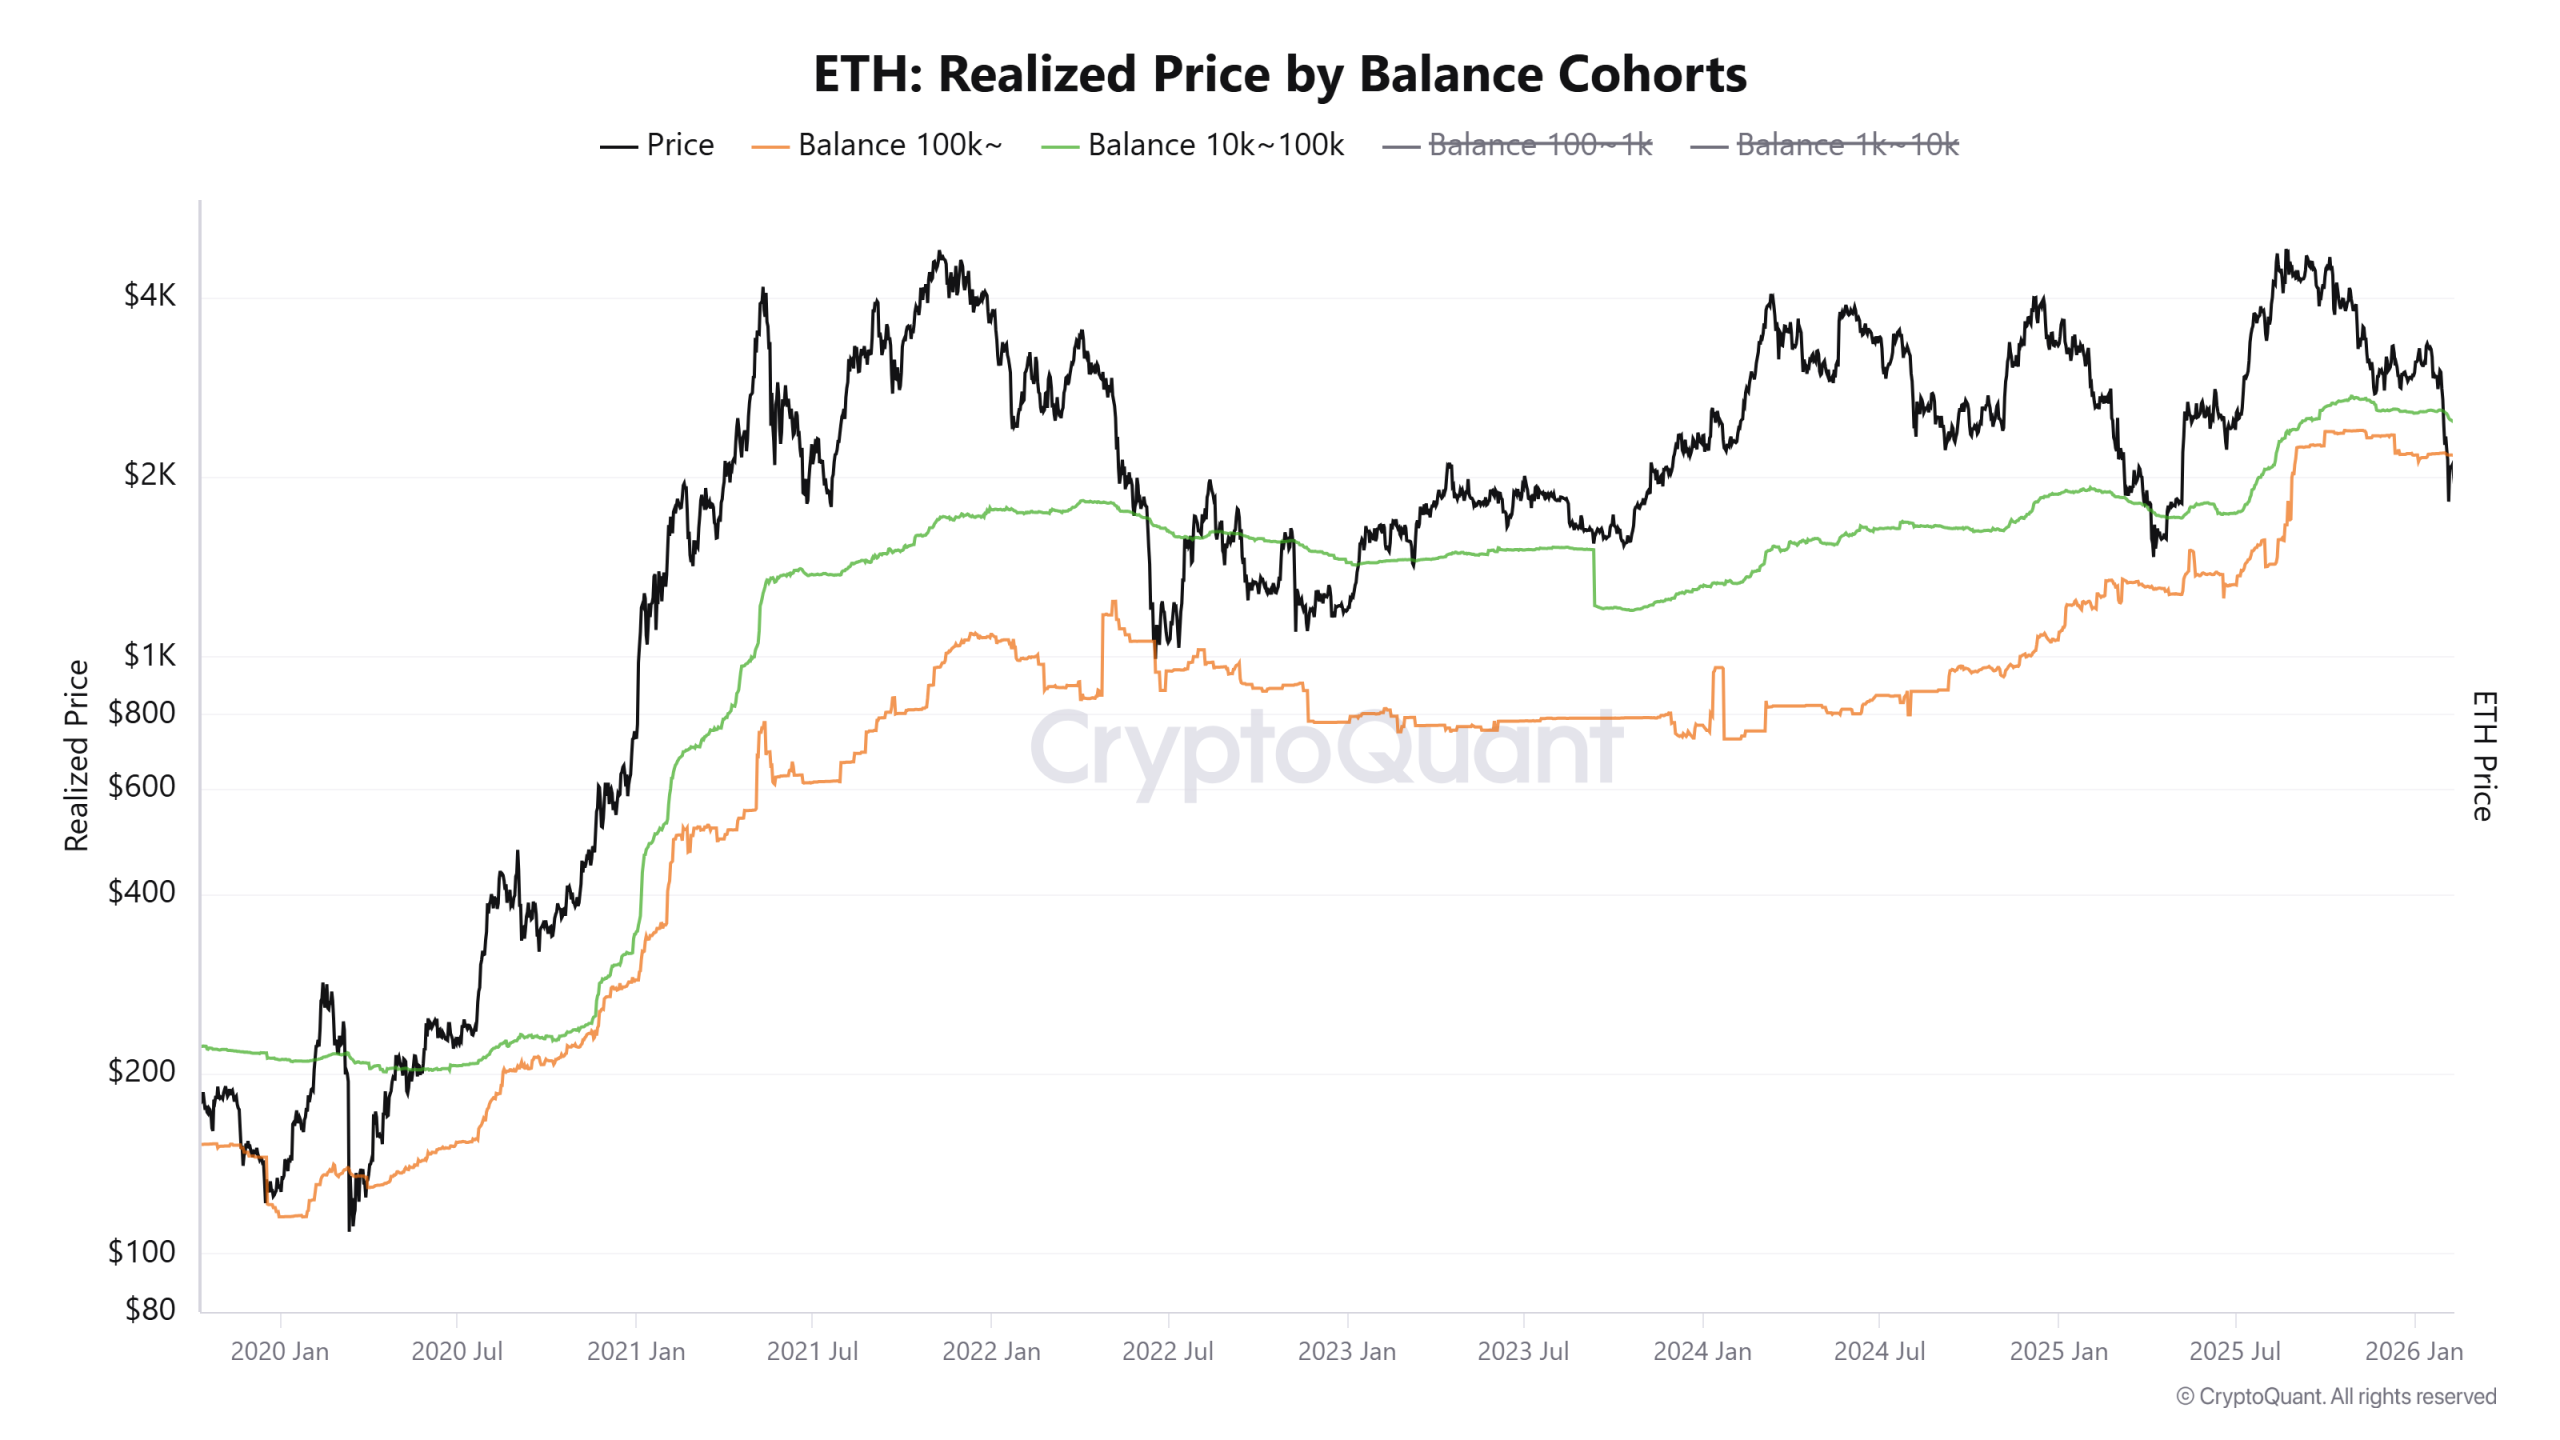
A daily close above $2,100 remains important because that level aligns with the cost basis and realized price of wallets holding 100,000 or more ETH. Realized price tracks the last moved price of coins, offering a profitability gauge rather than a spot reference.

Since 2020, Ether has traded below this whale cohort’s realized price only a handful of times, most notably during the 2022 bear market. The chart shows that the price has regularly recovered after the realized price level was tested as support.
Futures market analyst Dom described the setup as “a good clean look for the whole market,” pointing to an early-week sweep near the range lows. Dom said that the price tapped the one-month rolling VWAP (volume-weighted average price) and the value area high, the upper boundary of the price range where most of the volume traded over the past month.

The VWAP measures the average traded price weighted by volume. Acceptance over $2,140 may mark a shift in short-term order flow, while failure to retain a higher level keeps the price inside the established range.
Related: Longest Ether dip since 2022 ignored by whales: What’s next for ETH?
$1,800 remains the key price level to watch
CoinGlass data highlighted short liquidations of over $220 million over the past two days, clearing overhead leverage. Now, roughly $2.66 billion in cumulative long liquidation exposure sits near $1,800, forming a liquidity pocket below the price.

Crypto analyst Pelin Ay pointed to a notable shift in funding rates on Binance. ETH funding flipped sharply negative earlier this month as aggressive short positions piled in alongside Ether price weakness. Following Tuesday’s drop below $1,800, the funding rate has since swung back into positive territory at 0.23%, a sign that late shorts were squeezed out of their positions.

However, with the funding rate now elevated, traders’ positioning appears to be tilting toward the long side. If this trade becomes overcrowded, it raises the risk of a potential long squeeze near the $1,800 level once again, especially if the price momentum stalls or reverses.
Market analyst IncomeSharks identified three technical hurdles, including repeat super trend rejections and a channel resistance near $2,250.

The SuperTrend uses volatility, measured by the average true range (ATR), to define the trend direction. When the price trades below the indicator, the line flips red and acts as dynamic resistance. On the chart above, each rebound has been rejected at the red band, signaling that sellers remain in control.
The analyst added that traders should watch whether Ether revisits or finds renewed buying interest near the April lows around $1,500, a level that resides between a weekly demand zone of $1,691 and $1,384, before any sustained move above $2,500 can take shape.

Related: Ethereum reclaims $2K as volatility spike backs ETH price recovery
This article does not contain investment advice or recommendations. Every investment and trading move involves risk, and readers should conduct their own research when making a decision. While we strive to provide accurate and timely information, Cointelegraph does not guarantee the accuracy, completeness, or reliability of any information in this article. This article may contain forward-looking statements that are subject to risks and uncertainties. Cointelegraph will not be liable for any loss or damage arising from your reliance on this information.


Real estate mogul Grant Cardone is preparing to tokenize his firm’s $5 billion real estate portfolio, the latest property heavyweight to explore blockchain-based ownership.
In a Thursday X post, the investor said that Cardone Capital plans to tokenize its holdings to give investors “collateral and liquidity in the secondary markets.” He added that the firm aims to become a market leader in tokenizing assets at scale.
Cardone Capital manages multi-family and commercial properties across the U.S. In January, CoinDesk reported that Cardone was planning to use real estate cash flow to buy bitcoin as part of a long-term crypto strategy. The firm purchased 1,000 BTC in June and has said it intends to add more to its balance sheet
Tokenization is attracting more and more asset managers to turn traditional assets such as bonds, funds, private credit and real estate into tokens on blockchain rails. In the case of real estate, supporters say that tokenization can streamline ownership record-keeping, trading and settlement. However, uneven regulation remains a bottleneck and thin secondary trading can limit liquidity, a report by EY pointed out.
Other real estate leaders are exploring similar paths. The Trump Organization, the real estate conglomerate of Donald Trump and his family, is tokenizing loan revenue tied to a new Maldives resort project. Barry Sternlicht of Starwood Capital, which manages over $125 billion, recently said his firm is ready to tokenize assets but faces U.S. regulatory barriers.
The tokenized real estate market remains small yet but projected to grow rapidly over the next decade. Deloitte forecasted that $4 trillion in real estate could be tokenized by 2035, growing 27% annually.
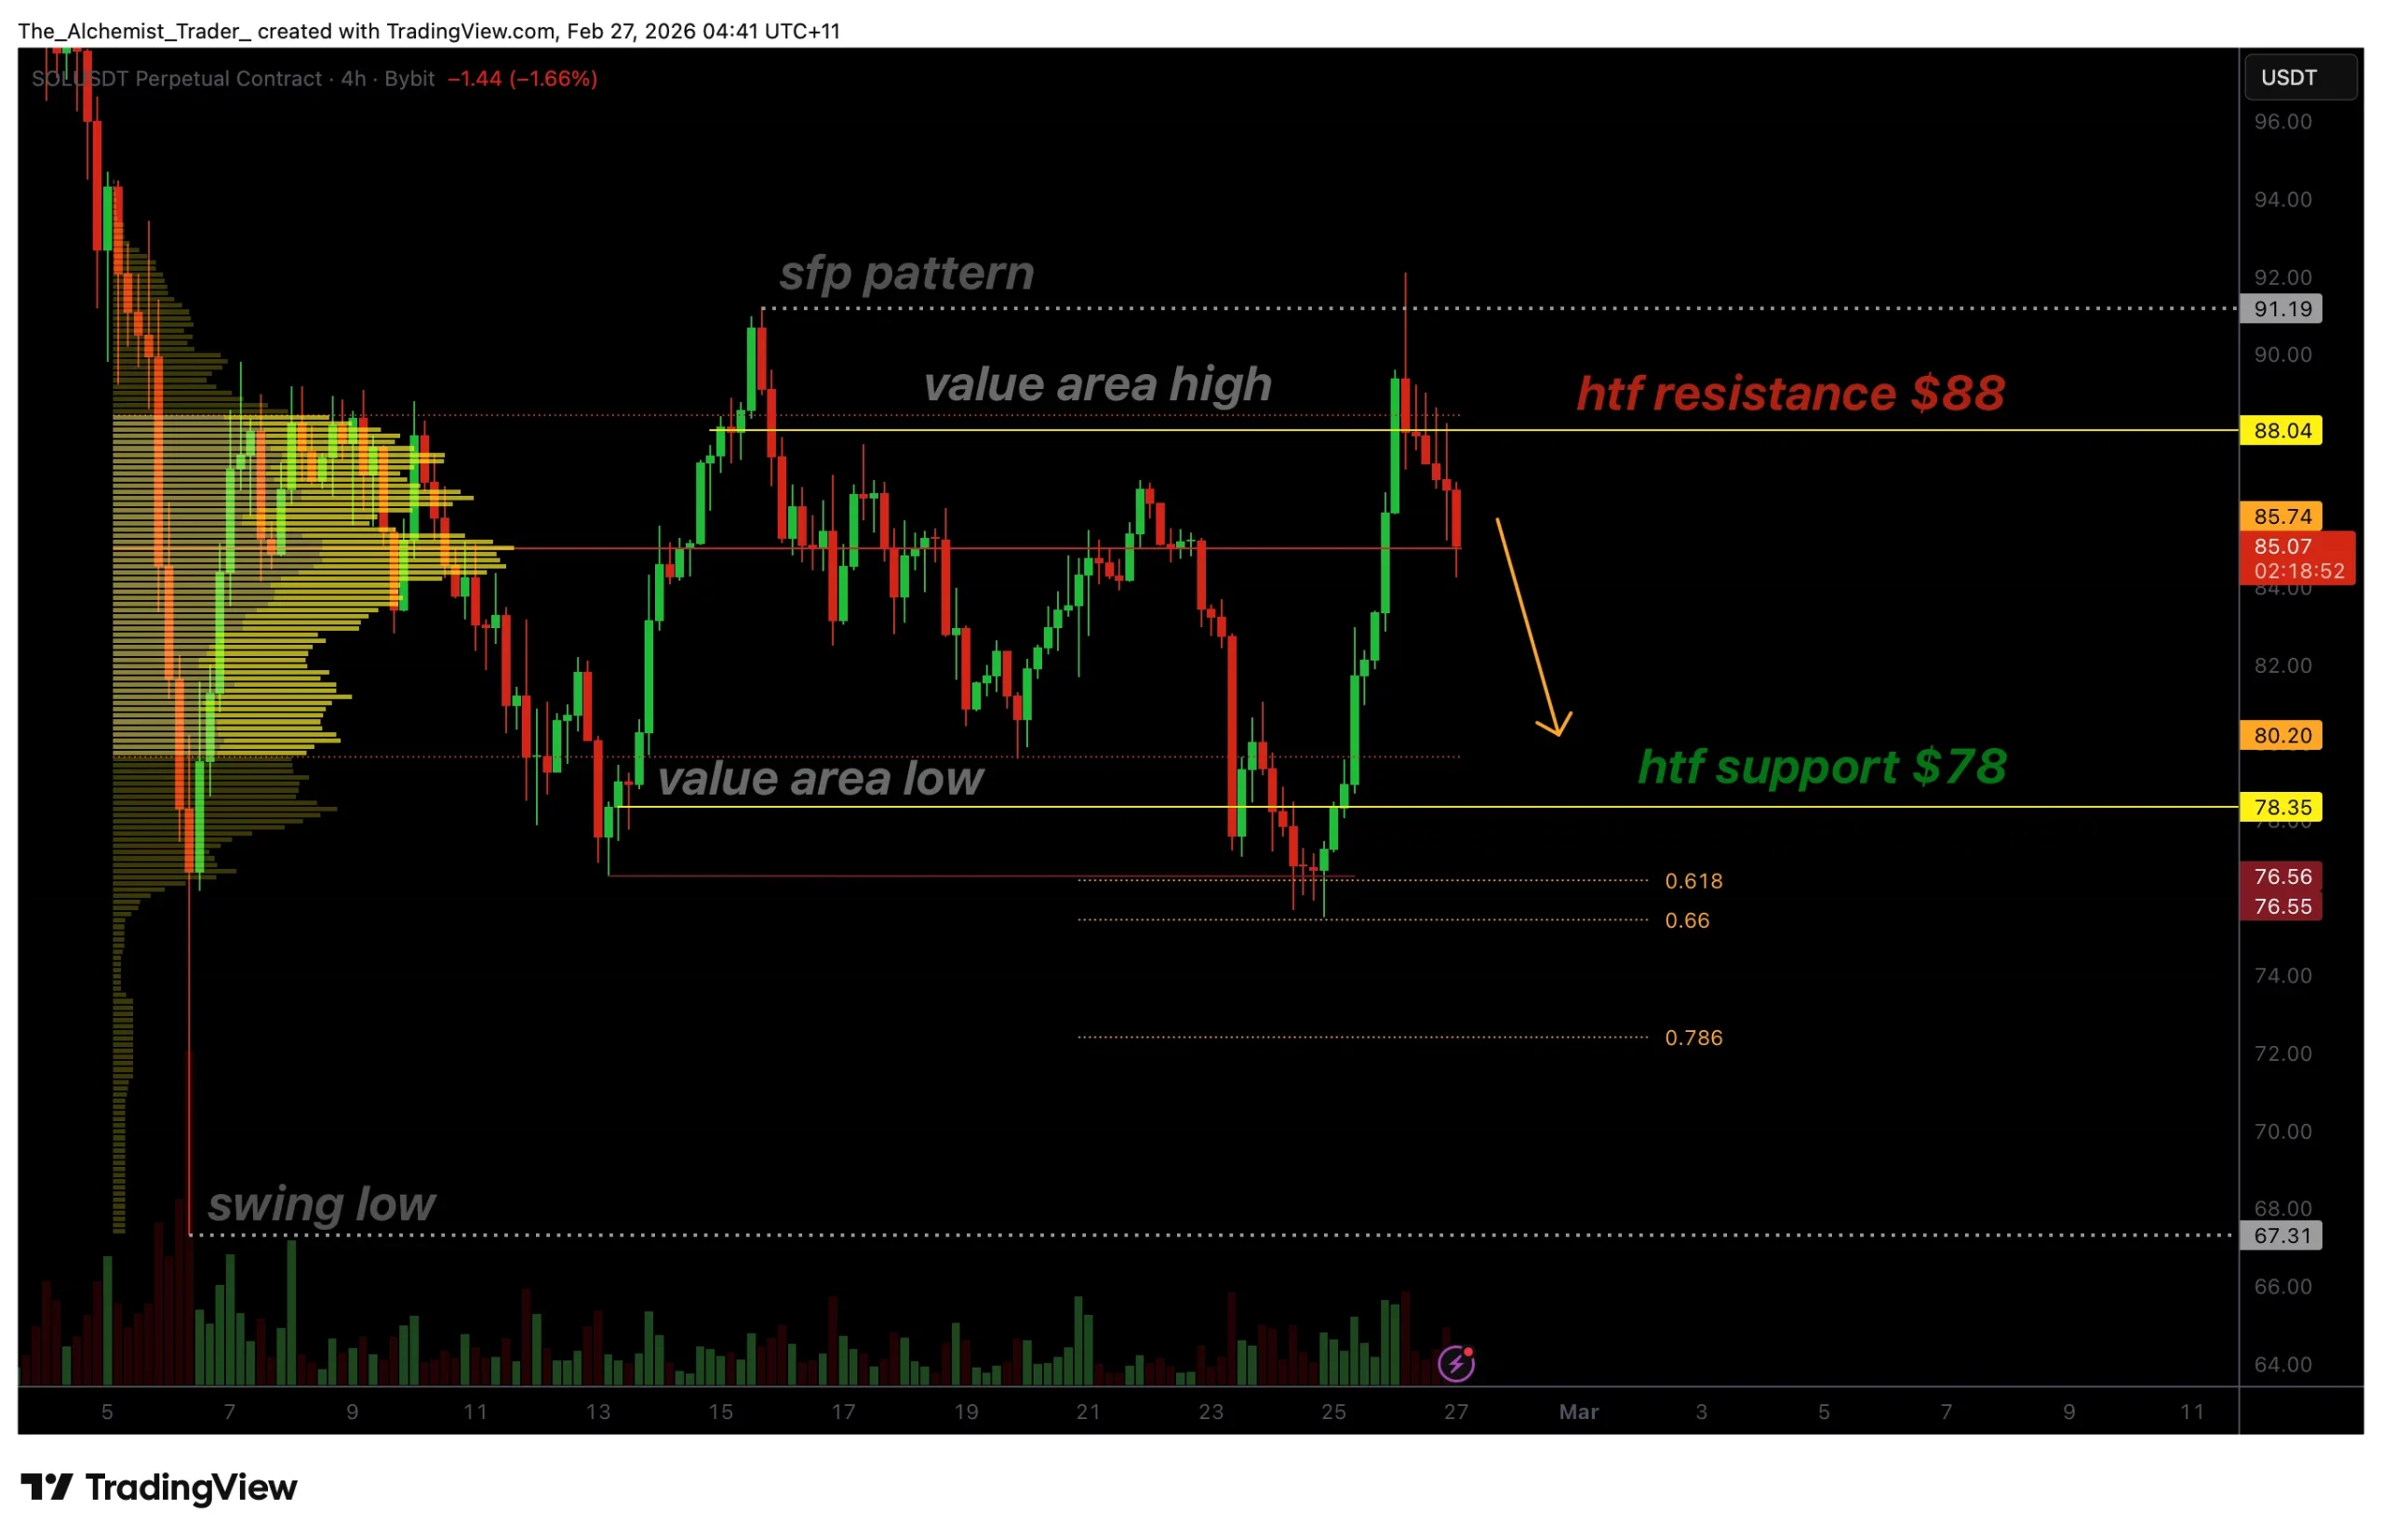
Solana price has turned corrective after losing key support near $88, pushing price back into its previous trading range. The shift in market structure now places $78 support at risk as downside pressure builds.
Summary
- Loss of $88 support flips level into resistance
- Price re-enters established trading range structure
- $78 value area low becomes next key downside support
Solana’s (SOL) recent price action signals a transition away from bullish continuation and back into range-bound conditions. After failing to hold above a major technical level, the market has begun rotating lower, reflecting weakening momentum and growing seller control.
The loss of a key support zone has altered short-term structure, increasing the probability that Solana revisits lower range support before any sustained recovery can develop.
Solana price key technical points
- Lost Support: $88 level flips into resistance alongside the value area high.
- Structural Shift: Price has re-entered its previous trading range.
- Downside Target: $78 aligns with the value area low and high timeframe support.
Solana recently lost the important $88 level, which previously acted as a structural support zone. This area also aligned with the value area high, making it a strong technical confluence region. When price loses a value area boundary, it often signals rejection rather than continuation, forcing markets back toward equilibrium within the established range. The failure to hold above this level confirms that buyers were unable to maintain control following the prior recovery attempt.
With the loss of $88 support, Solana has effectively reverted into its previous trading range. Range environments typically trap price action between clearly defined highs and lows, creating rotational market behavior rather than trending movement. In this case, the range low and major support zone sits near $78, which coincides with the value area low and high timeframe demand.
This comes as Step Finance announced it will shut down its Solana-based platforms following a January exploit that drained roughly $40 million, adding to cautious sentiment surrounding the ecosystem.
Currently, price action is hovering near the Point of Control (POC), the level representing the highest volume traded within the range. The POC often functions as equilibrium between buyers and sellers. Solana barely holding this level suggests market indecision, but it also signals vulnerability. A confirmed close below the POC would indicate acceptance at lower prices, significantly increasing the probability of a move toward range support.
From a market structure perspective, the current movement appears corrective rather than impulsive. Corrective phases typically unfold through gradual rotations toward liquidity pools where demand previously emerged. The absence of strong bullish continuation after losing support further reinforces the corrective bias. Without reclaiming $88 resistance, upside momentum remains limited.
Volume dynamics also support the corrective outlook. The recent decline has not been met with strong accumulation signals, suggesting buyers are waiting at deeper value zones rather than defending mid-range prices. This behavior is common within established ranges, where participants prefer to engage at extremes rather than within the middle of consolidation.
If Solana continues to trade below former support turned resistance, price action is likely to gravitate toward the lower boundary of the range. The $78 level therefore becomes a critical area to monitor. A reaction at this support could trigger a relief bounce or range continuation, while a breakdown below it would expose Solana to a broader structural reset. This comes as Zora expanded onto the Solana blockchain with the launch of its new “attention markets” platform, signaling continued ecosystem development despite the current corrective structure.
Despite the short-term weakness, range environments are not inherently bearish. Instead, they represent periods of market balance where liquidity accumulates before the next major expansion. For now, Solana remains confined within this structure, with directional clarity dependent on either reclaiming resistance or testing deeper support.
What to expect in the coming price action
Solana is likely to continue rotating within its established trading range unless bulls reclaim the $88 resistance level. Failure to hold the POC increases the probability of a move toward $78 support, where the next meaningful reaction is expected to occur.
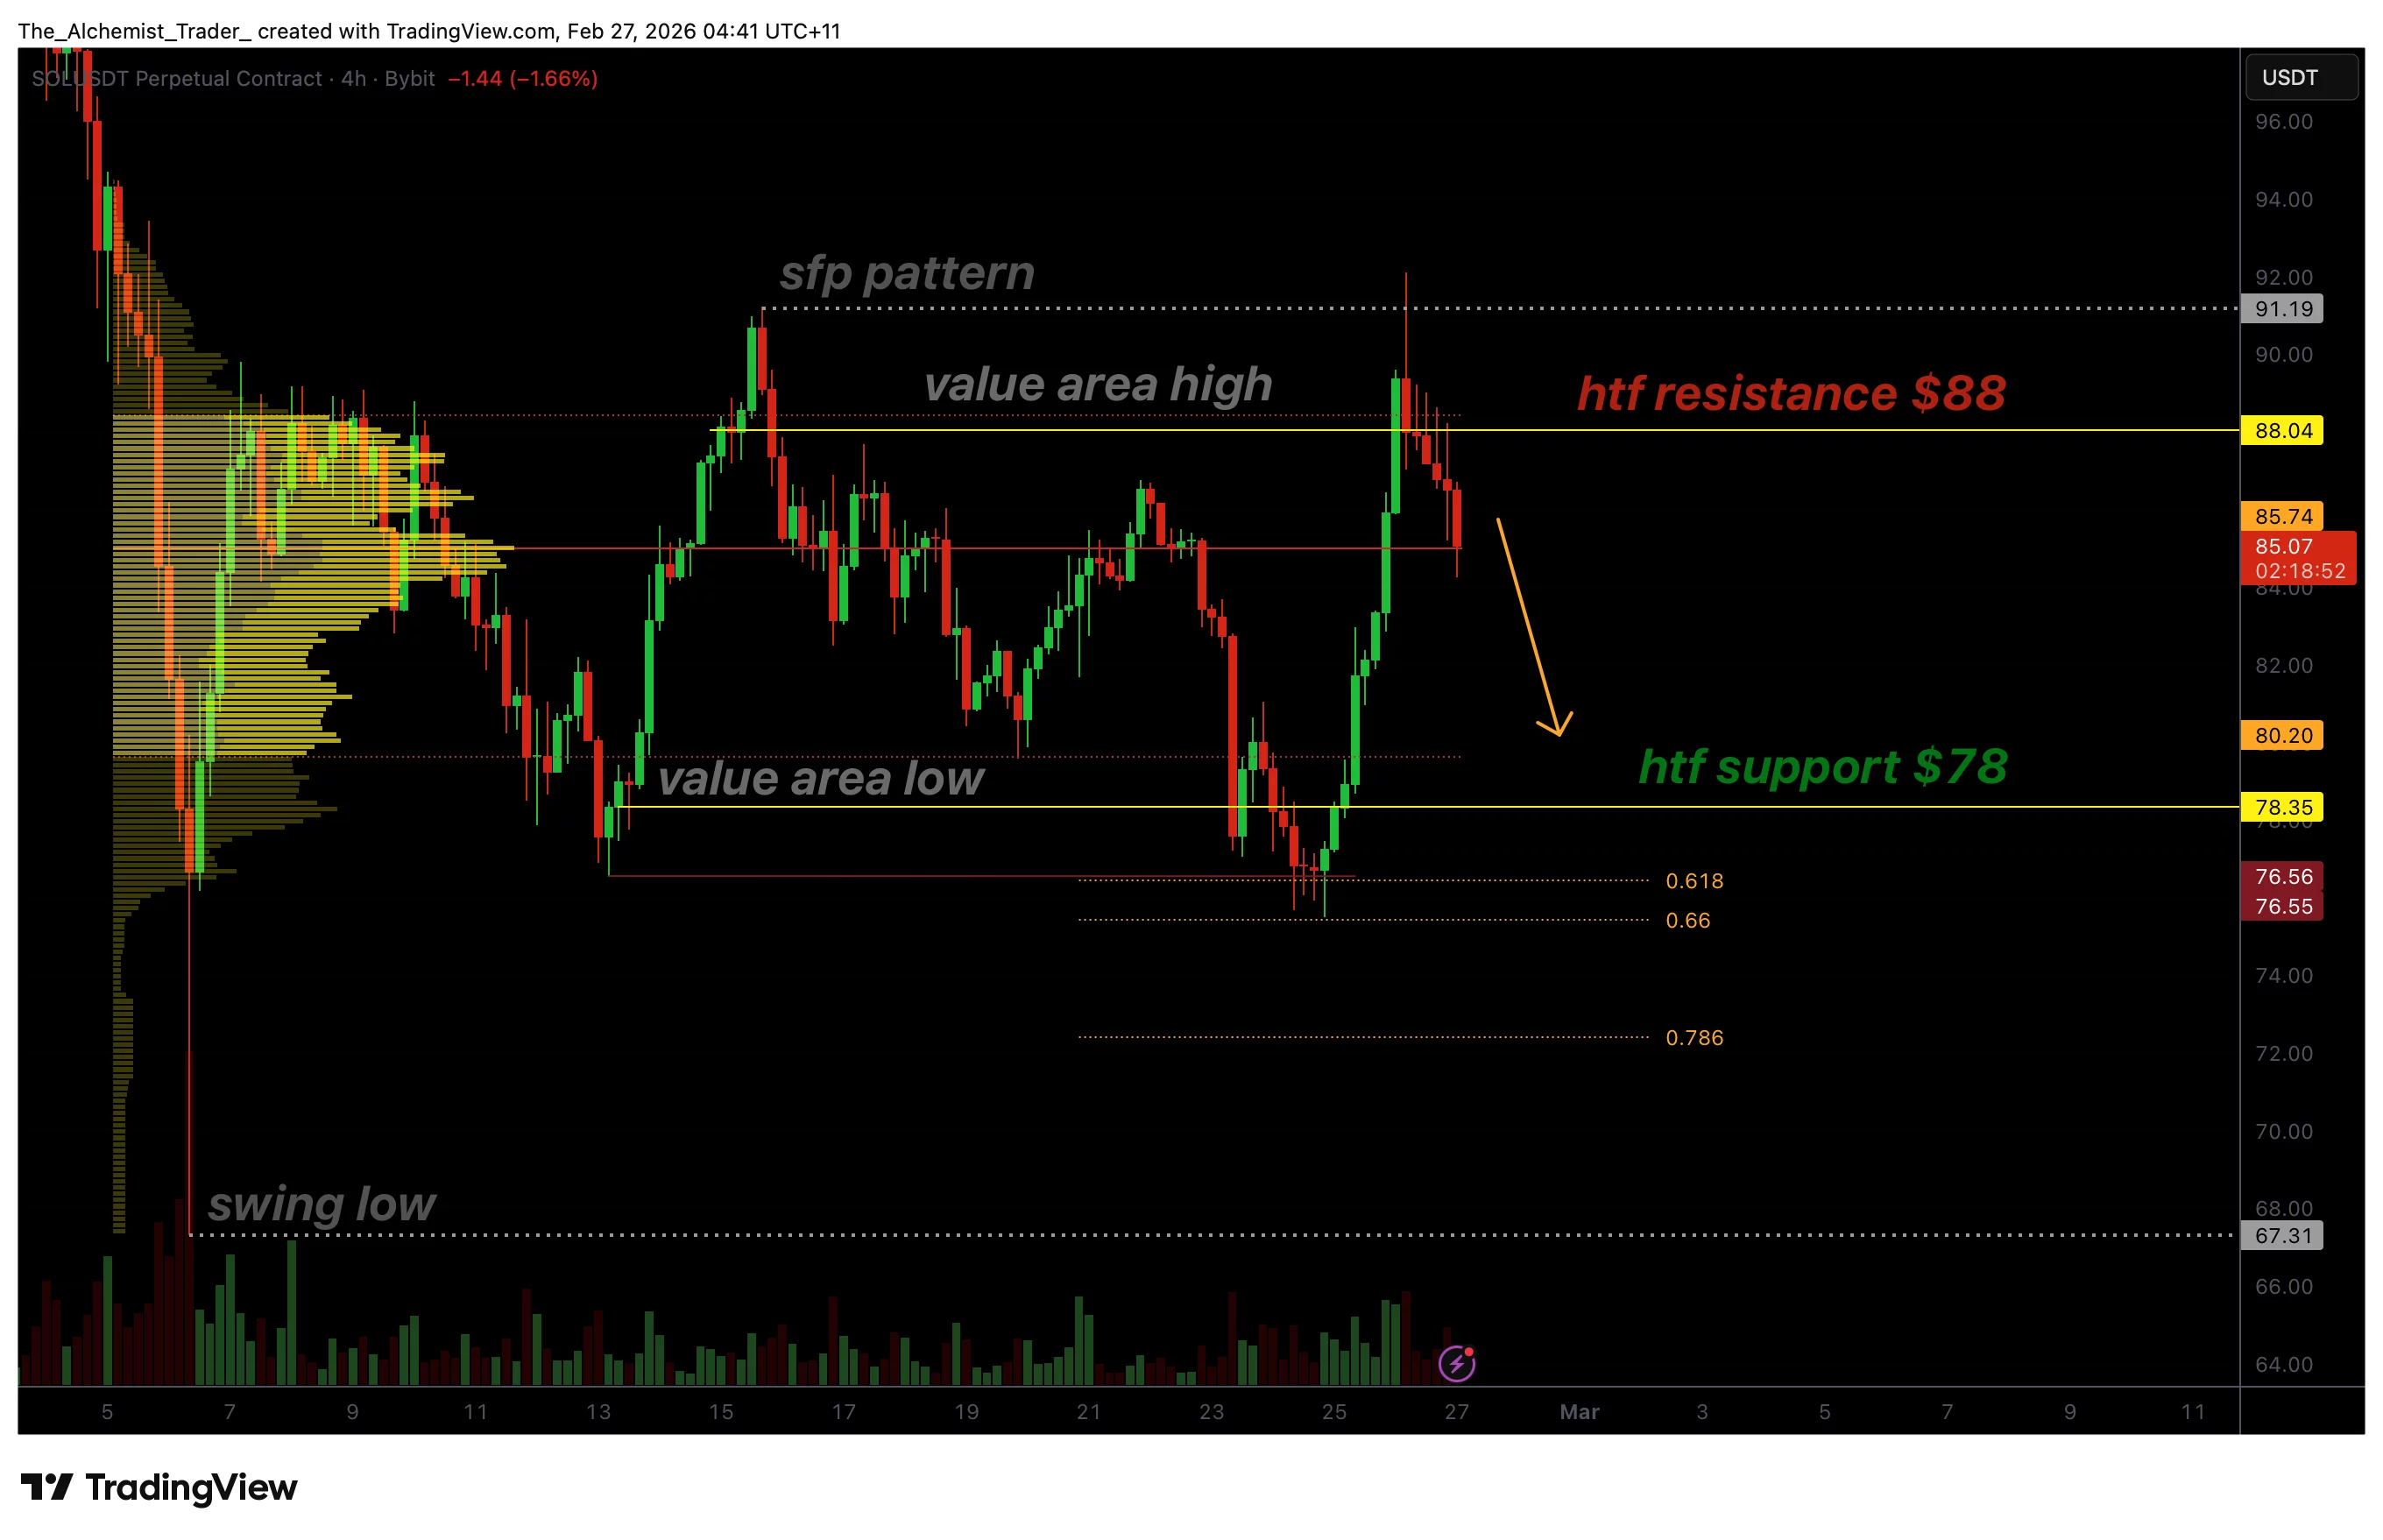
Sonic price remains under heavy selling pressure as an aggressive downtrend continues to dominate market structure. Consecutive lower highs and lower lows now place yearly support at risk of breaking.
Summary
- Aggressive downtrend confirmed by lower highs and lower lows
- Price trades near yearly low below 0.618 Fibonacci extension
- Lack of bullish volume signals continued downside risk
The Sonic (S) token continues to trade within a firmly established bearish trend, with price action showing little evidence of stabilization. Recent market behavior reflects persistent seller control, as rallies into resistance repeatedly fail and lead to further downside continuation.
With momentum weakening and bullish participation absent, the market now approaches a critical inflection point where a new yearly low may soon be confirmed.
Sonic price key technical points:
- Trend Structure: Clear sequence of lower highs and lower lows confirms strong downtrend.
- Key Level: Price trading near yearly low below the 0.618 Fibonacci extension.
- Market Bias: Lack of bullish volume suggests continuation of bearish momentum.
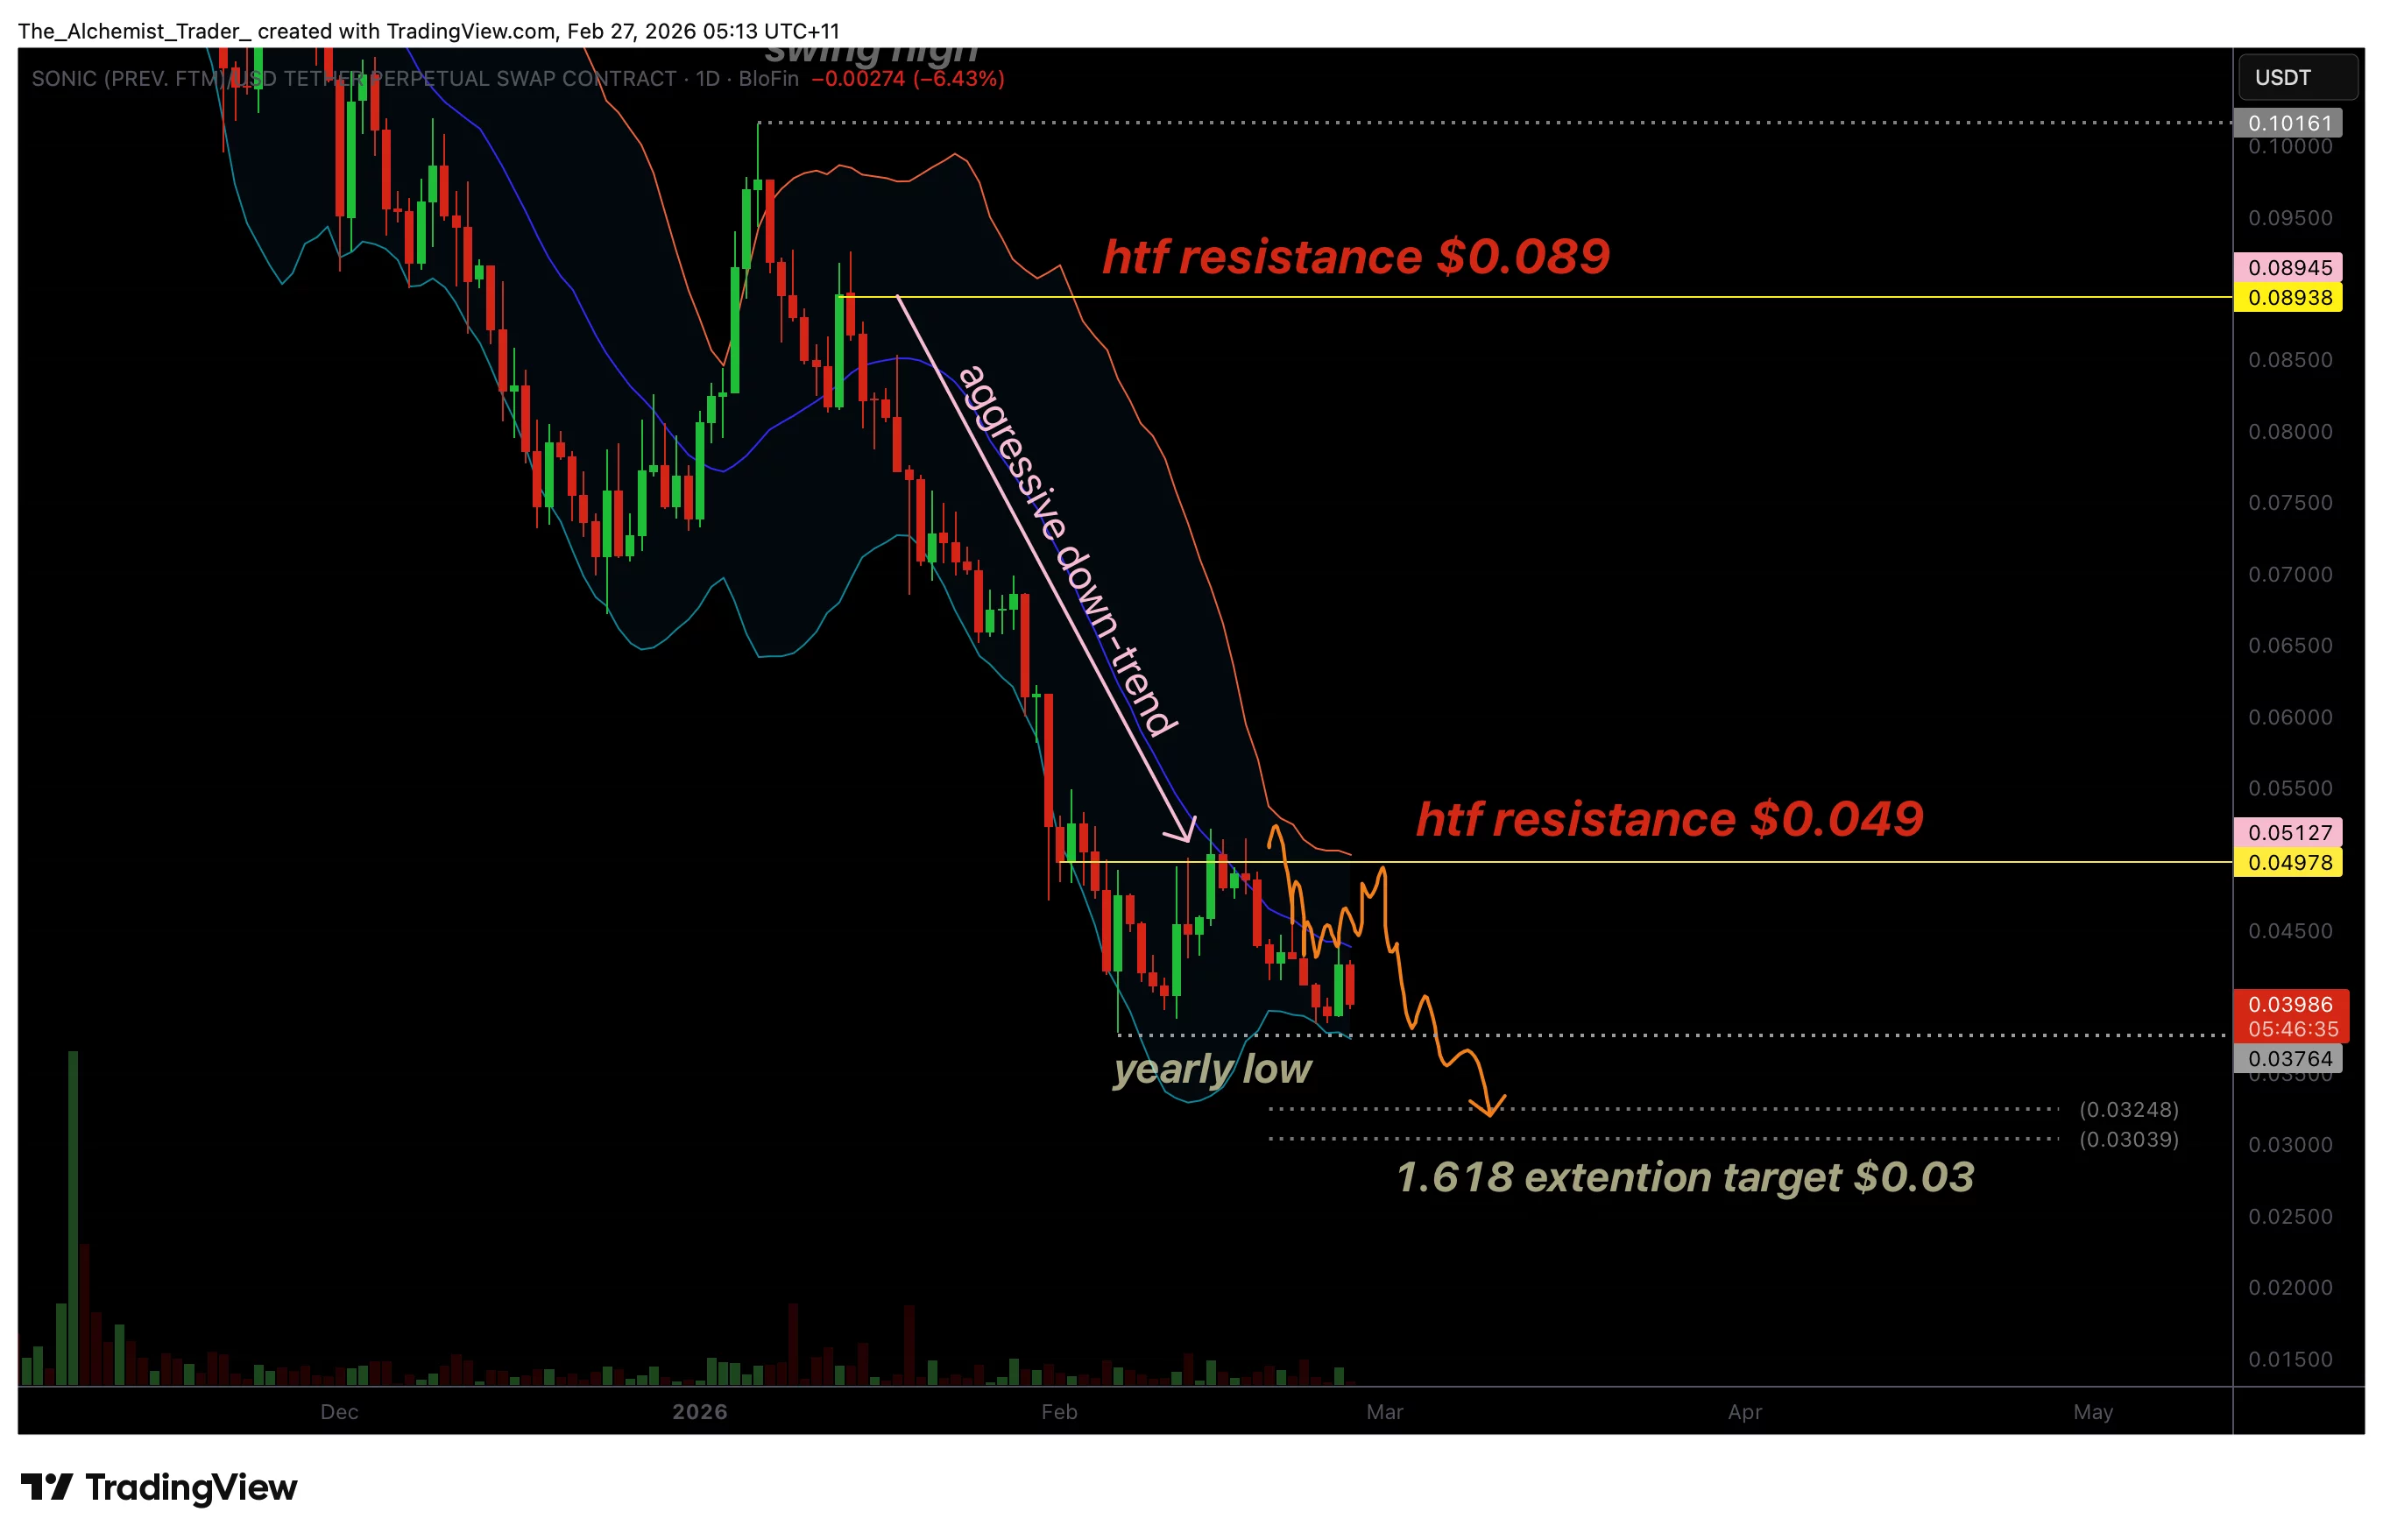
Sonic’s corrective phase has evolved into a sustained and aggressive downtrend characterized by repeated bearish retests and continuation moves lower. Each attempt at recovery has been met with selling pressure, reinforcing resistance zones and preventing any meaningful trend reversal. This pattern of failing rallies highlights the dominance of sellers and reflects a market environment where confidence remains weak.
From a technical perspective, the sequence of lower highs and lower lows is one of the clearest signals of bearish market structure. Instead of forming consolidation or accumulation patterns, Sonic has continued to trend downward with consistent momentum. Resistance levels that previously acted as support have flipped decisively into supply zones, creating a cascading effect where price struggles to regain higher ground.
Currently, Sonic trades near the absolute yearly low region while remaining positioned below the 0.618 Fibonacci extension, a level often associated with trend continuation during strong directional markets. A confirmed breakdown below this region would establish a new yearly low and validate the ongoing bearish projection.
Such price behavior typically signals continuation rather than exhaustion, particularly when volume does not show signs of aggressive buying interest.
Volume analysis further strengthens the bearish outlook. Throughout the decline, bullish volume has remained muted, suggesting limited demand at current prices. Reversal scenarios generally require expanding buy-side participation and structural reclaim of key resistance levels. At present, neither condition is visible, indicating that the market has yet to enter a recovery phase.
Market participants should also consider the psychological impact of prolonged downtrends. Extended periods of selling often reduce trader confidence, encouraging defensive positioning and short-term selling on rallies. Until Sonic can reclaim a meaningful high timeframe resistance level, upside attempts are likely to remain corrective rather than impulsive.
This comes as Sonic Labs CEO Mitchell Demeter outlines the key steps layer-1 blockchains must take to remain competitive, underscoring the broader strategic challenges facing the sector amid persistent market weakness.
Despite the weakness, markets rarely move in straight lines indefinitely. Short-term relief bounces may occur as oversold conditions develop; however, such moves would likely function as temporary pauses within the broader bearish structure unless accompanied by strong volume expansion and structural shifts.
From a broader market structure standpoint, Sonic remains trapped in a persistent downtrend where liquidity continues to build below price. As long as resistance levels remain intact, the path of least resistance favors further downside exploration.
What to expect in the coming price action
Unless Sonic reclaims high timeframe resistance and attracts meaningful bullish volume, the probability favors continuation toward new yearly lows. The prevailing bearish structure suggests downside pressure will persist, with any rallies likely serving as corrective retests rather than a confirmed trend reversal.
NVIDIA Stock just delivered a record-breaking Q4 with $68.1 billion in revenue, 73% year-over-year growth, and earnings per share of $1.62 that crushed estimates. JPMorgan, among others, wasted no time raising its price target from $250 to $265.
Yet on February 26, the stock fell nearly 7% from its session high of $197 to under $185. The results are undeniable. But the price action, the money flow, and the institutional behavior tell a very different story. At least, for now.
The Numbers Look Bulletproof, Until You Look Closer
NVIDIA’s Q4 numbers speak for themselves. Revenue hit $68.1 billion, up 73% year-over-year. The data center segment alone pulled in $62.3 billion, making up 91% of total revenue. EPS (Earnings Per Share) of $1.62 beat the $1.53 consensus by nearly 6%.
And the Q1 FY2027 guidance of $78 billion blew past Wall Street’s $72.8 billion estimate — a figure that notably excludes any revenue from China.
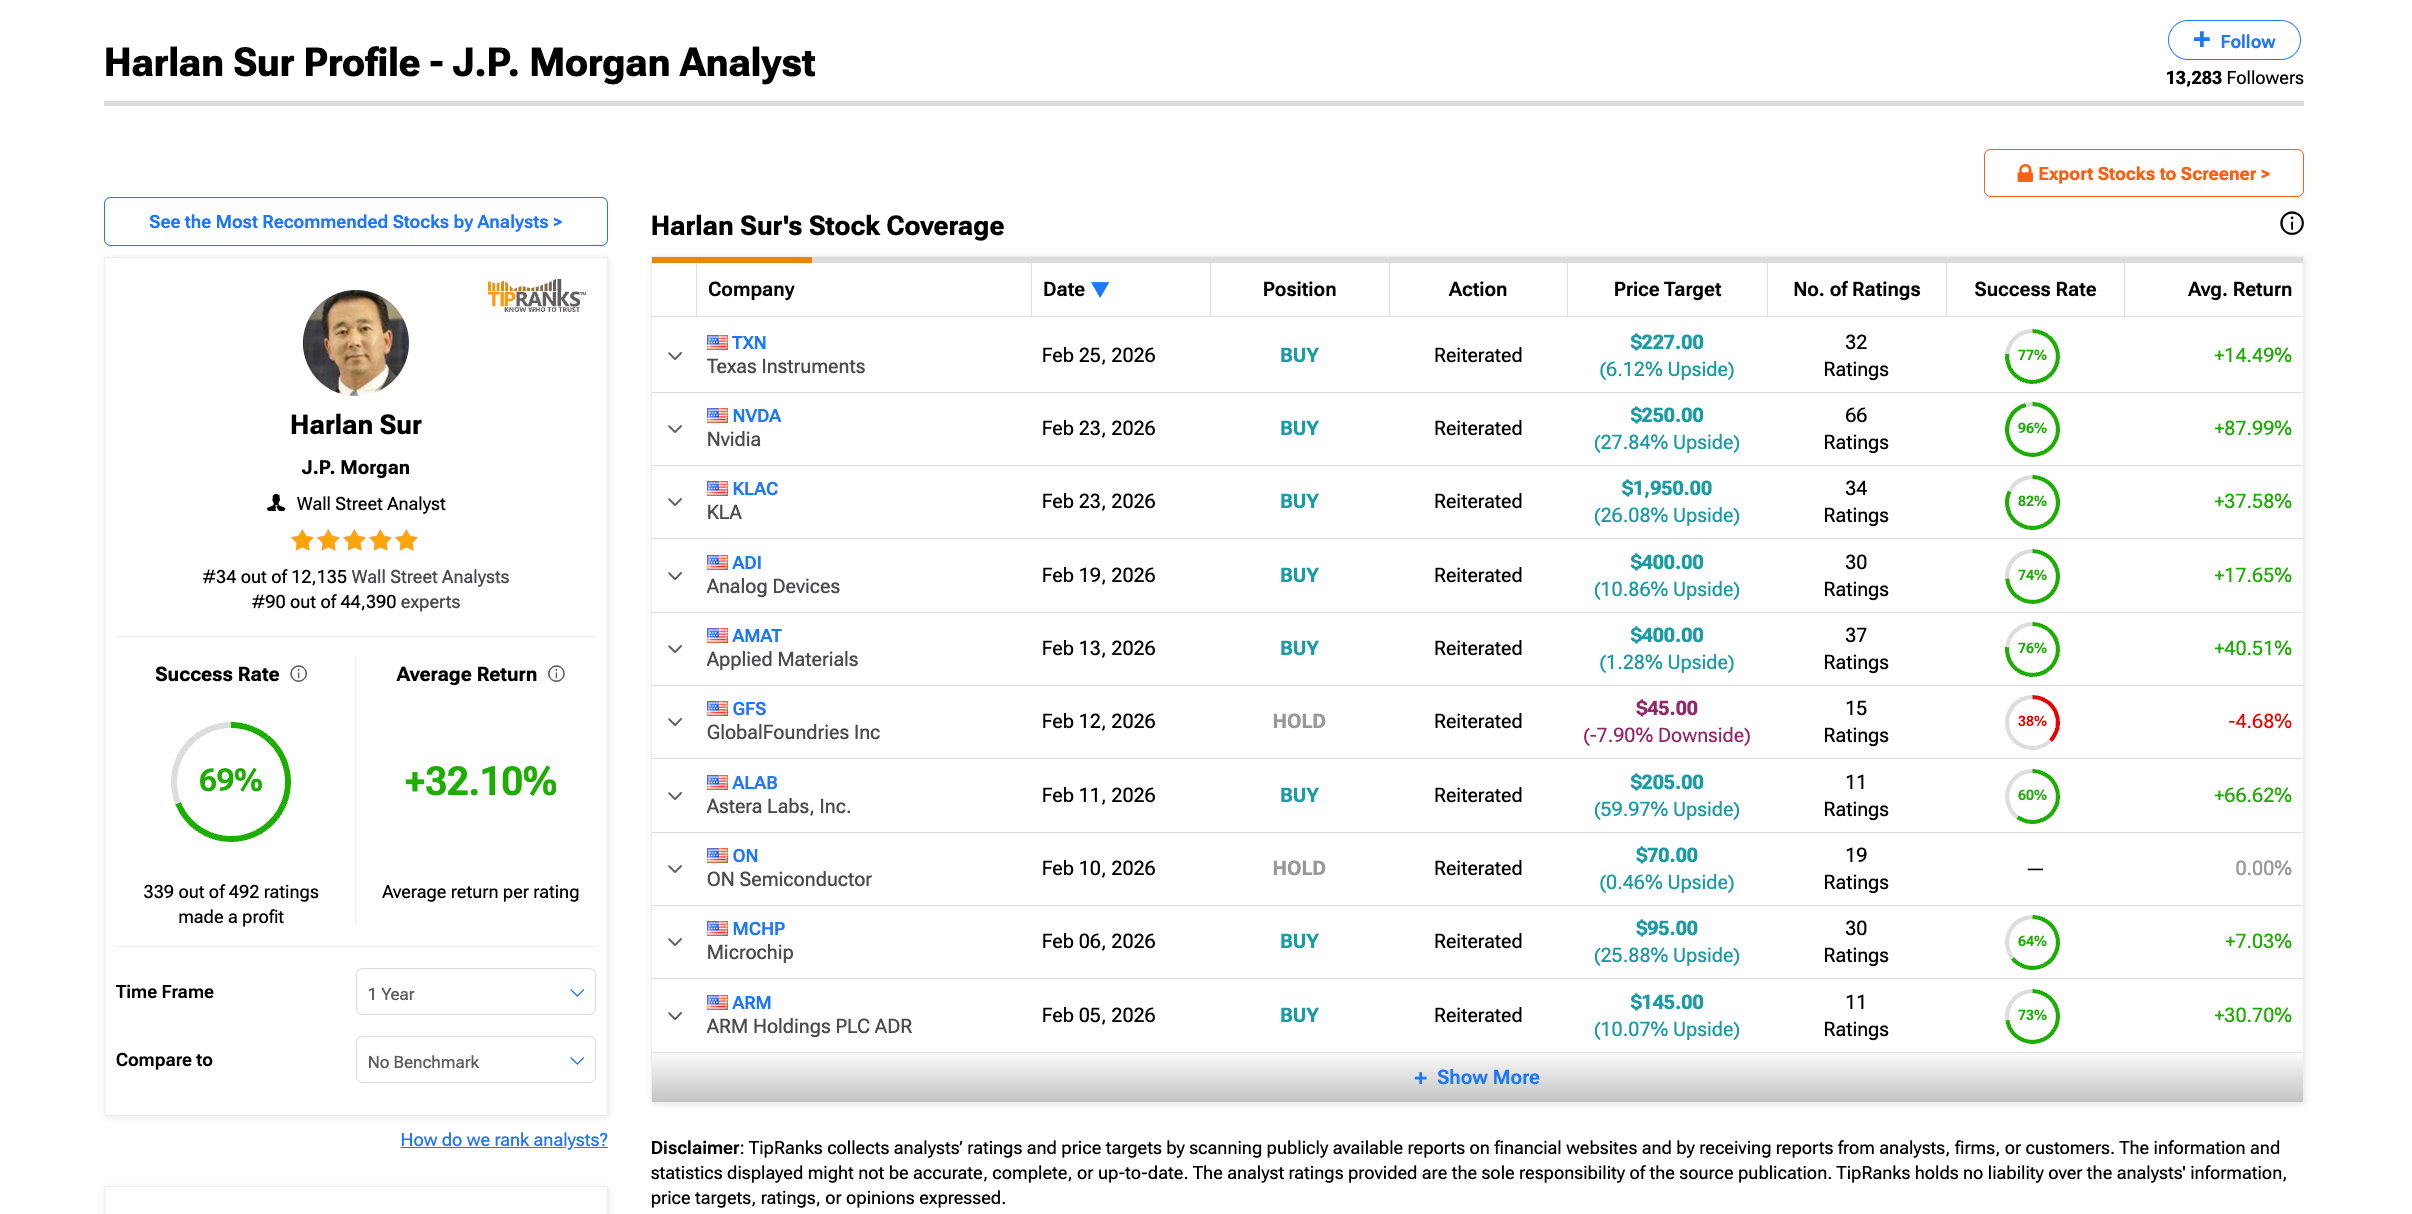
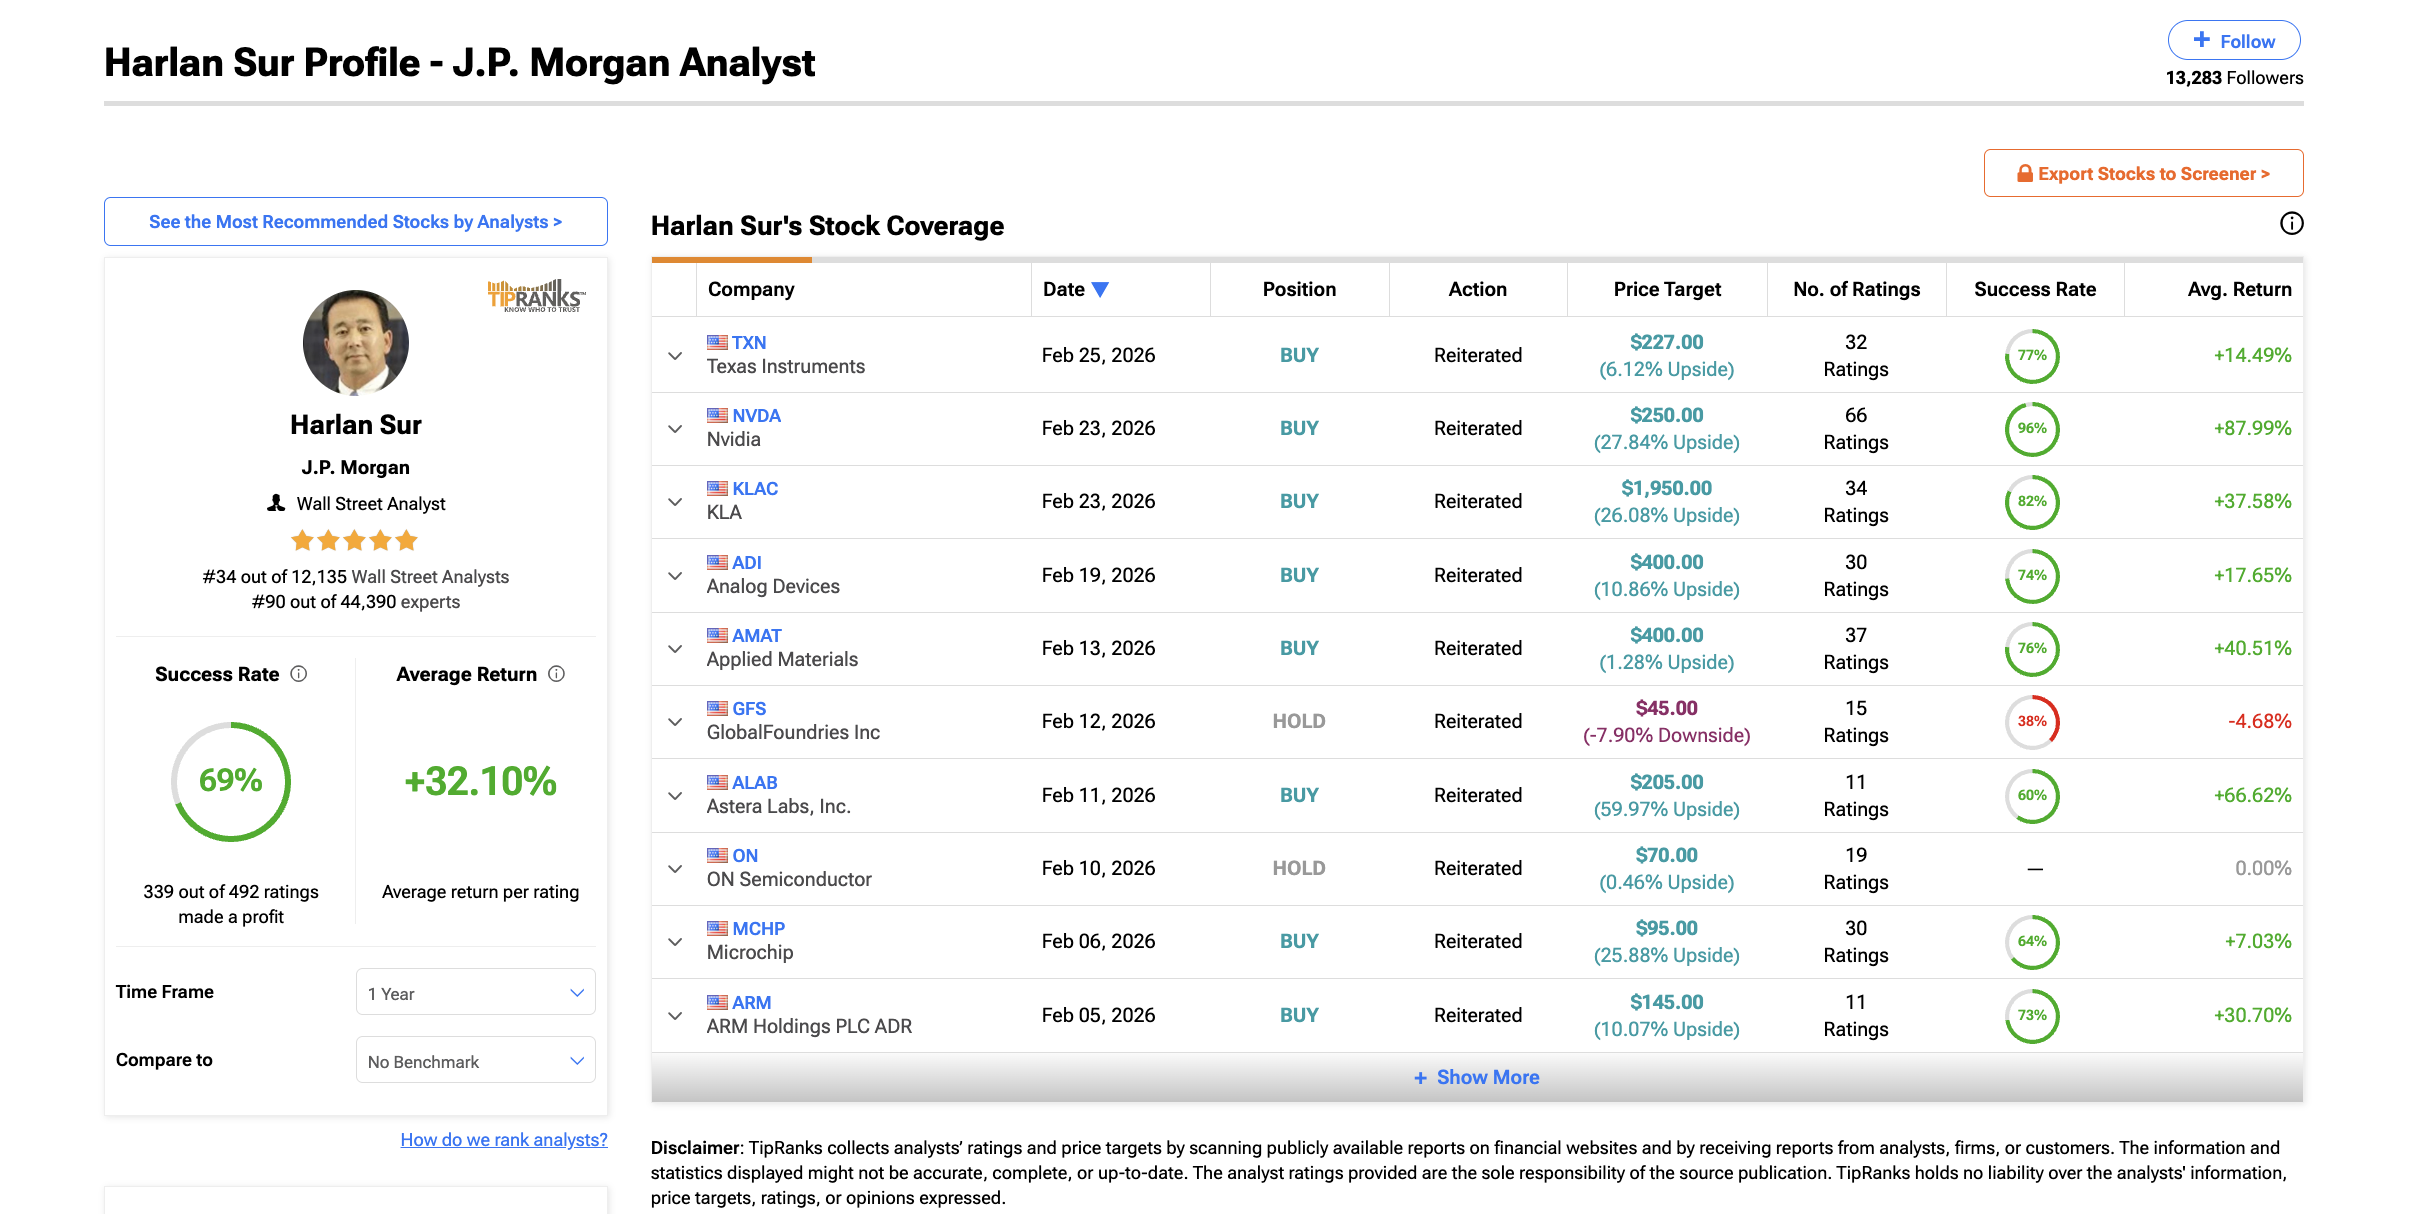
JPMorgan analyst Harlan Sur responded by lifting the Nvidia price target from $250 to $265.
But here is what most analysts are not highlighting. NVIDIA’s quarter-over-quarter growth rate is quietly decelerating. Q3 grew 22% over Q2. Q4 grew 19.5% over Q3.
The Q1 guidance implies roughly 14.5% sequential growth. Revenue keeps hitting records, but the pace of acceleration is fading. For a stock priced on growth momentum, this distinction matters. Something big money might be watching.
There is also the question of who is actually driving this revenue. Deepwater Asset Management’s Gene Munster estimates that roughly 70% of Nvidia’s revenue comes from just 8 companies.
CFO Colette Kress confirmed that the top 5 hyperscalers (cloud computing providers) account for slightly over 50% of data center revenue. That level of customer concentration means that even a modest 10-15% reduction in AI capex from a few major buyers could translate into billions in lost quarterly revenue.
It is also worth noting that JPMorgan’s asset management division is itself a significant institutional holder of Nvidia.
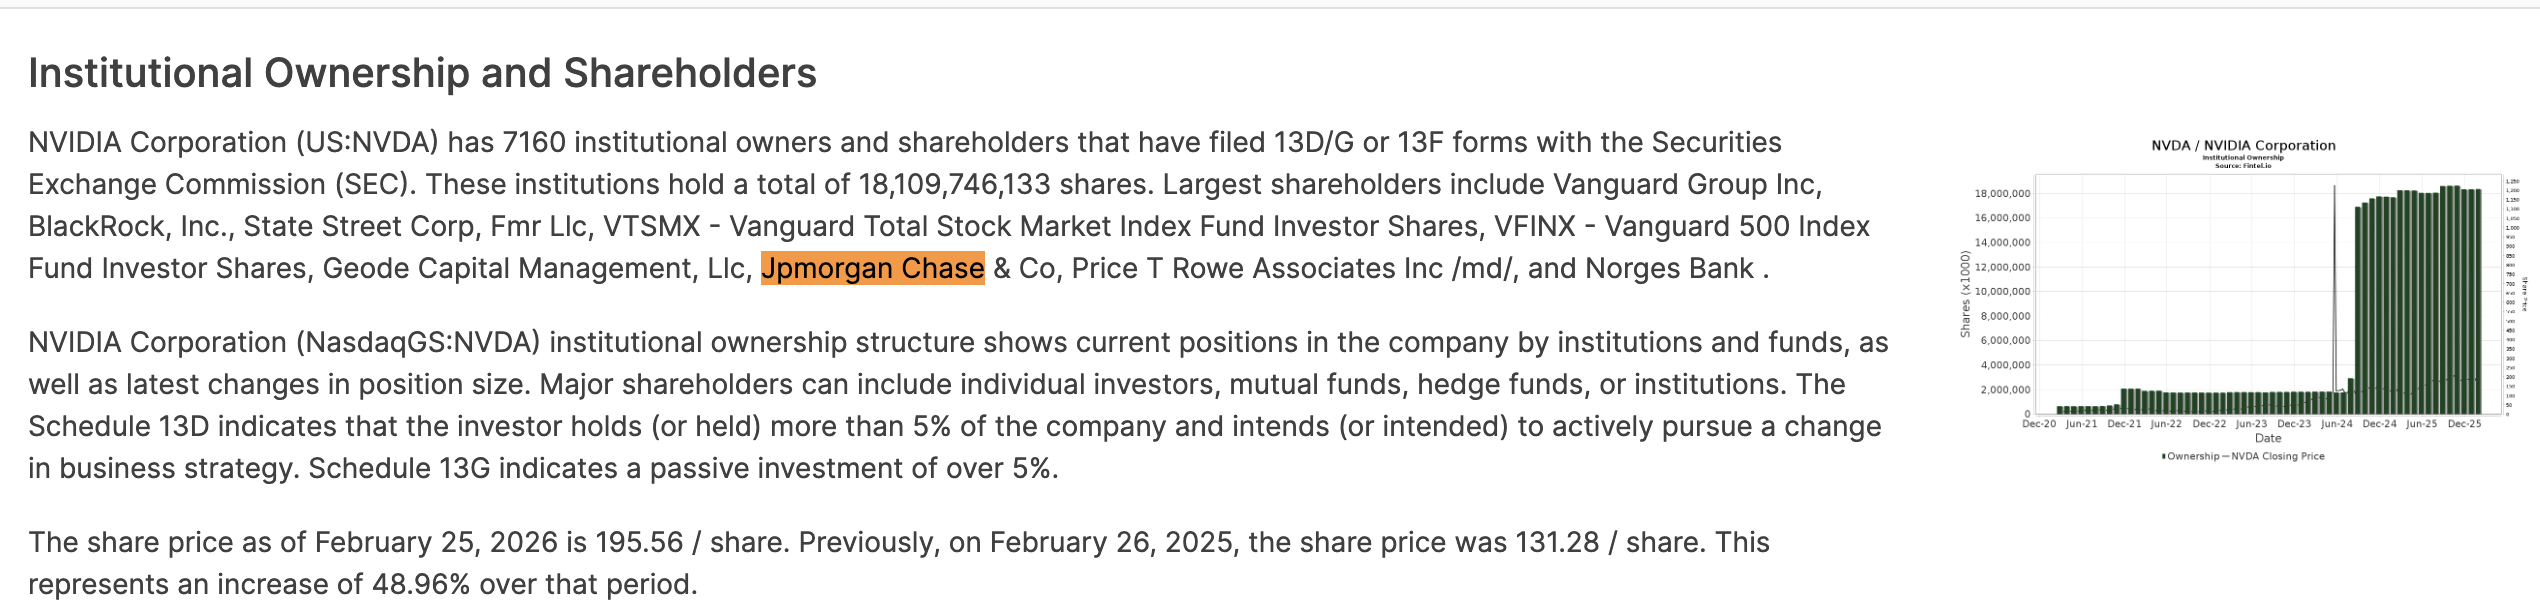
This is standard on Wall Street, but it is a context that retail investors should be aware of when evaluating the bullishness behind a price target upgrade.
What Retail NVDA Investors See vs What Institutions Are Doing
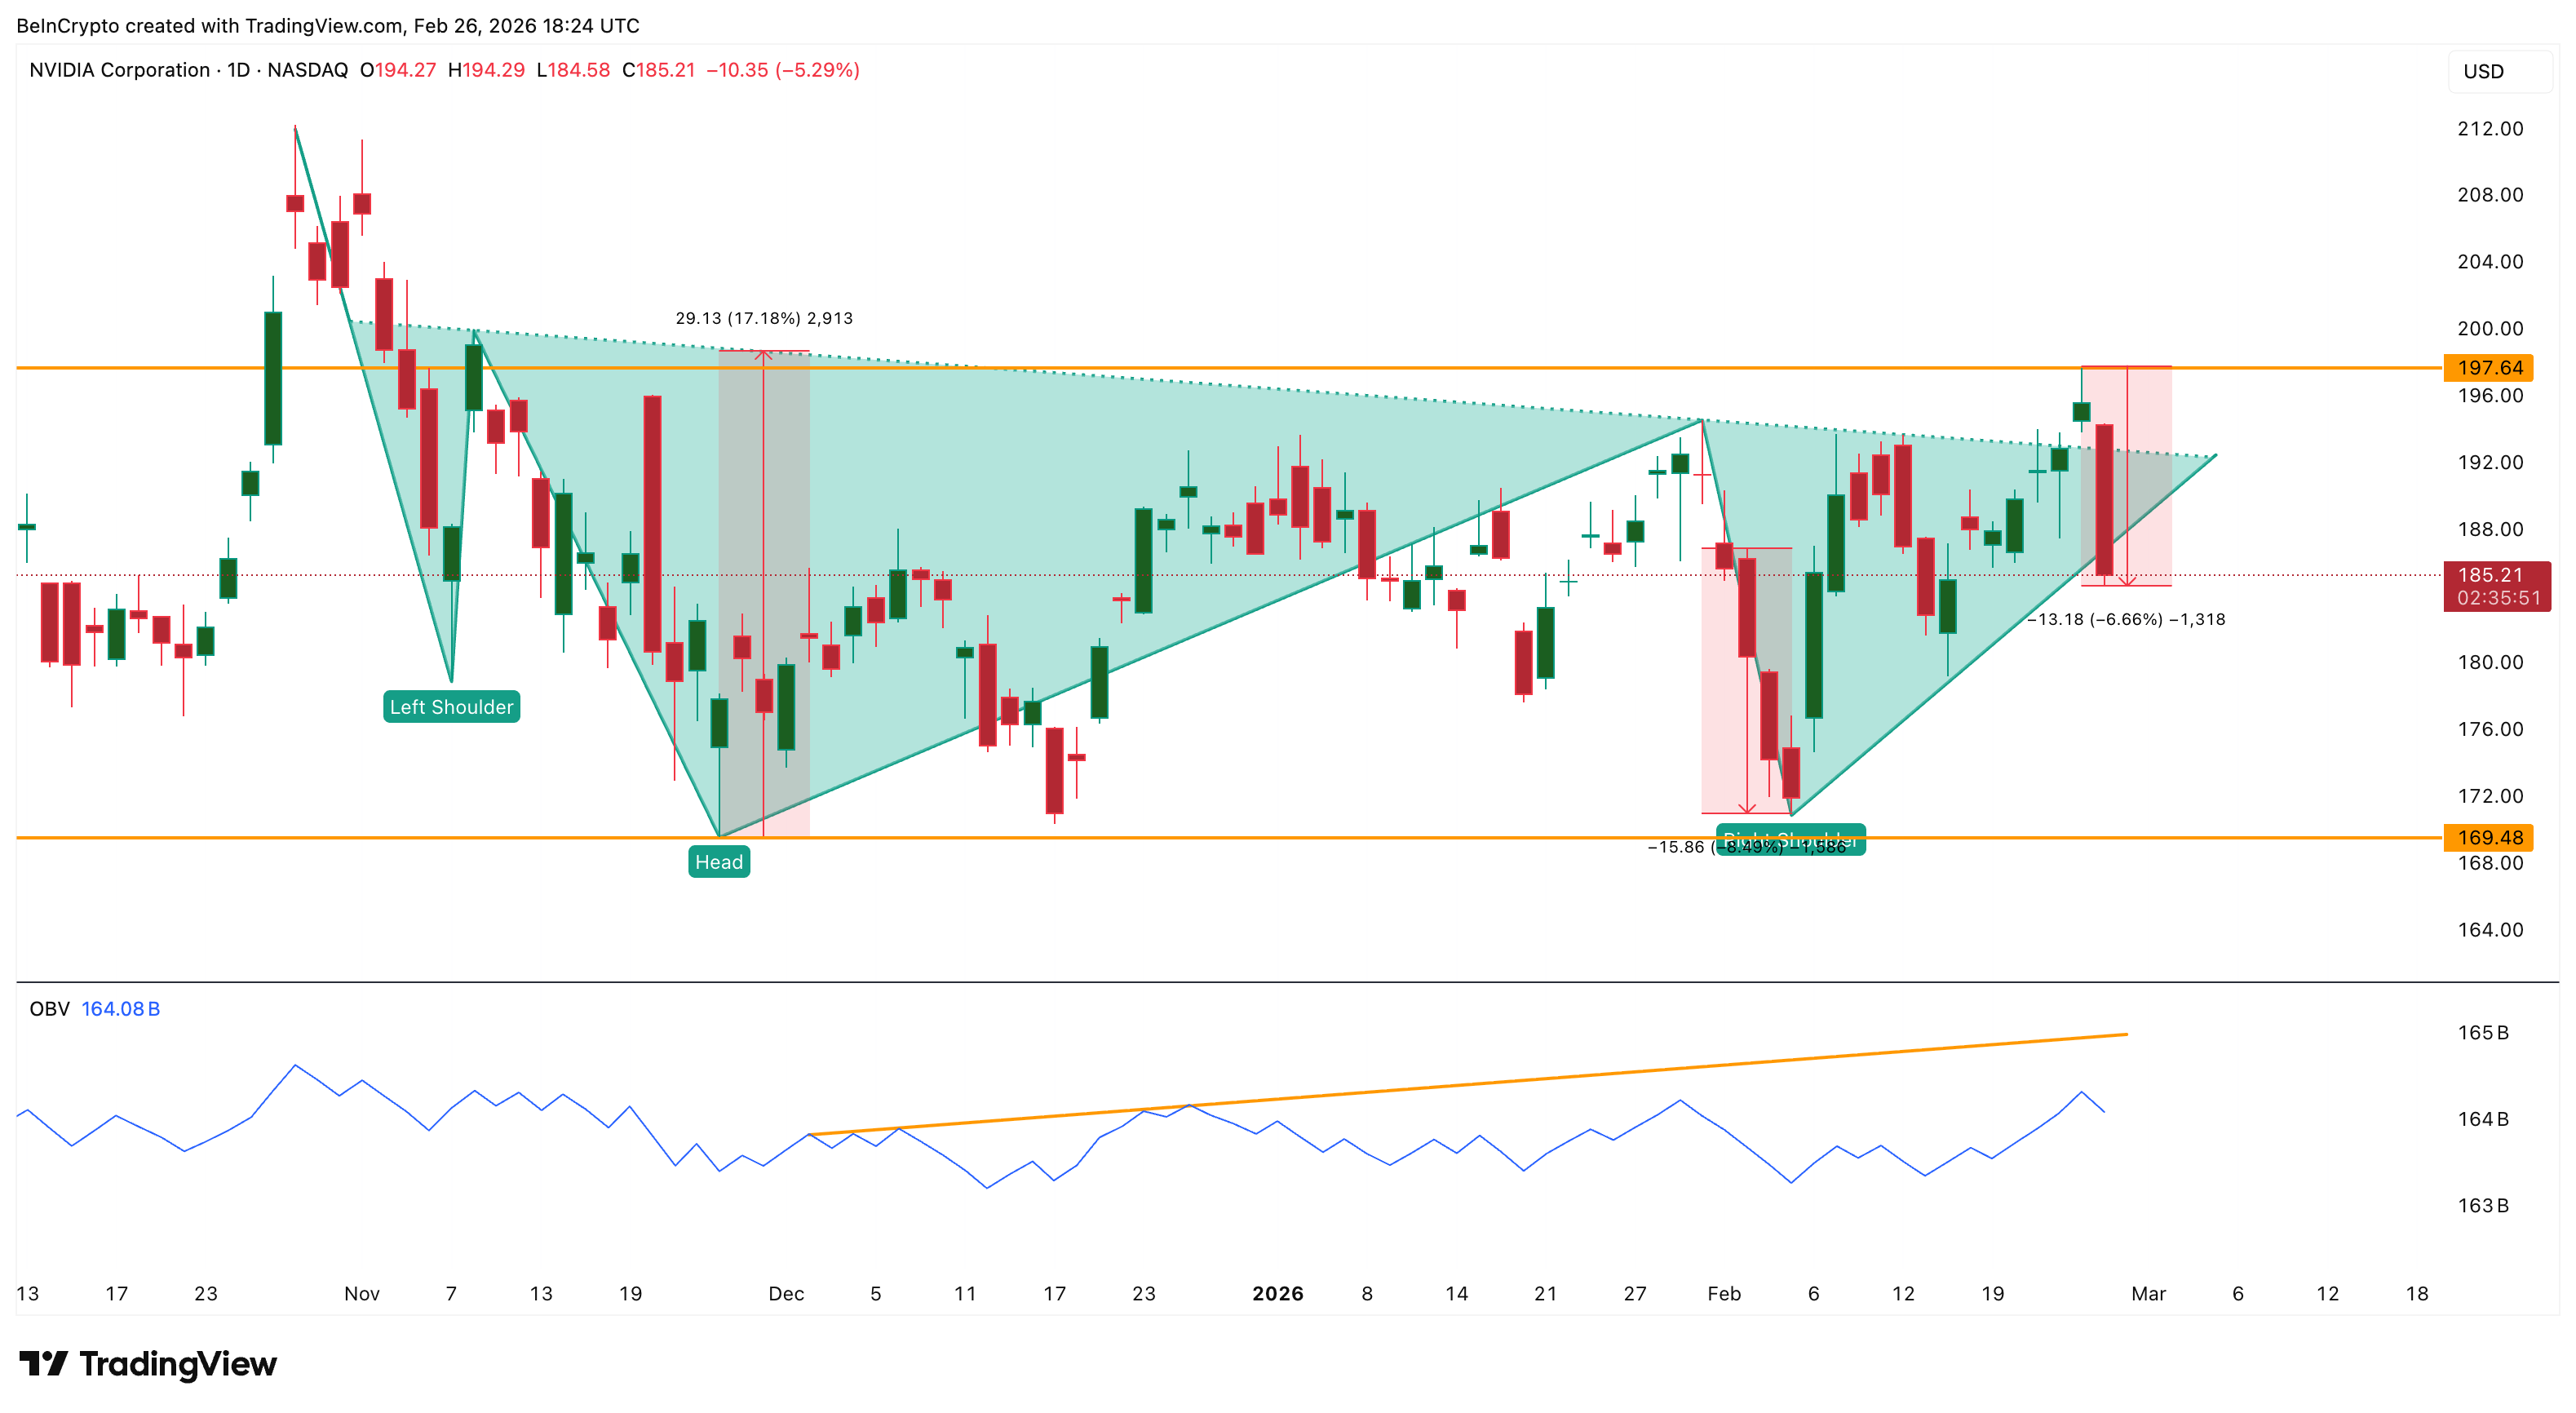
On-Balance Volume (OBV), an indicator that tracks cumulative buying and selling pressure by adding volume on up days and subtracting it on down days, tells a positive story on the surface.
OBV has maintained higher highs throughout Nvidia’s 3-month consolidation, suggesting retail-driven buying pressure remains consistently positive. However, it still needs to break past its ascending trendline resistance to confirm genuine broad-based strength.
The most recent 13F filings (quarterly reports large investors must file with the SEC revealing their positions) for Q4 2025 show a dramatic shift in institutional sentiment.
Net institutional money flow surged to approximately $149 billion in purchases against $36 billion in sales — a net inflow of roughly $113 billion. That is a massive improvement from Q3, where institutions bought $38 billion and sold $34 billion, leaving a net inflow of just $4 billion.
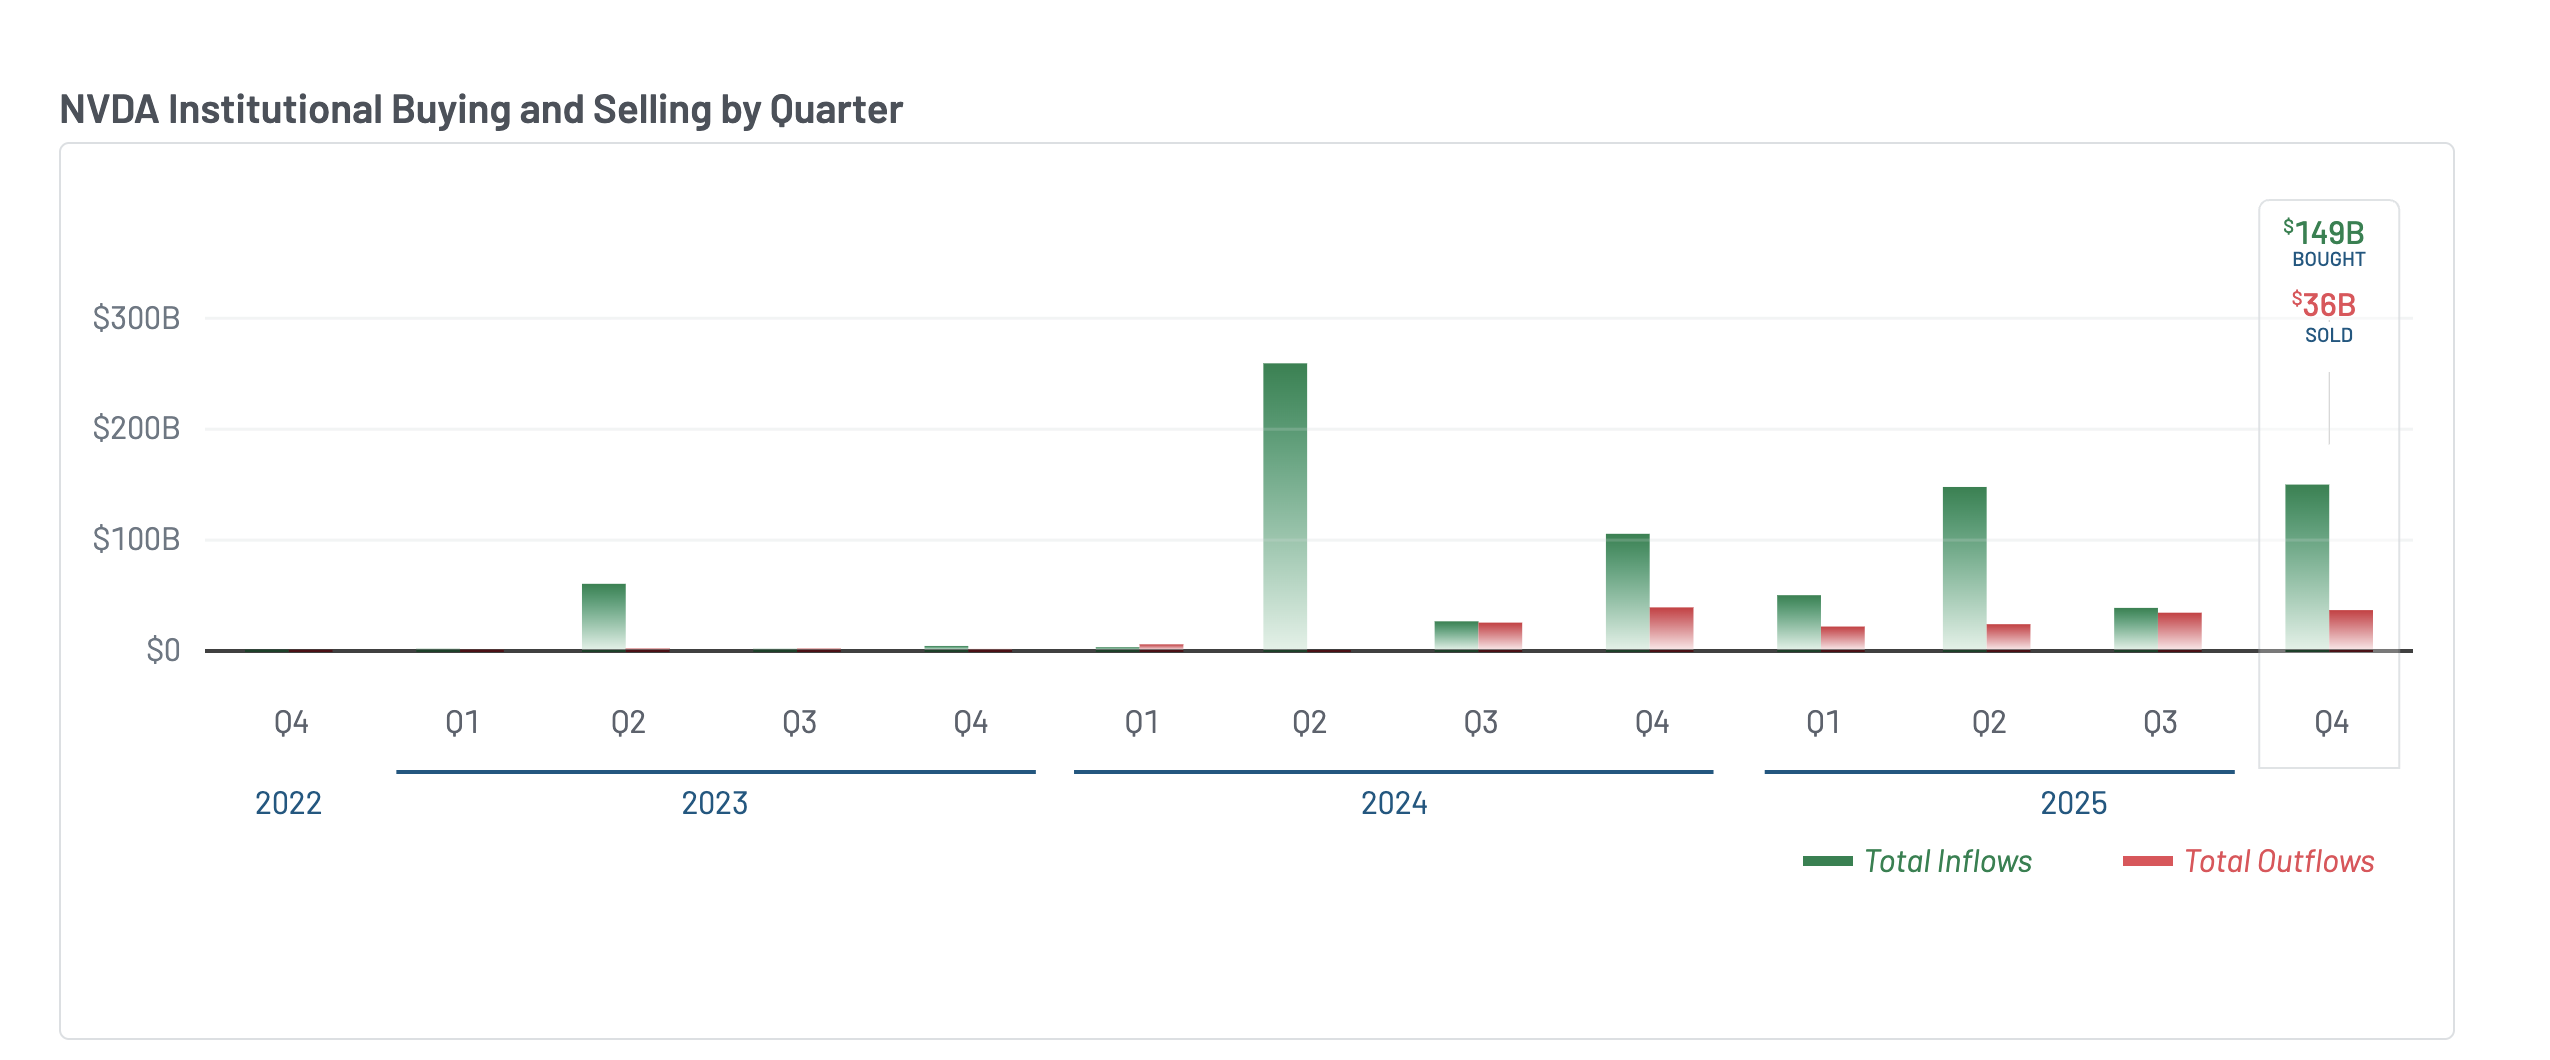
Yet despite this wall of institutional money entering NVDA in Q4, the stock barely moved — trading sideways for most of the period. That suggests institutions were accumulating, but supply from insiders and earlier holders absorbed the demand. NVIDIA director Mark Stevens sold approximately $40 million in shares in December.
Bank of America, while slightly increasing its equity stake, closed out both its call and put options positions entirely — neutralizing its directional bets.
Institutions are clearly positioned. But the hedging and the flat price despite massive inflows suggest they are bracing for something. The next section explores what that might be.
The Risk Hiding in the Charts
The Chaikin Money Flow (CMF), an indicator that measures whether money is flowing into or out of a stock based on where the price closes within its daily range weighted by volume, reveals what the earnings headline does not.
Since February 5, as the right shoulder of Nvidia’s inverse head and shoulders pattern formed, CMF climbed steadily alongside the price. It rose all the way into the February 25 earnings breakout when Nvidia briefly touched $197.
Then on February 26, as the stock reversed sharply to $185, CMF plunged.
That sudden collapse suggests the money flowing in during the rally was speculative positioning — not committed institutional capital — and it evaporated the moment the breakout failed. And based on what we discussed earlier, revenue deceleration could be a reason.
The monthly VWAP (Volume Weighted Average Price, which approximates where institutions have built their positions) reinforces this. NVIDIA had been trading above its monthly VWAP since breaking out on February 17.
The last time Nvidia broke below the monthly VWAP was on January 30, which led to a correction of approximately 8.5% by early February.
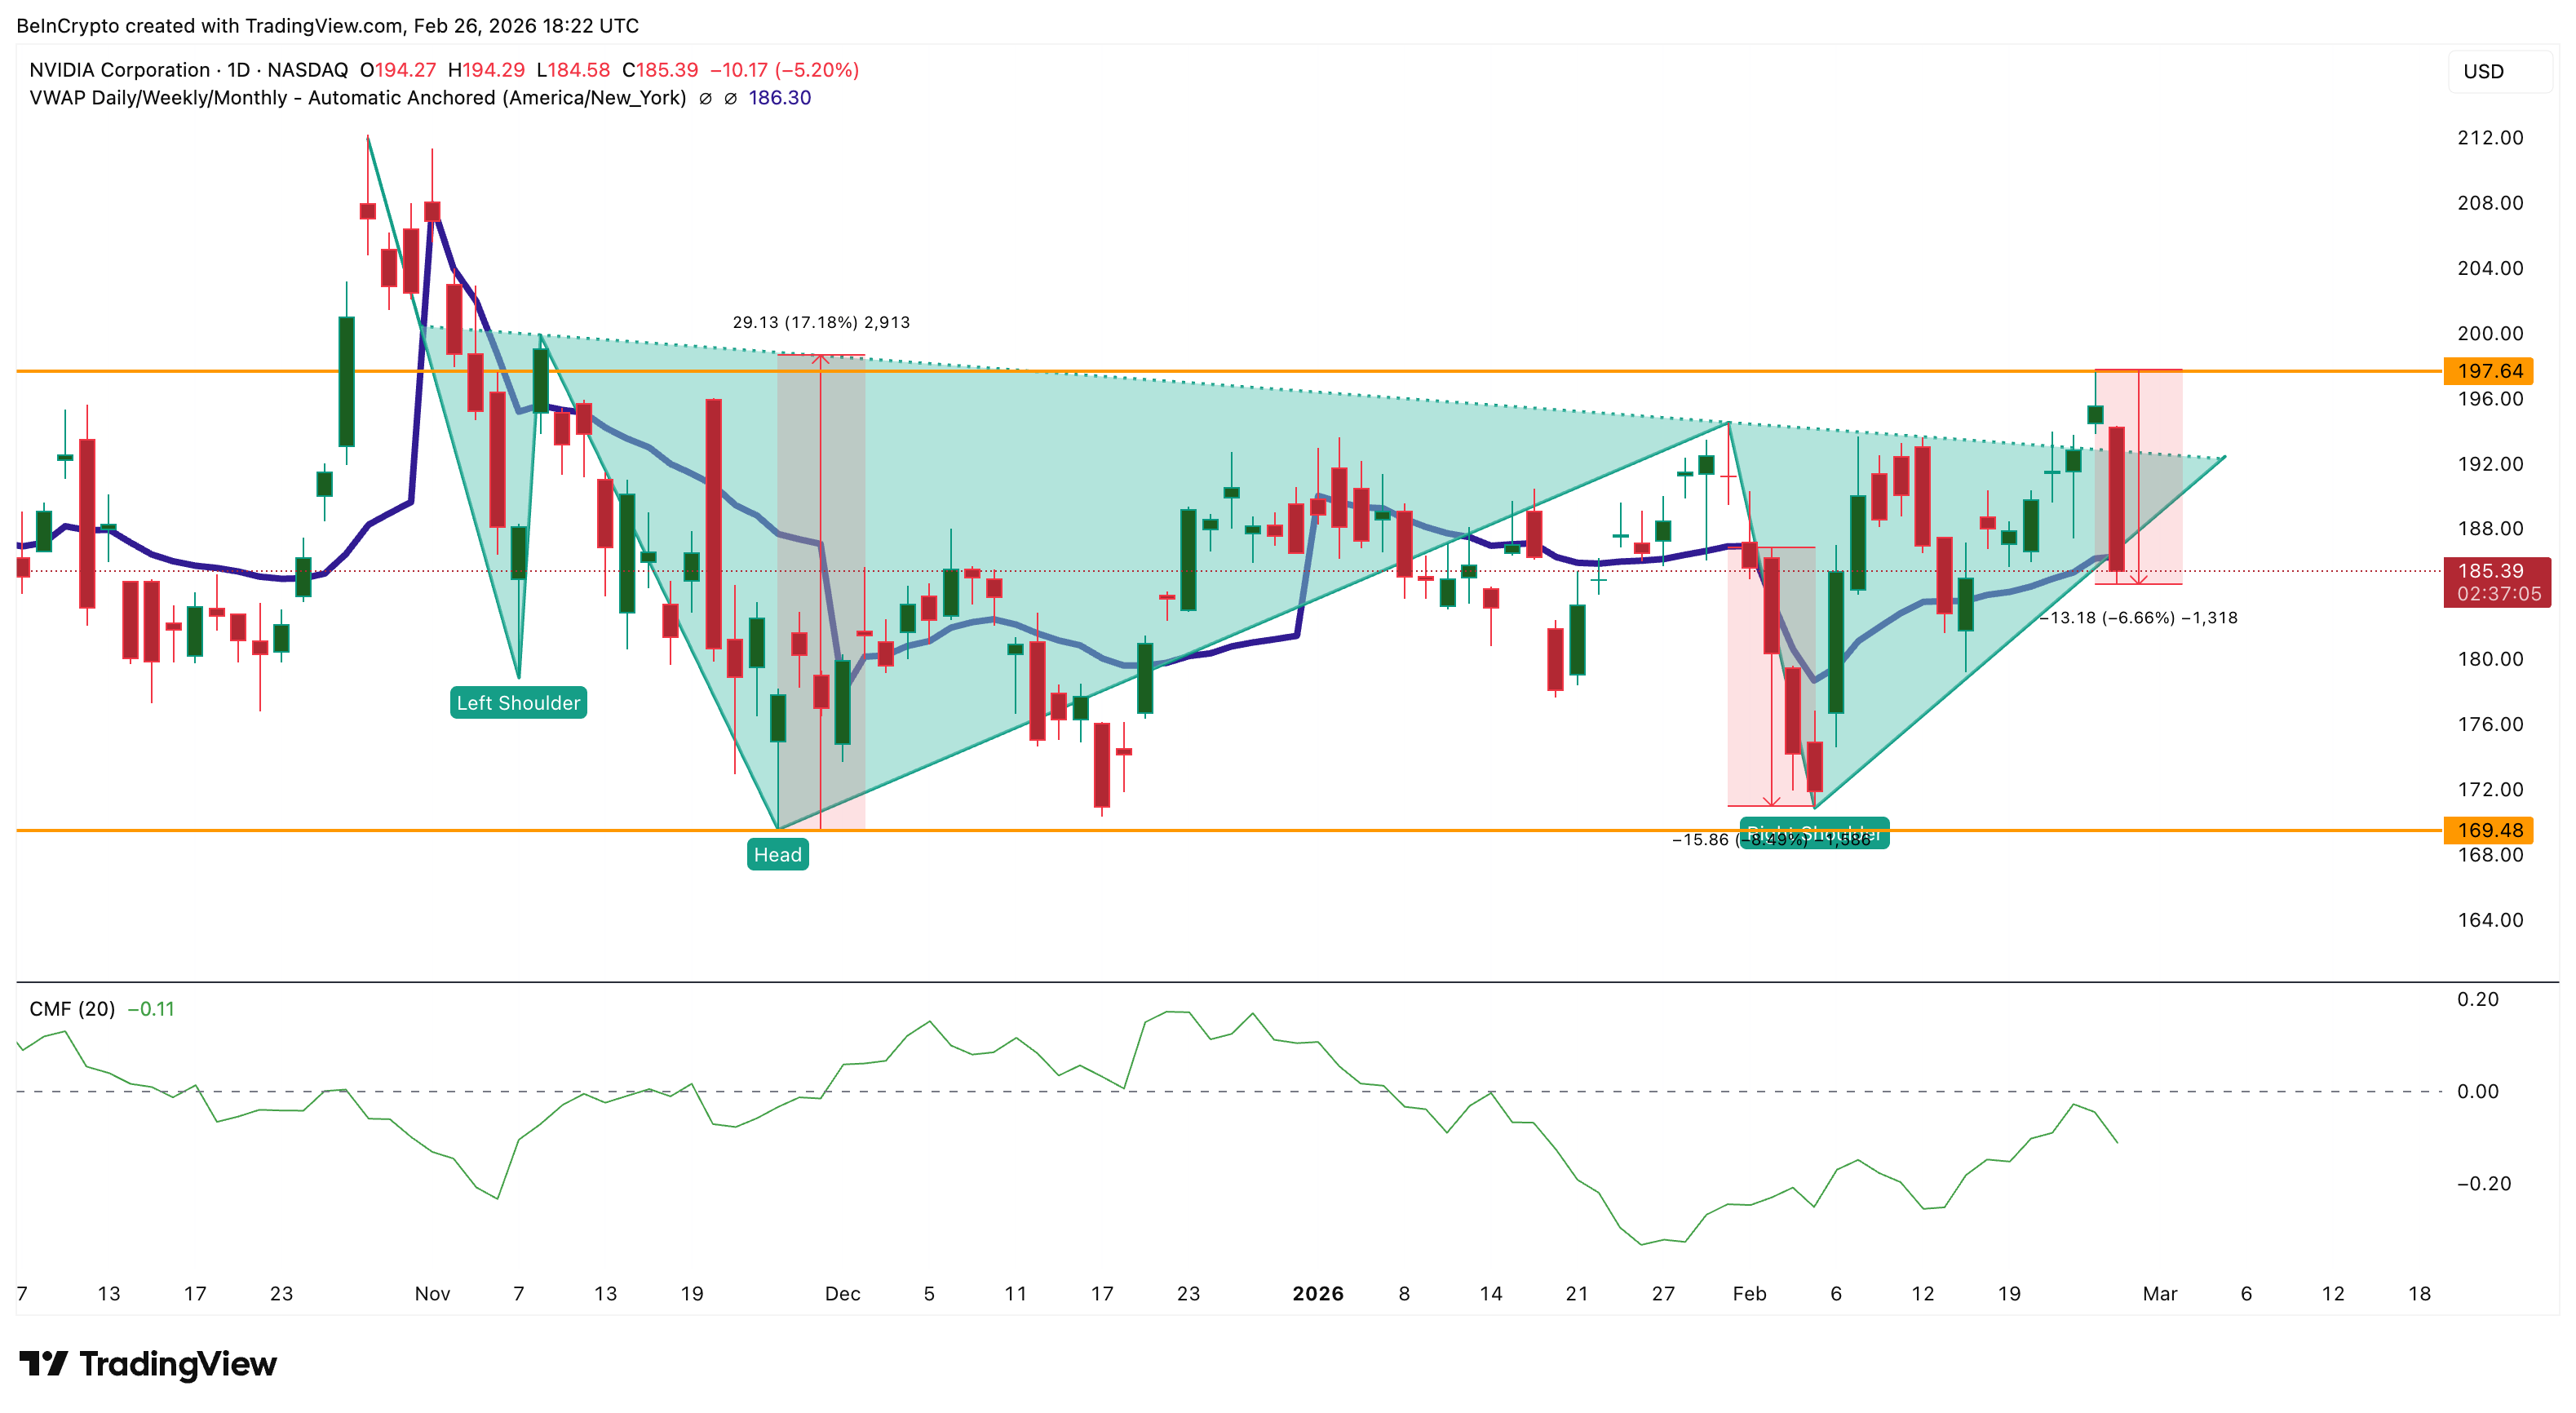
As of February 26, the stock has once again fallen below this line. This means recent institutional buyers are now underwater, which historically triggers further selling as stop losses unwind.
The technical breakdown has context. Michael Burry flagged today that Nvidia’s supply commitments have ballooned to levels that mirror Cisco before the dot-com bust — a company that wrote down billions when demand didn’t meet expectations.
CFO Kress acknowledged Nvidia has locked in inventory “further out in time than usual.” Bulls like BofA’s Vivek Arya argue this secures Nvidia’s dominance. But CMF collapsing and VWAP breaking on the same day suggests the market isn’t waiting to find out who’s right.
The NVIDIA Stock Price Levels That Decide What Happens Next
The charts, the money flow, and the institutional positioning all point to the same conclusion — $195 is where conviction gets tested, a level highlighted later on the chart. But first, the risk.
On the daily chart, a hidden bearish divergence has formed between November 10 and February 25. During this period, the NVIDIA stock price made a lower high while the Relative Strength Index (RSI), a momentum indicator, made a higher high
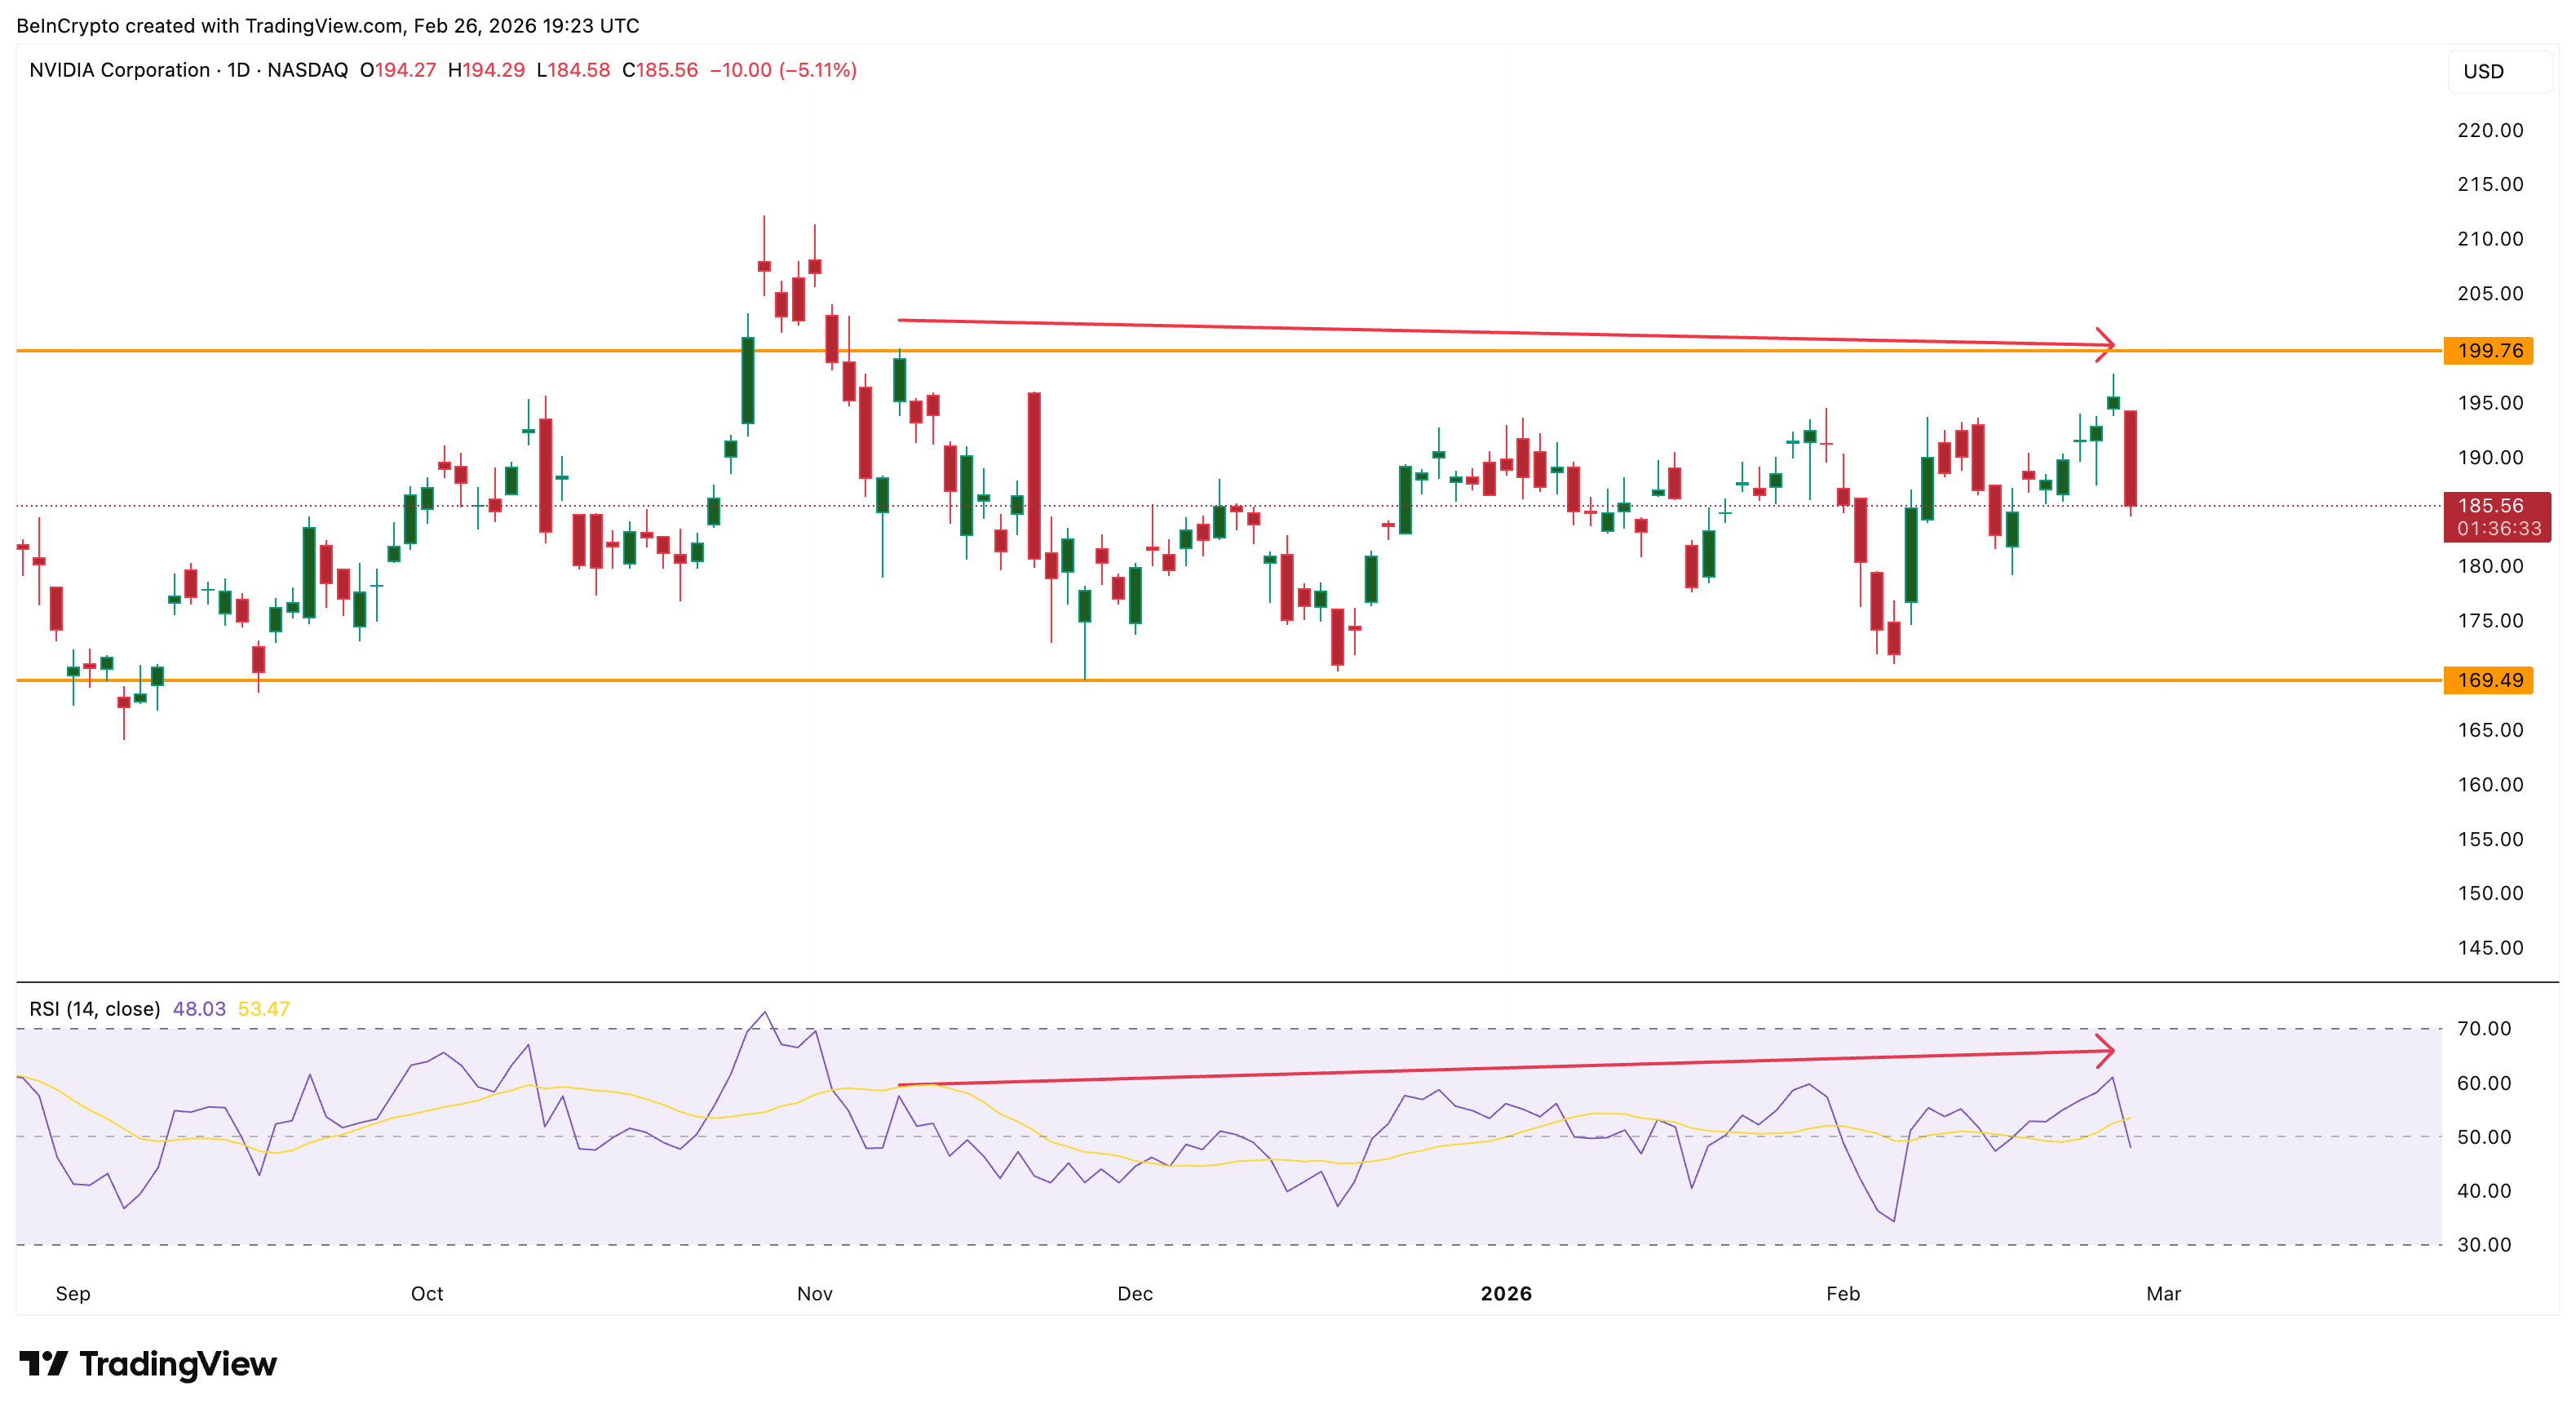
It is a signal that upward momentum is quietly fading even as the stock appears to hold its range.
Since that November divergence started developing, Nvidia has been locked between $169 and $199. It couldn’t break out of this consolidation despite multiple attempts — including the inverse head-and-shoulders breakout on February 25, which failed within 24 hours.
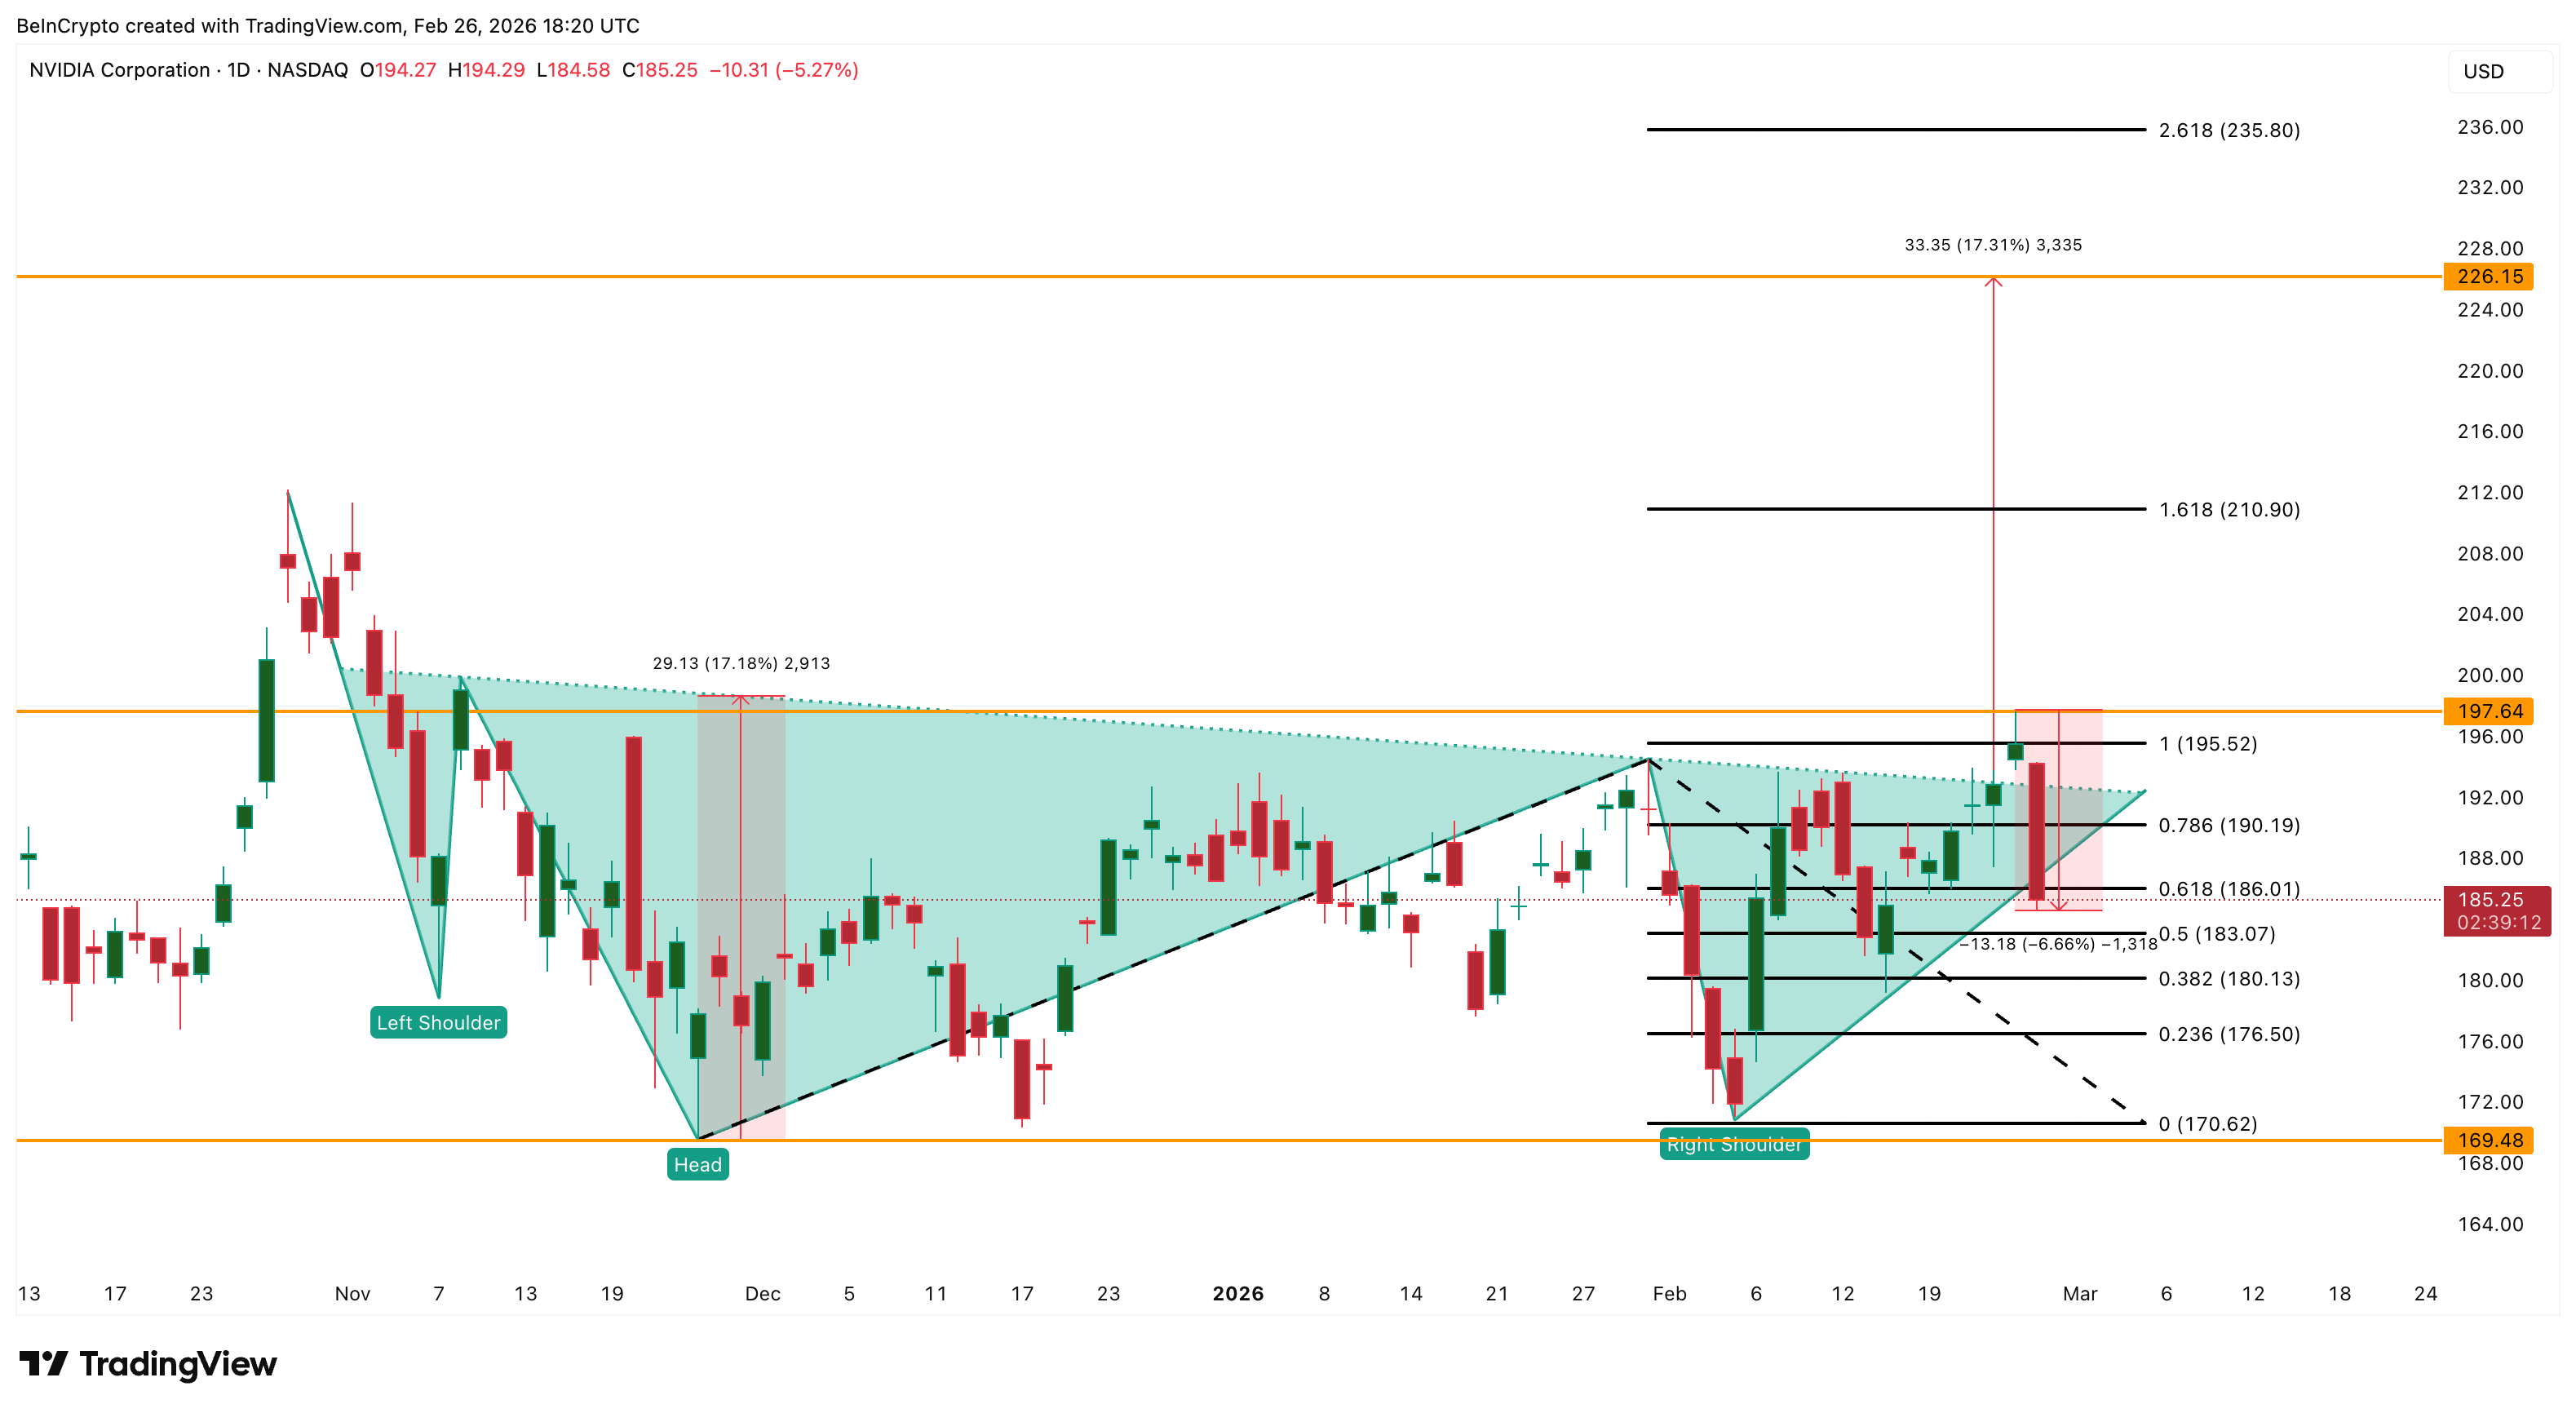
The Fibonacci extension levels from the pattern now frame what comes next. On the downside, $183 at the 0.5 level is the immediate support. Below that, $180 at the 0.382 level becomes critical — a break there exposes $170, the right shoulder low, and $169, the head. Those levels would invalidate the pattern entirely.
On the upside, the neckline at $195 remains the key resistance and the conviction tester. A clean daily close above it, which the NVIDIA stock failed to do yesterday, is needed to reactivate the pattern.
That could push it towards the projected target at $226, the full head-to-neckline measurement.
The next extension at $235 brings it closer to JPMorgan’s $265 target. The path exists on paper.
But as the money flow, the hidden bearish divergence, and today’s 7% rejection all confirm, this is a market that’s not buying it yet.

Licensing Expansion to Cover Dealers and Custodians
The government will introduce a bill this year to license digital asset dealers and custodians. The proposal will expand regulation beyond trading platforms and bring more service providers under formal supervision. As a result, authorities aim to close regulatory gaps and strengthen operational standards.
Officials structured the reforms under Hong Kong’s second digital asset policy statement. The framework seeks to balance innovation with clear compliance obligations across the market. At the same time, regulators intend to reinforce market integrity and financial stability.
The Securities and Futures Commission will oversee key parts of the expanded regime. It plans to broaden approved products and services for professional participants. In addition, the regulator will launch an accelerator program to support compliant financial technology development.
Stablecoin Licensing and Market Liquidity Measures
Authorities have confirmed that Hong Kong has implemented a licensing system for fiat-referenced stablecoin issuers. The first batch of licenses will be granted next month under the new framework. Consequently, the city will move from regulatory planning to live market authorization.
Regulators will work with approved issuers to develop controlled and compliant use cases. Officials aim to integrate stablecoins into payment and settlement activities within clear risk parameters. Meanwhile, authorities will monitor issuance structures and reserve management standards.
The Securities and Futures Commission will also take steps to deepen digital asset market liquidity. It will expand the scope of eligible instruments and services available to professional market participants. Therefore, policymakers expect stronger capital flows and improved price discovery across platforms.
Hong Kong’s broader strategy reflects rising global competition among financial centers. Several jurisdictions have advanced stablecoin and tokenization rules in recent years. In response, Hong Kong has accelerated its regulatory timetable to maintain regional leadership.
Tokenized Bonds and OECD Reporting Framework
Tokenization forms another core pillar of the government’s digital asset strategy. Authorities will issue guidance allowing debenture holder registers to operate on distributed ledger systems. This clarification will support legal certainty for tokenized bond structures.
Officials will also explore electronic signatures for bond issuance documents. In parallel, authorities will examine the digitalization of bearer bonds within existing legal boundaries. These measures aim to modernize debt markets while preserving regulatory oversight.
Hong Kong has already experimented with tokenized green bond issuance in recent years. Those pilot projects demonstrated operational feasibility and settlement efficiency. Building on that experience, policymakers now seek broader institutional adoption.
At the same time, the government will amend the Inland Revenue Ordinance. The changes will implement the OECD Crypto-Asset Reporting Framework and the updated Common Reporting Standard. A bill is expected in the first half of this year.
The new reporting rules will strengthen cross-border tax transparency for digital asset transactions. Authorities intend to align Hong Kong with global standards on financial disclosure. Therefore, the reforms will address tax compliance while supporting market credibility.
Together, the licensing expansion, stablecoin approvals, and tokenization guidance mark a coordinated policy push. The measures integrate regulation, innovation, and tax reporting into a unified framework. As implementation begins, Hong Kong positions itself as a structured and competitive global digital asset hub.
8 cost of living changes coming in 2026 including energy bills cut and DWP updates
Arlo Technologies surges on earnings beat and strong guidance

Will crypto market dip as USDT exchange reserves decline?


-

 Video7 days ago
XRP News: XRP Just Entered a New Phase (Almost Nobody Noticed)
-

 Politics5 days ago
Baftas 2026: Awards Nominations, Presenters And Performers
-

 Fashion6 days ago
Weekend Open Thread: Boden – Corporette.com
-

 Sports3 days ago
Women’s college basketball rankings: Iowa reenters top 10, Auriemma makes history
-

 Politics3 days ago
Nick Reiner Enters Plea In Deaths Of Parents Rob And Michele
-

 Business2 days ago
True Citrus debuts functional drink mix collection
-

 Crypto World3 days ago
XRP price enters “dead zone” as Binance leverage hits lows
-

 Business4 days ago
Mattel’s American Girl brand turns 40, dolls enter a new era
-

 Business4 days ago
Law enforcement kills armed man seeking to enter Trump’s Mar-a-Lago resort, officials say
-

 Tech2 days ago
Unsurprisingly, Apple's board gets what it wants in 2026 shareholder meeting
-

 NewsBeat21 hours ago
Cuba says its forces have killed four on US-registered speedboat | World News
-
 NewsBeat23 hours ago
Manchester Central Mosque issues statement as it imposes new measures ‘with immediate effect’ after armed men enter
-
 NewsBeat3 days ago
‘Hourly’ method from gastroenterologist ‘helps reduce air travel bloating’
-

 Tech4 days ago
Anthropic-Backed Group Enters NY-12 AI PAC Fight
-

 NewsBeat4 days ago
Armed man killed after entering secure perimeter of Mar-a-Lago, Secret Service says
-

 Politics4 days ago
Maine has a long track record of electing moderates. Enter Graham Platner.
-
 NewsBeat2 days ago
Police latest as search for missing woman enters day nine
-

 Business17 hours ago
Discord Pushes Implementation of Global Age Checks to Second Half of 2026
-

 Crypto World2 days ago
Entering new markets without increasing payment costs
-
 Sports3 days ago
2026 NFL mock draft: WRs fly off the board in first round entering combine week