
Crypto World
Cardano Price Tests Bear Market Support

Cardano’s price has entered a tight consolidation phase over the past several days. ADA is trading within a narrowing range as momentum weakens. Repeated attempts to break higher have stalled, reflecting broader caution in the crypto market.
Bearish signals dominate the short-term outlook. However, one key cohort of holders is providing support.
Cardano Is Under Pressure
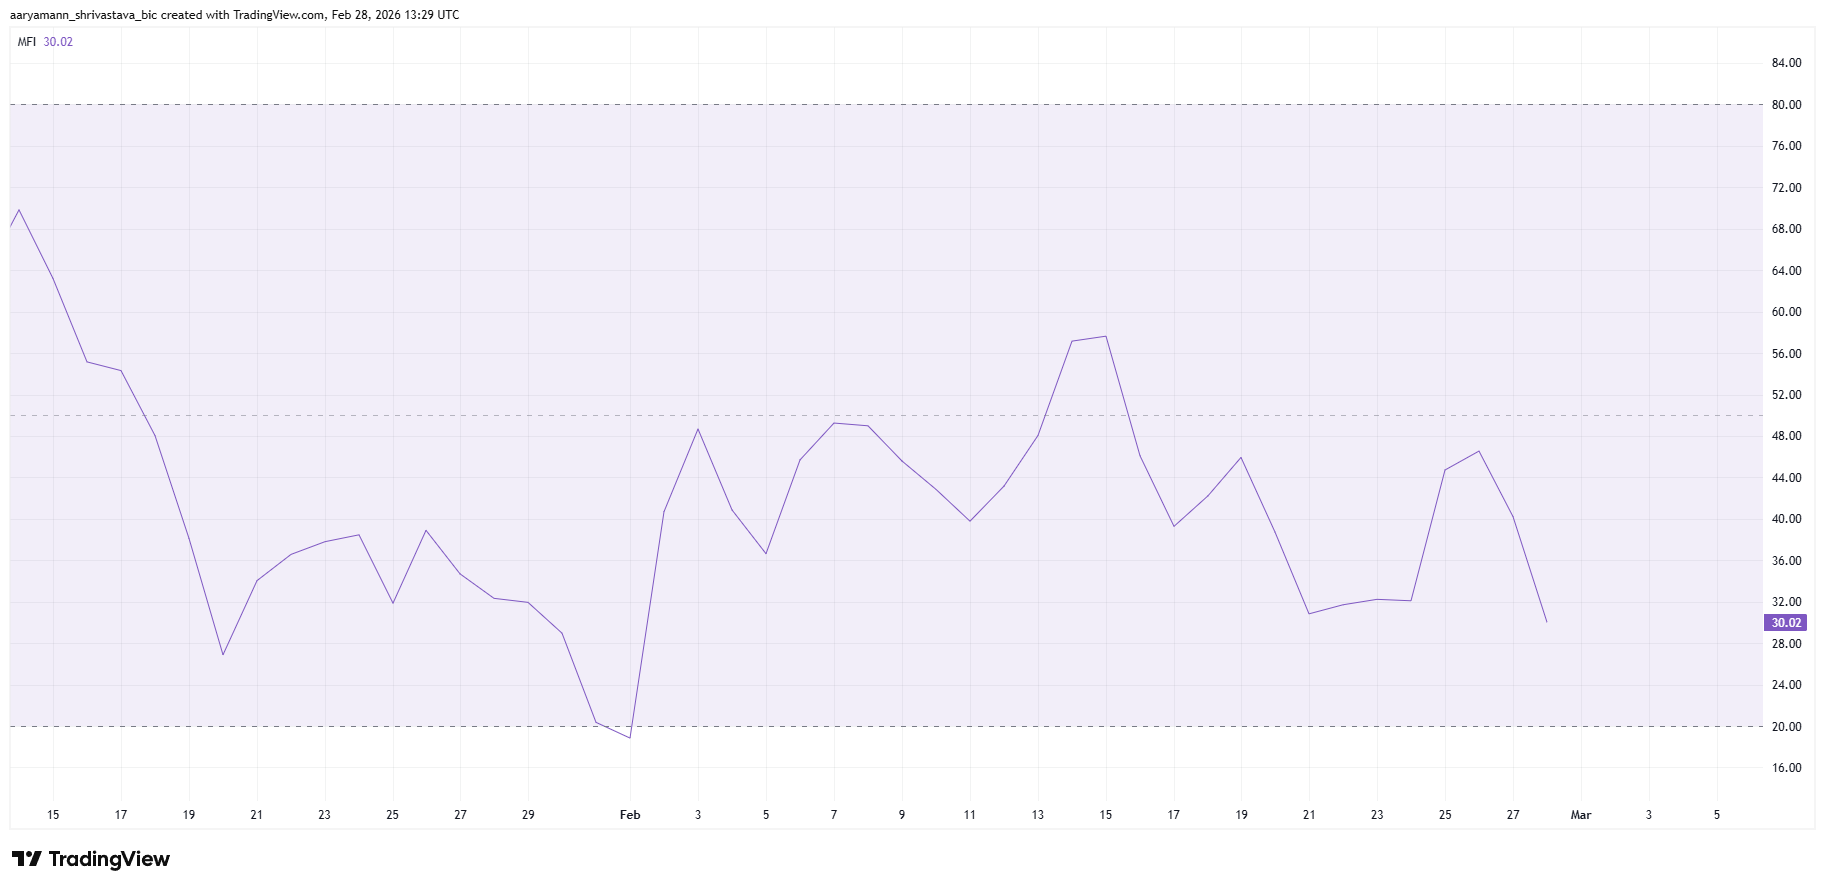
The Money Flow Index shows persistent selling pressure on ADA. The indicator remains below the neutral 50 level, signaling sustained capital outflows. Weak inflows suggest that buyers are hesitant to step in at current prices.
A shift in momentum requires reclaiming the 50 mark or entering oversold territory. At present, ADA is far from both conditions. Without a strong reversal signal, selling pressure may continue to weigh on Cardano price action.
Want more token insights like this? Sign up for Editor Harsh Notariya’s Daily Crypto Newsletter here.
Derivatives data reinforces the bearish narrative. The liquidation map indicates that Cardano futures contracts are skewed toward short positions. Exposure on short contracts stands near $23 million compared with $14 million in potential long liquidations.
This imbalance highlights trader expectations for further downside. Elevated short interest can increase volatility if the price moves sharply. However, current positioning suggests that many traders anticipate continued weakness rather than a breakout.
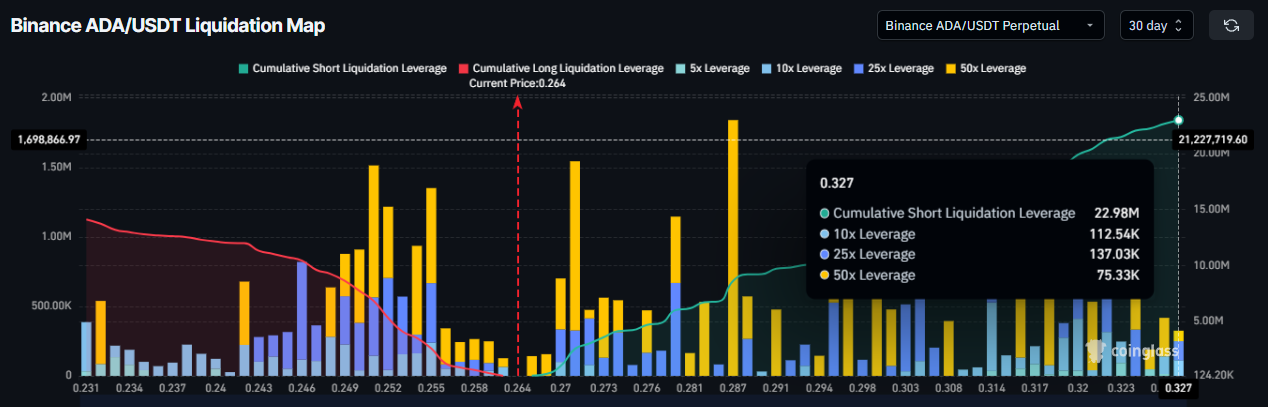
Sustained bearish positioning may amplify price swings. If ADA attempts a recovery, short liquidations could accelerate upside. Conversely, additional selling could reinforce negative momentum. For now, macro sentiment in futures markets remains defensive.
ADA LTHs Provide Relief
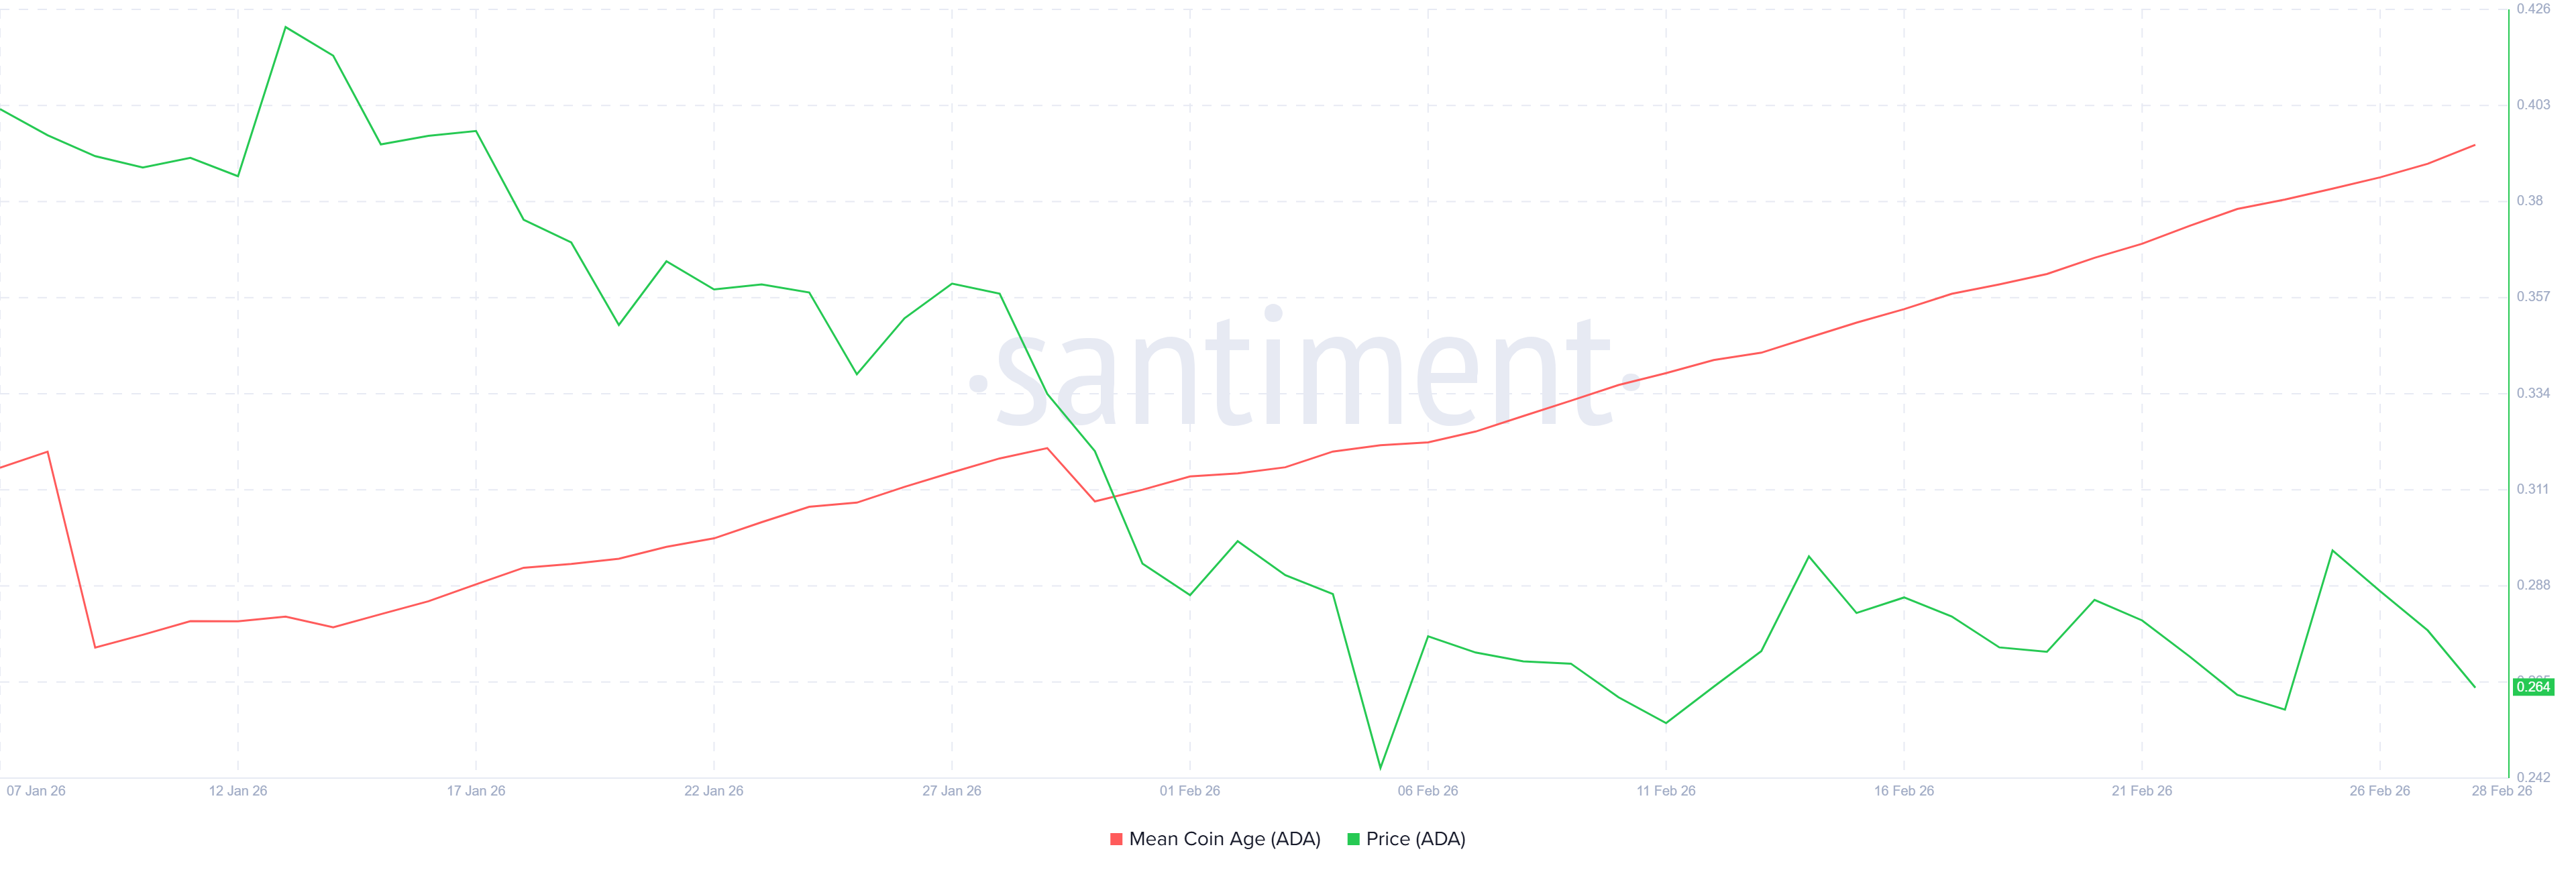
Long-term holders are currently offsetting part of the sell pressure. The Mean Coin Age metric is rising, indicating that older coins are remaining inactive. This trend suggests that LTHs are choosing to hold rather than distribute.
Resilience among long-term investors is crucial. Persistent holding behavior reduces circulating supply pressure. While it does not guarantee recovery, it helps ADA defend critical support levels during periods of uncertainty.
ADA Price Needs To Hold Above This Support
Cardano is trading at $0.264 at the time of writing, rangebound between $0.295 resistance and $0.256 support. The lower boundary aligns with the 13.6% Fibonacci retracement, often referred to as the bear market support floor. ADA has maintained this level for nearly three weeks.
Given current indicators, consolidation appears likely to continue. A successful defense of $0.256 could enable a rebound toward $0.278. Sustained buying may push ADA back to $0.295, testing upper range resistance once again.
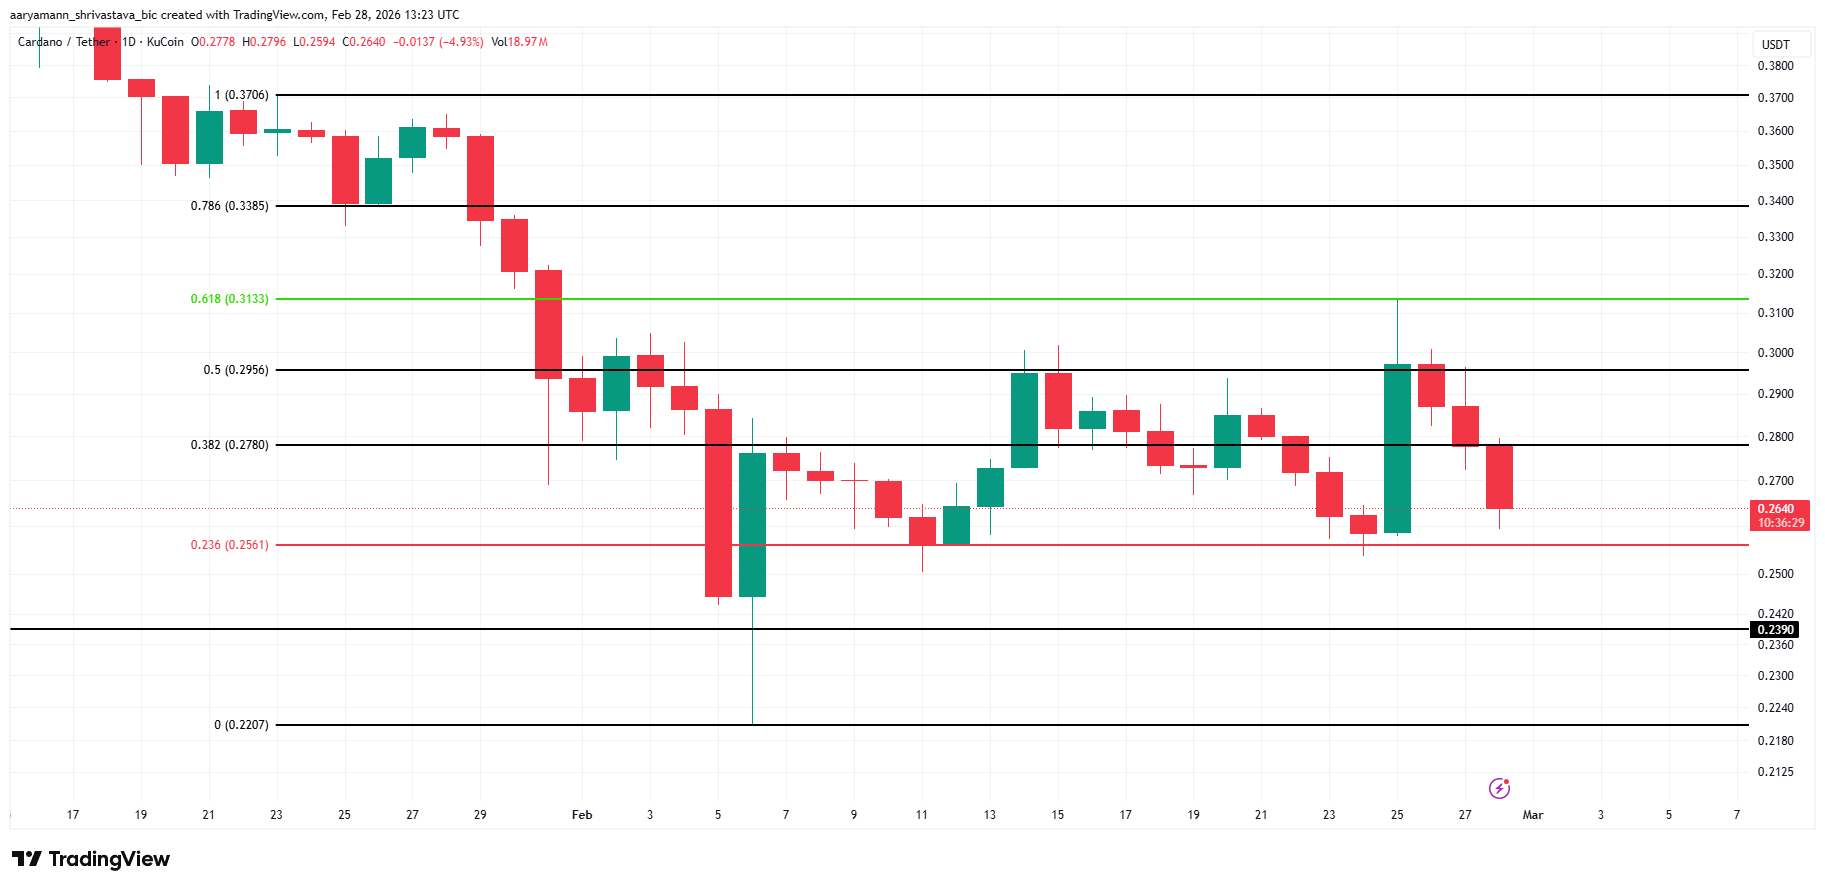
However, increased selling pressure would shift the outlook. A decisive breakdown below $0.256 would weaken structural support. In that scenario, Cardano price could decline toward $0.239, invalidating the short-term bullish thesis and reinforcing bearish control.

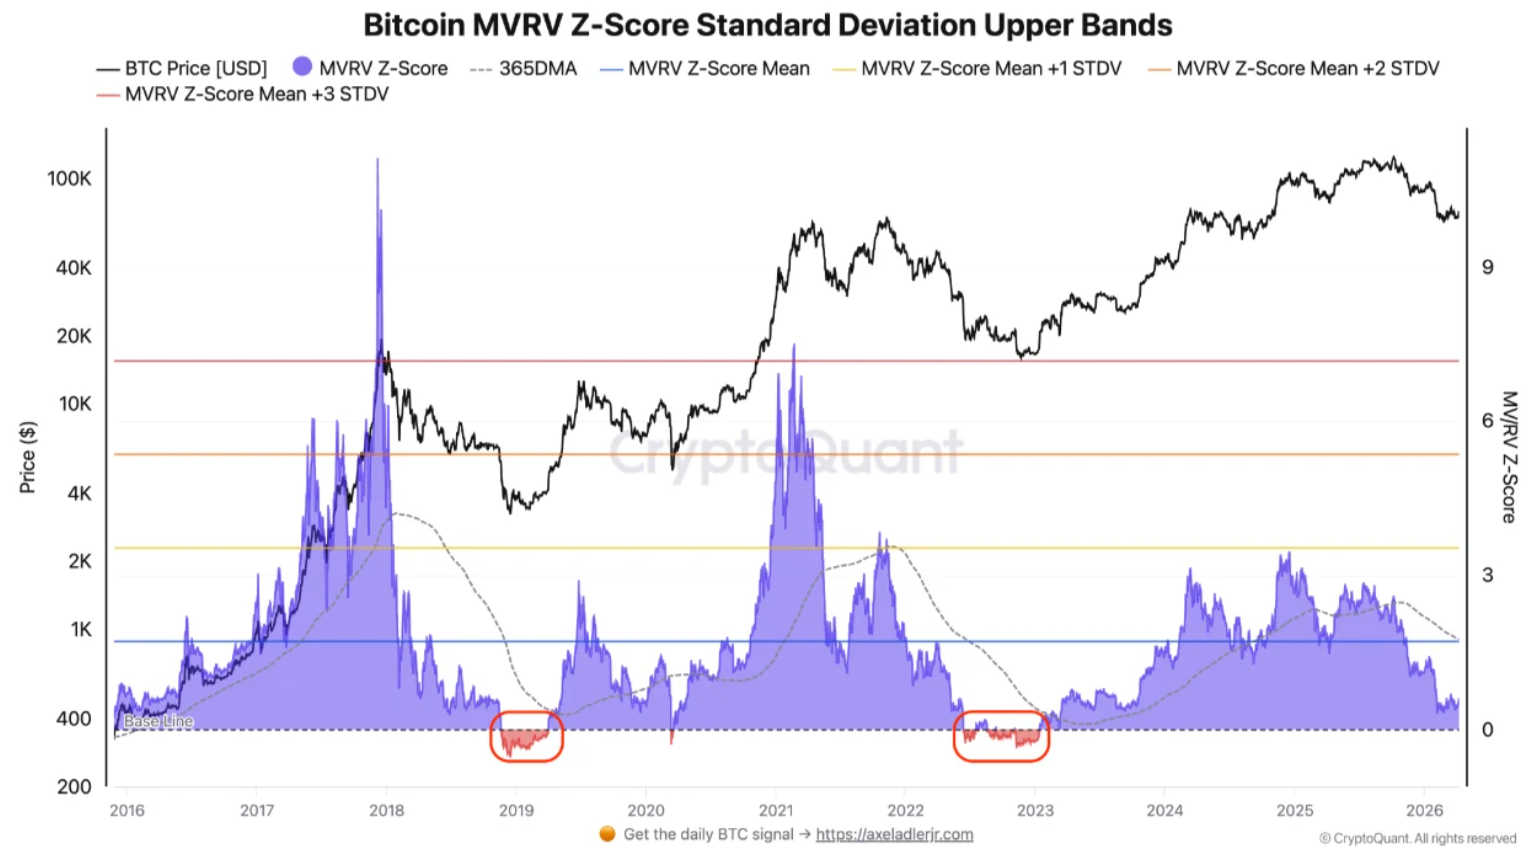
New BTC price analysis predicted that the bear market would bottom out later in the year, before beginning a “two-year accumulation phase.”
Bitcoin (BTC) should find a floor near $55,000 in the second half of 2026, a new prediction says.
Key points:
-
Bitcoin’s MVRV Z-score metric still needs to match old bear-market bottoms to signal trend change, says CryptoQuant.
-
That should result in a trip to $55,000 in late 2026 before a market rebound.
-
Going forward, the next cycle top is expected in the second half of 2029.
Bitcoin MVRV Z-score gives new $55,000 target
In one of its “Quicktake” blog posts on Friday, onchain analytics platform CryptoQuant set out the timeline for Bitcoin’s next “iron bottom.”
“Bear market bottoming is a marathon of exhaustion,” contributor Sunny Mom wrote.
“While data suggests we are halfway through, a final ‘wash-out’ is likely still ahead. As the saying goes: history may not repeat itself, but it often rhymes.”
CryptoQuant flagged three onchain indicators to support the theory that the next bear-market bottom is still ahead. Among them is the market value to realized value (MVRV) Z-score.
MVRV measures the price at which the BTC supply last moved, also known as its realized cap, versus the value of all BTC in existence (its market cap). The Z-score divides the resulting ratio by the standard deviation of market cap, giving clear “overvalued” and “undervalued” ranges for Bitcoin at a certain price point.
“This valuation metric is cooling but has yet to enter the negative/undervalued zone,” the analysis noted.
“Every ‘iron bottom’ in history has seen this score dip below zero; currently, the market is merely cooling, not despairing.”

The last time that the MVRV Z-score dipped below zero was during the bottoming phase of Bitcoin’s last bear market in 2022. Sunny Mom sees history “rhyming” between October and December this year.
“Target: $55K – $60K, coinciding with a sub-zero MVRV Z-Score,” they concluded.
Bottom to precede “two-year accumulation phase”
In January, Cointelegraph reported on two-year rolling Z-score values already undercutting old bear-market floors and other periods of intense market stress.
Related: Bitcoin RSI ‘nearly perfectly’ copying end of 2022 bear market: Analysis
At the time, crypto trader Michaël van de Poppe predicted that Bitcoin was “near the end” of its latest macro drawdown.
Meanwhile, Crypto Mom saw the second half of 2029 as a likely blow-off top for Bitcoin’s next bull run.
“Rationale: Following a late 2026 bottom, we expect a two-year accumulation phase,” they argued, without giving a price target.
“Combined with the April 2028 Halving, the market typically peaks 12–18 months post-halving, making late 2029 the likely window for the next parabolic bull run.”

This article is produced in accordance with Cointelegraph’s Editorial Policy and is intended for informational purposes only. It does not constitute investment advice or recommendations. All investments and trades carry risk; readers are encouraged to conduct independent research before making any decisions. Cointelegraph makes no guarantees regarding the accuracy or completeness of the information presented, including forward-looking statements, and will not be liable for any loss or damage arising from reliance on this content.

French officials are pushing for tighter oversight of crypto from two directions, as a Bank of France official called for stricter limits on non-euro stablecoins under the European Union’s Markets in Crypto-Assets Regulation (MiCA), and lawmakers in Paris advanced a separate reporting requirement for some self-custody holdings.
Denis Beau, First Deputy Governor of the Bank of France, delivered a speech at the EUROFI High Level Seminar in March, calling on the EU to restrict the use of stablecoins for payments, particularly those pegged to non-euro currencies.
Published on the Bank for International Settlements (BIS) website on Thursday, he said the Bank of France has been “pressing for a strengthening” of MiCA in this regard.
In a separate move, France’s National Assembly adopted on April 7 a provision in an anti-fraud bill that would require annual reporting of self-hosted crypto wallets above a 5,000 euro threshold, according to Gregory Raymond, founder of local outlet The Big Whale.
Taken together, the developments show French policymakers hardening their stance as Europe weighs how to contain the growing role of US dollar-linked stablecoins while tightening oversight of crypto assets held outside regulated platforms.
Bank of France presses for tougher MiCA limits
Addressing ways to respond to the global dominance of US dollar-pegged stablecoins, which account for 98% of the stablecoin market, Beau highlighted the role of supporting tokenized central bank money and private money, as well as stronger regulation.
While reporting progress on tokenization initiatives related to settlement infrastructure, such as Pontes and Appia, the official suggested that current regulatory measures might not be sufficient to address the issue.

“MiCA only partially addresses the risks posed by changes in the sector, particularly in the event of widespread adoption of stablecoins issued by non-European players,” Beau said.
Related: ECB paper questions if DeFi DAOs are decentralized enough to sit outside MiCA
In 2025, Bank of Italy Governor Fabio Panetta said MiCA had a limited impact on the adoption of compliant stablecoins in Europe, pointing to the digital euro as a key tool to address the issue.
France moves to require reporting self-custodial holdings
Separately, France’s National Assembly on April 7 adopted a provision in an anti-fraud bill that would require taxpayers to report certain self-hosted crypto holdings to the tax administration each year.
The measure would apply when the fair value of assets held in self-hosted wallets exceeds 5,000 euros, though the bill has not yet completed the legislative process.

Raymond said the proposal has faced opposition from lawmakers and parts of the government and tax administration, who raised concerns about enforcement limits and potential data security concerns.
The developments come as the community prepares to gather at Paris Blockchain Week next week, a major industry event hosted by Chain of Events. According to media reports, President Emmanuel Macron is expected to deliver a special address at the conference, which is scheduled for April 15-16 at the Carrousel du Louvre.
Magazine: How crypto laws changed in 2025 — and how they’ll change in 2026


The acting CDC director blocked the publication of CDC vaccine research showing COVID-19 vaccine benefits on April 10, citing methodology concerns that experts say reflect a research design used in vaccine effectiveness studies for decades.
Summary
- The acting CDC director blocked a research paper demonstrating COVID-19 vaccine benefits from being published.
- Experts say the study’s methodology is a long-established standard for measuring vaccine effectiveness.
- The move has drawn immediate backlash from the scientific and medical communities as the latest instance of administration interference with public health data.
A decision by the acting director of the Centers for Disease Control and Prevention to block a vaccine effectiveness study from publication has drawn sharp condemnation from researchers and public health experts on April 10. The intervention is being characterized as part of a broader pattern of the administration interfering with the release of government-funded scientific findings.
According to Democracy Now!, the acting CDC director blocked a study demonstrating the benefits of COVID-19 vaccines from publication, citing concerns about the research methodology. Experts responded immediately, noting the design used in the blocked study is the same approach that has been standard practice in vaccine research for decades.
Blocking the study removes from public record data developed using federal resources. Public health researchers described the intervention as highly irregular, noting that methodological disputes are normally addressed through peer review, not by preventing publication entirely.
The Scientific and Medical Backlash
Multiple researchers and public health officials said publicly on April 10 that suppressing vaccine effectiveness data poses direct risks to the clinical and policy decisions that rely on CDC-published evidence. Vaccine protocols at hospitals, clinics, and public health agencies are calibrated against published CDC data, and blocking a study denies practitioners access to evidence they would otherwise use.
The decision has drawn comparisons to other recent cases of the administration restricting data-related activities for political reasons. Anthropic sued the US government in March after alleging retaliation for refusing certain military uses of its technology, with the company arguing the government was using legal mechanisms to restrict information and capabilities that conflicted with its preferences.
A Pattern of Data Interference
Critics say the CDC decision is not an isolated event but part of a consistent approach by the administration to control what scientific information enters the public domain. The acting director offered no alternative process by which the blocked findings could be reviewed and eventually published.
As crypto.news reported, the administration has simultaneously been accelerating the deployment of AI tools across federal agencies, raising questions among civil liberties advocates about who decides what information government agencies produce, share, and suppress.


The Mahmoud Khalil deportation case moved one step closer to possible expulsion on April 10 after the Board of Immigration Appeals denied his latest challenge, rejecting arguments that would have had the proceedings dismissed entirely.
Summary
- The Board of Immigration Appeals denied Mahmoud Khalil’s latest attempt to have his deportation case dismissed.
- The ruling brings the Palestinian activist significantly closer to expulsion from the United States.
- Supporters have staged protests across major US cities as the case continues to divide opinion on free speech and immigration.
The legal battle to keep Palestinian activist Mahmoud Khalil in the United States suffered a significant setback on April 10. The ruling closes off one of his remaining legal pathways and hands the Trump administration a procedural victory in a case that has become one of the most closely watched free speech and immigration disputes in recent memory.
The Board of Immigration Appeals denied Khalil’s latest appeal, which had sought to dismiss the deportation proceedings against him entirely. According to NPR, the ruling leaves Khalil materially closer to expulsion, with his legal team expected to pursue further challenges through federal courts.
Khalil, a green card holder and Palestinian activist, was detained by immigration authorities earlier this year in a move widely characterized as part of the administration’s broader campaign against campus protest organizers. His supporters argue the case is a direct assault on constitutionally protected political speech.
Why This Case Has Drawn National Attention
The case has produced protests in several major US cities, with civil liberties groups arguing that his detention and the deportation proceedings represent an unprecedented use of immigration law to suppress lawful political dissent. Khalil’s attorneys contend the government is setting a dangerous precedent for how it can target non-citizens for protected speech.
The Treasury Department has separately expanded sanctions against Gaza-based financial networks this year, reflecting a broader pattern of the administration using legal mechanisms aggressively in matters connected to Palestinian advocacy.
What Comes Next
Khalil’s legal team is expected to seek relief in federal court. The administration has signaled it intends to move forward with removal proceedings as quickly as legally permitted.
The case echoes concerns raised by Anthropic, which sued the US government in March after alleging retaliation for refusing to allow certain military uses of its technology. Legal observers note that both cases center on the same question: how broadly federal agencies can use existing legal authority against individuals and entities whose positions conflict with administration policy.
Bitcoin (BTC) extended its bullish run into the Wall Street open on Friday, rallying above $73,000. Traders now eye a move back toward $80,000 by the end of April, as several indicators point to bulls retaking control of the crypto market.
Bitcoin breaks a bearish chart pattern
On Tuesday, Bitcoin invalidated what initially appeared to be a bear pennant on the daily chart.
Related: Old Bitcoin whales sold $271M in BTC: Is crypto rally at stake?
The BTC/USD pair pierced through the pennant’s upper trend line at $70,000, jumping as much as 7% to a six-week high of $73,300 on Friday. Its breakout came alongside a rise in trading volume, implying stronger conviction behind the rally.

The price also reclaimed key support lines, including the 200-week exponential moving average (EMA, blue line), the 20-day EMA (red wave), and the 50-day EMA (orange wave) at $68,350, $69,520, and $70,580, respectively.
That simultaneously increased the odds of a symmetrical-triangle bullish reversal.
A symmetrical triangle forms when price makes lower highs and higher lows, compressing into a tightening range. It resolves when the price breaks either of the trendlines and moves by as much as the pattern’s maximum height.

In Bitcoin’s case, the measured move above the upper trend line points to $87,000, about 20% above the current price.
The bullish divergence from the relative strength index (RSI) suggests that the bullish momentum has been steadily building up over the last two months, reinforcing BTC’s upside potential.
Bitcoin’s next hurdle is the 100-day EMA (blue) near $75,400.
As Cointelegraph reported, a rejection there would weaken the breakout and raise the odds of a pullback.
Onchain data caps Bitcoin’s upside at $80,000
Data from TradingView shows that Bitcoin has spent more than six weeks consolidating within a $60,000–$70,000 range, with multiple failed attempts to sustain a strong footing above $72,000.
Glassnode’s risk indicator reveals a major resistance between the true market mean at $78,000 and the short-term holder cost basis level around $80,000.
“This is a particularly meaningful threshold,” Glassnode said in its latest Week Onchain newsletter, adding:
“Any rally into this zone is likely to encounter meaningful distribution pressure from recent buyers seeking to exit at or near breakeven.”

The chart above reinforces the view that any recovery attempt could be halted near the true market mean and the STH realized price, as seen in 2023.
Glassnode’s Entity-Adjusted UTXO Realized Price Distribution (URPD), which shows at which prices the current set of BTC UTXOs was created, also revealed that BTC price has entered a relatively open zone between $72,000 and $82,000, where there’s less resistance.
This means BTC may move more freely in the short term within this range, if the momentum holds, with the upside possibly capped at $82,000-$85,000. This is where investors acquired more than 1.3 million BTC.

Meanwhile, BTC’s cost-basis distribution heatmap shows a pronounced accumulation between $78,000 and $84,000, suggesting a potential short-term pathway toward this level.
Polymarket odds for $80,000 BTC in April rise
Polymarket, a crypto-based prediction market where users trade contracts on real-world outcomes, is showing a clear bullish shift for Bitcoin in April.
Traders now assign 26% chances that BTC/USD reaches $80,000 in April, a 5% increase over the last 24 hours. The $75,000 target carries even stronger convictions at 76%.

At the same time, the odds of the BTC price reaching $65,000 in April are priced lower than before, suggesting the crowd is trimming its downside expectations.
This article is produced in accordance with Cointelegraph’s Editorial Policy and is intended for informational purposes only. It does not constitute investment advice or recommendations. All investments and trades carry risk; readers are encouraged to conduct independent research before making any decisions. Cointelegraph makes no guarantees regarding the accuracy or completeness of the information presented, including forward-looking statements, and will not be liable for any loss or damage arising from reliance on this content.
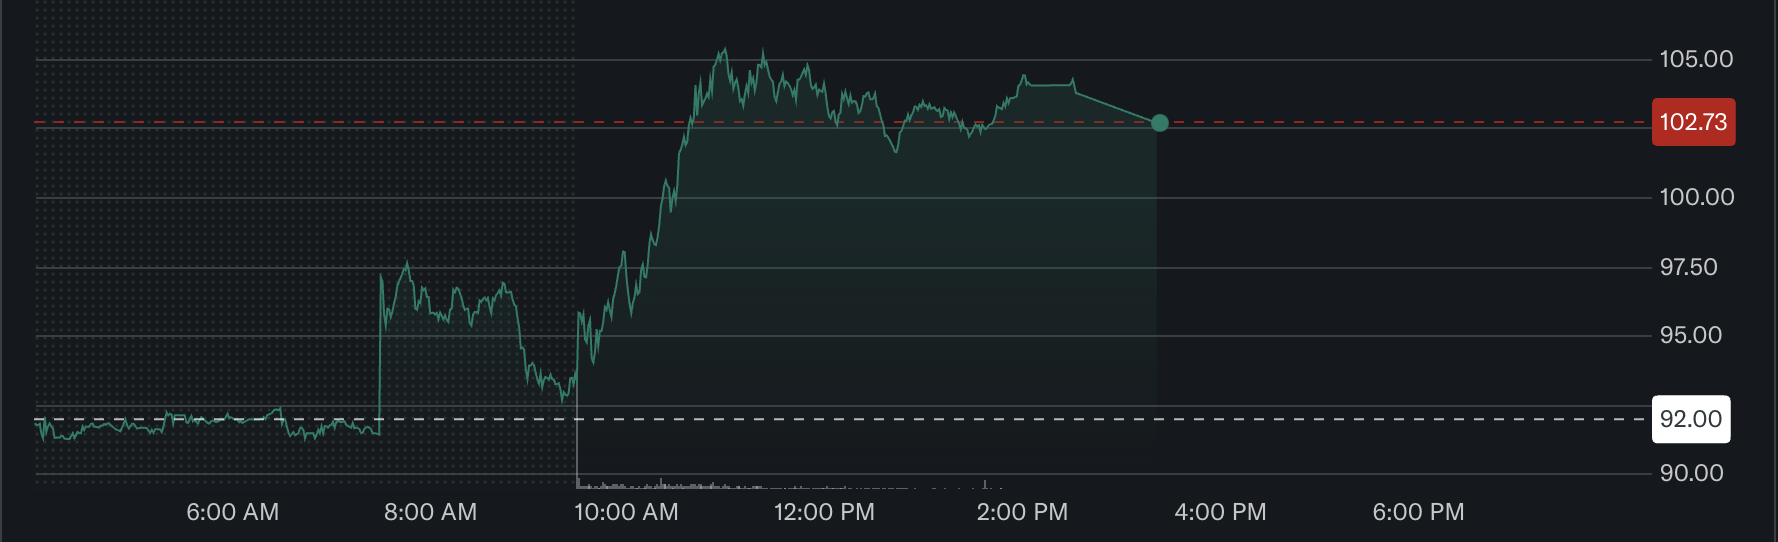
CoreWeave, a publicly traded AI cloud infrastructure company, announced on Friday a “multi-year” agreement with AI developer Anthropic, which will use CoreWeave’s cloud computing data centers for its Claude AI model workloads.
The agreement will be rolled out in phases, with the “potential to expand over time,” according to CoreWeave’s announcement.
Shares of CoreWeave surged more than 12% on Friday and are trading at $102.73 at the time of writing.

The agreement follows CoreWeave’s recent $8.5 billion capital raise, led by tech giant Meta Platforms.
The financing was collateralized against CoreWeave’s deployed computing capacity, which is tied to predictable cash flows, rather than its graphics processing unit hardware, marking a notable departure from traditional crypto mining financing structures.
CoreWeave pivoted away from crypto mining and rebranded as an AI infrastructure company in 2019, as the mining sector faced prolonged economic pressure following the 2018 crypto market downturn.
Related: Core Scientific secures up to $1B credit from Morgan Stanley for data centers
AI continues to draw miners away as economic headwinds hamper the crypto industry
Bitcoin (BTC) miners are struggling with rising energy costs, reduced rewards and declining crypto asset prices, leading many to repurpose their mining hardware for AI processing.
Up to 20% of Bitcoin miners are unprofitable in the current economic environment, according to asset manager CoinShares’ latest mining report.

Crypto miners must generate yield on their assets by deploying their crypto on decentralized finance (DeFi) platforms to shore up declining revenues, according to market maker Wintermute.
The mining industry’s economic challenges worsened after the October 2025 market crash, which took BTC down from a high of about $126,000 to the low $60,000 range. Prices have since stabilized around $73,000.
The high costs of mining and shrinking profit margins threaten the viability of Bitcoin mining, with AI workloads becoming much more attractive in this environment, according to market analyst Ran Neuner.
“Both industries compete for the same thing: electricity, and right now, AI is willing to pay much more for it,” he said.
Magazine: AI has dramatically accelerated the quantum threat to Bitcoin: AI Eye


Melania Trump Epstein ties were denied directly by the First Lady on April 10 in an unexpected public appearance at the White House, where she rejected claims of any past connection to Jeffrey Epstein and described the circulating reports as lies.
Summary
- Melania Trump made a surprise White House appearance specifically to deny any past connection to Jeffrey Epstein.
- Advisers described the statement as a direct response to what they called lies being spread about the First Lady.
- The White House declined to comment on the timing of the appearance.
Melania Trump made an unusual public statement on April 10, stepping forward specifically to address and deny claims of a past connection to Jeffrey Epstein. The move was deliberate, according to her advisers, who said it was intended to shut down coverage rather than let it build through continued silence.
Melania Trump appeared at the White House specifically to reject any past ties to Jeffrey Epstein, calling the circulating claims lies. According to the Washington Post, the White House declined to comment on the timing of the statement, a notable silence given that public discussion of Epstein tends to renew pressure around sealed documents and their political implications.
As crypto.news reported, the Epstein files already functioned as a market variable in 2025, with Musk’s escalating public accusations against Trump over the documents coinciding with unexplained crypto selling pressure and broader market uncertainty.
The Epstein Files and Their Broader Shadow
The Epstein case has continued to generate disclosures with financial and political dimensions. As crypto.news noted, Department of Justice files released earlier this year revealed that Epstein once claimed direct contact with Bitcoin’s founders and maintained deep ties to early cryptocurrency discussions dating back to at least 2013.
Those documents showed correspondence between Epstein and prominent figures in technology and finance, adding a digital asset dimension to what was already one of the most politically charged document releases in recent memory.
What Happens Next
Melania Trump’s decision to address the matter personally signals that her team believes the claims require direct rebuttal rather than press office silence. Journalists and lawmakers continue to press for the full release of sealed Epstein documents, meaning any White House statement on the matter tends to generate more questions than it closes.

The 10-day lunar flyby mission is expected to end in a splashdown landing in the Pacific Ocean on Friday evening.
Users on the prediction markets platform Kalshi are using the platform’s event contracts to bet on the aftermath of the Artemis II mission, NASA’s first manned spacecraft to the Moon in more than 50 years.
As of Friday, several event contracts related to a Moon landing were available on the Kalshi and Polymarket platforms, but many users were taking positions on what would be said at NASA’s news conference following the splashdown.
With just over $4,000 in volume on the event contracts, Kalshi users anticipate that NASA officials will mention the words “president” or “prime minister,” “radiation,” and “damage” in connection with the Moon mission.

The Orion spacecraft from the Artemis II mission is expected to return to Earth at about 12:07 am UTC on Saturday, having launched from Florida on April 1 and completed a flyby of the Moon with a crew of four people. The NASA mission followed its Artemis I in 2022, which orbited the Moon with an unmanned vessel, and preceded its plans to land on the lunar surface in 2028.
Using positions in event contracts on prediction markets has drawn controversy because platforms like Polymarket allow users to bet on the outcomes of events related to the US-Israeli war against Iran. Some of the bets, which some lawmakers have described as suspicious due to their timing, have prompted calls for legislation to address potential insider trading on prediction markets.
Related: MoonPay releases open-source wallet standard for AI agents
Kalshi offered an event contract for a manned Moon landing by NASA, with a 63% chance before 2030 and a 41% chance before 2029.
Company plans to mine Bitcoin from Earth orbit
In March, an Nvidia-backed orbital data center company called Starcloud announced plans to mine Bitcoin (BTC) from space following the launch of a spacecraft into Earth orbit. Its CEO, Philip Johnston, said in an interview that the plans would utilize solar panels and application-specific integrated circuit (ASIC) miners in its orbital data centers.
Magazine: Should users be allowed to bet on war and death in prediction


Institutions are accelerating their adoption of crypto, with major players steadily entering the market and expanding their exposure to digital assets. But while participation is rising, the way these institutions engage with the ecosystem has fundamentally changed.
The old model, where funds parked large amounts of capital directly on crypto exchanges, is being replaced. In its place is a new architecture where trading and custody are no longer intertwined.
“Counterparty risk awareness in crypto comes in cycles, and the recent major cyber-attack has triggered one of the largest waves of exchange derisking since FTX. It is yet another reminder that separating crypto custody from exchange trading is essential for security,” says Dominic Lohberger, Sygnum Chief Product Officer.
How FTX Broke Institutional Trust in Exchange Custody
Before 2022, the dominant strategy was simple. Deposit funds onto an exchange, execute trades, and leave capital there for convenience and speed. Exchanges acted as both trading venues and custodians. That model worked, until it didn’t.
The collapse of FTX exposed a critical flaw. Investors were taking on massive, often invisible counterparty risk. FTX operated as an exchange, custodian, lender, and clearinghouse all in one
What had been considered operational efficiency was suddenly recognized as a structural vulnerability. Customer assets were not held in verifiable, on-chain, segregated accounts. When the firm filed for bankruptcy, clients discovered their funds had been diverted to Alameda.
The damage extended well beyond FTX’s direct users. Galois Capital, a former registered investment adviser, shut down after half its assets were stuck on FTX when the exchange collapsed.
In September 2024, the SEC fined Galois $225,000 for failing “to comply with requirements related to the safeguarding of client assets.”
The Celsius bankruptcy added another layer of alarm. A US bankruptcy court ruled that customer deposits into Celsius Earn Accounts became the property of the debtors’ estate, not the depositors.
Investors who believed they were holding assets learned they were, in legal terms, unsecured creditors.
Research from Coalition Greenwich found that institutional-grade cold storage and exchange wallets were equally popular before the FTX collapse. That changed overnight.
The industry mantra “not your keys, not your coins” evolved from a philosophical stance into a compliance requirement.
What Off-Exchange Settlement Actually Looks Like
The traditional crypto trading model required institutions to deposit funds into an exchange before placing a trade. The exchange held both the assets and the execution function, thereby concentrating risk in a single entity.
Off-exchange settlement, or OES, flips this model. This new class of infrastructure is designed specifically to isolate risk. Assets remain with a third-party custodian or in a self-custodied wallet.
Instead of holding assets on exchanges, institutions now store them with third-party custodians. These custodians, often regulated entities or specialized infrastructure providers, secure funds in segregated wallets.
Trading still happens on exchanges, but with a key difference. Exchanges are granted limited access to a trading balance or credit line, typically backed by assets held in custody.
The exchange can execute trades, but it cannot unilaterally move or withdraw the underlying funds. Settlement happens separately, often on a net basis after trades are completed.
Subscribe to our YouTube channel to watch leaders and journalists provide expert insights
The Rise of Risk Isolation Models
In traditional finance, this separation between custody and execution has existed for decades. Crypto lacked this structure until several companies, including Fireblocks and Copper, built it.
The former launched Fireblocks Off Exchange in November 2023. Off-Exchange offers Collateral Vault Accounts (CVAs).
These are on-chain wallets secured by Multi-Party Computation (MPC) cryptography. When an institution deposits assets into a CVA, the connected exchange receives a trading credit.
Copper’s ClearLoop is an off-exchange settlement solution in which assets remain in Copper’s MPC (Multi-Party Computation) custody. Trades settle on Copper’s own infrastructure.
Both systems have gained significant traction. Deribit became the first exchange to fully integrate Fireblocks OES in February 2024. HTX followed in April 2025.
“Since the launch, HTX has onboarded numerous institutional clients and recorded a 200% increase in trading volume, validating market demand for secure off-exchange settlement models,” the press release read.
Copper’s ClearLoop now connects several live exchanges, including Coinbase, OKX, Bybit, Deribit, Bitget, and more, facilitating over $50 billion in monthly notional trading volume. The Bybit hack of 2025 further demonstrated the advantages of off-exchange settlement.
How Bitcoin ETFs Made the Separation Permanent
The approval of spot Bitcoin (BTC) ETFs in January 2024 did more than open a new investment vehicle. It hardwired the custody-execution separation into the most visible crypto product on Wall Street.
For instance, like many other ETFs, BlackRock’s iShares Bitcoin Trust ETF (IBIT) uses Coinbase Custody Trust Company, LLC. The structure is built so that Bitcoin sits in cold storage vaults, entirely separate from any trading venue.
Creation and redemption of ETF shares follow an operational process in which assets move between the vault and trading balances within defined settlement windows. The exchange where IBIT trades on the secondary market never touches the underlying Bitcoin.
This is not an optional design choice. It is how ETFs work by definition. The custodian holds the asset. The authorized participant handles creation and redemption. The exchange handles price discovery. Three roles, three entities, no overlap.
Off-Exchange Trend Rises, but Coinbase Holds the Crown
While the shift away from exchange custody is real, the data suggest a more nuanced transition rather than a full-scale replacement.
Despite the rise of off-exchange models, Coinbase remains the dominant force in institutional crypto custody. The firm currently holds custody for over 80% of global crypto ETF assets.
It also serves as custodian for eight of the top 10 publicly traded companies with Bitcoin (BTC) on their balance sheets.
This dominance is further reinforced by regulatory momentum. In April 2026, the Office of the Comptroller of the Currency granted Coinbase conditional approval to charter Coinbase National Trust Company, a move that would allow it to operate as a federally regulated crypto custodian upon full approval.
Follow us on X to get the latest news as it happens
The significance of this shift is twofold. First, it strengthens Coinbase’s position as a qualified custodian, a key requirement for institutional investors such as asset managers, pension funds, and ETF issuers.
Second, it signals that while institutions are reducing exposure to exchange risk, they are not abandoning centralized players altogether.
Instead, capital is consolidating around a smaller group of regulated, systemically important custodians. This creates a hybrid market structure:
- Off-exchange infrastructure reduces direct counterparty risk
- Regulated exchanges and custodians continue to anchor institutional trust
- Market power concentrates in platforms that can offer both compliance and scale
In effect, the post-FTX evolution isn’t about eliminating intermediaries. It’s about redefining which intermediary institutions are willing to trust.
What Would Happen If an FTX-Scale Collapse Occurred Today
Amid growing attention toward off-exchange models, a natural question emerges: would an FTX-style failure still have the same impact on institutional capital?
Under the old model, an exchange collapse froze all deposited assets. Institutions became unsecured creditors in a years-long bankruptcy proceeding.
Under the current OES infrastructure, the outcome would differ substantially. If an exchange using Fireblocks OES collapsed, the institution’s assets would remain in its CVA. The principal never entered the exchange’s balance sheet.
Fireblocks’ disaster recovery mechanism, powered by Coincover, also enables institutions to ensure operational security by eliminating single points of failure. The only exposure would be unsettled profit-and-loss from recent trades.
With ClearLoop, the English Law Trust would shield client assets from both exchange and Copper insolvency. Again, an institution’s loss would be limited to any unsettled trading obligations, not the total portfolio.
At FTX, institutions lost their entire deposited balance. Under OES, the same scenario would expose them to days of unsettled P&L at most. That is the difference the new plumbing makes.
That distinction highlights the real impact of crypto’s changing infrastructure. The industry hasn’t eliminated risk, but it has significantly reduced the scope of catastrophic loss tied to exchange failure.
Market Scale and What Comes Next
The institutional crypto custody market hit approximately $3.2 billion in 2024. It is projected to reach $27.8 billion by 2033 at a 26.7% compound annual growth rate.
That growth reflects more than just new capital entering the market. It reflects a structural rebuild of how that capital is held, moved, and settled.
The next phase of that rebuild is already taking shape around tokenized collateral. Rather than locking up idle stablecoins or Bitcoin as margin on an exchange, institutions are beginning to use tokenized money market funds and yield-bearing stablecoins as on-exchange.
“Institutions aren’t chasing speculation; they’re chasing capital efficiency. Off-exchange settlement delivers that by putting custody and control back where they belong. As tokenised collateral and regulated venues converge, OES will become the default workflow for serious institutional participation,” Wing Cheah, Product Manager, Interchange, said.
Traditional banks are also entering the picture. In 2025, BBVA partnered with Binance to offer regulated off-exchange custody services to Binance’s institutional clients.
Nomura’s digital assets arm, Laser Digital, applied for an OCC license to open a national trust bank focused on crypto custody, spot trading, and staking for clients.
These moves signal that the custody function is migrating from crypto-native firms into the broader financial system. Taken together, these developments point in a consistent direction.
The custody function is quietly migrating away from exchanges. Liquidity and price discovery remain on the trading venue, but the assets themselves increasingly do not.
What started as a post-FTX demand from a handful of institutional players is gradually becoming the default wiring of the market. The separation is not yet complete, but the direction has not reversed either.
The post Since FTX, Institutions No Longer Want to Keep Crypto on Exchanges appeared first on BeInCrypto.


A federal judge has blocked the state of Arizona from bringing criminal charges against prediction market provider Kalshi, at least temporarily, in response to a motion from the Commodity Futures Trading Commission.
District Judge Michael Liburdi, in the District of Arizona, ruled Friday that Arizona cannot hold an arraignment of Kalshi as scheduled on Monday, April 13. Arizona announced last month it would file 20 criminal charges against Kalshi for offering what the state claimed were betting products in violation of Arizona law.
“Defendants are temporarily restrained and enjoined from enforcing AZ’s gambling laws in any criminal or civil enforcement actions to any contracts listed on CFTC-regulated [designated contract markets],” the judge ruled in the temporary restraining order, according to Paradigm senior regulatory counsel Stefan Schropp.
In a statement Friday, CFTC Chair Michael Selig said the regulator “appreciated” the judge’s decision.
“Arizona’s decision to weaponize state criminal law against companies that comply with federal law sets a dangerous precedent, and the court’s order today sends a clear message that intimidation is not an acceptable tactic to circumvent federal law,” he said.
The CFTC sued Arizona and two other states arguing that prediction markets, otherwise known as event contracts, are swaps subject to the federal agency’s supervision, and that its role preempts state law.
It’s a view that’s seen largely mixed results in court; state courts have often sided with states, such as when a Nevada state court ruled that the Gaming Control Board could temporarily block Kalshi while a broader case moves forward.
Federal courts have had different results; the Third Circuit Court of Appeals ruled earlier this week that prediction markets are subject to CFTC rule, and it was up to the CFTC’s discretion on if it wanted to block providers from offering sports-related products or not.
The Ninth Circuit Court of Appeals declined to weigh in on the aforementioned Nevada action, allowing that state court to block Kalshi, but it will hold a hearing on a consolidated case next week allowing various providers and other parties to argue.
Judge Liburdi of Arizona granted the CFTC’s motion to block the Arizona state action against Kalshi two days after denying Kalshi’s own motion for a preliminary injunction against the state.
London v Mayo Preview, Team News, Betting and Prediction

Chimpanzees In Uganda Locked In Vicious ‘Civil War’, Say Researchers

Arsenal FC vs Bournemouth: Prediction, kick-off time, TV, live stream, team news, h2h results, odds


![[KLPGA 2026] iM Financial Group Open 2026 / Round 1 (ENG Commentary)](https://wordupnews.com/wp-content/uploads/2026/04/1775865806_maxresdefault-80x80.jpg)


-

 Business5 days ago
Three Gulf funds agree to back Paramount’s $81 billion takeover of Warner, WSJ reports
-

 Sports6 days ago
India men’s 4x400m and mixed 4x100m relay teams register big progress | Other Sports News
-

 Politics6 hours ago
US brings back mandatory military draft registration
-

 Fashion7 hours ago
Weekend Open Thread: Veronica Beard
-

 Business7 days ago
Expert Picks for Every Need
-

 Tech3 days ago
How Long Can You Drive With Expired Registration? What Florida Law Says
-

 Business6 days ago
No Jackpot Winner, Prize to Climb to $231 Million
-

 Fashion5 days ago
Massimo Dutti Offers Inspiration for Your Summer Mood Board
-
 Sports7 hours ago
Man United discover Nico Schlotterbeck transfer fee as defender reaches Dortmund agreement
-

 Fashion3 days ago
Let’s Discuss: DEI in 2026
-

 Crypto World2 days ago
Bitcoin recovers as US and Iran Agree a Ceasefire Deal
-

 Business6 days ago
Akebia Therapeutics, Inc. (AKBA) Discusses Pipeline Progress and Strategic Focus on Kidney Disease Treatments at R&D Day – Slideshow
-

 Business4 hours ago
Tesla Model Y Tops China Auto Sales in March 2026 With 39,827 Registrations, Beating Cheaper EVs and Gas Cars
-

 Crypto World2 days ago
Canary Capital Files SEC Registration for PEPE ETF
-

 Politics7 days ago
The UK should not pay a penny in slavery reparations
-

 Business13 hours ago
OpenAI Halts Stargate UK Data Centre Project Over Energy Costs and Copyright Row
-

 Tech5 days ago
Samsung just gave up on its own Messages app
-

 Tech5 days ago
Italian court says Netflix must refund customers up to $576 over price hikes
-

 Tech5 days ago
Haier is betting big that your next TV purchase will be one of these
-

 Tech5 days ago
The Xiaomi 17 Ultra has some impressive add-ons that make snapping photos really fun
You must be logged in to post a comment Login