
Crypto World
Chainlink price retests August 2024 support at $9.65
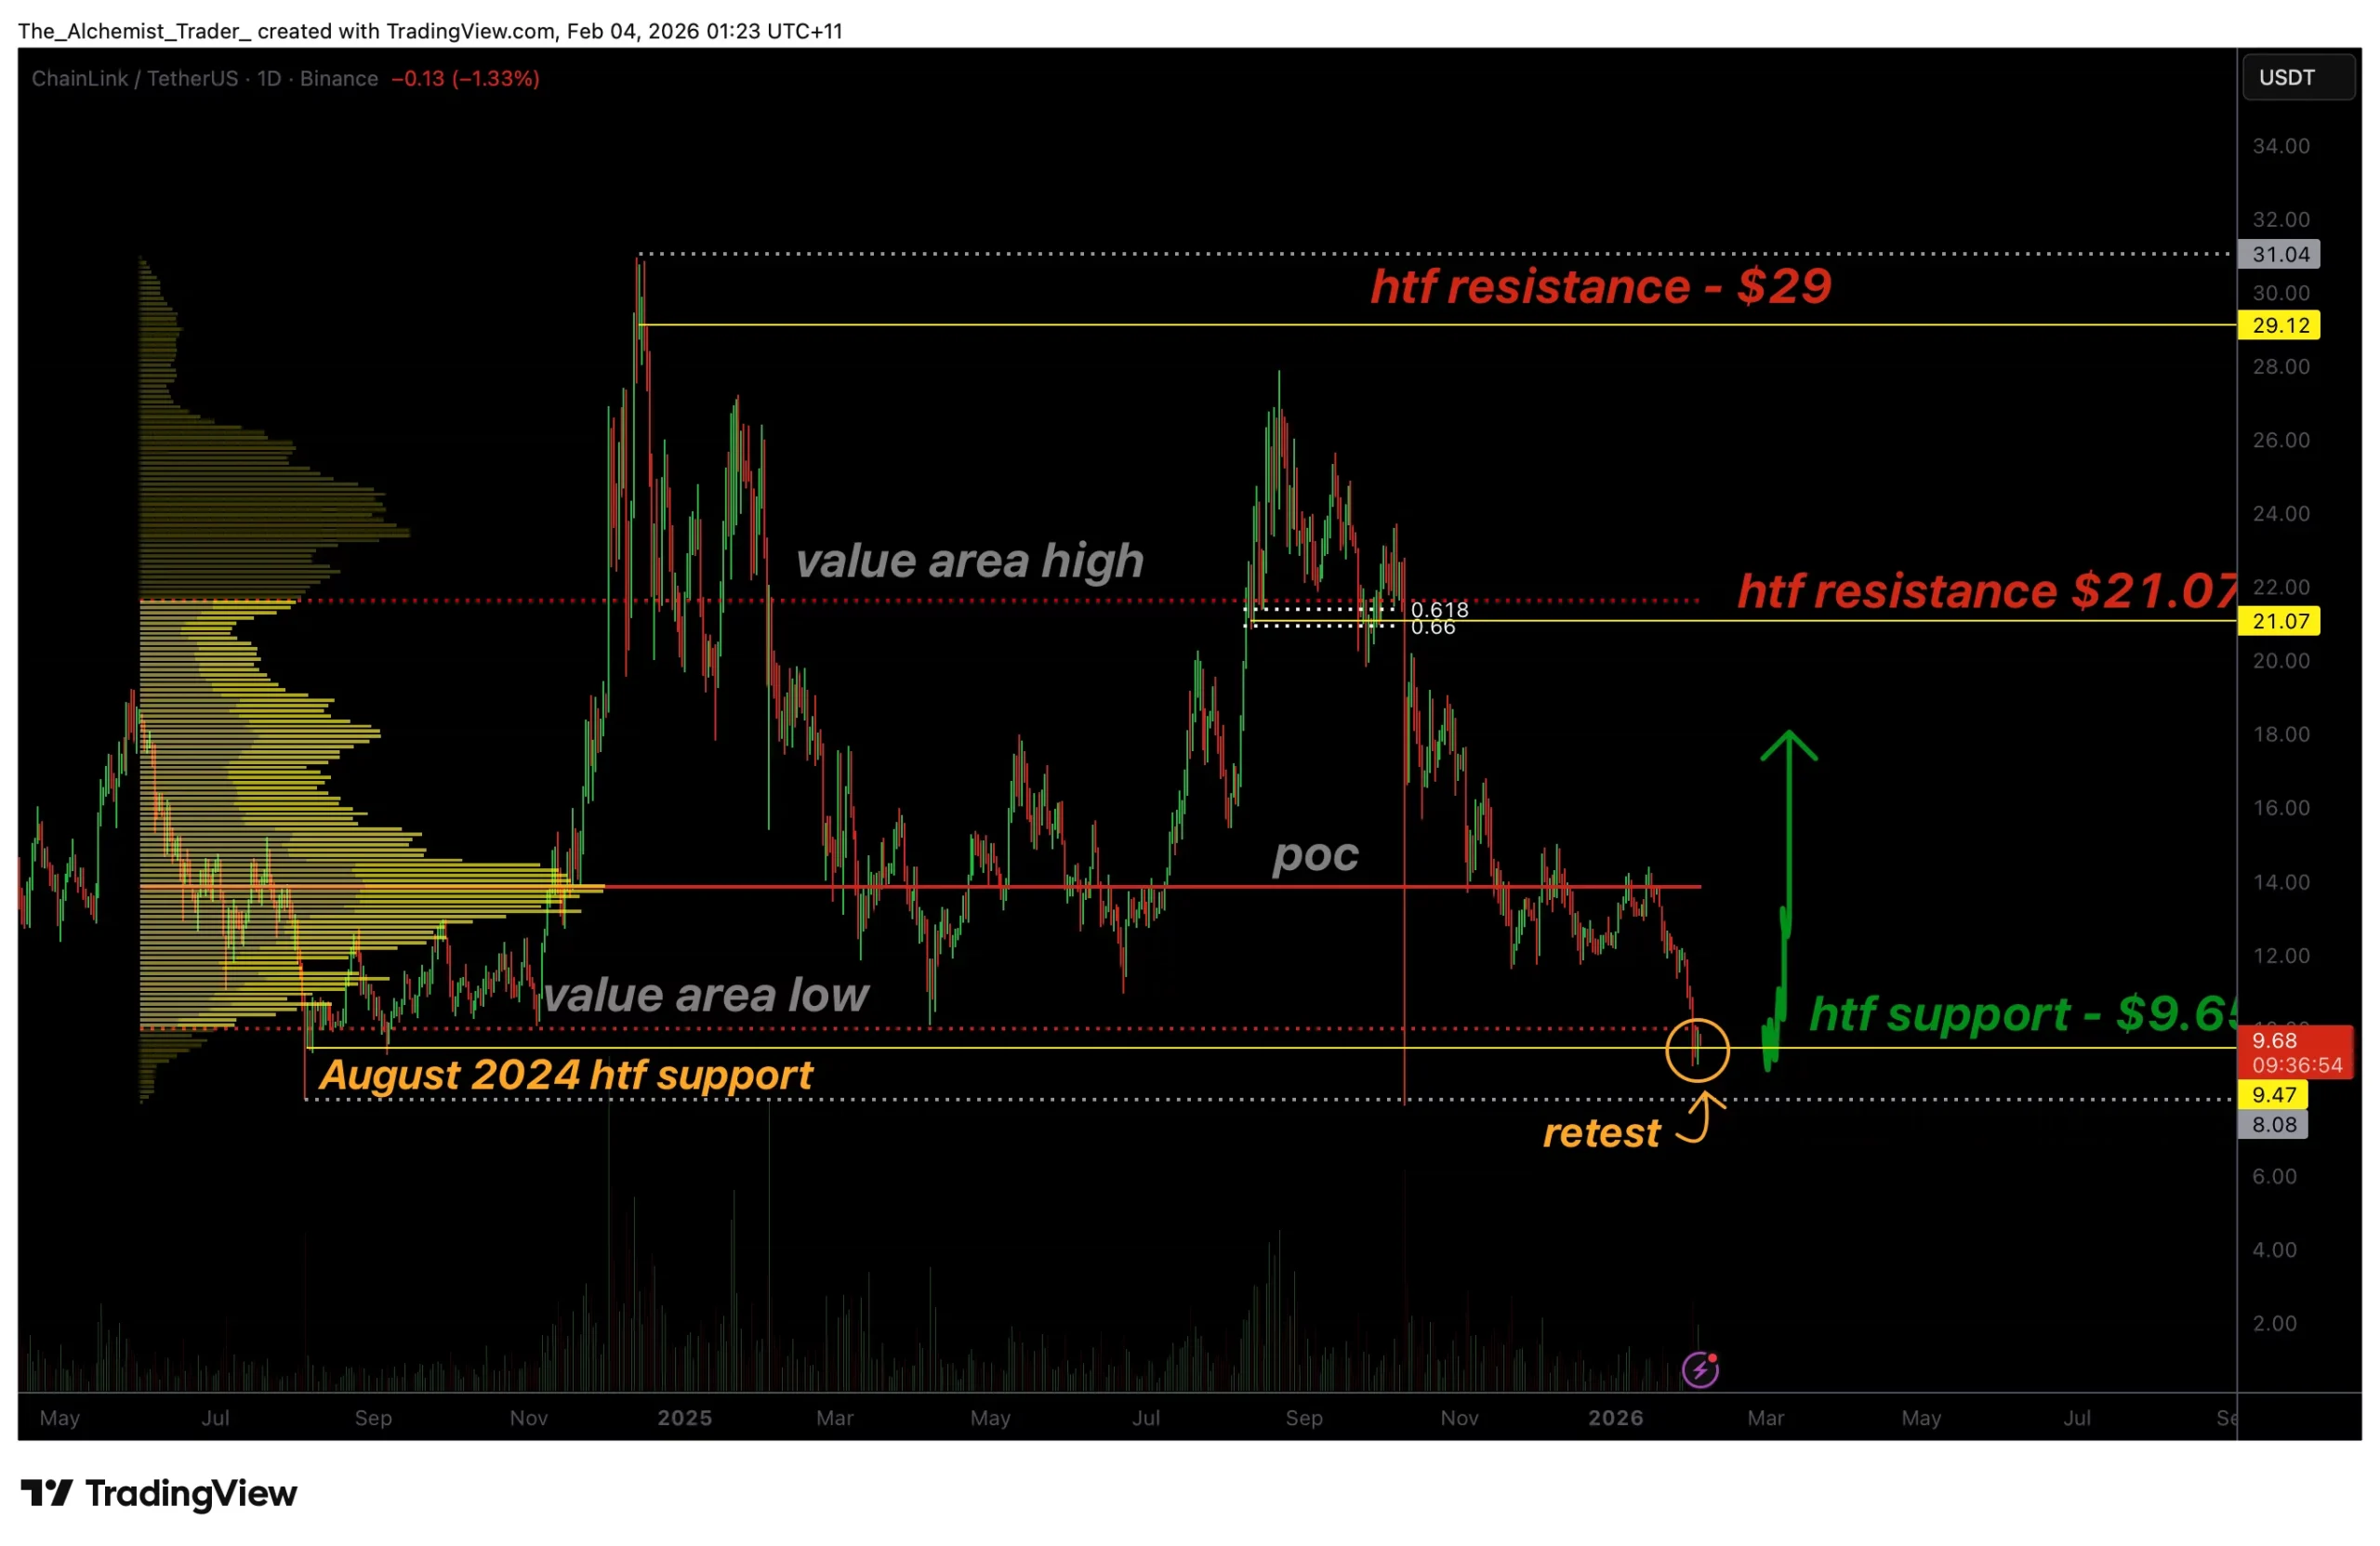
Chainlink price has accelerated into a major historical support zone at $9.65 after losing key value levels, placing the market at a critical inflection point where a relief bounce may develop if demand returns.
Summary
- LINK accelerated lower after losing value area high near $21
- Price is retesting strong August 2024 and multi-year support at $9.65
- Bullish volume could fuel a relief rally toward the POC and $21 resistance
Chainlink (LINK) price action has entered a decisive technical zone after an aggressive corrective move to the downside. Following the loss of key volume-based support earlier in the cycle, LINK has rapidly rotated lower and is now retesting a historically significant support level that last held firm in August 2024.
This region around $9.65 represents not only a higher-timeframe demand zone, but also an area where price has repeatedly triggered bullish reactions in the past.
Chainlink price key technical points
- Impulsive sell-off after losing value area high: The breakdown below $21 accelerated downside momentum.
- $9.65 marks multi-year and August 2024 support: Strong historical demand exists at this level.
- Bullish volume needed for confirmation: Any relief rally depends on renewed buyer participation.

The current corrective phase on LINK began once the price lost acceptance below the value area high, which was situated near the $21 region.
This level previously served as a balance point between buyers and sellers, and its failure signaled a shift in control toward sellers.
Once value was lost, price transitioned from a balanced auction environment into a trending corrective move, resulting in accelerated selling pressure.
As is typical in such scenarios, LINK did not spend much time consolidating below the value area high. Instead, price moved swiftly through lower liquidity zones, targeting the next major area of historical interest.
This behavior reflects a lack of meaningful demand between $21 and the current support, reinforcing the importance of the $9.65 region as a potential stopping point for the decline.
Why the $9.65 level matters
The $9.65 level stands out as a critical support zone for several reasons. First, it represents a higher-timeframe support that has been defended multiple times over the past market cycles. Each prior interaction with this region has led to a bullish response, ranging from short-term relief rallies to more sustained upside rotations.
Second, the value area low is in close confluence with this level, increasing its technical relevance. When price reaches the value area low after an impulsive move, it often signals that the market has explored the lower boundary of fair value. At this stage, two outcomes are typically observed: either strong demand enters the market, leading to mean reversion, or price fails to attract buyers and continues into deeper discount zones.
Finally, the $9.65 area carries psychological importance as a long-standing reference point for market participants. Levels with this degree of historical interaction tend to attract attention from longer-term buyers, increasing the probability of at least a temporary reaction.
Upside targets a relief rally scenario
Should LINK successfully hold above $9.65 and attract sustained buying interest, the next upside targets are clearly defined. The first area of interest sits near the point of control (POC), where the highest volume has previously traded.
A move back toward the POC would represent a classic mean reversion following an impulsive sell-off.
Beyond that, the $21.07 resistance level stands out as a major higher-timeframe objective. This zone aligns closely with the previously lost value area high and would likely act as a significant test for any recovery attempt.
While a move from $9.65 to $21 would still be considered corrective within the broader structure, it would represent a substantial relief rally and a meaningful reset in market conditions.
What to expect in the coming price action
From a technical, price-action, and market-structure perspective, LINK is currently at a major decision point.
The $9.65 support level has strong historical significance and has previously produced bullish reactions, giving the market a credible foundation for a relief bounce.
If bullish volume begins to flow and price consolidates above this support, a rotation toward the POC and potentially the $21.07 resistance becomes increasingly likely.
Conversely, failure to attract demand would weaken the bullish case and expose LINK to further downside risk.
For now, all eyes remain on how price behaves at this long-term support, as the next sessions are likely to determine whether LINK stages a relief rally or continues its broader corrective trend.


The average Web3 VC pitch sounds like ours did three years ago. “We have deep relationships across the ecosystem.” “We add value beyond capital.” “Our network is our edge.” It’s not that any of these statements is a lie; it’s that everyone says them, which makes them effectively meaningless.
Liquidity providers (LPs) have heard this pitch so many times that the words have lost all shape. And yet somehow, the industry just keeps photocopying the same deck. Impressive logo slide. Vague thesis. Three bullet points about “value add.” A track record that, for most emerging managers, doesn’t yet exist. Repeat until funded, or not.
My colleagues and I at TBV spent a lot of time asking ourselves what we actually had that no one else did. The answer, eventually, was humbling: not much. So we built something different.
Here’s the thing that the data keeps trying to tell the industry and the industry keeps ignoring: emerging managers actually outperform. Studies consistently show they reach top-quartile performance more often than established funds and deliver materially higher returns on average. The upside is real. The problem is entirely structural — emerging managers can’t communicate a clear reason to clients to back them over others, so capital flows to brands rather than potential.
When we built TBV, we decided the pitch had to be a product, not a promise. The question we kept returning to was: what does a fund actually own? Not who it knows. Connections are not defensible. What has it built, what data has it generated, and what platform value does it create for founders? That’s defensible.
The answer we landed on was events. We weren’t looking for just a networking play or branding exercise. We wanted to develop a people-centric deal engine. Web3 runs on conferences. Everyone already knows this. Founders travel thousands of miles to shake hands at side events. VCs pay enormous sponsorship fees for access to people they could probably have reached by email. The ROI calculus has always been fuzzy at best. What we wanted to do was flip the model: instead of paying for access, build the environment. Own the data. Create the relationships at scale and feed them directly back into sourcing, diligence and value for everyone involved.
In 2025, our event series drew over 43,000 attendees and more than 100 partners. That didn’t happen by accident, and it wasn’t just a marketing stunt. It was deliberate infrastructure. Every interaction, every connection, every emerging trend spotted in those rooms feeds into TBX, our AI-driven deal engine. The events and the fund are the same flywheel.
“We’re not the only ones rethinking this. What’s interesting is how different the approaches are and how few of them look anything like a traditional fund.”
Another VC firm, Outlier Ventures, figured this out from a different angle. They leaned into the accelerator model — building a genuine platform of support around early-stage founders rather than just writing checks and showing up for board meetings. The result is a fund with over 300 portfolio companies and a real reason for founders to choose them over others with just more AUM. Paradigm went in a completely different direction: they got technical. They don’t just invest in protocols; they contribute to them. That kind of depth is genuinely hard to replicate, and LPs can see it.
What these models share, and what the next generation of interesting managers will share, is that the fund itself is a product with utility beyond capital. The question isn’t “how do we tell a better story?” It’s “how do we build something that makes the story self-evident?”
The good news is there isn’t just one answer. The events model works for us. The accelerator model works for Outlier. Deep technical contribution works for Paradigm. What doesn’t work, what has never really worked, and what LPs are increasingly unwilling to pretend works, is a pitch built entirely on relationships you can’t show and value you can’t measure.
Web3 moves fast enough that the managers who build real infrastructure now will be very hard to displace later. The ones still writing decks about their networks in three years will find the room has quietly emptied out around them. I’m genuinely curious to see what other models emerge. Competition in this space, when it’s actually focused on doing something different, is the best thing that could happen to it.

TLDR:
- Heavily shorted US stocks surged 13%, outperforming the S&P 500 by nine percentage points
- Short sellers covered $93 billion in positions, marking one of the fastest unwinds in years
- Unprofitable tech stocks rallied strongly, with gains reaching up to 14% during the week
- Institutional buying and algorithmic funds added momentum to an already accelerating market rally
A rapid unwind of short positions has driven a sharp rally across US equities this week. Heavily shorted stocks surged well above broader indices, as large-scale covering activity and renewed institutional flows accelerated upward market momentum.
Short Covering Drives Sharp Market Rally
Market data shows that short sellers exited positions at the fastest pace seen in recent years. The move triggered strong upward pressure, especially in heavily shorted stocks. These names outperformed the broader market by a wide margin.
A tweet from Global Markets Investor detailed the scale of the move, citing data from Goldman Sachs. It reported that the most-shorted US stocks gained 13% during the week. This performance exceeded the S&P 500 by nine percentage points.
At the same time, short sellers covered about $93 billion in positions across US equities. Data from S3 Partners shows this activity occurred within the same month. This level of covering indicates strong pressure on bearish positions.
As short sellers closed positions, buying demand increased sharply. This forced prices higher, creating a feedback loop across multiple sectors. The process pushed already rising stocks even further.
The trend also extended beyond heavily shorted names. A basket of unprofitable technology stocks recorded strong gains during the same period. These stocks often react quickly to shifts in market positioning.
Data referenced from UBS shows that financially weak stocks rose by about nine percent. At the same time, broader unprofitable tech names advanced by roughly fourteen percent.
Institutional Flows and Momentum Amplify Gains
The rally did not occur in isolation, as broader market factors also supported price action. Institutional investors and algorithmic funds contributed to the upward movement. These participants had previously reduced equity exposure to lower levels.
As market conditions shifted, these groups began increasing their positions again. This added fresh demand on top of short-covering activity. Together, both forces accelerated the rally across equities.
Algorithmic strategies likely responded to price trends and volatility signals. As momentum built, these systems increased buying activity. This behavior reinforced the upward direction of the market.
At the same time, institutional purchases provided additional support. Large investors often move capital in response to changing macro and market signals. Their re-entry added stability to the ongoing rally.
However, the pace of the move suggests it may not continue at the same speed. Rapid short squeezes tend to occur over short periods. Once positions are covered, buying pressure can begin to slow.
Even so, the recent activity reflects how positioning can influence market direction. When large short positions unwind quickly, price movements can accelerate across sectors. This dynamic remains a key feature of modern equity markets.

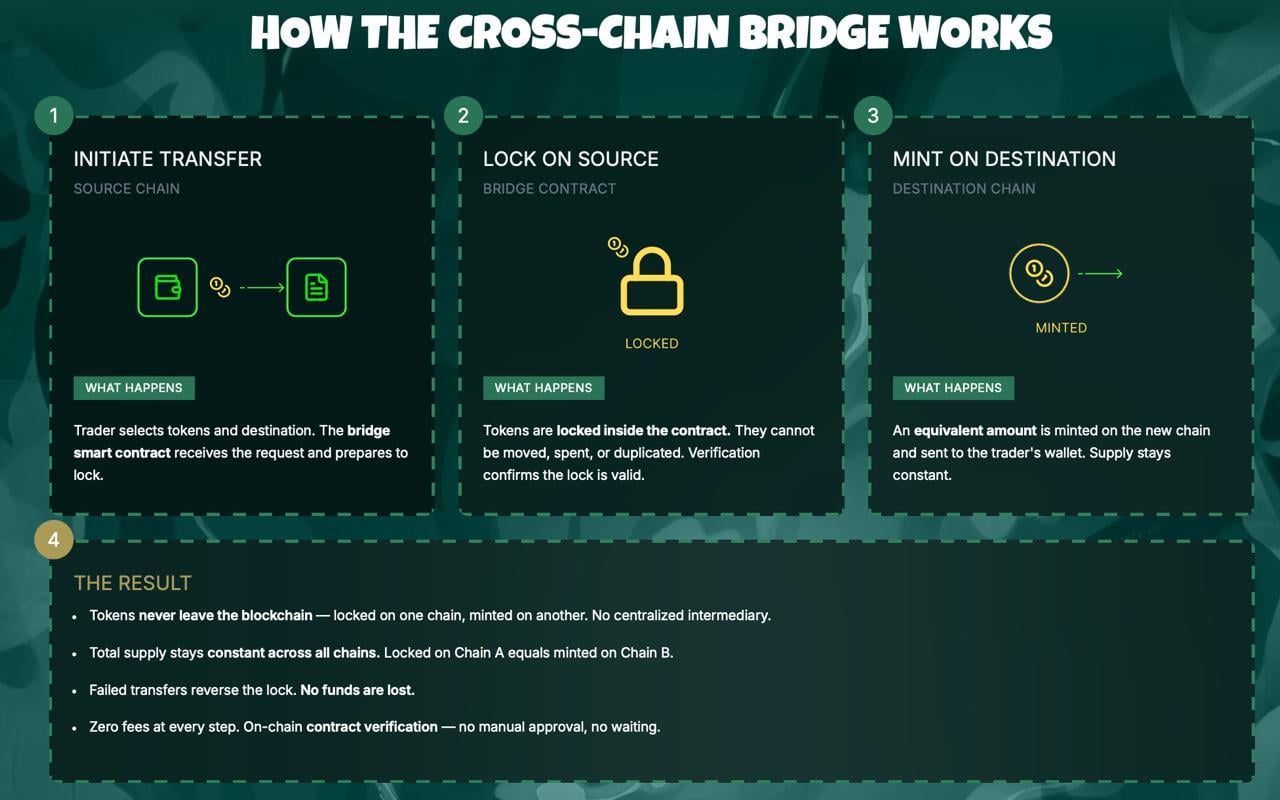
The big Ethereum price news this week is Schwab opening spot ETH trading for retail clients, putting ETH directly inside one of the largest traditional brokerage platforms in the United States, per Blockonomi. The launch dropped on April 17 while the token pushed past $2,308, up 1% on the session and up over 4.15% on the week after Ethereum ETFs pulled in $127.4 million of net inflows in a single trading day.
While Ethereum keeps adding institutional wins, the presale entry at Pepeto is the position that turns into the return everyone talks about when this cycle gets written into the record books. The round keeps filling fast, more than $9.23 million has flowed in, and every signal points to why below.
Schwab activated spot ETH trading for retail clients on April 17, widening brokerage access to Ethereum beyond institutional ETF channels for the first time, per Blockonomi. The move follows a six-day ETF inflow streak that pulled nearly $300 million into U.S. Ethereum funds.
Ethereum ETFs posted $127.4 million in net inflows on April 17 alone, led by Fidelity’s FETH at $84.1 million and BlackRock’s ETHA at $30.8 million, per Blockchain.News. This Ethereum price news matters because Schwab puts ETH inside tens of millions of new retail accounts while ETF demand confirms the setup from above. Two fresh buyer channels in one week usually marks the start of a longer run.
Strongest Entries Drawing April Capital as Ethereum Catalysts Build
Pepeto: The Round That Fills While Others Wait for Proof
Pepeto comes out of the team behind one of the biggest Pepe chapters in crypto, paired with a build lead who spent years inside Binance designing exchange rails for millions of daily traders. Every contract passed a full SolidProof review before public capital moved in, and that team is why over $9.23 million flowed in across one of the tighter quarters the market has seen.
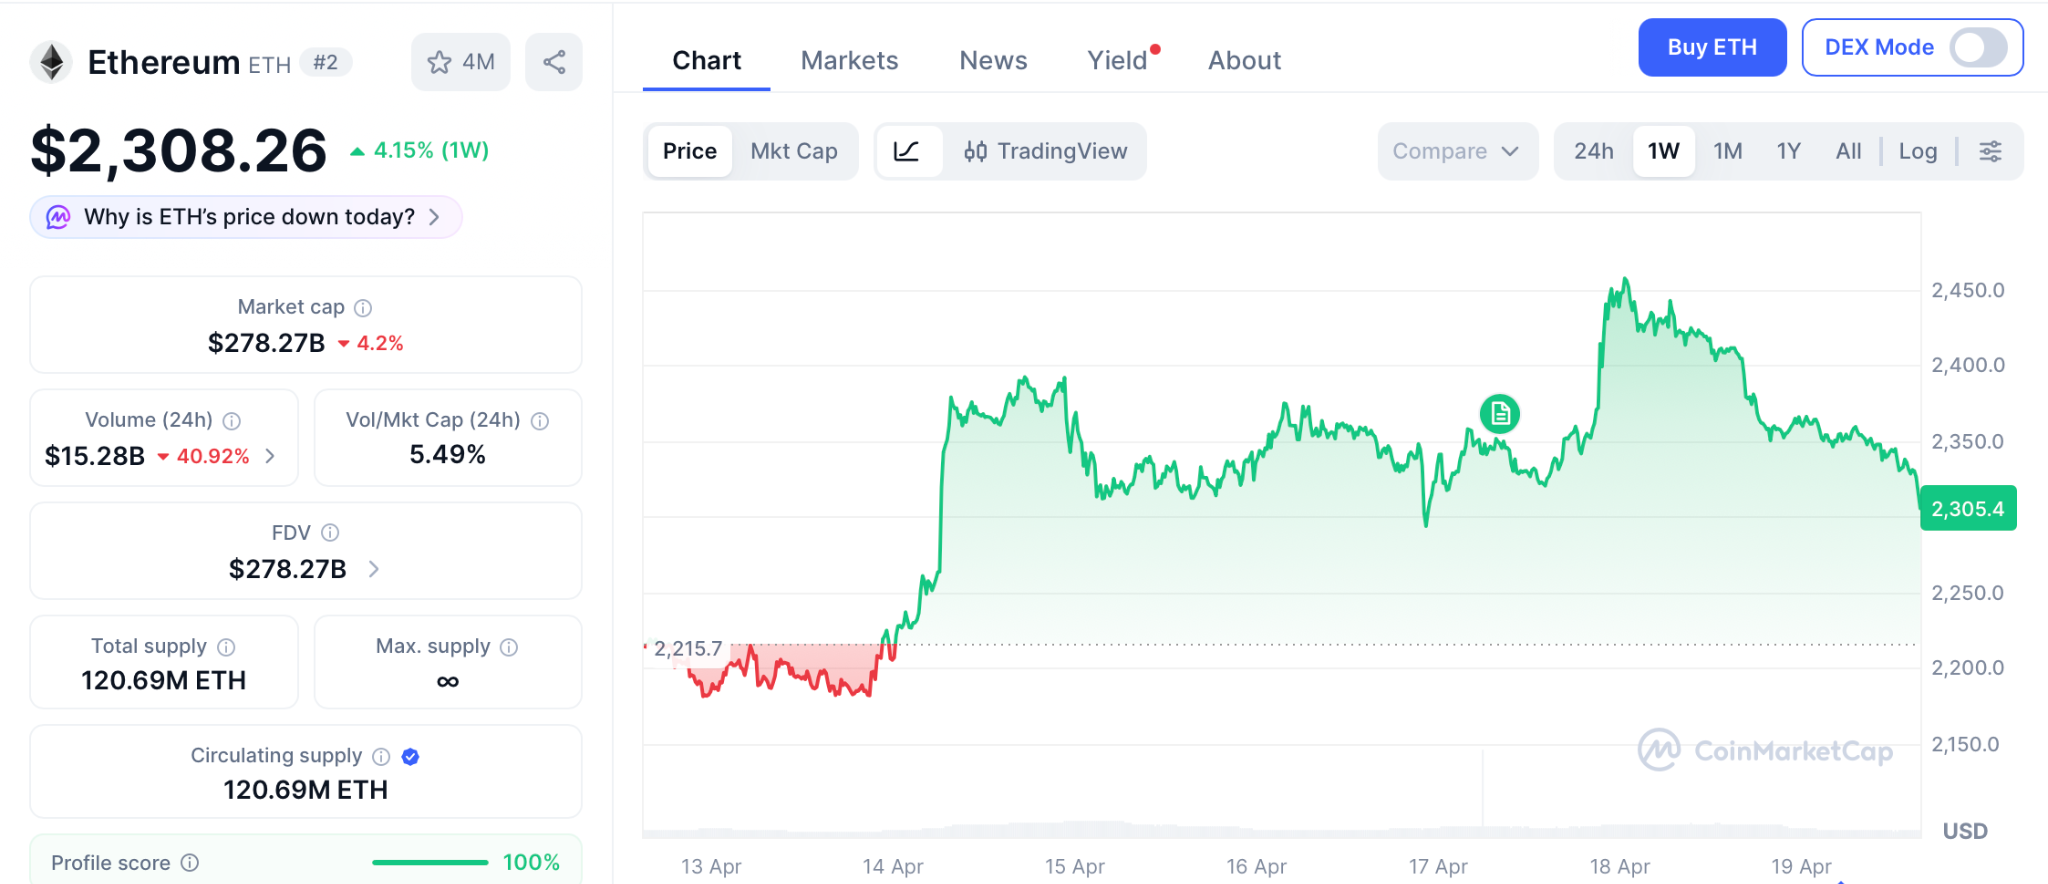
PepetoSwap ties Ethereum, BNB Chain, and Solana into one zero-fee bridge so assets move between networks at no cost. A live AI contract checker scans anything a wallet is about to touch and flags risk before capital moves. Both tools run on the Pepeto token at the protocol layer, so each swap pulls direct demand the same way every base-fee block on Ethereum burns ETH and cuts supply.
The previous round closed ahead of schedule, and this one runs at the same pace. Wallets entering at $0.0000001865 lock the floor before the Binance listing sets a higher one, and staking at 181% APY adds tokens to every position that holds through launch.
Buyers loading this round understand entering now puts them on the side that collects the gains instead of watching them play out on a chart. Every fresh Ethereum price news update pulls more attention into crypto, and that attention finds presale entries where entry-to-listing math still makes sense. Entering Pepeto at this price and staking through the listing is how presale math turns into real returns.
Ethereum (ETH) Price News: $2,308 With $2,600 Target as ETF Streak Extends
Ethereum (ETH) trades at $2,308 on April 17 per CoinMarketCap, up 1% on the day and up 4.15% on the week after six straight days of spot ETF inflows. The 50-day SMA is closing in on a bullish cross with the 100-day, MACD lines have turned up, and analysts target $2,600 next if the $2,400 breakout confirms, with $2,200 as the downside pivot.
Whale accumulation is steady, Schwab widens the buyer base, and ETF flows are clean positive. A move from $2,308 into $2,600 prints roughly 9%, and that gap versus a presale entry at a fraction of a cent is why capital keeps rotating into earlier tokens every time fresh Ethereum price news hits.
Conclusion:
Schwab just opened spot ETH trading for retail, ETFs pulled $127 million in a single day, and Ethereum price news in April 2026 carries more weight than any month this year. Yet the token still sits at $2,308, because even the strongest headlines need time to work their way into the chart.
The wallets buying Pepeto at presale pricing picked the entry that still has real distance left to run, and 181% APY staking keeps compounding quietly while the listing draws closer every day. This round is filling right now, and the second it closes the floor jumps higher for good. Locking in the presale price today is exactly how wallets end up holding the kind of returns everyone else spends the next year wishing they had grabbed.
Click To Visit Pepeto Website To Enter The Presale

FAQs
What is the latest Ethereum price news for April 2026?
Schwab launched spot Ethereum (ETH) trading for retail clients on April 17, and U.S. spot Ethereum ETFs pulled $127.4 million in net inflows the same day, extending a six-day streak that lifted ETH above $2,308.
Is Pepeto worth buying before the Binance listing?
Pepeto offers presale entry at $0.0000001865 with $9.23 million raised and 181% APY staking compounding daily before the confirmed Binance listing, giving buyers 100x potential from the current floor.
Disclaimer: This is a Press Release provided by a third party who is responsible for the content. Please conduct your own research before taking any action based on the content.
TLDR:
- Total 3 has recovered approximately $90B since February despite tight liquidity and geopolitical pressure.
- The share of Binance altcoins below the weekly 50 MA dropped from 89% in February to 67% recently.
- Since October 2025, Total 3 lost nearly $460B, representing around 38% of its total market value.
- With 49 million cryptocurrencies now in existence, asset selection has become far more complex for investors.
The altcoin market has regained approximately $90 billion since February, offering early signs of recovery. This comes after a prolonged correction that began following the October 2025 market peak.
Total 3, the metric tracking altcoin market capitalization excluding Bitcoin, Ethereum, and stablecoins, remains well below prior highs.
Meanwhile, a key technical indicator on Binance shows measurable improvement in market breadth across the altcoin sector.
Total 3 Claws Back Ground After a $460B Decline
Since the October 2025 top, the altcoin sector has endured a sharp and sustained downturn. Total 3 shed close to $460 billion in value over that stretch, representing roughly 38% of its market cap. That kind of drawdown reflects broad-based selling pressure rather than isolated weakness in a few assets.
However, conditions began shifting in February. Despite a challenging geopolitical climate and restricted liquidity, Total 3 has recovered around $90 billion from its lows. The recovery is measured, but it points to a gradual return of buying interest across smaller digital assets.
One useful way to track this shift is through the percentage of altcoins on Binance trading below their weekly 50-period moving average.
This moving average is a widely followed level in technical analysis. Traders often use it to gauge whether a market is in a healthy or weakened state.
As noted by analyst Darkfost, that figure peaked at 89% of Binance-listed altcoins trading below this level in early February.
It has since dropped to 67%, suggesting that more coins are beginning to stabilize or recover toward this technical threshold.
Caution Remains Despite the Improving Numbers
While the data points in a more positive direction, the broader environment still calls for careful positioning. Liquidity conditions remain tight, and macroeconomic factors have not meaningfully eased. Those constraints limit how far and how fast capital can rotate back into higher-risk assets like altcoins.
Asset selection has also grown considerably harder. The total number of cryptocurrencies now stands at around 49 million. Of those, approximately 19 million are on Base, more than 22 million on Solana, and 4.78 million on BNB Smart Chain.
That level of supply fragmentation makes it far more difficult to identify assets with genuine momentum. With so many tokens competing for attention and capital, investors face a much more complex filtering process than in prior cycles.
The weekly 50 moving average still acts as resistance for a large share of altcoins. Until more assets reclaim that level, the recovery remains in its early stages.
Sustained improvement will require both broader participation and a more accommodating liquidity environment to take hold.
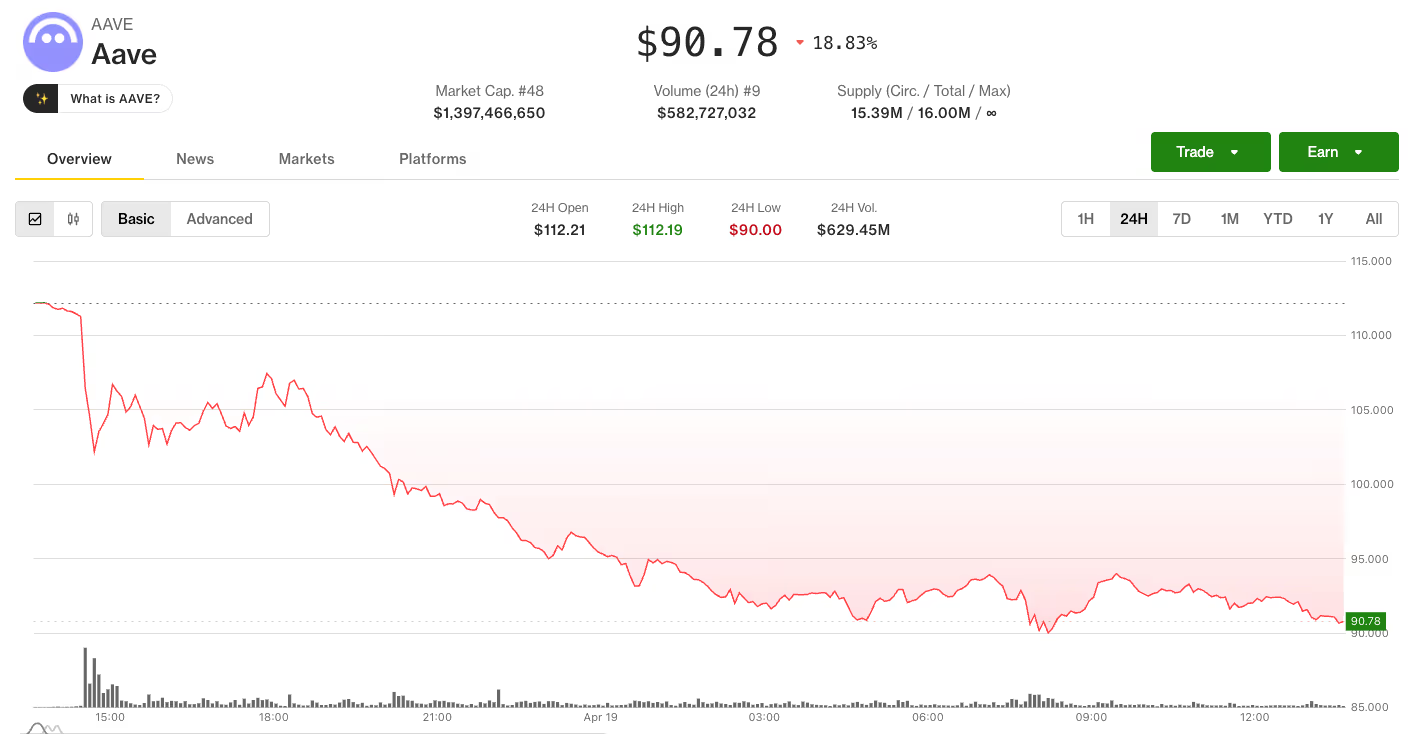
The $292 million exploit of Kelp DAO has set off a wave of reactions across the crypto industry, with developers and traders warning that the incident exposed deeper flaws in how decentralized finance (DeFi) is built.
Data shared by market participants shows the immediate fallout spread far beyond the hacked protocol.
“The rsETH hack is leading to withdrawals across all lending protocols, even on solana and unaffected protocols,” 0xngmi said in one post on Sunday, pointing to steep outflows including “Aave: -6,200m (-23%) net inflows” and smaller but notable declines across Morpho, Sky and JupLend. rsETH is liquid restaking protocol Kelp DAO’s restaked ether and is a Liquid Restaking Token (LRT) that allows users to earn ether staking and restaking rewards while keeping their assets liquid, even when they are locked in staking.
That pressure quickly turned into something more severe. One widely circulated post by Josu San Martin described cascading liquidity stress inside lending markets: “ETH depositors cannot withdraw the ETH so they are borrowing stables to ‘withdraw’ funds… This is a full on run on AAVE.”
While Stani Kulechov, Aave’s founder, said the exploit was external and that the protocol’s contracts were not compromised, the depositors panicked. The total value locked (or deposits) dropped from $26.4 billion on April 18 to nearly $20 billion in U.S. morning hours on Sunday, per DefiLlama. The AAVE token also fell more than 18% as depositors scrambled to withdraw their money through the weekend.

A ‘case study’
The exploit itself has become a focal point for engineers and developers.
Several developers pushed back on early assumptions that the issue stemmed from core infrastructure. “The KelpDAO exploit (~$290M, is NOT a LayerZero protocol bug. It’s a configuration issue and a case study every project with a cross-chain token needs to look at today,” one technical breakdown by cryptogoblin read.
The thread detailed how a single verification point enabled the attack. “One signature and 116,500 rsETH materialized out of thin air on Ethereum,” the post said, describing a system where “the [smart] contracts weren’t broken. The verification layer was,” the post claimed.
Others argued the problem runs deeper than a single setup choice.
One critique, who goes by Fishy Catfish on X, framed it as a design flaw, alleging that: “there is no security floor… A configuration can be a 1/1 DVN and the DVN you chose can be a single node ran by a single entity.” A DVN (Decentralized Verifier Network) in DeFi, specifically within LayerZero V2, is an independent entity responsible for validating and attesting to the authenticity of messages sent across different blockchain networks. Essentially, DVNs verify message hashes between a source chain and a destination chain.
To make the point clearer, the author drew a real-world comparison: “imagine if a roller coaster manufacturer allowed amusement parks to individually decide what the minimum safety specs were.” Essentially, the author is simply saying that flexibility without guardrails can create hidden risks.
The post went so far as to claim that the setup was the problem within the design. “I personally think this is a flawed design. Modular security is a worthwhile design space, however, the range of security should have a native security floor that is quite strong, and then allow *additional* layering of security on top of that for more high-value use-cases.”
‘DeFi is dead’
It’s not just the amount and complexity of the exploit that drew the harsh, panicked criticism. The scale of the exploit has heightened concerns.
Roughly 116,500 rsETH, about 18% of supply, was affected. The attacker tricked LayerZero’s cross-chain messaging layer into believing a valid instruction had arrived from another network, which triggered Kelp’s bridge to release 116,500 rsETH to an attacker-controlled address.
Protocols responded by freezing markets and pausing features. Aave halted rsETH activity. Lido paused deposits tied to the asset. Other projects took similar steps to limit exposure as the situation unfolded.
Beyond the technical debate, sentiment across crypto turned sharply negative. One post perhaps captured the mood shift in blunt terms: “DeFi is dead… ‘just use aave’ is dead,” while adding that “The age of crypto is over” and asking, “If you’re reading this – why are you still in crypto?”
While the response may sound like an overreaction, that kind of ‘knee-jerk’ reaction is not unusual after large exploits, but the breadth of this event stands out.
The attack affected cross-chain infrastructure, restaking models and lending markets simultaneously. It also follows a string of recent incidents. The hack lands in an unusually hostile stretch for DeFi, particularly this month. Solana-based perpetuals protocol Drift was drained of about $285 million on April 1 in an attack later linked to North Korea-affiliated actors, and at least a dozen smaller protocols have been exploited in the weeks since, including CoW Swap, Zerion, Rhea Finance and Silo Finance.
‘Check your configs’
Despite all the explanations, there are still more questions than answers.
Even LayerZero is still trying to figure out the full details of the exploit. “We’re fully aware of the rsETH exploit and have been in active remediation with the @KelpDAO team since the incident and continue to monitor. All other applications remain safe,” it said in a post on X. “We are still identifying the root cause alongside @_SEAL_Org and others. We will publish a complete post-mortem with @KelpDAO as soon as we have all information.”
KelpDAO echoed this sentiment. “Earlier today we identified suspicious cross-chain activity involving rsETH. We have paused rsETH contracts across mainnet and several L2s while we investigate. We are working with @LayerZero_Core, @unichain, our auditors and top security experts on RCA. We will keep you posted as we learn more about this situation.”
Still, some developers see a clearer lesson in the chaos.
The exploit did not rely on breaking encryption or bypassing smart contracts. Instead, it exposed how fragile systems can become when they depend on layered assumptions.
In simple terms, the tools worked as designed. The way they were configured did not.
That distinction may shape what comes next. Builders are now urging projects to review their setups, especially those relying on cross-chain messaging.
As cryptogoblin put it bluntly: “Check your configs. Stay safe out there.”
Read more: DeFi yields are crashing so hard that they can’t compete with a traditional savings account
Crypto World
XRP Struggles for Bullish Momentum as Negative CVD Signals Weak Buyer Demand on Binance
TLDR:
- XRP is trading near $1.44 on Binance, recovering modestly but still lacking a confirmed upward trend direction.
- The CVD indicator reads -7.18 million, showing that sell orders continue to outpace buy orders in the market.
- XRP’s price recovery appears driven by reduced selling pressure rather than strong and genuine buyer demand.
- A 30-day price-CVD correlation of 0.61 points to gradual realignment between price action and liquidity flows.
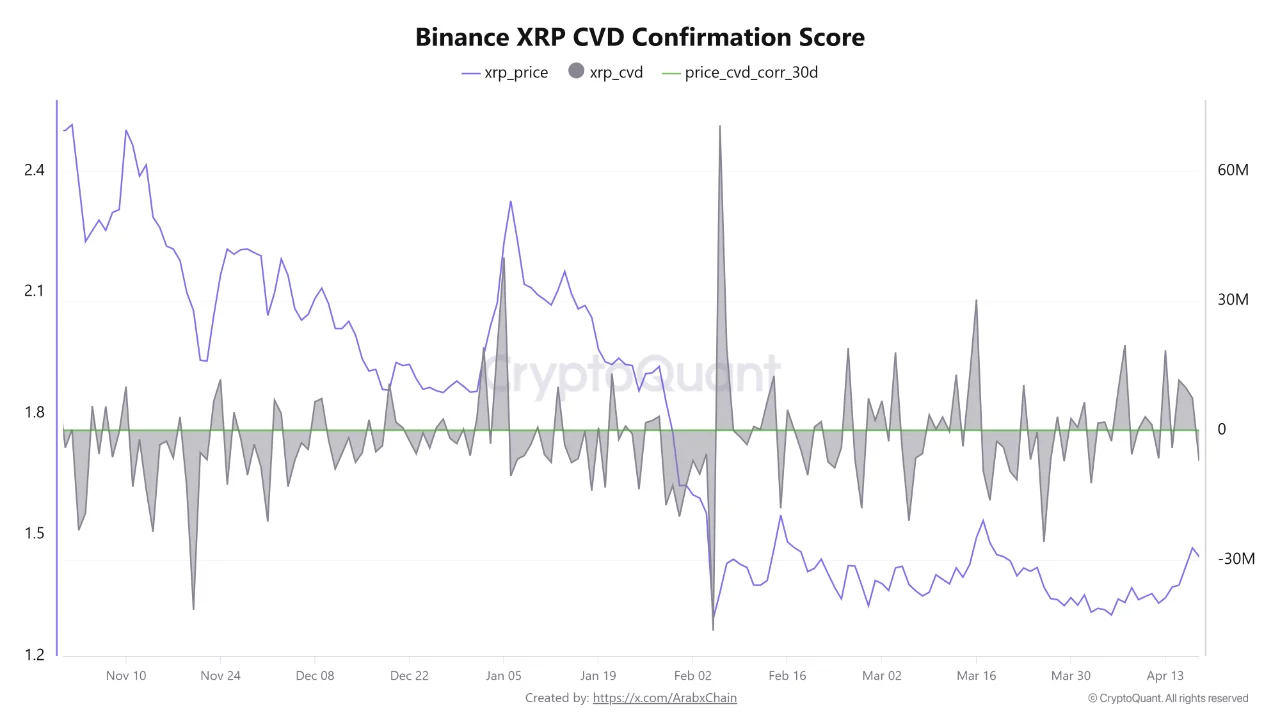
XRP is trading at approximately $1.44 on Binance, showing a modest recovery from recent lows. However, the Cumulative Volume Delta (CVD) indicator remains negative at around -7.18 million.
This signals that sell orders continue to outpace buy orders in the market. Meanwhile, the 30-day price-CVD correlation stands at 0.61, pointing to a gradual realignment between price action and underlying liquidity flows.
XRP Price Holds Steady Amid Persistent Selling Activity
XRP has recorded a relative recovery after going through a notable period of price decline. The token is currently holding around the $1.44 level on Binance, yet it has not confirmed a fresh upward trend.
Market participants are closely watching whether XRP can sustain this recovery or face renewed selling pressure. The asset has not broken out of its consolidation range, keeping the trend direction unclear.
Despite the price uptick, the CVD reading of approximately -7.18 million paints a different picture for the asset. Sell orders continue to dominate market activity, based on the latest Binance data available.
This divergence between price movement and liquidity flow raises valid questions about the strength of the current recovery.

Source: Cryptoquant
The price increase may be the result of reduced selling activity rather than genuine buying demand. Without a corresponding rise in buy-side volume, the rally lacks the foundation for a sustained move. Traders are, therefore, cautious about reading too much into the current price behavior.
CVD Correlation Data Points to a Shifting Market Structure
The 30-day price-CVD correlation index sitting at 0.61 reflects a more stable relationship between price and liquidity. Compared to earlier periods of wider divergence, this reading shows a clear improvement in market conditions.
It suggests that price movements are beginning to align more closely with the actual flow of capital. A correlation of 0.61 is considered moderately positive in the context of crypto market analysis.
Historically, wider gaps between price action and CVD have often preceded sharp corrections or unsustainable rallies.
The narrowing of this gap now indicates that the market may be transitioning toward a more balanced state. This is a cautiously constructive reading for those monitoring XRP’s medium-term direction.
Even so, the market has not yet confirmed a clear bullish momentum shift for XRP. Selling pressure remains the dominant force and continues to cap the upside for the token.
A consistent move of CVD from negative to positive territory would serve as the clearest confirmation of improved buyer participation. Analysts note that without this shift, any price recovery will likely remain limited in scope.
TLDR:
- RAVE token crashed 95% from $26 to $1 in 24 hours, erasing roughly $6 billion in market cap value.
- Nine wallet addresses linked to RAVE’s initial distribution collectively control around 95% of its total supply.
- ZachXBT raised his bounty to $25K after flagging on-chain wallet ties to RaveDAO team members on Bitget and Gate.
- Tokens including SIREN, MYX, COAI, M, PIPPIN, and RIVER also show highly questionable price action on major exchanges.
On-chain investigator ZachXBT has raised serious allegations of market manipulation surrounding RAVE, a token that collapsed 95% in price within 24 hours.
The token fell from $26 to $1, wiping out approximately $6 billion in market capitalization. ZachXBT publicly called on major exchanges — Binance, Bitget, and Gate — to investigate the suspicious price activity. His findings point to a heavily concentrated token supply controlled by a small group of addresses.
Supply Concentration and Exchange Activity Raise Red Flags
RAVE launched in December 2025 on Binance Alpha with a total supply of one billion tokens. ZachXBT identified nine wallet addresses linked to RAVE’s initial distribution. Together, these addresses control roughly 95% of the entire supply.
On April 18, 2026, ZachXBT posted a call to action at 7:26 am UTC, offering a $10,000 bounty for information. He later raised the bounty to $25,000 by 10:56 am UTC. Bitget, Binance, and Gate each acknowledged the call within hours.
ZachXBT also found suspicious activity on centralized exchanges tied to RaveDAO team addresses on-chain. He linked specific wallet addresses to both Bitget and Gate, which potentially contradicts RaveDAO’s public statement denying involvement. The team had posted that denial at 3:06 pm UTC on the same day.
Prior to the public post, ZachXBT had confronted RaveDAO co-founder Yemu Xu, also known as wildwoomoo, on April 13 and 14. As of the time of reporting, no response had been received. ZachXBT stated he had not taken any position in RAVE and could not predict when exchanges would respond publicly.
Broader Pattern of Suspicious Token Activity Concerns Observers
A key data point from ZachXBT’s analysis involves the liquidation ratio. Around $6 billion in market cap was erased on just $52 million in 24-hour liquidations. That gap between liquidations and market cap loss points to an inflated and unsustainable valuation.
RAVE reached a top-15 market cap ranking within just ten days of its rise before collapsing nearly entirely. ZachXBT noted this made it the most blatant case he had observed recently on major centralized exchanges.
However, RAVE is not an isolated case. ZachXBT flagged several other tokens — SIREN, MYX, COAI, M, PIPPIN, and RIVER — as having similarly questionable price activity in recent months.
Exchanges, according to ZachXBT, need to act faster when manipulation appears. Each day without intervention allows retail traders to absorb losses while platforms continue to earn fees on trading volume.
ZachXBT confirmed his $25,000 bounty remains active, as no verified information with supporting evidence has been submitted yet.


Vercel disclosed a security incident involving unauthorized access to its internal systems, affecting a limited number of customers.
The web hosting platform published a security bulletin on April 19, urging all users to review their environment variables immediately.
What Happened at Vercel
According to Vercel’s official statement, attackers gained unauthorized access to certain internal systems. The company has engaged incident response experts and notified law enforcement.
Follow us on X to get the latest news as it happens
Developer Theo Browne shared additional details, noting that Vercel’s Linear and GitHub integrations bore the brunt of the attack.
“They’re selling internal DB + employee accounts + GitHub/NPM tokens for $2M on BreachForums,” noted one AI and tech expert.
However, environment variables marked as “sensitive” within the platform remained protected.
Variables not flagged as sensitive should be rotated as a precaution.
The breach method may have targeted multiple companies beyond Vercel. The full scope of affected customers remains unclear as the investigation continues.
According to Dark Web Informer, the attacker is likely ShinyHunters, a black-hat criminal hacker and extortion group that is believed to have been involved in a significant amount of data breaches.
Why Crypto Projects Should Pay Attention
Many crypto and Web3 frontends deploy on Vercel, from wallet connectors to decentralized application interfaces.
Projects storing API keys, private RPC endpoints, or wallet-related secrets in non-sensitive environment variables face potential exposure risk.
The breach does not threaten blockchains or smart contracts directly, as those operate independently of frontend hosting.
However, compromised deployment pipelines could theoretically allow build tampering for affected accounts.
No evidence of such tampering has surfaced yet.
Vercel recommends reviewing all environment variables and enabling its sensitive variable feature.
Security experts also urge regenerating GitHub tokens tied to Vercel integrations and auditing recent build logs for cached credentials.
The incident serves as a reminder of the risks centralized deployment platforms pose in a decentralized space.
The post Vercel Security Breach Raises Concerns for Crypto Projects appeared first on BeInCrypto.

Online gambling is one of the biggest digital industries in the world. Millions of players log in daily to online casinos, sportsbooks and betting platforms across dozens of regulated markets. The operators behind these platforms manage complex businesses spanning technology, compliance, payments, customer service and marketing. Yet when it comes to one of the most fundamental elements of brand building — public relations — most online gambling operators have been left to fend for themselves.
Kooc Media, a PR distribution agency that has worked with gambling and crypto clients since 2017, has announced a dedicated PR support service for online gambling operators. The service covers press release writing, guaranteed publication on established news websites, international newswire distribution and detailed campaign reporting. It is available to online casinos, sportsbooks, betting platforms, poker networks, bingo operators and any other business operating in the online gambling space.
Why Online Gambling Operators Need Dedicated PR
The relationship between the PR industry and online gambling has always been difficult. Most mainstream PR agencies will not take on gambling clients. Their internal policies classify betting and casino companies as restricted categories, regardless of whether the operator holds valid licences and operates in fully regulated markets. The few agencies that do accept gambling business tend to be small outfits with limited media networks and no ability to guarantee results.
This has created a situation where online gambling operators — many of which are substantial, well-funded businesses — operate without any structured PR support at all. They invest in affiliate marketing, paid advertising, social media management and influencer campaigns, but press coverage on independent news and finance publications remains out of reach for most.
The consequences go beyond missed headlines. Without regular media coverage, online gambling brands struggle to build the kind of independent credibility that players, regulators, investors and business partners all look for. An operator can spend millions on marketing and still be viewed with suspicion by a potential player who searches the brand name and finds nothing beyond the company’s own website.
Kooc Media has provided gambling PR alongside crypto PR since the agency was founded. The decision to formalise its online gambling offering into a dedicated service reflects growing demand from operators who have recognised the gap in their marketing and want a reliable way to close it.
“Online gambling operators have been underserved by the PR industry for years,” said Michelle De Gouveia, spokesperson for Kooc Media. “These are licensed, regulated businesses with genuine news to share. They deserve proper PR support and that is exactly what we are providing.”
How the Service Works
Kooc Media has built a PR model that removes the guesswork and unreliability that online gambling operators have experienced with traditional agencies.
The process starts with content. Operators can provide their own press releases or have Kooc Media’s in-house editorial team handle the writing. The agency’s writers specialise in gambling and crypto content and produce press releases that meet the editorial standards of the publications they will appear on. Whether the announcement covers a new market launch, a licensing achievement, a platform upgrade, a major sponsorship or a promotional campaign, the content is crafted to read as credible industry news rather than marketing material.
Publication happens first across Kooc Media’s owned network of news websites. The agency operates several established publications including Blockonomi, CoinCentral, MoneyCheck, Parameter, Beanstalk and Computing. These sites cover finance, technology, cryptocurrency and iGaming and carry strong domain authority accumulated through years of consistent editorial output. Because Kooc Media owns these publications, every placement is guaranteed. There is no pitch process, no editorial rejection risk and no uncertainty about whether the story will run.

Distribution then extends through a partner network that includes hundreds of additional media outlets and thousands of syndication feeds spanning multiple regions and content verticals. Operators selecting premium packages can secure placements on major financial and business platforms including Business Insider, Bloomberg, Benzinga, MarketWatch and USA Today.
The full cycle can be completed in a single day. An operator can brief the agency in the morning and have live coverage across multiple publications by the afternoon. After distribution, a complete report is delivered listing every placement with a direct link to each published article.
The Business Case for PR in Online Gambling
Online gambling operators who invest in consistent PR gain advantages across several areas of their business simultaneously.
Player trust is the most direct benefit. Online gambling depends entirely on players trusting an operator with their money. Before signing up and depositing funds, most players conduct at least a basic search for the brand. What they find shapes their decision. An operator with articles on recognised news and finance publications appears established and legitimate. An operator with no media presence beyond its own site and a handful of affiliate reviews raises questions that many players will not bother to resolve — they will simply choose a competitor instead.
Search engine optimisation is a closely related benefit. Every article placed on a high-authority publication generates a backlink to the operator’s website. These backlinks are among the strongest signals search engines use when determining rankings. Online gambling operators compete fiercely for organic visibility on terms like “best online casino,” “top sportsbook,” “online betting sites,” “casino bonus offers” and “sports betting platform.” Operators who run consistent PR campaigns build a backlink profile that improves their rankings progressively, delivering organic traffic that does not require ongoing ad spend.
Regulatory and corporate credibility strengthens with media visibility. Online gambling is an increasingly regulated industry. Operators applying for licences, renewing existing ones or entering newly regulated markets benefit from demonstrating a visible and transparent public profile. Regulators assess brand reputation as part of their evaluation process. A documented track record of press coverage across credible publications supports that assessment. Similarly, operators pursuing investment, preparing for public listings or negotiating B2B partnerships find that media presence strengthens their position in those conversations.
Competitive differentiation rounds out the picture. The online gambling market is crowded. Thousands of casinos and sportsbooks compete for the same players, often with similar products, similar odds and similar promotional offers. Press coverage creates a layer of brand recognition that product features alone cannot replicate. The operator that a player has actually read about on a trusted website holds an advantage over the one they have never encountered outside of a banner ad.
Packages for Every Type of Operator
Kooc Media recognises that online gambling operators come in all sizes and stages. A newly licensed online casino preparing for launch has very different PR needs than a multinational betting group managing dozens of brands across multiple markets.
Standard packages provide a set number of guaranteed placements across the agency’s owned publications and partner outlets. They include optional content writing and comprehensive reporting. These packages suit operators who want steady, predictable media coverage on a regular basis — monthly announcements, quarterly updates, game launches, promotional campaigns, sponsorship news or regulatory milestones.

Custom campaigns are available for operators with specific strategic goals. A sportsbook launching operations in a newly regulated state or country needs a coordinated press push timed to the market opening. A casino group completing an acquisition needs corporate-level coverage aimed at business and financial media. An online betting platform rebranding after a merger needs press that introduces the new identity to players and industry stakeholders simultaneously. An operator adding cryptocurrency payment options needs coverage that bridges its traditional player base and the growing crypto gambling audience.
Kooc Media handles every element of these campaigns. Strategy, content creation, distribution scheduling and post-campaign reporting are all managed by the agency. Operators without dedicated PR or communications staff can use the service as a complete external press office. Those with existing marketing teams can use it as a specialist distribution channel that extends their reach beyond what internal efforts can achieve alone.
About Kooc Media
Kooc Media is a PR distribution agency founded in 2017, specialising in online gambling, crypto, fintech and technology. The company operates its own network of news publications and works with a broad partner distribution network to deliver guaranteed media coverage for clients. Services include press release writing, sponsored articles, homepage placements, newswire distribution and fully managed PR campaigns.
Kooc Media’s gambling PR packages are available now through the company’s website at https://kooc.co.uk.
Disclaimer: This is a Press Release provided by a third party who is responsible for the content. Please conduct your own research before taking any action based on the content.
Crypto World
MORPHO Breaks Out of Multi-Year Triangle: Can Bulls Push the Price to the $3.91 All-Time High?
TLDR:
- MORPHO broke out of a multi-year symmetrical triangle, clearing upper resistance at the $1.87 level.
- The initial price target stands at $2.65, aligning with the August 2025 highs following the breakout.
- A retest near $1.70 is considered a standard technical move and may offer a secondary entry point.
- Traders are advised to maintain a stop loss at $1.57 to keep the risk-to-reward ratio favorable.
MORPHO is drawing attention from technical analysts after breaking out of a multi-year symmetrical triangle pattern.
The token, currently trading around $2.02, cleared a key resistance trendline at $1.87. Analysts see this as a sign that the prolonged accumulation phase has ended.
Price targets of $2.65 and $3.91 are now on the radar for traders watching the chart structure closely.
Breakout Signals a Shift in Market Structure
Crypto analyst Ali Charts flagged the MORPHO breakout in a post on April 19, 2026. According to the analyst, the token cleared the upper resistance trendline of the symmetrical triangle at $1.87. This level now serves as the base from which the new trend is emerging.
The initial price target following the breakout stands at $2.65. That level aligns with the highs recorded in August 2025. A secondary macro target points to the previous all-time high at $3.91, should bullish momentum continue to build.
Symmetrical triangle patterns typically form during periods of price consolidation. A confirmed breakout from such a formation often attracts fresh buying interest.
The multi-year nature of this pattern adds weight to the move, as longer consolidations tend to produce stronger directional moves.
Retest Zone and Risk Management Levels to Watch
Ali Charts noted that multi-year breakouts often include a retest of the breakout zone before the next expansion phase.
A pullback toward $1.70 would fall within that range. The analyst described such a move as a standard technical development rather than a signal of weakness.
For traders who missed the initial entry, a retest near $1.70 could present a second opportunity. The area around the former resistance trendline may act as support on any dip. This is a common behavior seen across different assets following extended consolidation breakouts.
Risk management remains a priority for traders tracking this setup. Ali Charts placed a stop loss level at $1.57 to define the risk on the trade.
With a target of $2.65, the distance between entry and stop offers a favorable reward relative to the downside being risked.

Web3 VCs have a differentiation problem

Marshals Cast Teases Dutton Ranch Crossover, Defend Romance
The colourful Welsh village inspired by Portofino and featured on hit Channel 4 show


-
 NewsBeat7 days ago
Pep Guardiola and Gary Neville agree over Arsenal title problem that benefits Man City
-

 Crypto World6 days ago
The SEC Conditionalises DeFi Platforms to Be Avoided for Broker Registration
-

 Fashion2 days ago
Weekend Open Thread: Theodora Dress
-

 Crypto World6 days ago
SEC Signals Exemption for Crypto Interfaces From Broker Registration
-

 News Videos4 days ago
Secure crypto trading starts with an FIU-registered
-

 Sports2 days ago
NWFL Suspends Two Players Over Post-Match Clash in Ado-Ekiti
-

 Crypto World6 days ago
SEC Proposes Certain Crypto Interfaces Don’t Need to Register as Brokers
-

 NewsBeat5 days ago
Trump and Pope Leo: Behind their disagreement over Iran war
-

 Business3 hours ago
Powerball Result April 18, 2026: No Jackpot Winner in Powerball Draw: $75 Million Rolls Over
-

 Politics2 days ago
Palestine barred from entering Canada for FIFA Congress
-

 Crypto World2 days ago
Russia Pushes Bill to Criminalize Unregistered Crypto Services
-

 Sports6 days ago
NWFL opens Pathway for new Clubs ahead of 2026 Season
-
 Entertainment6 days ago
Brand New Day’ Footage Reveals the Devastating Impact of ‘Now Way Home’
-
 Business3 days ago
Creo Medical agree sale of its manufacturing operation
-

 Politics8 hours ago
Zack Polanski demands ‘council homes not luxury flats for foreign investors’
-

 Crypto World6 days ago
Trump whales load up ahead of Mar-a-Lago luncheon.
-
Business6 days ago
Kering slides after Morgan Stanley downgrade, Gucci woes loom
-

 Tech6 days ago
Google adds E2E encryption to Gmail for iOS and Android enterprise users
-
Crypto World7 days ago
Sei Network Enters Quiet Reset Phase as On-Chain Metrics Signal a Slowdown in 2026
-

 Tech6 days ago
Apple glasses won’t go brand shopping like Meta did with Ray-Ban and Oakley
You must be logged in to post a comment Login