
Crypto World
Chainlink Price Surges: What’s Behind Today’s LINK Rally?

The price of Chainlink ($LINK) rebounded over 14% on Wednesday in a spectacularly quick comeback.
LINK traded at bottoms of $8.20 in the early morning hours of Tuesday UTC, according to Coingecko data. However, over the next 24 hours it rapidly shot up 14% to reclaim the $9.35 level, briefly going all the way up to $9.50 before dipping to its current price around $9.25.
This means LINK is trading around its highest price point since February 5. The sudden upward move is driven by a dual catalyst: a major integration with the Canton Network for real-world asset (RWA) tokenization and sustained institutional inflows into spot LINK ETFs.
JUST IN: @CantonNetwork adopts Chainlink data and interoperability standards to unlock institutional tokenization. — Chainlink (@chainlink) February 25, 2026
 Data Streams (incl. 24/5 equities) SmartData (NAV & AUM) Proof of Reserve CCIP
Canton  Chainlink pic.twitter.com/49UV9NNxJ3
Additionally, Chainlink is getting friendly with regulators. In February alone, Chainlink’s former executive lawyer Taylor Lindman joined the SEC’s crypto task force, while its founder and CEO Sergey Nazarov joined the CFTC’s Innovation Advisory Committee.
Key Takeaways
- The Catalyst: Canton Network integration unlocks institutional RWA data streams for Chainlink.
- The Data: Grayscale’s GLNK fund now holds $61 million in assets, defying broader ETF outflow trends.
- The Setup: $LINK must hold $9.16 to validate the breakout from oversold conditions.
Chainlink and Canton: The Bigger Picture
This is not a routine partnership announcement. It signals deep infrastructure entrenchment. Chainlink has integrated with Canton Network, a dominant player in the RWA tokenization sector.
The integration introduces critical data streams, including equities, proof of reserves, and Cross-Chain Interoperability Protocol (CCIP) support, directly into Canton’s institutional framework.
That matters because it moves Chainlink beyond simple price feeds. It positions the network as the connective tissue for institutional capital.
While recent macro catalysts have lifted Bitcoin, LINK’s specific outperformances are tied to utility.
Institutional funds are voting with their wallets. Grayscale’s Chainlink Trust (GLNK) fund now commands over $70 million in assets, while Bitwise’s CLNK holds over $11 million.
In a month where Bitcoin ETFs have shed billions, LINK products are accumulating.
On-chain accumulation supports the bullish thesis. Chainlink’s Strategic Reserves have jumped to over 2.17 million tokens, currently valued at over $20 million.
RESERVE UPDATE — Chainlink (@chainlink) February 19, 2026

Today, the Chainlink Reserve accumulated 136,898.30.
Total holdings: 2,172,261.86 pic.twitter.com/OIlDLvgVrn
The project is using off-chain fees to buy back its own token. That is a fundamental supply sink. When combined with emerging buy signals across the altcoin sector, the floor for LINK appears to be hardening around the $8.00 mark.
Discover: The top crypto to diversify your portfolio with
Chainlink Price Prediction: The Path to $10 and Beyond!
Momentum indicators favor the bulls. The RSI has bounced from 34 to 50 in a few hours, indicating huge buy orders have pushed it out of oversold territory and into a strong neutral zone.
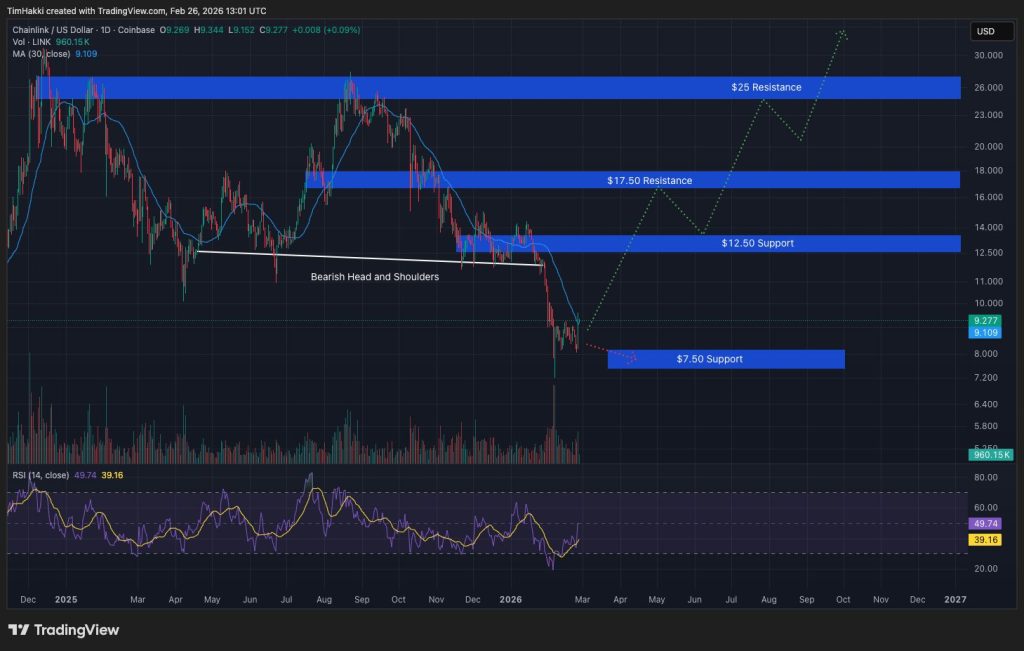
Open interest is approaching $422 million, suggesting traders are stepping back in with leverage. If LINK clears the psychological $10.00 barrier, its next major challenges lie around $17.50 and $25.
Conversely, if price drops below the 30-day moving average again, the rally could collapse.
A close below $8.20 would invalidate the current rally and expose local support levels around $7.50.
Unfortunately, in the short-to-mid-term, the industry is still too tied to the fate of Bitcoin. If Bitcoin falters, it will likely drag LINK down regardless of the Canton news or regulatory developments.
Discover: The best crypto to buy now
The post Chainlink Price Surges: What’s Behind Today’s LINK Rally? appeared first on Cryptonews.


Binance co-founder Changpeng Zhao (CZ) confirmed he is officially divorced and offered OKX founder Star Xu a $1 billion bet to prove it.
The challenge came after Xu questioned CZ’s marital status as part of a broader dispute triggered by CZ’s 457-page memoir “Freedom of Money,” released on April 8.
Star Xu Questions CZ’s Marital Status
Xu demanded that CZ produce a divorce agreement signed by both parties.
He said he would publicly apologize if CZ could present the document. If not, he argued, the claim would amount to public misrepresentation.
I typically ignore all these false claims and attacks. But… You can apologize now. I am officially divorced,” wrote CZ.
CZ responded by confirming his divorce and proposing a permanent wager of $1 billion. He stated he would not share legal documents online out of respect for his ex-wife’s privacy.
However, he offered to have lawyers verify the agreement if Xu accepted the bet.
“I am happy to bet $1 billion USD (or any number you choose) that: I am officially divorced (way before today),” CZ added.
He gave Xu a 24-hour window to respond, adding that silence would reveal who had been misleading the public.
A Feud Rooted in a Decade of Rivalry
The divorce dispute is the latest front in a conflict that dates back to 2014. CZ served as chief technology officer at OKCoin, the predecessor to OKX.
Their falling out over equity, a Bitcoin.com domain contract, and forgery allegations have resurfaced multiple times.
CZ’s memoir also claims Huobi founder Li Lin told him in 2025 that Xu had reported him to Chinese authorities. Xu has denied that claim.
“Both OKX and Binance are regulated by multiple regulators. As the UBO of a regulated company, publicly offering a $1 billion bet is hardly professional conduct,” Xu responded to CZ’s invitation.
The OKX executive also called on the attention of Binance’s regulators to CZ’s offer, questioning whether Changpeng Zhao’s Binance stake has been legally separated with his ex-wife.
“Bill Gates and Jeff Bezos have already shown what proper asset separation looks like in a divorce,” he added.
Yi He, the co-CEO of Binance, is the long-term life partner (romantic and business) and the mother of three of CZ’s children. Reportedly, CZ has five kids total, two from his previous marriage.
They met in 2014 while working at the crypto exchange OKCoin (she recruited him), and became a couple around that time, and co-founded Binance together in 2017.
Amid the ongoing talks between CZ and Star Xu, Yi He has come to her own defense, highlighting her role as the second largest shareholder and Co-CEO of Binance.
“I’m not some delicate wife literature female protagonist; I’m the second largest shareholder and Co-CEO of Binance who continues to fully suppress competitors even after CZ stepped down,” she articulated.
The post Binance’s CZ Offers OKX Founder $1 Billion Bet Over Divorce Dispute appeared first on BeInCrypto.

Bitcoin is sitting at 43% below its October peak, and yet Wall Street hasn’t blinked. The institutional product machine is still running at full speed. What happens next to the price may surprise both bulls and the newly converted suits.
Morgan Stanley has rolled out its first dedicated Bitcoin fund, the latest in a string of Wall Street moves that signal a structural, long-term commitment to the asset class regardless of short-term volatility. The launch arrives as Bloomberg analysts note the “speculative heat” has clearly exited the market, the 40% drawdown from peak levels is evidence enough.
— BSCN (@BSCNews) April 8, 2026
 BULLISH: MORGAN STANLEY'S BITCOIN ETF MAKES HISTORY ON DAY 1$MSBT printed $34,000,000 in trading volume on day one, putting it among the most successful ETF debuts in market history.
This is the first spot Bitcoin ETF issued directly by a major US bank. Morgan Stanley… pic.twitter.com/dTCV7pJS73
But product launches don’t follow price; they follow conviction. Macro headwinds still remain real, with global trade disruption from the Iran conflict weighing on risk assets broadly. Though the divergence between institutional product activity and spot price weakness is the story we shouldn’t ignore.
Discover: The best pre-launch token sales
Can Wall Street Pump Bitcoin Price to $80K?
Bitcoin is consolidating near the $71,000 level following a sharp multi-month correction. Volume has thinned during this drawdown phase, a pattern consistent with distribution giving way to accumulation. Technical readings suggest momentum is compressed, with the 200-day moving average acting as a line in for medium-term trend direction.
The $68,500–$70,000 band represents the key near-term support cluster. A clean hold there keeps the recovery thesis intact. Resistance sits in the $76,000–$78,000 range; a weekly close above that level would shift the technical picture meaningfully.
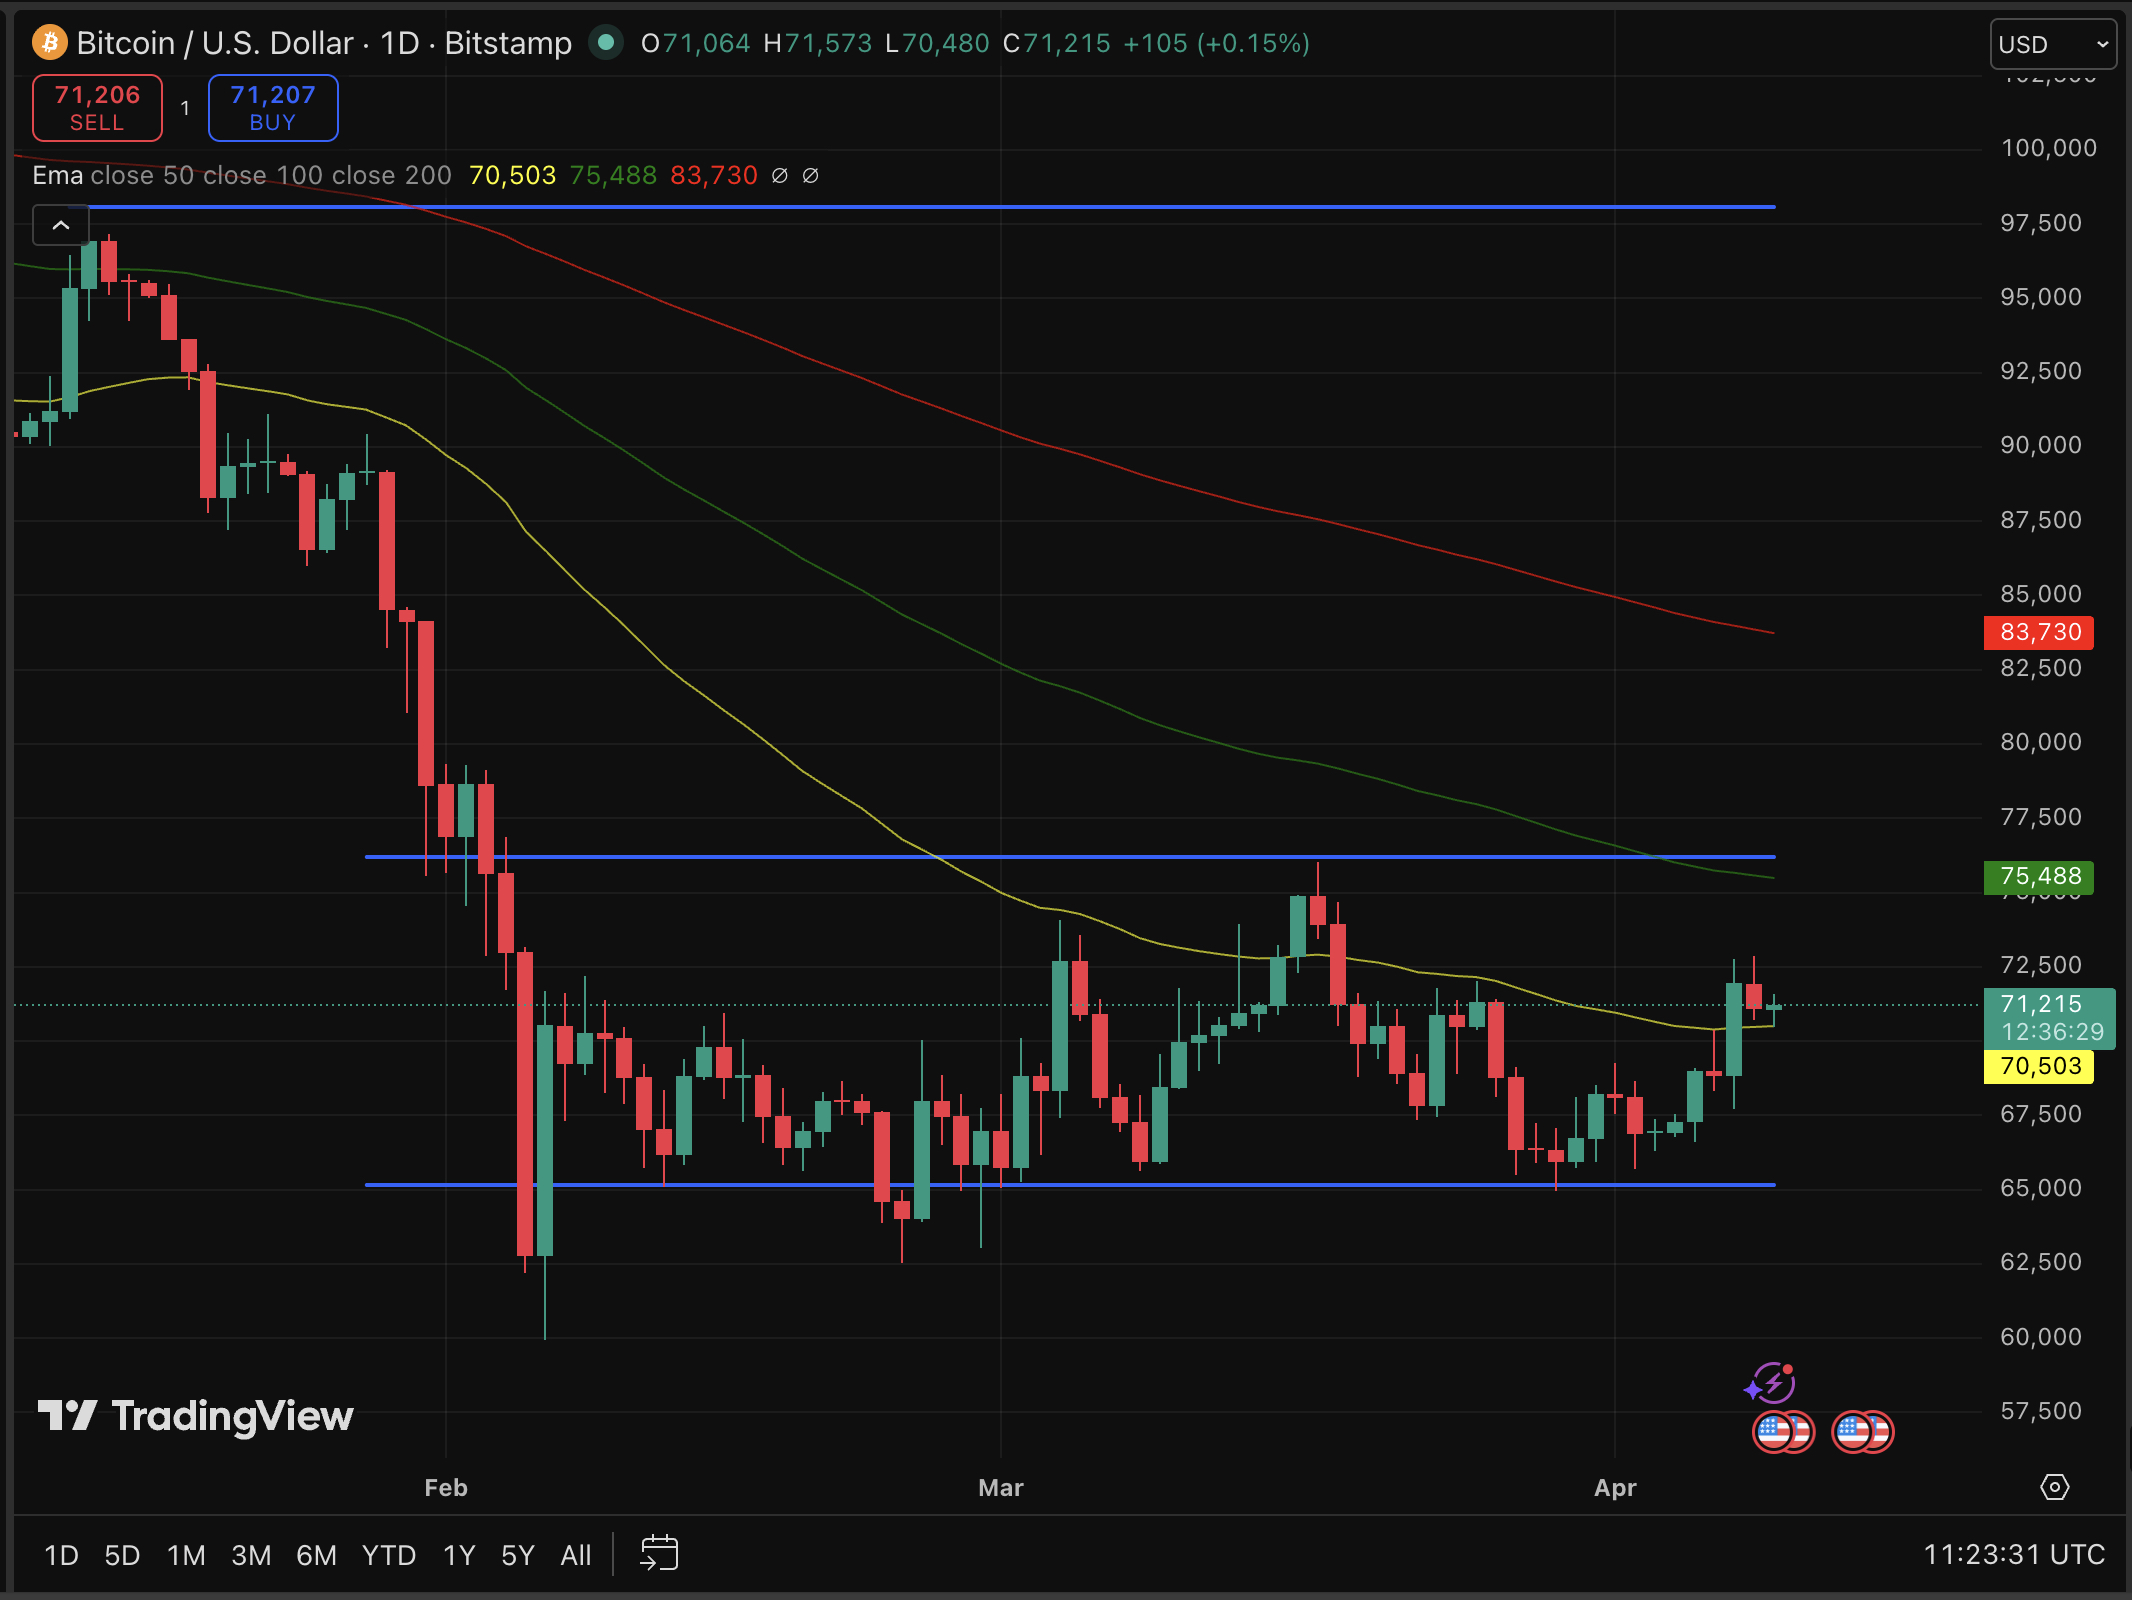
Institutional, especially from Wall Street, Bitcoin buying pressure from the new Morgan Stanley fund flows, absorbs sell-side supply, forcing the price to grind back toward $80,000–$85,000 over four to six weeks.
However, a weekly close below $67,000 invalidates the recovery structure and opens a retest of the $60,000 psychological level.
The data points to patience being required here. Institutional conviction is building the floor; it isn’t yet building the ceiling.
Discover: The best crypto to diversify your portfolio with
Bitcoin Hyper: It’s Bitcoin, But Hyper
When Bitcoin itself trades sideways, capital historically rotates toward higher-beta opportunities in the Bitcoin ecosystem, not away from Bitcoin entirely, but toward projects that amplify its thesis. That’s the window presale investors are currently watching.
Bitcoin Hyper ($HYPER) is positioning directly inside that rotation. It’s the first Bitcoin Layer 2 integrating the Solana Virtual Machine, meaning developers get Bitcoin’s security and trust layer combined with sub-second smart contract execution that, by design, targets performance exceeding Solana’s own throughput.
The project addresses Bitcoin’s three structural constraints simultaneously: slow transactions, elevated fees, and the absence of native programmability.
The numbers are concrete. Currently, presale price stands at $0.0136, with approaching $33 million raised to date. Staking is live with a high 36% APY also available to early participants. The presale has already crossed significant milestones, suggesting genuine demand rather than manufactured momentum.
Traders looking for asymmetric exposure while BTC consolidates can research Bitcoin Hyper here.
The post Bitcoin Wall Street Love Affair: Honeymoon Phase Cooling Down, But Affection appeared first on Cryptonews.

Ben Delo, co-founder of crypto exchange BitMEX, said he donated 4 million pounds ($5.1 million) to Nigel Farage’s Reform UK party, in an opinion piece for The Telegraph Wednesday.
Delo wrote that the contribution was made “since the start of this year” to help build Reform UK into “a genuine alternative party of government.”
The op-ed does not specify whether the donation was made in fiat currency or cryptocurrency, though he also expressed support for a proposed U.K. government moratorium on political donations made in cryptoassets, citing regulatory complexity.
Guidance from the U.K. Electoral Commission, last updated April 7, 2026, states that crypto donations are currently not prohibited under electoral law, but are treated as non-monetary donations and must be valued in pounds at the time of receipt. Parties must also verify donor identity, particularly for contributions above 500 pounds.
The Commission also noted government plans to introduce a moratorium on crypto donations, potentially applying retrospectively to contributions received from March 25, 2026, though no legal changes have yet taken effect.
Late last month, U.K. Prime Minister Keir Starmer’s government announced an immediate moratorium on cryptocurrency donations to political parties, citing concerns that digital assets could be used to obfuscate the origin and motivation behind donations in British politics.
The move placed crypto at the centre of a broader crackdown on foreign interference, signaling that regulators view digital payments as a democratic risk rather than a financial one.
Electoral Commission data does not reveal any contributions listed under Delo or BitMEX.
Delo did not respond to a CoinDesk request for further information.
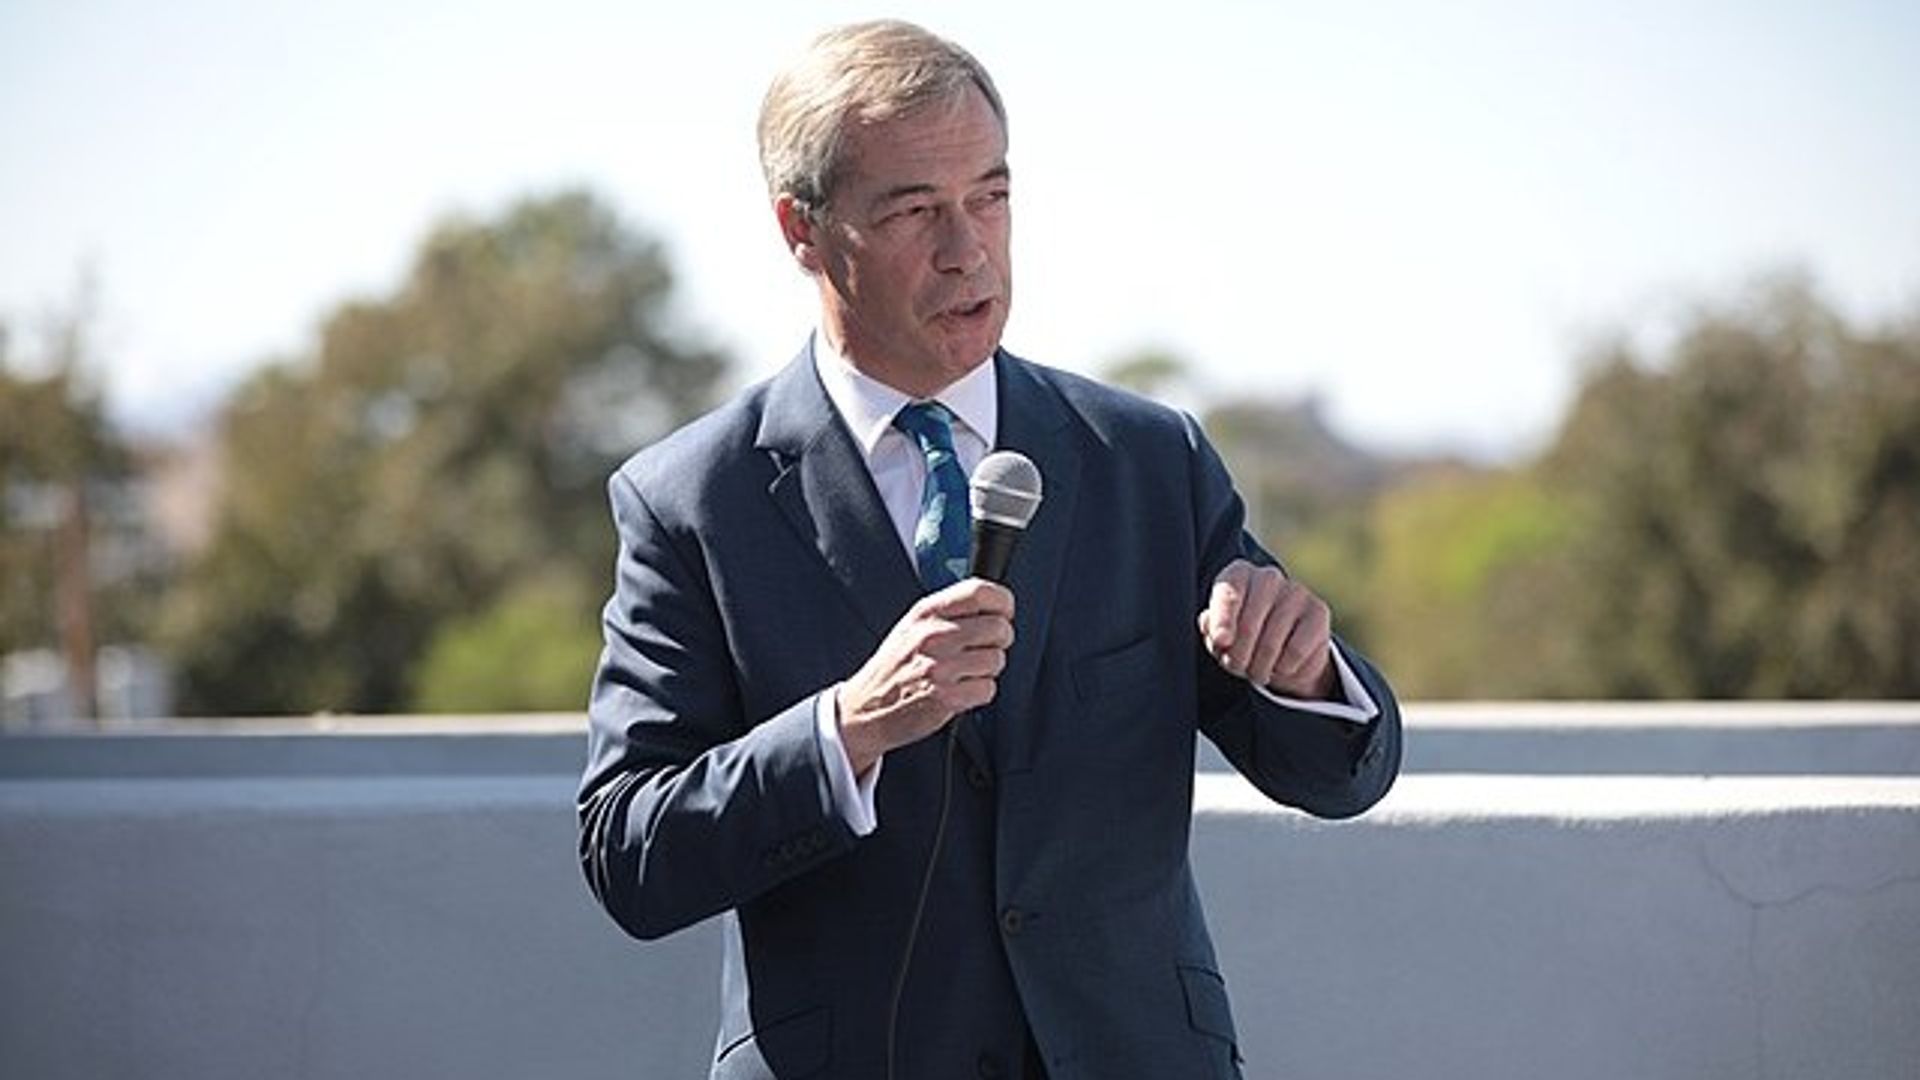
Farage acknowledged the support on X, writing that “brave people like Ben Delo” were becoming “even more determined” to back Reform UK.
In December, British multi-billionaire Christopher Harborne, a Thailand-based entrepreneur who has invested in stablecoin issuer Tether and crypto exchange Bitfinex, made a donation of 9 million pounds to Reform.
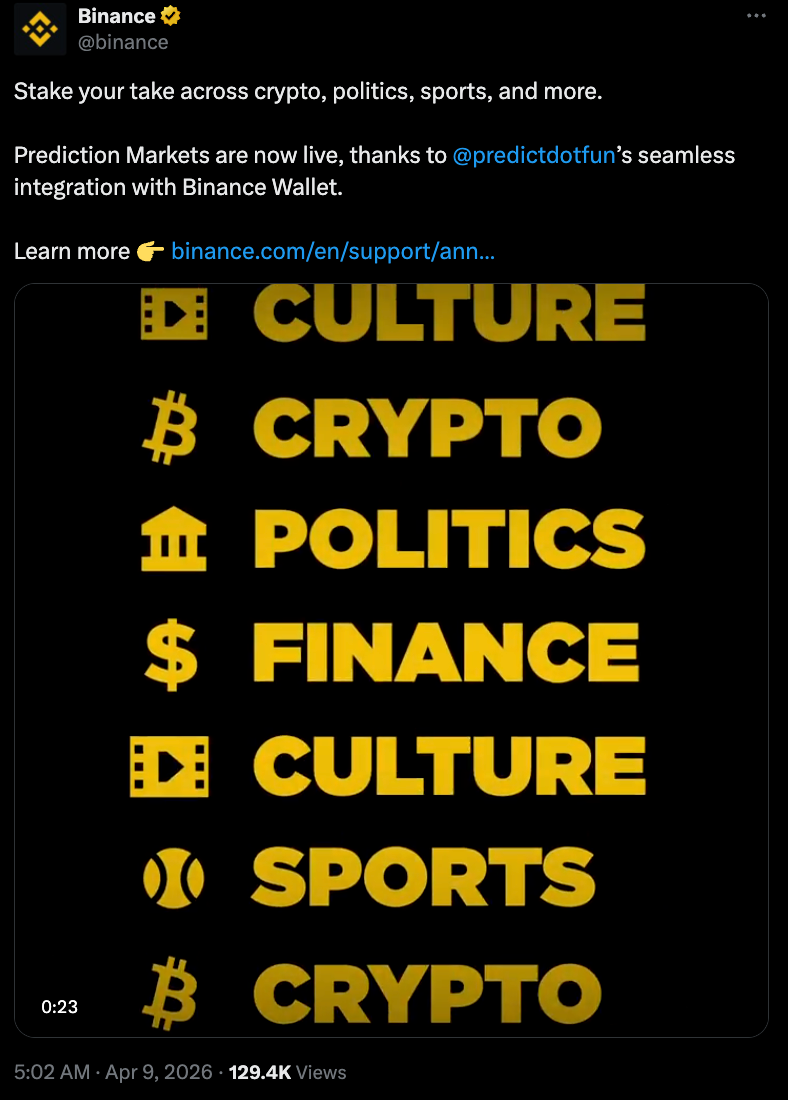
Binance Wallet has integrated prediction market features into its app, saying it will cover all trading and settlement transaction fees for users as it make a play for a piece of the $20 billion market.
In a Thursday notice, Binance said it will launch probability-based markets as a feature on the company’s app through an integration with third-party platforms, starting with Predict.fun. According to the crypto exchange, the integration will be “gasless,” with the company sponsoring fees for trades and settlements on the BNB Smart Chain.

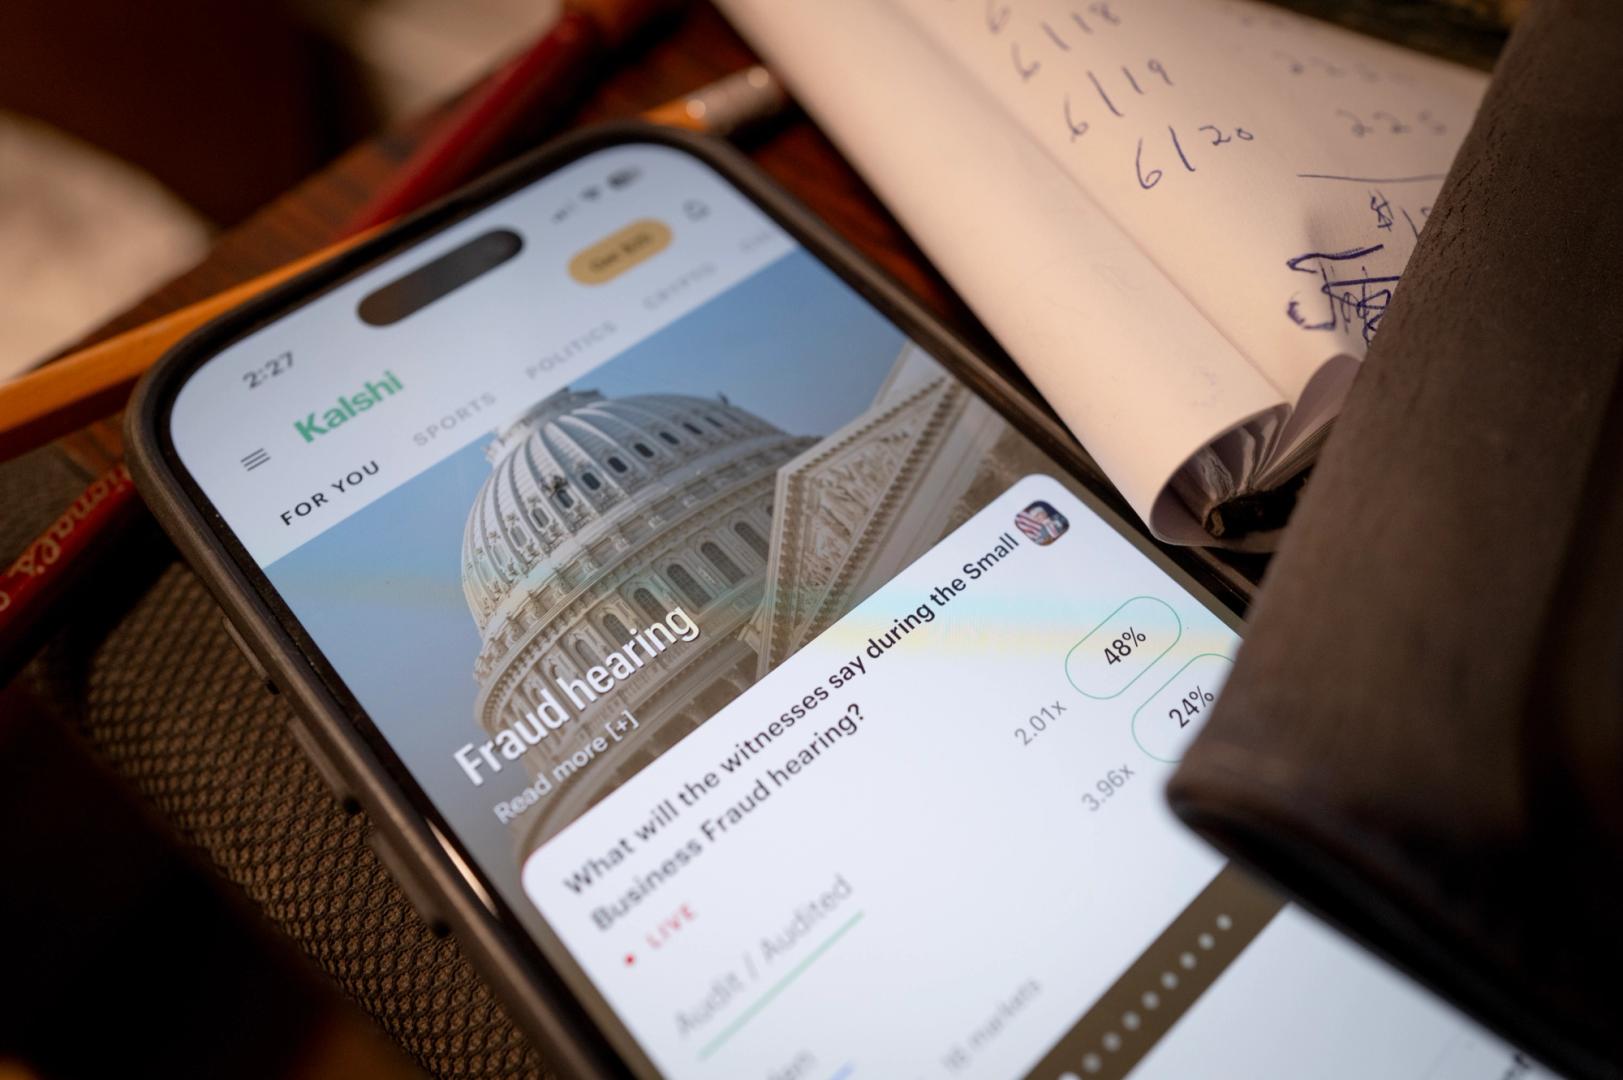
Prediction market platforms like Kalshi and Polymarket offer users the chance to take a position on the outcome of events in a variety of topics, including politics and sports. The latter has put those platforms in the sights of multiple US state authorities who have filed lawsuits for allegedly violating state gaming laws by offering sports bets.
Binance’s integration is the latest example of a crypto platform moving deeper into prediction markets despite some of the more controversial bets on the platforms. Polymarket, for example, has offered users contracts on events related to US-Israeli military actions against Iran.
Related: DOJ and CFTC seek halt to Arizona action against Kalshi
According to data from TRM Labs, the monthly transaction volume across prediction markets platforms reached $20 billion in January — a twenty-fold increase from levels seen in early 2025.
Kalshi co-founder denies Trump son is influencing US regulators
While state-level gaming authorities pursue the platforms in court, the US Commodity Futures Trading Commission (CFTC) has claimed it has “exclusive jurisdiction” to oversee prediction markets. Amid challenges by federal regulators to state actions, ties between some of the companies and the current US administration have stoked concerns among industry leaders and lawmakers about conflicts of interest.
In an Axios interview released on Thursday, Kalshi CEO Tarek Mansour and co-founder Luana Lopes Lara addressed questions about conflicts due to hiring US President Donald Trump’s son as a strategic adviser shortly before his father took office.
“We have never asked for any favors […] and he has never done anything, any regulatory ask, nothing like that,” said Lara, referring to Donald Trump Jr. using his connections to the US government.
Magazine: Anger grows over Polymarket bets on Iran war: ‘Dystopian death market’
Crypto World
As Traders Navigate Market Uncertainty, Varntix Offers New Approach to Crypto Wealth Generation

Crypto markets remain difficult to navigate as traders respond to inflation concerns, interest rate expectations, and geopolitical pressure. The sudden changes in mood have rendered the generation of wealth by way of price inflation much more uncertain. Within this climate, investors are seeking models that can provide greater control and direction of returns.
That change is attracting interest to Digital Asset Treasuries, or DATs. These models are about systematized capital distribution, treasury and more disciplined exposure to digital assets. To investors, that may translate to a more efficient approach of seeking returns without having to be so preoccupied with market timing and short-term speculation.
Varntix is a perfect fit in this evolving story. Varntix provides investors with a more moderate way to generate crypto wealth by providing structured crypto income plans in the form of fixed plans, flexible yield solutions, and treasury-based solutions.
Here’s a cleaner revised version that fixes the minimum-entry confusion and brings in the Fixed and Flexi structure properly:
Why Varntix Is Gaining Relevance in Uncertain Markets
Market uncertainty is changing investor behavior. Many traders still want exposure to digital assets, but they are becoming more cautious about relying fully on short-term price movements. In earlier cycles, fast gains often shaped decision-making, but today’s market is moving with sharper volatility and weaker predictability.
That shift is pushing more attention toward structured income models. Instead of depending only on whether prices rise in the near term, investors are looking for clearer return expectations, defined time horizons, and ways to keep capital active without constant trading. In uncertain conditions, discipline is starting to matter as much as upside.
How Varntix presents a different model
Varntix is a digital wealth platform built around structured crypto income. Its Fixed Income plans are designed for investors who want higher, pre-defined returns over a set period. These plans currently run across 6, 12, and 24-month terms, with yields reaching up to 20% to 24% APY depending on the selected duration. Importantly, these products are not reserved only for high-net-worth users, as entry starts from $500.
That makes the platform easier to evaluate. Instead of committing funds based only on price speculation, users can review the term, projected payout, and return structure before investing. Income is paid in USDT or USDC, which gives users clearer visibility into the dollar value of what they are expected to receive.
Varntix adds flexibility alongside predictable returns
Alongside its fixed-term products, Varntix also offers a Flexi Income structure for users who want more liquidity. These plans typically offer around 4% to 6.5% APY, while allowing users to access products from as little as $50. That makes Flexi more suitable for users who want passive income without locking up capital for long periods.
This matters because it shows Varntix is not built around a one-size-fits-all approach. Some users may prefer the stronger yield of fixed plans, while others may value the accessibility and withdrawal flexibility of Flexi products. Together, both structures widen the platform’s appeal and avoid the impression that Varntix is only for investors deploying $100,000 or more.
A more structured path to crypto wealth generation
Varntix does not remove risk from crypto, but it does offer a more structured way to approach it. Through fixed and flexible income products, stablecoin payouts, treasury-based strategies, and on-chain transparency, it gives users more control over how they earn from digital assets.
As more investors look for stability during uncertain periods, platforms built around disciplined income strategies may continue to gain ground. Varntix reflects that shift by offering a model centered on access, predictability, and a more deliberate path to crypto wealth generation.
Varntix is a digital wealth platform focused on fixed income in crypto and on-chain convertible notes. Learn more at varntix.com.
Disclaimer: This is a Press Release provided by a third party who is responsible for the content. Please conduct your own research before taking any action based on the content.

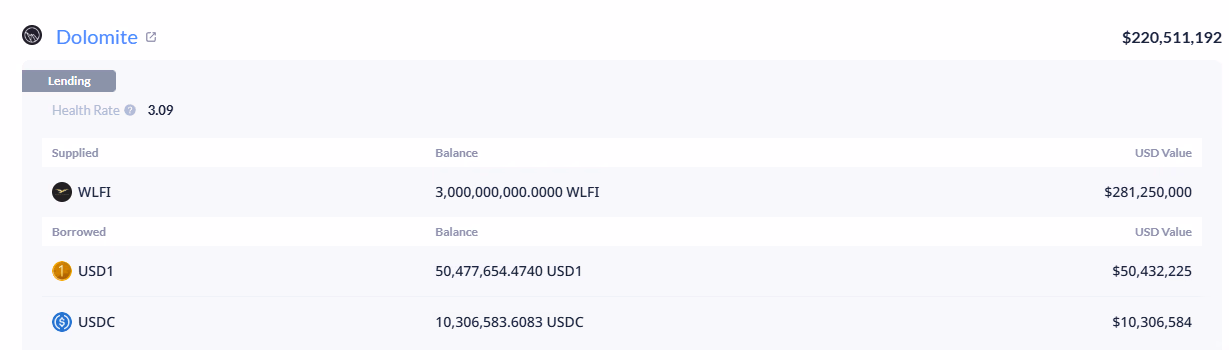
The DeFi project’s treasury used 3 billion WLFI tokens as collateral on Dolomite to borrow $75 million in stablecoins over the past week.
World Liberty Financial, the DeFi venture affiliated with the Trump family, leveraged its treasury to borrow roughly $75 million in stablecoins from Dolomite, the lending protocol co-founded by WLFI’s chief technology officer, Corey Caplan.
On-chain data shows WLFI’s official treasury multisig routed approximately 3 billion WLFI tokens through an intermediary wallet over the past week before depositing the full amount into Dolomite as collateral. The treasury wallet previously deposited roughly 2 billion WLFI directly into Dolomite. The collateral positions are currently valued at roughly $460 million as of April 9, per Dolomite’s stats page.

In the new wallet, the team borrowed 65.4 million USD1 and 10.3 million USDC, roughly $75.7 million in total, although $15 million was repaid on April 7, according to on-chain data.
World Liberty Financial launched World Liberty Markets in January, in partnership with Dolomite, offering lending and borrowing services for its USD1 stablecoin. The arrangement effectively means WLFI built its flagship DeFi product on infrastructure created by one of its own executives, and then used its treasury to become the dominant borrower on that same platform.
WLFI collateral now accounts for more than half of Dolomite’s deposits. The dynamic has drawn comparisons to some of DeFi’s most cautionary episodes involving founders leveraging their own governance tokens.
In June 2024, Curve Finance founder Michael Egorov was forced into roughly $80 million in CRV liquidations after borrowing nearly $100 million in stablecoins across multiple lending protocols using CRV as collateral. At the time, onlookers argued that Egorov had effectively cashed out without selling, extracting $100 million in stablecoins from a $140 million CRV position.
The playbook echoes an even earlier precedent. In January 2022, Wonderland co-founders Daniele Sestagalli and 0xSifu suffered cascading liquidations after leveraging their staked TIME tokens as collateral on Abracadabra, a lending protocol within their own Frog Nation ecosystem. The founders’ oversized positions cratered TIME from $800 to $360 in hours, triggering a vicious cycle in which liquidated collateral was sold into an already weak market, fueling further margin calls.
DeFi analyst Ethan described WLFI’s maneuver as a similar mechanism to extract liquidity without directly selling tokens, while Ignas warned that the WLFI-backed borrowing may ultimately prove unrepayable.
WLFI Slides to All-Time Low
The WLFI token briefly fell nearly 10% on April 9, hitting $0.0885, its lowest level since trading began in September 2025, according toCoingecko.

The thin market depth compounds the risk: if an actor were to aggressively short WLFI, the resulting price drop could trigger a liquidation cascade that Dolomite cannot absorb, since there is no clean path to liquidating billions of illiquid governance tokens.
USD1 is backed by U.S. Treasuries and cash equivalents, limiting the risk of a full depeg. But with USD1’s circulating supply now exceeding $4 billion, the fallout from a Dolomite crisis could extend well beyond the WLFI token itself.
The episode arrives alongside a separate controversy. An investigation by The Times found that WLFI had integrated USD1 with AB DAO, a Southeast Asian blockchain project that had been promoting a resort linked to Cambodia’s Prince Group, whose founder Chen Zhi was sanctioned by U.S. and U.K. authorities in November over alleged involvement in large-scale online fraud. WLFI said it was unaware of AB DAO’s prior ties.
World Liberty Financial has not issued a public statement addressing the recent borrowing, and Dolomite did not immediately respond to The Defiant’s request for comment.
This article was written with the assistance of AI workflows. All our stories are curated, edited and fact-checked by a human.

Prediction markets are seeing steady growth in the U.S., but a wave of legal disputes and shifting competition is beginning to reshape the sector, a new report from Bank of America said.
Total weekly volume rose 4% week-over-week, according to the report, with Kalshi — a federally regulated exchange — leading gains at 6%. Crypto.com posted a smaller increase, while Polymarket, a crypto-native platform that had surged in prior weeks, saw overall volumes fall 16%.
Kalshi now controls roughly 89% of measured U.S. prediction market volume, far ahead of Polymarket at 7% and Crypto.com at 4%, according to BofA estimates. The shift points to a market consolidating around platforms with clearer regulatory standing.
That divide reflects a deeper tension. At the center is whether prediction markets should be treated as financial instruments or as gambling. Kalshi operates under oversight from the Commodity Futures Trading Commission (CFTC), framing its contracts — including those tied to political or sports outcomes — as derivatives.
Polymarket runs on blockchain rails and has historically operated outside U.S. regulatory boundaries. It allows users to trade on event outcomes using crypto, often attracting global liquidity but facing restrictions domestically.
The gap is becoming more visible as regulators step in. Nevada and Massachusetts have both secured preliminary injunctions against Kalshi at the state level, while New Jersey lost an appeal that limits its ability to enforce gambling laws against the firm.
At the same time, the CFTC has taken an aggressive stance in support of prediction markets.
The agency has sued multiple states, arguing that federal law preempts state-level gambling rules. CFTC leadership has also drawn a distinction between sports betting, which it views as entertainment, and event contracts, which it classifies as financial tools for hedging risk.
The outcome of that fight could define the industry. A federal win would allow platforms like Kalshi to scale nationally under a single framework. A loss could push the market into a state-by-state model similar to online sports betting, slowing growth.
Crypto firms are still trying to carve out a role. Polymarket remains one of the largest global platforms and has drawn attention during major events like elections, where trading volumes can spike sharply. Meanwhile, companies like Crypto.com and Coinbase (COIN) are experimenting with prediction market-style products, signaling broader interest from centralized exchanges. The largest crypto exchange in the world, Binance, announced Thursday that it added a prediction markets feature to Binance Wallet.
Even traditional gaming firms are adjusting. FanDuel recently shut down parts of its fantasy sports offerings, a move Bank of America links in part to the rise of prediction markets. The shift suggests users may be moving toward products that resemble trading more than betting.
Ether’s (ETH) recent sell-off was stopped at $1,800, as bulls aggressively defended the level. Ether’s rebound above $2,100, along with on-chain and technical data, suggests that traders will hold the price above $2,000 for the short-term.
Key takeaways:
-
Ether’s profitability metrics drop to levels that have historically marked local bottoms.
-
The MVRV Z-score and pricing bands suggest ETH price drop to $1,800 was the bottom.
-
ETH price bounced off a multi-year trendline that has marked previous macro lows.
Ether traders realize losses
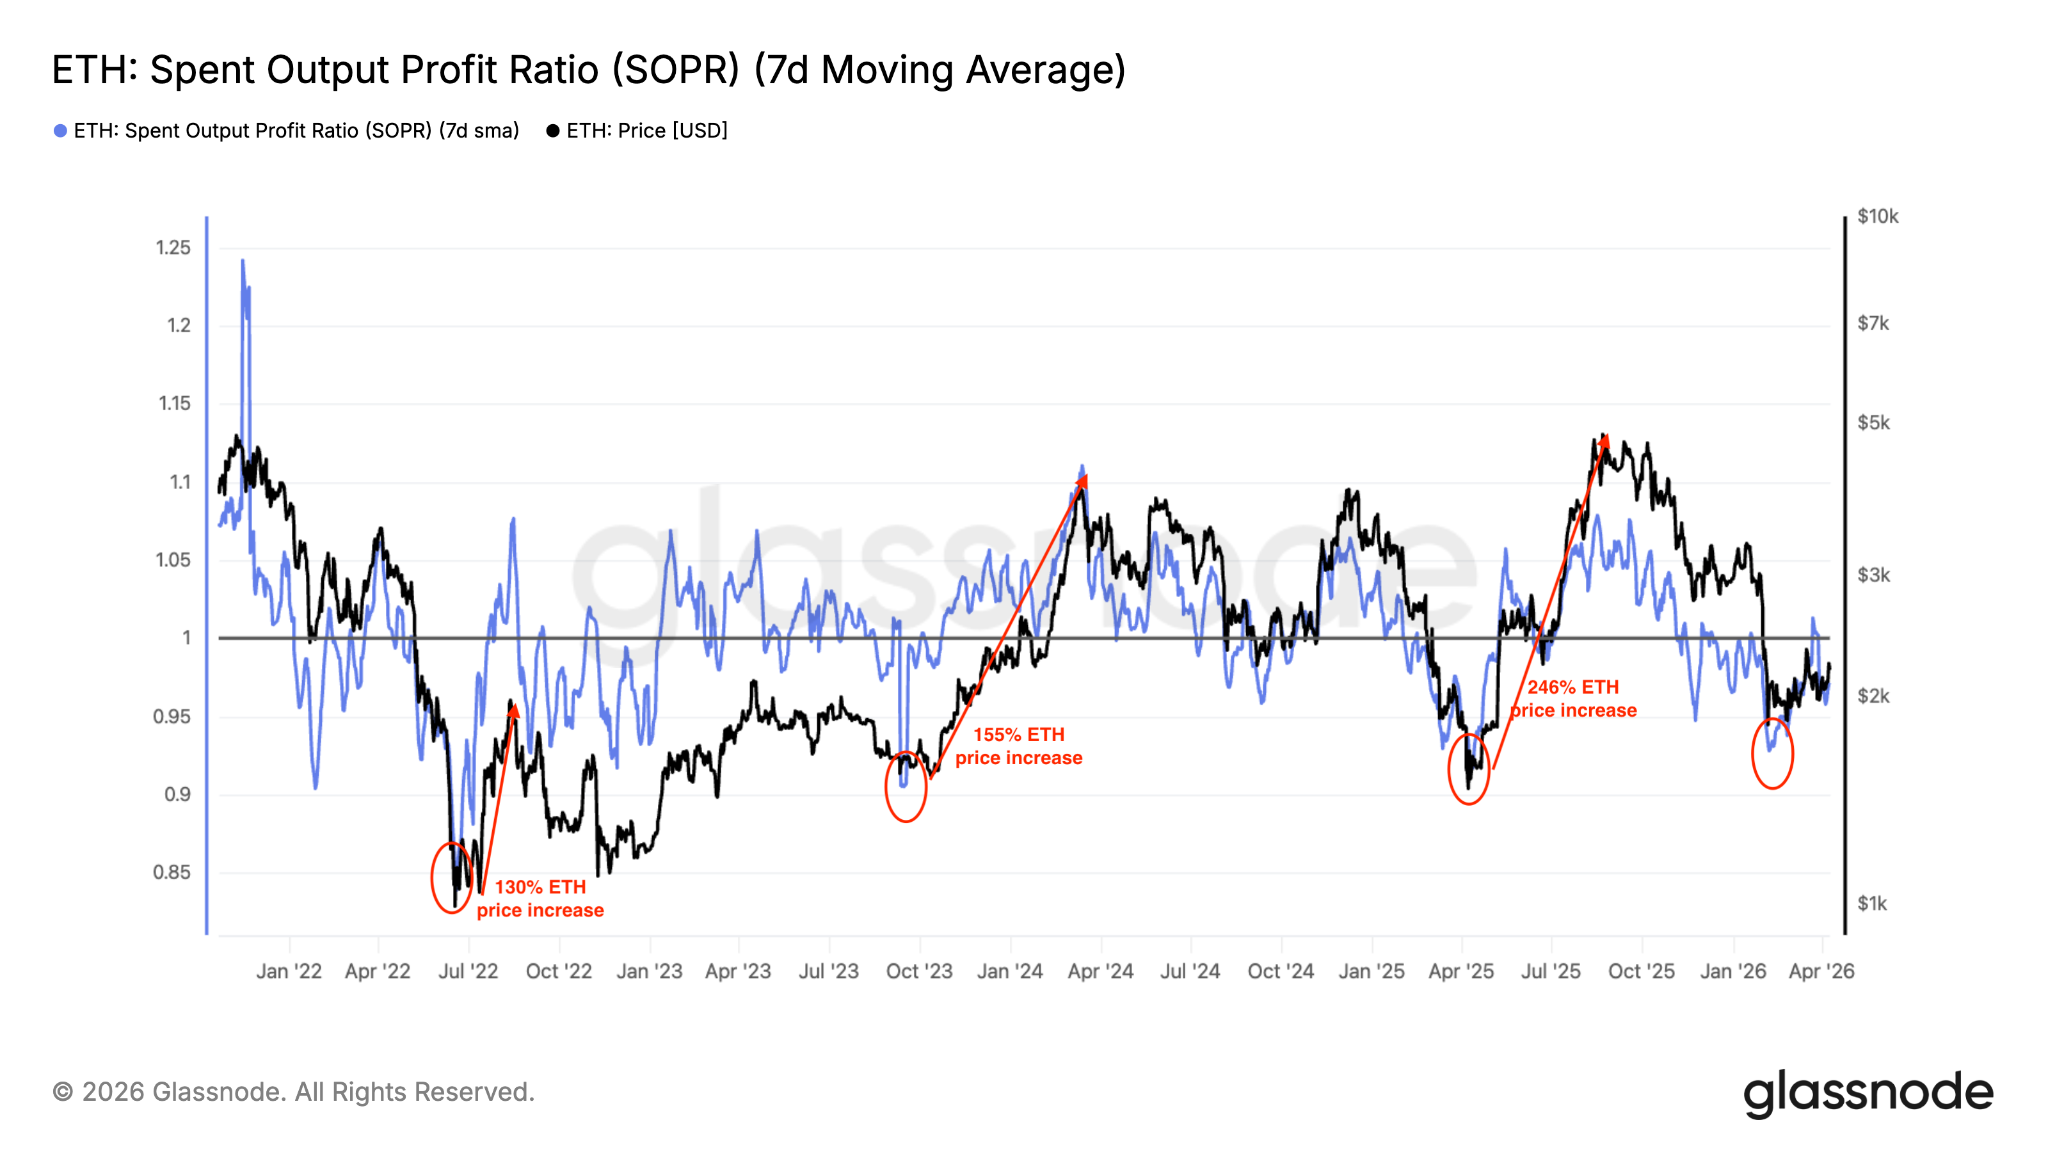
Onchain data shows that Ether’s Spent Output Profit Ratio (SOPR) is at 0.96, suggesting ETH investors are still selling at a loss.
This metric dropped as low as 0.92 on Feb. 6, implying that Ether’s price drop to $1,800 was driven by traders realizing losses amid panic and extreme fear.
Related: Ethereum stablecoin supply hits $180B all-time high: Token Terminal
SOPR measures the profit or loss of spent ETH outputs by comparing the value of coins when they were last moved to their value when they are spent again.
A value below 1 might suggest capitulation or a market bottom, potentially signaling a good time to buy.

Historically, this scenario has often preceded price recoveries. When SOPR fell to 0.86 following Ether’s drop to $1,500 in April, it was followed by a 246% price recovery to its current all-time high of $4,950.
Similar scenarios in 2022 and 2023 were followed by 130% and $155% ETH price rallies, respectively.
As such, some investors saw the drop to $3,000 as an opportunity to buy.
MVRV Z-Score suggests Ether bottomed at $1,800
Ether’s MVRV Z-Score, a key onchain metric used to identify market tops and bottoms, has dropped into the historical accumulation zone (the green line in the chart below), strengthening the argument that ETH may have found a bottom.

The last time Ether’s MVRV Z-score fell to the current levels was in April 2025, after a 66% price drawdown. This coincided with a macro market bottom at $1,400 and preceded a multi-month rally, with the ETH/USD pair rising 258% to its current all-time high of $4,950.
Meanwhile, the 0.80 MVRV pricing band, which has historically marked cycle bottoms, is currently at $1,880.

This indicates that, from an onchain perspective, Ether is undervalued and may continue the ongoing recovery, potentially rising toward dense liquidity clusters between $2,400 and $2,600 in the short term.
ETH price sits on strong support above $1,800
Data from TradingView shows that ETH price has successfully held above a key support zone over the last two months, as illustrated in the chart below.
This is the area around $1,800, where investors acquired more than 1.35 million ETH, according to Glassnode’s cost basis distribution heatmap.

This level aligns with a multi-year trendline that has historically marked the bottom for ETH/USD, as seen in 2022 and in April 2025.

Ether’s rebound from this level in early February suggests the trendline still holds as support, paving the way for a sustained recovery toward $4,800.
As Cointelegraph reported, a drop below $2,000, where the 20-day EMA and the 50-day SMA converge, could see the price drop toward the next major support at $1,750.
This article is produced in accordance with Cointelegraph’s Editorial Policy and is intended for informational purposes only. It does not constitute investment advice or recommendations. All investments and trades carry risk; readers are encouraged to conduct independent research before making any decisions. Cointelegraph makes no guarantees regarding the accuracy or completeness of the information presented, including forward-looking statements, and will not be liable for any loss or damage arising from reliance on this content.

Gunzilla Games, the developer behind NFT-incorporating battle royale game Off The Grid, has allegedly stopped paying staff as the shooter struggles to maintain its player base.
As reported by Insider Gaming, a number of Gunzilla employees have taken to LinkedIn to detail the state of affairs at the company.
The firm’s Talent Acquisition Lead, Anna Savina, claimed that employees had gone months without receiving their salary, and alleged that Gunzilla execs were ignoring requests for payment.
“I dedicated three years of my professional life to Gunzilla Games. I built teams, found top talent, and lived the company’s mission 24/7. Today, I’m forced to face a significant outstanding debt that covers several months of my professional life,” Savina said.
Read more: Otherside got $450M from Yuga Labs but its latest game is ‘virtually unplayable’
She now claims her “personal matter” has been resolved.
Anton Pali, a senior QA engineer, claimed that he’s gone five months without a paycheck from Gunzilla, and that the company’s CEO, Vlad Korolev, backtracked on promises to pay him in full.
Meanwhile, retired VFX animator Paul Creamer claimed, “Gunzilla Games has not paid its employees for many months but still expects them to work,” adding that he hasn’t been paid since October 2025 with some waiting even longer.
Creamer also claimed that in December, Korolev called his department to inform them that salaries would be paid, the firm is profitable, and that they should keep quiet about salaries.
He said, “He was not being truthful and now the company ignores our questions and removes our posts about what’s going on trying to silence us. Silence is what they’re hoping for, wishing that we’ll just quietly go away.”
It’s not just pay, either. Former biome artist Théa Dorangeon claims they were mistreated by former colleagues, and that the game’s artistic guidelines lacked clarity and drove artists “crazy.”
These are just a few of the upset employees who’ve taken to LinkedIn to air their grievances over delayed payments.
Gunzilla Games CEO defends salary delays
In response to the slew of allegations, Korolev admitted that the salaries have been delayed while also claiming that this was necessary for the company’s success. He described the salary revelations as “a new narrative from haters.”
He posted, “Yes, we are optimizing costs — like every company in gaming, crypto, and tech is doing right now. We have been doing this for over a year.”
“And yes, to not disrupt company operations, some payments may be scheduled in a way that works for the company’s cash flow — not always for everyone individually. That’s the reality of the world we live in.”
He went on, “But to protect the interests of our players and our full-time official employees — whose salaries, over six years, have never been delayed by more than a week — we operate at a pace that ensures the company continues moving forward.”
Read more: CZ cries FUD as anti-Binance posts flood X
“And of course, we honor every obligation. We apologize for any inconvenience this may have caused,” he said.
These explanations were buried near the end of his post, while the majority of his address was used to brag about player counts, subscriber numbers, and game updates.
Oddly, he offered a live dashboard for “those still spreading FUD” to see new players joining, but added that it would cost the viewer 100,000 GUNZ tokens to access.
The GUNZ token, which is utilized in Off The Grid’s in-game economy, is down almost 86% since its launch last year and at its current price, it would cost the viewer $1,649 to check this dashboard.
Off The Grid’s developer isn’t off the hook.
Some of the disgruntled workers are now trying to recover compensation through the European Union’s legal framework.
Vladyslav Spitkovskyi, Gunzilla’s senior game programmer, claims he hasn’t been paid since December 2025, and is now pursuing compensation in court.
He said, “The legal process for recovering unpaid compensation in the EU is well-defined, and the costs are relatively modest compared to what is owed.”
Savina also noted that she was undertaking formal steps within the EU legal framework.
Off The Grid was launched in 2024 and was one of the more mainstream video games to incorporate blockchain technology into its game store.
Read more: ‘Biggest NFT trading platform on TRON,’ AINFT, has $6 in volume
The game launched with a decent amount of player traction.
By 2025, publications reported it had 450,000 daily active players. However, this statistic was just active addresses holding its GUNZ token, and not a metric for actual players.
It initially struggled with a litany of optimization issues for console players, and reviews for the game have been less than stellar. On Steam, it now pulls in roughly 12,000 players a day.
In March 2025, Gunzilla acquired video game news outlet Game Informer after it was shut down by GameStop in 2024. All of its old staff were rehired in the process.
Off The Grid testers say they were paid inconsistently
Former Blockworks journalist Kate Irwin also shared this week that Off The Grid game testers told her that they weren’t being paid, or received incredibly late payments, for their work.
“On Glassdoor, you can also see reports of delayed payments going back years from people who say they worked at Gunzilla as full-time employees, not as contractors or freelancers,” Irwin added.
The testers told Irwin that there were at least 700 of them, and some suffered delayed payments. They claimed there was inconsistency across the wages of testers, while some said they were simply happy to be paid during the Ukraine-Russia war.
Irwin noted, however, that a third-party intermediary in charge of the payments may have been the problem, and not necessarily Gunzilla.
Protos has reached out to Game Informer and Gunzilla for comment and will update this piece should we hear anything back.
Got a tip? Send us an email securely via Protos Leaks. For more informed news and investigations, follow us on X, Bluesky, and Google News, or subscribe to our YouTube channel.

Former Crypto Czar David Sacks and CFTC Chair Michael Selig both called on the Senate to pass the Digital Asset Market Clarity Act (CLARITY Act) on Wednesday, April 9.
The posts arrived four days before the Senate returns from its Easter recess on April 13, with a Banking Committee markup targeted for late April.
Coordinated Pressure Before the Senate Reconvenes
Sacks, who recently concluded his role as White House AI and crypto czar, posted that the GENIUS Act had already established US leadership on stablecoins.
He argued the CLARITY Act would extend that to all other digital assets by providing clear regulatory rules.
“…the time to act is now. Senate Banking and then the full Senate should pass the market structure. I’m confident that they will. And then President Trump will sign this landmark bill into law,” Sacks emphasized.
Minutes earlier, Treasury Secretary Scott Bessent had called on the Senate Banking Committee to hold a markup and send the bill to the president’s desk.
CFTC chair Michael Selig also endorsed Bessent’s call and stated that he and Securities and Exchange Commission (SEC) Chair Paul Atkins are prepared to implement the legislation.
According to Selig, the bill is a way to protect digital asset markets from future regulatory reversals under a different administration.
In the same tone, SEC’s Paul Atkins urges Congress to future-proof against rogue regulators and advance comprehensive market structure legislation to President Trump’s desk.
“Project Crypto is designed so once Congress acts, SEC and CFTC are ready to implement the CLARITY Act,” wrote Atkins.
Late-April Window Carries High Stakes
Senator Cynthia Lummis confirmed the Banking Committee will attempt a markup in the second half of April.
Senator Bernie Moreno has warned that if the bill does not pass by May, digital asset legislation could stall until after the November 2026 midterms.
The CLARITY Act passed the House 294-134 in July 2025. The Senate Agriculture Committee advanced its portion in January 2026.
However, the Banking Committee has postponed its markup twice, first in January over stablecoin yield disputes and again in March.
Wednesday’s coordinated messaging from four senior administration-aligned figures suggests the White House is applying maximum pressure as the Senate’s final realistic window opens next week.
The post Trump’s Inner Circle Rallies Behind CLARITY Act Days Before Senate Returns appeared first on BeInCrypto.

Child dies from dog bite at property in North Yorkshire

The Trade Desk Is Now A Deep Value Stock (NASDAQ:TTD)
Binance’s CZ Offers OKX Founder $1 Billion Bet Over Divorce Dispute


-

 Business7 days ago
No Jackpot Winner and $194 Million Prize Rolls Over
-

 Fashion6 days ago
Weekend Open Thread: Spanx – Corporette.com
-

 Business4 days ago
Three Gulf funds agree to back Paramount’s $81 billion takeover of Warner, WSJ reports
-

 Business6 days ago
Expert Picks for Every Need
-

 Sports5 days ago
India men’s 4x400m and mixed 4x100m relay teams register big progress | Other Sports News
-

 Tech2 days ago
How Long Can You Drive With Expired Registration? What Florida Law Says
-
Business4 days ago
No Jackpot Winner, Prize to Climb to $231 Million
-

 Fashion3 days ago
Massimo Dutti Offers Inspiration for Your Summer Mood Board
-
Politics6 days ago
Wings Over Scotland | The quality of mercy
-

 Fashion2 days ago
Let’s Discuss: DEI in 2026
-

 Business5 days ago
Akebia Therapeutics, Inc. (AKBA) Discusses Pipeline Progress and Strategic Focus on Kidney Disease Treatments at R&D Day – Slideshow
-

 Fashion7 days ago
Statement Sunglasses: The Accessory Shaping Modern Fashion
-

 Crypto World1 day ago
Bitcoin recovers as US and Iran Agree a Ceasefire Deal
-

 Politics7 days ago
East Jerusalem Palestinian families eviction orders
-

 Politics7 days ago
Why so many children are now classified as ‘disabled’
-

 Fashion7 days ago
For Love & Lemons’ Spring 2026 Line is for the Romantics
-

 Politics7 days ago
Nuclear rockets, moon bases and NASA’s Mars plan
-

 Tech7 days ago
The Threadless Ball Screw Never Took Off, But Don’t Write It Off
-
 Business7 days ago
HPS FY 2025 slides: SaaS inflection drives 22% revenue growth
-

 Fashion6 days ago
Frugal Friday’s Workwear Report: Hammered Metallic Button Sweater Vest
You must be logged in to post a comment Login