
Crypto World
ChatGPT Maker Eyes Biggest US IPO With Amazon and Nvidia

OpenAI on Thursday confirmed a $110 billion valuation, fueling expectations that it could stage the largest IPO in US tech history if it moves forward with a public listing.
The company has not yet filed for an IPO. However, the valuation announced on February 27 positions OpenAI above several landmark Silicon Valley debuts and signals strong backing from major technology investors.
Who are the Big Tech Going All-In on OpenAI?
OpenAI has raised billions in private funding over the past few years. Its most significant backer remains Microsoft, which committed multi-year investments reportedly totaling around $13 billion through structured equity and cloud partnerships.
The new funding includes $30 billion from SoftBank, $30 billion from NVIDIA, and $50 billion from Amazon. Additional financial investors are expected to join as the round progresses.
Other major investors include Thrive Capital, Khosla Ventures, Sequoia Capital, and Andreessen Horowitz. These firms participated in earlier funding rounds as OpenAI scaled ChatGPT and enterprise AI infrastructure.
OpenAI Could be the Biggest IPO in US History
If OpenAI proceeds at this valuation, it would rank among the largest US tech IPOs ever. The scale of this funding dwarfs most historic IPO valuations.
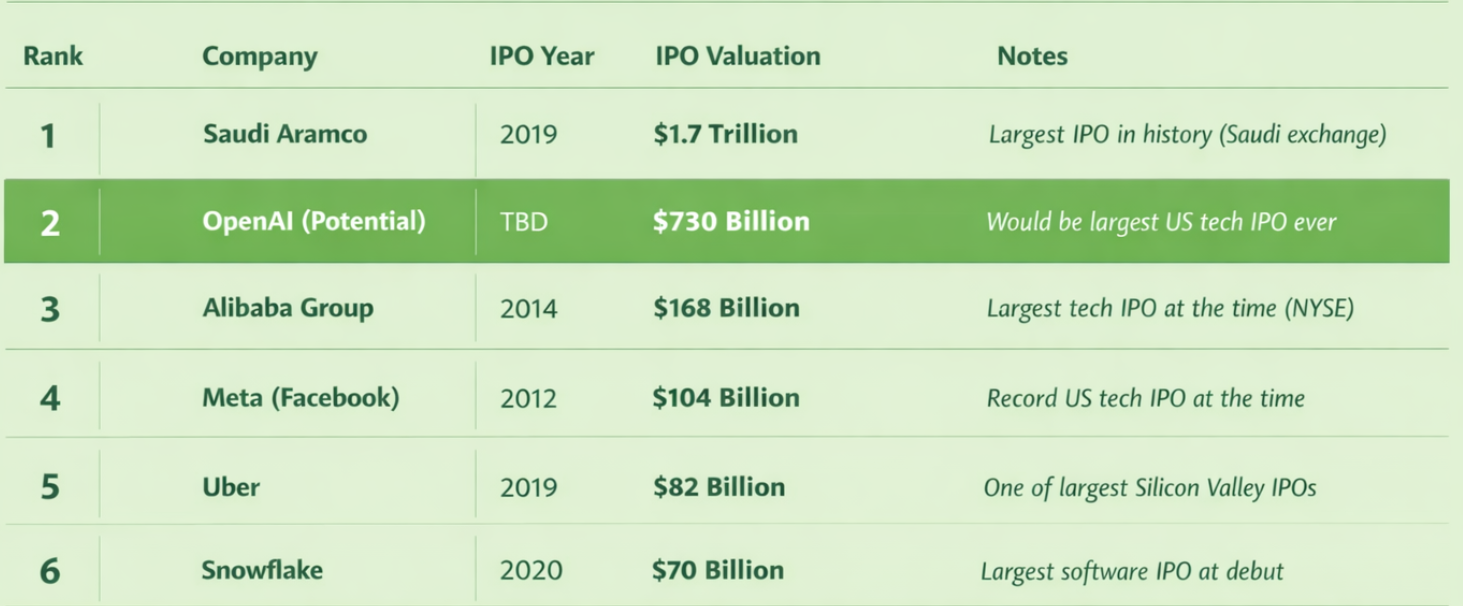
For comparison, Meta Platforms (Facebook) went public in 2012 at about $104 billion. Snowflake debuted in 2020 at roughly $70 billion. Alibaba Group was listed at around $168 billion in 2014.
Globally, Saudi Aramco still holds the overall IPO record at $1.7 trillion.
At a $730 billion valuation, OpenAI now stands in a different category.
If it proceeds to a public offering, it would likely rank as the largest US tech IPO ever, reflecting the scale of investor conviction behind frontier AI.
The company has not disclosed a potential listing date or share price range. Those details would emerge in a formal IPO filing.


Crypto prices are under further pressure during U.S. morning hours on Sunday after President Trump announced a blockade of the Strait of Hormuz.
“Effective immediately, the United States Navy … will begin the process of blockading any and all ships trying to enter, or leave, the Strait of Hormuz,” said the president in a social media post.
The president’s move came hours after Vice President J.D. Vance late Saturday announced that U.S. and Iranian negotiators had failed to agree to an extended ceasefire after long weekend meetings in Pakistan.
Trading above $73,000 for most of Saturday, bitcoin quickly pulled back to the $71,500 area following the Vance comments. In the minutes since President Trump announced the blockade, BTC has slid further to $70,900, now lower by 2.5% over the past 24 hours.


The largest traders have a problem: how to keep their activity quiet enough to not influence market prices or reveal any long-term strategies.
In traditional markets like equities, they’ve had that ability for decades through so-called dark pools and off-exchange venues. Even as far back as January 2025, more than half of all U.S. equities trading took place off public exchanges, according to Bloomberg data.
Crypto has never had an equivalent, and the absence is increasingly difficult to ignore. Every trade on Hyperliquid, every order on a decentralized exchange, is visible to anyone paying attention, and companies like DeFiLlama and Arkham exist to collect and present that data in a digestible way.
The crypto market, which prides itself on disrupting traditional finance, has replicated one of TradFi’s most persistent structural problems: If you’re big enough to move markets, everyone can see you coming. As a result, firms providing liquidity on public decentralized exchanges say their strategies get reverse-engineered quickly
“On Hyperliquid, one of the top market makers told us they have to rotate their trading strategies every three weeks because they get copied,” Denis Dariotis, co-founder of GoQuant, a crypto trading infrastructure firm backed by GSR, said in an interview. “That’s the alpha problem.”
There are other consequences, too. Market makers — the firms providing the liquidity that keeps crypto markets functioning — operate in full public view, and the industry has developed a habit of making them the villain whenever something goes wrong. Recent scrutiny of Jane Street‘s involvement in the Terra/Luna collapse is only the latest example. A large firm’s onchain activity gets traced, a narrative forms and the company spends weeks managing a PR crisis over trades that, on a traditional venue, would have been entirely unremarkable.
GoQuant’s answer is GoDark, a decentralized exchange (DEX) set to start up on Solana in May. That platform uses zero-knowledge proofs to conceal trade details not just from other market participants, but also from the node operators running the order book. The ambition is radical: a matching engine where nobody in the system can see what they’re matching.
The immediate question is whether that’s technically achievable at any useful speed. Zero-knowledge proofs are computationally expensive, and the architecture adds latency that privacy-agnostic systems don’t have to absorb. Internal testing puts order matching at 25 to 50 milliseconds — Dariotis frames this as fast relative to most decentralized exchanges, where execution often runs into the hundreds of milliseconds, and he’s right. But it’s also an order of magnitude slower than what’s available to firms co-located with a centralized exchange. For retail traders that gap probably doesn’t matter. For the market makers GoDark is banking on to provide liquidity, it might.
Which brings up the harder problem. A private exchange with no volume is just a dark room. GoDark’s plan to seed liquidity mirrors what Hyperliquid did with its HLP vault — users deposit funds, the funds get deployed as market-making liquidity, participants take a cut of fees and first access to liquidations.
It worked for Hyperliquid. But it has not worked for most of the DEXes that have tried to replicate the model since, which have generally seen volume collapse once the incentive period ends.
Then there is the regulatory question, which the team has so far avoided having to answer directly. Traditional dark pools are private in the narrow sense that they conceal pre-trade order information, but they operate under post-trade reporting requirements and regulatory oversight.
GoDark’s privacy is more absolute by design, it’s structurally incapable of producing a full audit trail. The inclusion of automated OFAC screening is a gesture toward compliance, but it is unlikely to satisfy regulators who have spent the past three years pushing crypto toward more transparency, not less. How that tension resolves — and whether it limits institutional participation to jurisdictions with lighter oversight — remains to be seen.
GoDark is separate from GoQuant’s existing institutional product of the same name, a spot DEX built with Copper and GSR that enters production next month and targets a different, narrower client base. The May launch is the retail-facing version.
Banks and corporates across Europe are moving beyond exploration and are now actively selecting infrastructure partners to support stablecoin adoption, according to Lamine Brahimi, co-founder and managing partner at crypto custody technology provider Taurus.
Brahimi told Cointelegraph that eighteen months ago, most conversations were still educational, focused on understanding stablecoins and their risks. Today, firms with board-level approval are preparing to go live. He said the introduction of Markets in Crypto-Assets Regulation (MiCA) has accelerated that transition by replacing fragmented national rules with a single regulatory regime.
“In the past twelve months alone some of Europe’s most stringent financial institutions are all arriving at the same conclusion, digital assets, including stablecoins, belong inside the existing banking stack, not beside it,” he said.

Corporate treasury teams are driving much of the demand. Initially focused on payments and settlement, companies are looking to use stablecoins to move funds faster, reduce costs and operate outside traditional banking hours, Brahimi said.
Related: Bank of France calls for tougher MiCA limits on stablecoin payments
Demand drives stablecoin adoption in Europe
Brahimi said adoption is increasingly driven by practical needs rather than long-term strategy. “Once clients start asking for better settlement, more flexibility, or more efficient cross-border movement of value, the conversation becomes much more immediate and much more practical,” he added.
On Thursday, ClearBank Europe announced that it has become the first Dutch credit institution to secure approval under MiCA to operate as a crypto asset service provider. A consortium of major European banks, including ING, UniCredit, CaixaBank and BBVA, is also developing Qivalis, a MiCA-compliant euro stablecoin initiative designed to enable regulated onchain payments and settlement across Europe.
European banks are also moving ahead with stablecoin initiatives. Societe Generale has positioned its stablecoins around cross-border payments, onchain settlement, FX and cash management, while Oddo BHF has launched a MiCA-compliant euro stablecoin. Meanwhile, a consortium of banks, including ING, UniCredit and BNP Paribas is preparing a Swiss-franc stablecoin for the second half of 2026.

Konstantin Vasilenko, co-founder and chief business development officer at Paybis, said the platform has seen rising demand for compatible stablecoins in Europe. Between October 2025 and March 2026, USDC (USDC) volume on Paybis in the EU climbed about 109%, while its share of total stablecoin activity increased from roughly 13% to 32%.
Vasilenko added that in the EU, Paybis stablecoin buy volume remained roughly five to six times higher than sell volume between October 2025 and March 2026. He also noted that average stablecoin transaction sizes were about 15% to 35% larger than typical Bitcoin (BTC) or Ether (ETH) trades. “That usually points to working capital, settlement use and more deliberate business flows,” he said.
Related: Hong Kong grants first stablecoin licenses to Anchorpoint and HSBC
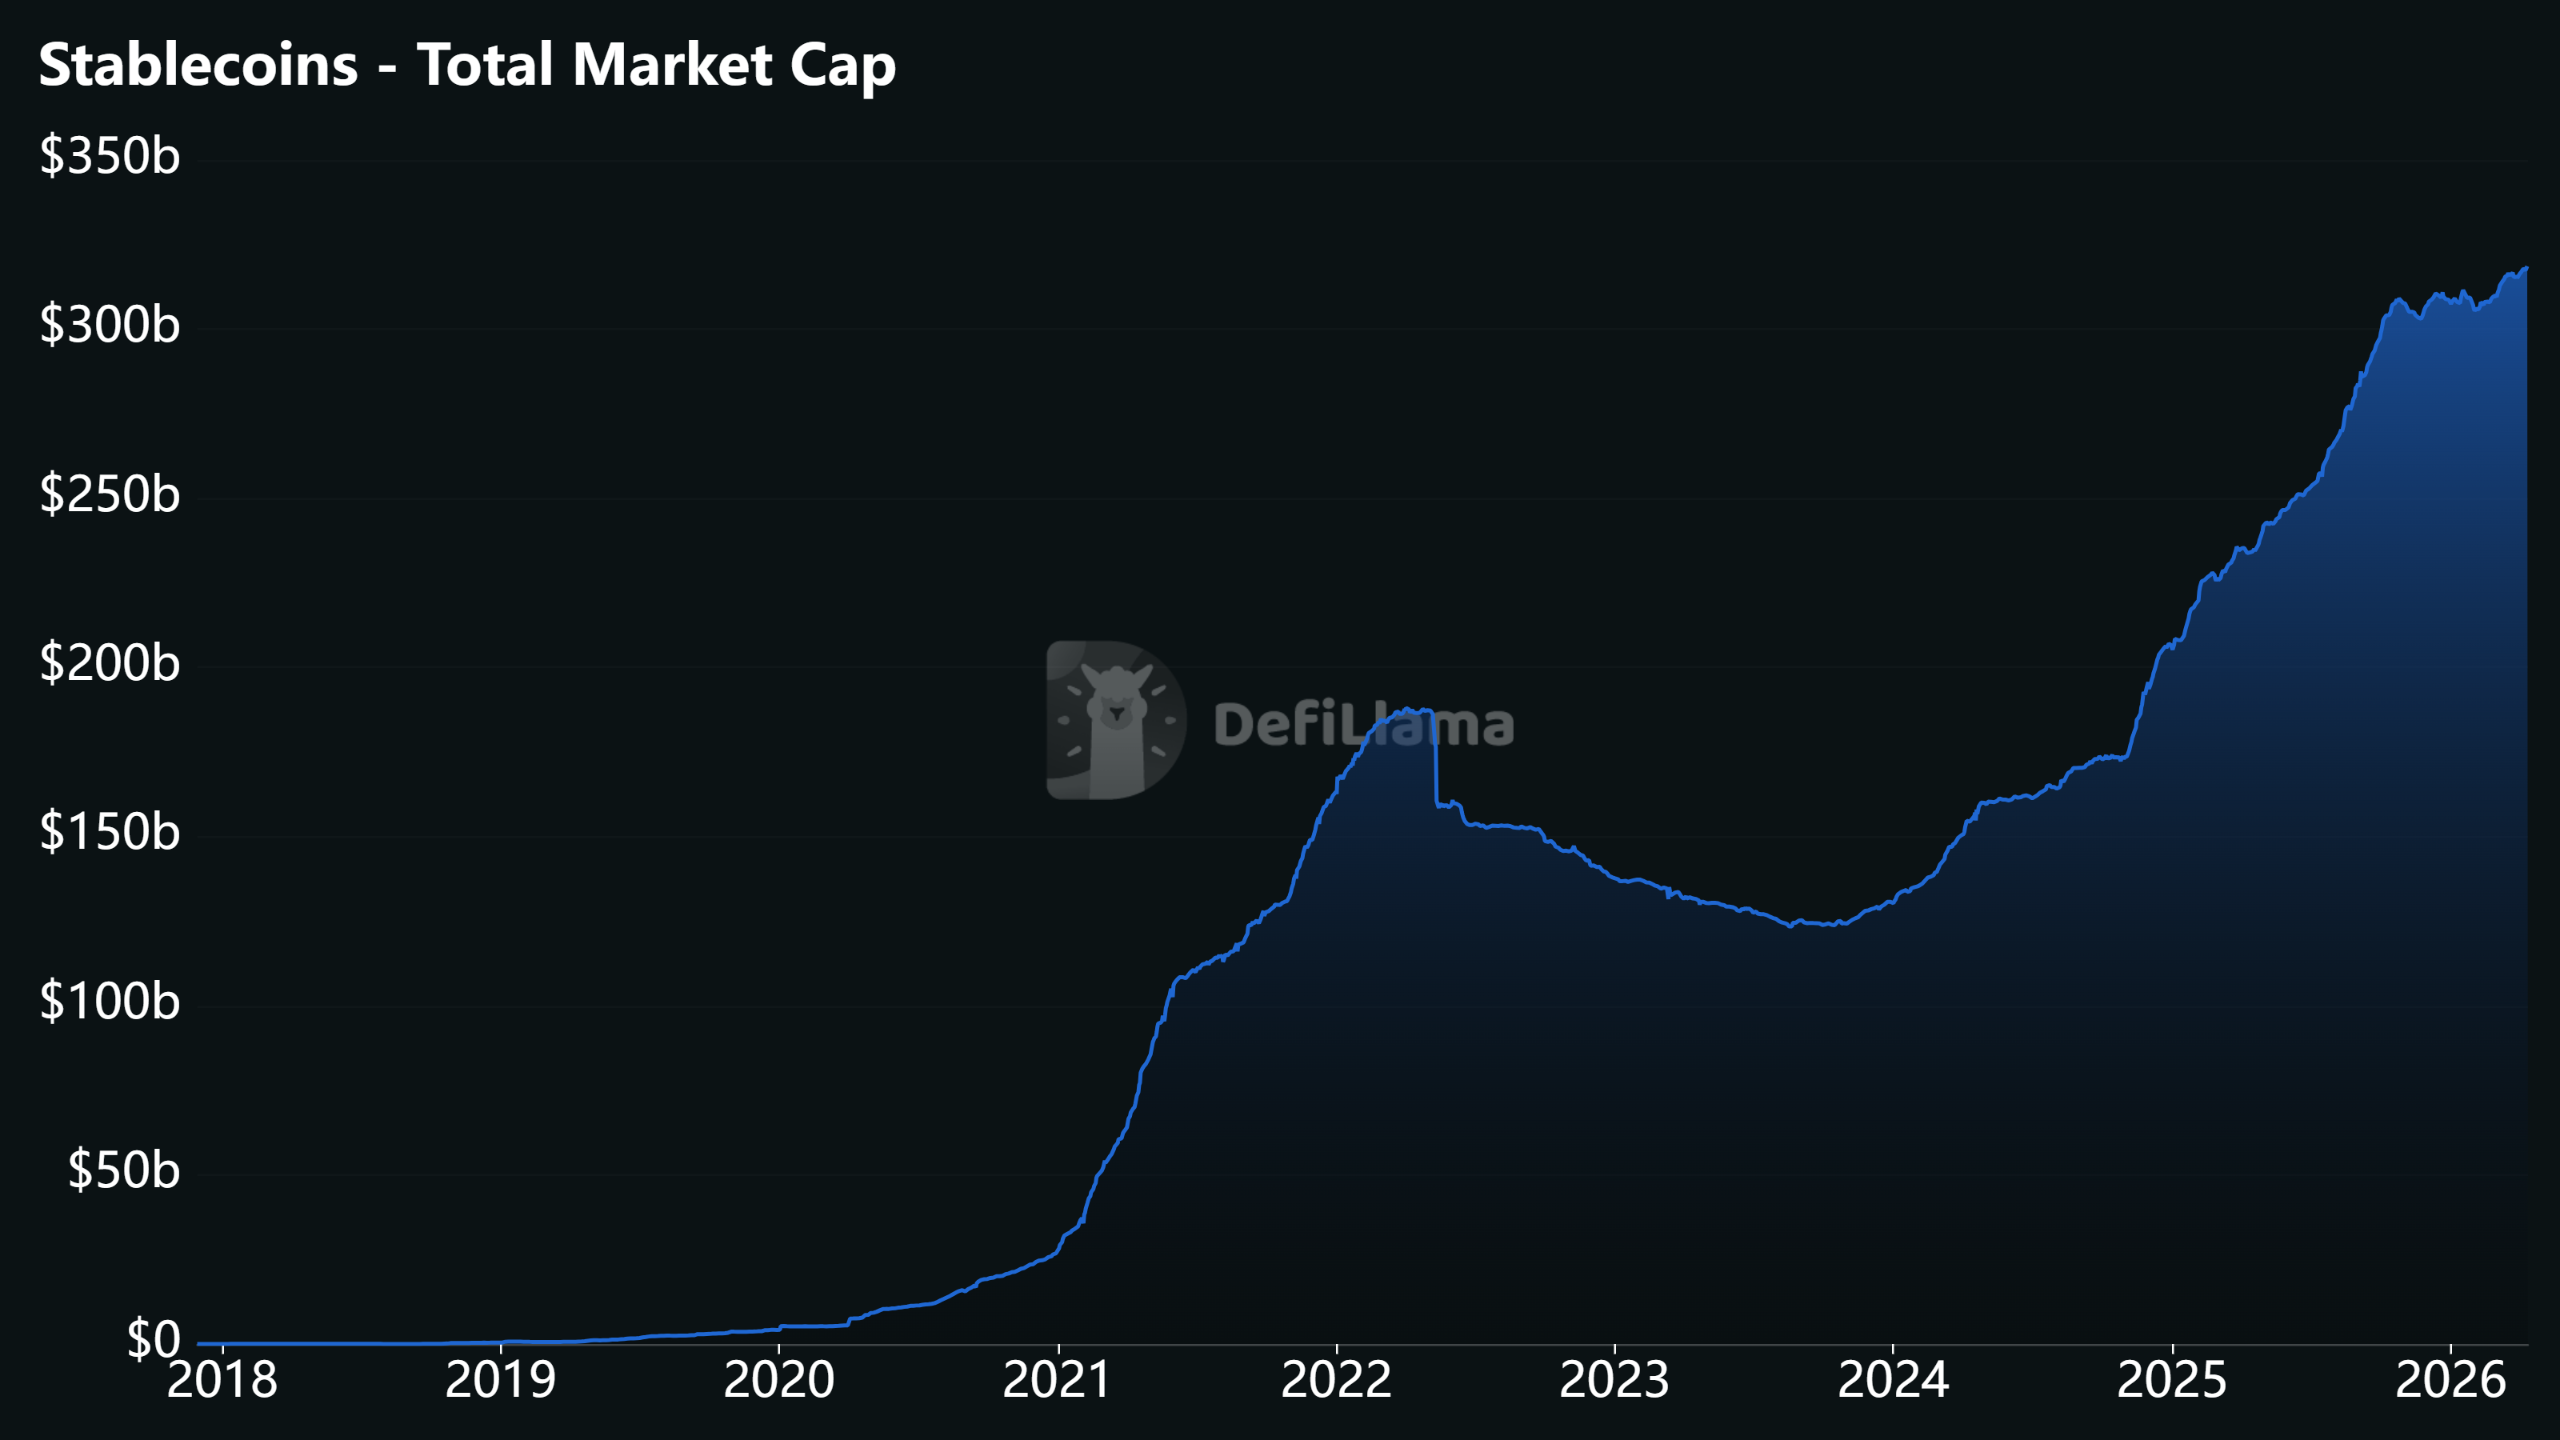
Stablecoin volumes could reach $1.5 quadrillion by 2035
A new report from Chainalysis projects that stablecoin transaction volumes could grow dramatically over the next decade, reaching as high as $719 trillion by 2035 under organic growth scenarios, up from about $28 trillion in 2025.
In a more aggressive scenario, volumes could climb to $1.5 quadrillion if stablecoins become a dominant payment infrastructure and wealth transfer from baby boomers to younger, more crypto-native generations accelerates adoption.
Will Harborne, CEO of stablecoin infrastructure provider Rhino.fi, said that stablecoins will become increasingly important for corporate treasury, cross-border settlement, and FX between euro and dollar stablecoins over the next few years.
“I think every business will eventually start accepting and using stablecoins in some form, and the companies that prepare early will be in the best position when that shift becomes mainstream,” he said.
Magazine: How crypto laws changed in 2025 — and how they’ll change in 2026

Polymarket briefly appeared in Google News results alongside established outlets when users searched for event-driven questions, but Google later confirmed the listing was an error and has since been removed. The incident, now described by Google as a temporary misindexing, comes as Polymarket and its rival Kalshi push to embed prediction-market data into mainstream platforms, deploying a mix of partnerships and wallet integrations to broaden access while navigating a shifting regulatory backdrop.
Before its removal, Polymarket links surfaced under mainstream coverage for queries such as “will ships transit the strait,” pairing market bets with accompanying news results. A Futurism report highlighted how a search on the Strait of Hormuz returned Polymarket outcomes alongside Reuters and The Guardian stories. In a subsequent test run by Cointelegraph, the same query did not surface Polymarket results, underscoring how fragile such appearances can be in search ecosystems.
Key takeaways
- Google News briefly surfaced Polymarket results for event-driven queries, but the listing was characterized by Google as an error and has been removed from News.
- Polymarket has been expanding its media presence through partnerships and platform integrations, including a Google Finance collaboration with Kalshi, plus high-profile ties with X and wallet projects like MetaMask and World App.
- Investor realities in prediction markets remain mixed: a small share of traders achieves meaningful profits, while the vast majority do not sustain high monthly earnings over time.
- Expect ongoing experimentation at the intersection of media, social platforms, and prediction markets, with regulatory uncertainty continuing to shape adoption.
Media surfaces and the fragile edge of prediction markets
The Google News incident illustrates how quickly prediction-market data can surface within mainstream information channels, even if only briefly. The Verge reported that Google said the appearance was an error and that Polymarket no longer shows up in News. While such episodes may be short-lived, they reveal an underlying strategy: Polymarket and Kalshi are intent on linking their forecasting markets with traditional media signals to boost discoverability and credibility beyond crypto-native audiences.
Historically, search and news integrations have been a proving ground for how reliably prediction-market content can coexist with standard journalism. The example cited by Futurism—where a search for an ongoing geopolitical question produced Polymarket bets next to established outlets—demonstrates both the potential reach and the volatility of such integrations. The takeaway for traders and users is that discovery channels may be temporary and context-dependent, reinforcing the notion that prediction markets work best when embedded in trusted, regulated environments rather than as fleeting search-index byproducts.
A push to embed Polymarket in mainstream platforms
Polymarket and Kalshi have been pursuing broad media and data distribution strategies for more than a year. Notably, Google partnered with both platforms to bring their data into Google Finance, a collaboration that signals an appetite to translate prediction-market signals into familiar financial interfaces. The move places outcome-based markets alongside traditional financial data streams, potentially widening the audience beyond crypto enthusiasts.
The momentum isn’t limited to Google. In June, Elon Musk’s X publicly announced a partnership naming Polymarket as its official prediction-market partner, a move framed as integrating forecast-based thinking into the social-media experience. This collaboration suggests a broader ambition to normalize prediction markets as a forecasting tool within digital communities and real-time events, rather than relegating them to niche crypto spaces.
Further, in October, MetaMask said it would integrate Polymarket as part of a broader push to broaden access beyond a crypto wallet to a more inclusive “democratized finance” gateway. World App, the digital wallet and identity platform from Sam Altman’s World project, also added Polymarket to its app ecosystem. Taken together, these partnerships illustrate a concerted effort to place Polymarket’s forecasting markets where users already manage identities and finances, reducing friction for entry and usage.
These moves are generally framed as ways to diversify user bases and improve liquidity by tapping into platforms with established user engagement. However, they also bring new layers of regulatory scrutiny, given the evolving legal status of prediction markets in different jurisdictions and the potential for consumer protection concerns when forecasting political or geopolitical outcomes. Still, the cross-platform strategy signals a clear editorial and product direction: forecast-based markets want to be as accessible and visible as traditional financial data, even when their underlying contracts remain distinct in risk and structure.
Profitability realities for Polymarket traders
Beyond platform reach, discussions about profitability on Polymarket have highlighted a more sober picture. A Crypto analytics perspective highlighted that only a small portion of traders achieve meaningful and sustained profits. Specifically, about 1% of traders exceeded $5,000 in profit in a single month, but only 0.015% managed to maintain that level for four consecutive months. On cumulative terms, roughly 0.033% of wallets surpassed $100,000 in total profits, a signal that professional or highly active traders dominate the higher echelons of profitability while most participants struggle to maintain consistent gains.
These figures mirror broader questions about the economics of prediction markets: while the concept is compelling—crowdsourced forecasting with real-time risk pricing—the practical path to sustained profitability is narrow, given the blend of volatility, liquidity, and information asymmetries that characterize event-driven markets. For investors and builders, the takeaway is that the field still rewards specialized strategies and disciplined risk management, rather than broad, casual participation. The data also underline why media partnerships and easier access points matter: lower barriers to entry can attract more participants, but sustaining profitability requires skill, data access, and sound discipline.
For readers seeking deeper context, previous coverage from Cointelegraph highlighted how traders with disciplined approaches have navigated Polymarket’s liquidity and event-focused markets, though profitability remains uneven and sensitive to event outcomes, market sentiment, and timing.
What to watch next for Polymarket and the prediction-market space
Looking ahead, the convergence of media visibility, platform integrations, and heightened public discourse around forecasting raises several questions. Will more mainstream technology platforms adopt prediction-market data as a standard feature, and if so, what safeguards and regulatory guardrails will accompany such integrations? How will trader behavior adapt as interfaces become more familiar to non-crypto users, and what does that mean for liquidity and volatility during high-stakes events?
Observers should monitor whether these partnerships translate into tangible increases in mainstream adoption or if they remain primarily branding and distribution plays. The ongoing regulatory environment will likely shape both the speed and scope of embedding forecast markets within consumer platforms. For now, Polymarket’s outreach through Google Finance, X, MetaMask, and World App marks a notable push to reposition forecast markets as part of the broader financial-information ecosystem—and a test of how far mainstream platforms will go in embracing probability-based forecasting as a normal feature of everyday decision making.
As the ecosystem evolves, readers should stay attentive to how search indexing quirks, regulatory updates, and platform policy changes influence accessibility and reliability of Polymarket’s markets, and what that means for traders seeking to navigate this unique, high-variance corner of crypto finance.
Readers should watch ongoing developments in media integrations and platform partnerships, as they will influence access, liquidity, and the perceived legitimacy of prediction markets within both crypto-native and mainstream audiences.
Crypto World
Altria Group (MO) Stock: Valuation Models Signal Upside Despite Mixed Analyst Sentiment

Key Takeaways
- MO shares finished trading at $66.80, delivering 26.9% returns over 12 months and an impressive 91.9% gain across five years
- Intrinsic valuation via DCF methodology reaches $99.44 per share, suggesting the stock trades at a 32.8% discount
- Current P/E multiple of 16.12x falls short of the calculated Fair Ratio at 23.27x, indicating potential undervaluation
- Company declared $1.06 quarterly dividend, translating to a 6.3% annual yield, with April 30 payment date
- Wall Street maintains “Hold” rating with average price objective at $65.75
Altria Group (MO) has delivered impressive returns to shareholders recently. The tobacco giant’s shares settled at $66.80, representing year-to-date appreciation of 16.6% and a robust 26.9% advance over twelve months. Looking further back, the five-year return reaches 91.9%.
Such robust performance inevitably leads investors to wonder: is there more upside ahead, or has the rally exhausted itself?
MO shares began Friday’s session at $67.52. The 50-day moving average currently stands at $66.41, while the 200-day average tracks at $62.59. Over the past year, the trading range has extended from a low of $54.70 to a peak of $70.51.
The company’s fourth-quarter results showed earnings per share of $1.30, falling marginally short of analyst expectations at $1.32. Top-line performance fared better, with revenue reaching $5.08 billion versus the $5.02 billion consensus forecast.
Wall Street projects full-year earnings of $5.32 per share for the ongoing fiscal period.
Fundamental Analysis Indicates Discount to Fair Value
Utilizing a 2-Stage Free Cash Flow to Equity discounted cash flow framework, Altria’s fair value calculates to $99.44 per share. This assessment incorporates trailing twelve-month free cash flow of $9.11 billion, with projections reaching $9.31 billion by 2028.
Measured against the prevailing market price of $66.80, this methodology points to a meaningful 32.8% discount — flagging the stock as potentially undervalued.
Price-to-earnings analysis reinforces this conclusion. MO currently commands a 16.12x earnings multiple. While this exceeds the tobacco sector average of 12.27x, it trails the peer group average of 18.63x. Simply Wall St’s calculated Fair Ratio for Altria sits at 23.27x, further supporting the undervaluation thesis.
The company maintains a market capitalization of $112.85 billion, with a PEG ratio of 2.85 and beta of 0.41 — indicating lower volatility relative to broader equity markets.
Distribution Policy and Ownership Patterns
Management declared a $1.06 per share quarterly distribution, scheduled for April 30 payment. The ex-dividend date occurred on March 25. This translates to $4.24 annually and generates a 6.3% yield.
The current payout ratio registers at 103.16%.
Recent institutional activity shows Westbourne Investments establishing a fresh position valued at approximately $995,000 during Q4, acquiring 17,261 shares. Multiple other institutional players expanded holdings, including V Square Quantitative Management, Yarger Wealth Strategies, and Powers Advisory Group. MH & Associates Securities Management initiated a position worth roughly $2.72 million.
Institutional ownership currently represents 57.41% of outstanding shares.
Street Sentiment and Corporate Transactions
Wall Street opinion remains divided. UBS maintains a buy recommendation with a $74 price objective. Citigroup holds a neutral stance at $65. Barclays carries an underweight rating at $63. Jefferies assigns an underperform rating with a $50 target.
The aggregate consensus lands at “Hold” with a mean price target of $65.75 — marginally below current trading levels.
Regarding insider transactions, SVP Charles N. Whitaker disposed of 27,908 shares on March 5 at an average price of $67.57, generating proceeds of approximately $1.89 million. This sale reduced his holdings by 13.37%. His remaining position totals 180,869 shares.
Company insiders collectively control 0.08% of outstanding equity.


TLDR:
- Quantum Safe Bitcoin works within Bitcoin’s existing consensus rules, requiring no soft fork or miner signaling.
- Each QSB transaction costs between $75 and $200 due to heavy off-chain GPU computation requirements.
- QSB replaces ECDSA signature security with hash-based proofs that quantum computers cannot easily break.
- Levy frames QSB as a last-resort emergency tool, not a substitute for long-term fixes like BIP-360.
A StarkWare researcher has introduced Quantum Safe Bitcoin (QSB), a hash-based scheme that makes Bitcoin transactions resistant to quantum attacks today, without requiring any changes to the protocol.
The method works under Bitcoin’s existing consensus rules, needing no soft fork or miner signaling. However, the protection comes at a steep price — each transaction costs between $75 and $200, driven by intensive off-chain GPU computation.
Quantum Safe Bitcoin Requires No Protocol Changes
Quantum Safe Bitcoin (QSB) comes from StarkWare researcher Avihu Levy. The scheme enables quantum-resistant Bitcoin transactions on the live network today. Importantly, it works within Bitcoin’s existing consensus rules without requiring a soft fork.
Bitcoin currently secures transactions using ECDSA signatures. These are safe against classical computers but vulnerable to quantum attacks. A powerful enough quantum computer could theoretically derive a private key from a public key, compromising user funds.
QSB tackles this by replacing signature-based security with hash-based proofs. These work like tamper-proof mathematical fingerprints. Even advanced quantum computers would struggle to forge or reverse them.
The proposal improves on an earlier concept called Binohash. That system added extra computational layers but still relied on cryptography that quantum computers could break. QSB eliminates that weakness by moving security entirely to hash functions.
This puts QSB in direct contrast with BIP-360, the long-term quantum resistance proposal merged into Bitcoin’s improvement repository in February.
BIP-360 lacks a Bitcoin Core implementation and faces years of governance uncertainty. QSB bypasses all of that by working under rules that already exist.
Transactions Could Cost Up To $200 Each
The trade-off with QSB is significant. Generating a valid transaction means searching through billions of possible candidates using off-chain GPU computation. Levy estimates these costs between $75 and $200 per transaction, compared to Bitcoin’s current average fee of around 33 cents.
QSB transactions also cannot flow through Bitcoin’s standard mempool. Instead, users would need to route them directly to miners willing to include them. That alone adds friction that most everyday users are not equipped to handle.
Compatibility is another concern. QSB does not work with the Lightning Network and requires outsourcing computation to external hardware. Levy himself frames the scheme as a last-resort emergency tool, not an everyday payment method.
BIP-360 remains the preferred long-term path for quantum resistance on Bitcoin. However, Polymarket bettors give it low odds of activating this year.
Bitcoin’s governance track record backs that skepticism — Taproot took over seven years from concept to deployment. For now, QSB offers a costly but functional safety net if a quantum threat arrives before the protocol catches up.


Bitcoin traded lower Sunday as geopolitical risks resurfaced after U.S. Vice President JD Vance said peace talks involving Iran held in Pakistan had failed.
But beyond the macro noise, crypto-specific drivers continued to point toward a potential move toward $88,000 and higher, though outcomes remain dependent on how broader risk conditions evolve.
Bullish flows
Starting with market flows, sentiment has remained constructive. Strategy, the world’s largest publicly listed bitcoin holder, said it purchased $330 million worth of bitcoin last week, lifting its total holdings to 766,970 BTC. Some estimates suggest Strategy’s STRC-related activity has added roughly 8,000 bitcoin so far this week.
If that wasn’t enough, U.S.-listed spot bitcoin ETFs—widely seen as a proxy for institutional demand—recorded net inflows of $787 million this week, according to data from SoSoValue. That marks the strongest weekly inflow since early March. Since then, these funds have attracted nearly $2 billion in cumulative investor capital.
“These are not yet massive flows in absolute terms, but the direction and persistence matter: with MicroStrategy buying and ETFs absorbing supply, downside risk is structurally capped as long as these flows and the technical picture hold,” said Markus Thielen, founder of 10x Research, in a note to clients on Sunday.
Thielen’s base case is now a rally toward $88,000, driven not only by flows but also by oversold signals from technical indicators such as stochastic oscillators, along with improving risk appetite across related markets, including mining equities and broader equities.
Publicly listed miners such as TeraWulf (WULF), Bitdeer Technologies (BITDEER), and IREN Limited have climbed between 10% and 30% this month. Broader U.S. equities have also rebounded, with the S&P 500 rising 4%, while AI-heavyweights such as Nvidia gained around 6%.
“The recent performance of bitcoin miners, particularly those pivoting toward AI hosting, signals that the market is rotating back into the AI capex and growth theme, with Iran-related risk increasingly looking like a sideshow,” Thielen said.
“Taken together, this shifts our base case firmly to the upside, with $88,000 as our primary near-term target. The confluence is rare: technicals are constructive, flows are positive and broadening, and the market is demonstrating a clear willingness to look through geopolitical noise,” he noted,
Other widely tracked indicators of demand are also flashing supportive signals. For instance, the Coinbase Premium Index – which measures the price gap between bitcoin on Nasdaq-listed Coinbase and offshore exchange Binance – has climbed to 0.0586%, its highest level since October, according to data from Coinglass.
The move suggests relatively stronger buying pressure from U.S. investors compared with offshore markets, a dynamic often associated with bullish phases in crypto markets.
Clarity act
Matt Mena, senior crypto research strategist at 21Shares, said the potential passage of the Clarity Act later this quarter provides a “well-defined structural path” for further upside in crypto markets. The legislation, which aims to establish clearer jurisdictional boundaries between the SEC and the CFTC and to define when a digital asset is a security or a commodity, is widely viewed as a key regulatory milestone that could reduce long-standing uncertainty for bitcoin and the broader crypto sector.
Polymarket traders are currently pricing in a 65% probability that the Clarity Act will be signed into law this year. While the bill passed the House in July 2025, it is currently stalled in the Senate.
“With the potential passage of the Clarity Act later this quarter, the structural path for a significant expansion is well-defined. Reclaiming $73,000 clears the runway for a $75,000 test, which would likely provide the firepower for a rapid move through $80,000 toward the $90,000 corridor. Combined with a neutral inflation backdrop, a $100,000 milestone by the end of Q2 remains a possible outcome,” he said in an email.
Inflation and on-chain dynamics
On the macro front, recent inflation data came in broadly mixed but leaned softer on underlying pressures. The consumer price index (CPI) rose 0.9% month-on-month, lifting the annual rate to 3.3%, largely driven by a 10% jump in energy prices.
However, core CPI – which strips out food and energy – rose just 0.2% on the month and 2.6% year-on-year, both 0.1 percentage points below expectations. The print suggests that underlying price pressures remain contained even as headline inflation is distorted by volatile energy costs.
For markets, that distinction matters. If inflation continues to moderate beneath the surface, the Federal Reserve may be able to look through temporary energy-driven spikes and maintain a more flexible policy stance later this year. A steady or more accommodative rate path typically supports liquidity conditions, which tends to benefit risk assets such as equities and cryptocurrencies, including bitcoin.
Lastly, Vikram Subburaj, CEO of India-based FIU-registered Giottus exchange, pointed to supply dynamics which suggests prices are unlikely to face any resistance between $70,000 and $80,000.
“Supply distribution data indicates that only about 1 percent of circulating Bitcoin lies between $72,000 and $80,000. This suggests that a sustained break above current resistance could lead to relatively faster price discovery due to thinner overhead supply,” he said in an email.
Taken together, these factors suggest that while geopolitical risks continue to dominate headlines, underlying crypto market structure remains supportive of potential upside in bitcoin—assuming broader risk conditions do not materially deteriorate.
Crypto World
Robinhood (HOOD) Expands Prediction Markets While Eliminating Risky Contract Categories

TLDR
- Robinhood shares slid 1.33% on Friday, ending the session at $69.19
- The brokerage is growing its prediction market offerings while eliminating certain high-risk contract categories
- “Mention Markets” contracts — wagers on specific words in public speeches — were discontinued due to abuse and manipulation risks
- The company collaborates with regulated U.S. platforms Kalshi and ForecastEx instead of crypto-based competitors like Polymarket
- CEO Vlad Tenev described prediction markets as the company’s “fastest-growing business ever” in 2025, with 12 billion contracts exchanged
Robinhood continues to scale its prediction markets operation, but the company is establishing firm boundaries around which contract types it will make available to traders.
The brokerage has eliminated specific event-based contracts from its offerings, particularly “Mention Markets” — instruments allowing traders to wager on whether certain words will appear in speeches or corporate earnings calls. According to Robinhood UK President Jordan Sinclair, these contracts were discontinued over concerns related to potential market abuse and insider trading vulnerabilities.
“We don’t necessarily offer all prediction markets or all event contracts,” Sinclair explained. “There are some we’ve chosen that aren’t right for our customers.”
This move arrives as prediction market platforms encounter heightened regulatory examination. Multiple prominent incidents have sparked concern throughout the sector.
Substantial, suspiciously-timed wagers emerged before a U.S. military operation targeting Iran. Israeli law enforcement brought charges against two people accused of exploiting classified defense intelligence to place bets. Trading volume also spiked prior to a Nobel Peace Prize reveal, prompting an official leak probe.
Beyond geopolitical events, a former editor associated with a popular YouTube channel paid a $20,000 penalty for wagering based on insider knowledge of unreleased video content.
These incidents demonstrate how prediction markets become vulnerable to exploitation when results depend on confidential information.
Choosing Compliance Over Decentralization
Robinhood has deliberately partnered with Kalshi and ForecastEx — both operating as regulated entities within the United States that mandate identity verification and comply with federal oversight frameworks. This approach contrasts sharply with Polymarket, which permits users to participate through cryptocurrency wallets requiring minimal personal verification.
For a publicly traded corporation, this strategic choice carries significant implications. Minimizing connections to unregulated platforms helps mitigate both legal exposure and potential damage to corporate reputation.
Robinhood views the prediction market sector as a substantial revenue generator. The firm projects approximately $300 million in annual revenue from this business line.
CEO Vlad Tenev characterized prediction markets as the platform’s “fastest-growing business ever” during 2025. Throughout that year, more than 12 billion contracts changed hands on the platform.
Tenev has additionally suggested the market might enter a “supercycle” phase, potentially reaching trillions in yearly trading volume eventually — though he provided no specific timeframe for such expansion.
HOOD Stock Performance on Friday
Robinhood’s stock decreased 1.33% during Friday’s trading, settling at $69.19.
Analyst sentiment toward the stock remains strongly positive. Aggregating 17 analyst assessments, HOOD holds a Strong Buy consensus rating. The mean price target stands at $106.20, implying a potential upside of 53.49% from Friday’s closing price.
Robinhood’s decision to discontinue Mention Markets comes after previous enforcement actions where individuals faced penalties for insider trading connected to comparable contract structures.


Ripple has issued another warning to the XRP community after a fake Instagram account appeared to impersonate Chief Executive Officer Brad Garlinghouse.
Summary
- A fake Instagram account posed as Brad Garlinghouse and promoted an XRP giveaway scam to users.
- David Schwartz warned the XRP community that Ripple executives will never ask for funds online.
- Ripple repeated that fake support channels, deepfakes, and giveaway posts remain common crypto scam tools.
The case added to a long list of social media scams that use Ripple’s name to target crypto users.
A fake Instagram account posing as Ripple CEO Brad Garlinghouse has been flagged in a new warning to XRP holders. The account reportedly contacted users and promoted an XRP giveaway.
Ripple CTO Emeritus David Schwartz drew attention to the case on social media. He pointed to an older post from 2019 that described a similar message sent from an account pretending to be Garlinghouse.
The message followed a common scam pattern. It asked a user to send XRP first and promised to send back a larger amount later.
Schwartz made clear that the Instagram account was not linked to the Ripple CEO. His response served as a direct warning that the account was fake.
Crypto giveaway scams often copy the names and images of well-known figures. They usually promise free tokens and try to pressure users into acting fast.
In this case, the fake account used Brad Garlinghouse’s identity to build trust. It then pushed the false claim that users could receive more XRP after sending funds.
The warning also comes as deepfake videos and fake support accounts remain common across social media. Scammers often use these tactics to make fake promotions appear real.
Schwartz’s message repeated a point Ripple has made before. Any request to send XRP in exchange for a larger return should be treated as a scam.
Ripple repeats safety guidance to XRP community
Ripple has said in earlier notices that it will never ask users to send XRP. The company has also warned that fake livestreams, fake giveaways, and fake support channels are often used in fraud attempts.
Ripple has also stated that it does not operate an official Telegram channel. Any account claiming to represent Ripple there should be treated with caution.
The company has told users that its staff will not ask for wallet details, passwords, personal data, or payments through unofficial channels. That guidance also applies to messages that appear to come from executives.
The latest scam alert keeps that message in focus. Ripple employees, including Garlinghouse, will not ask users to send funds or join suspicious investment offers.
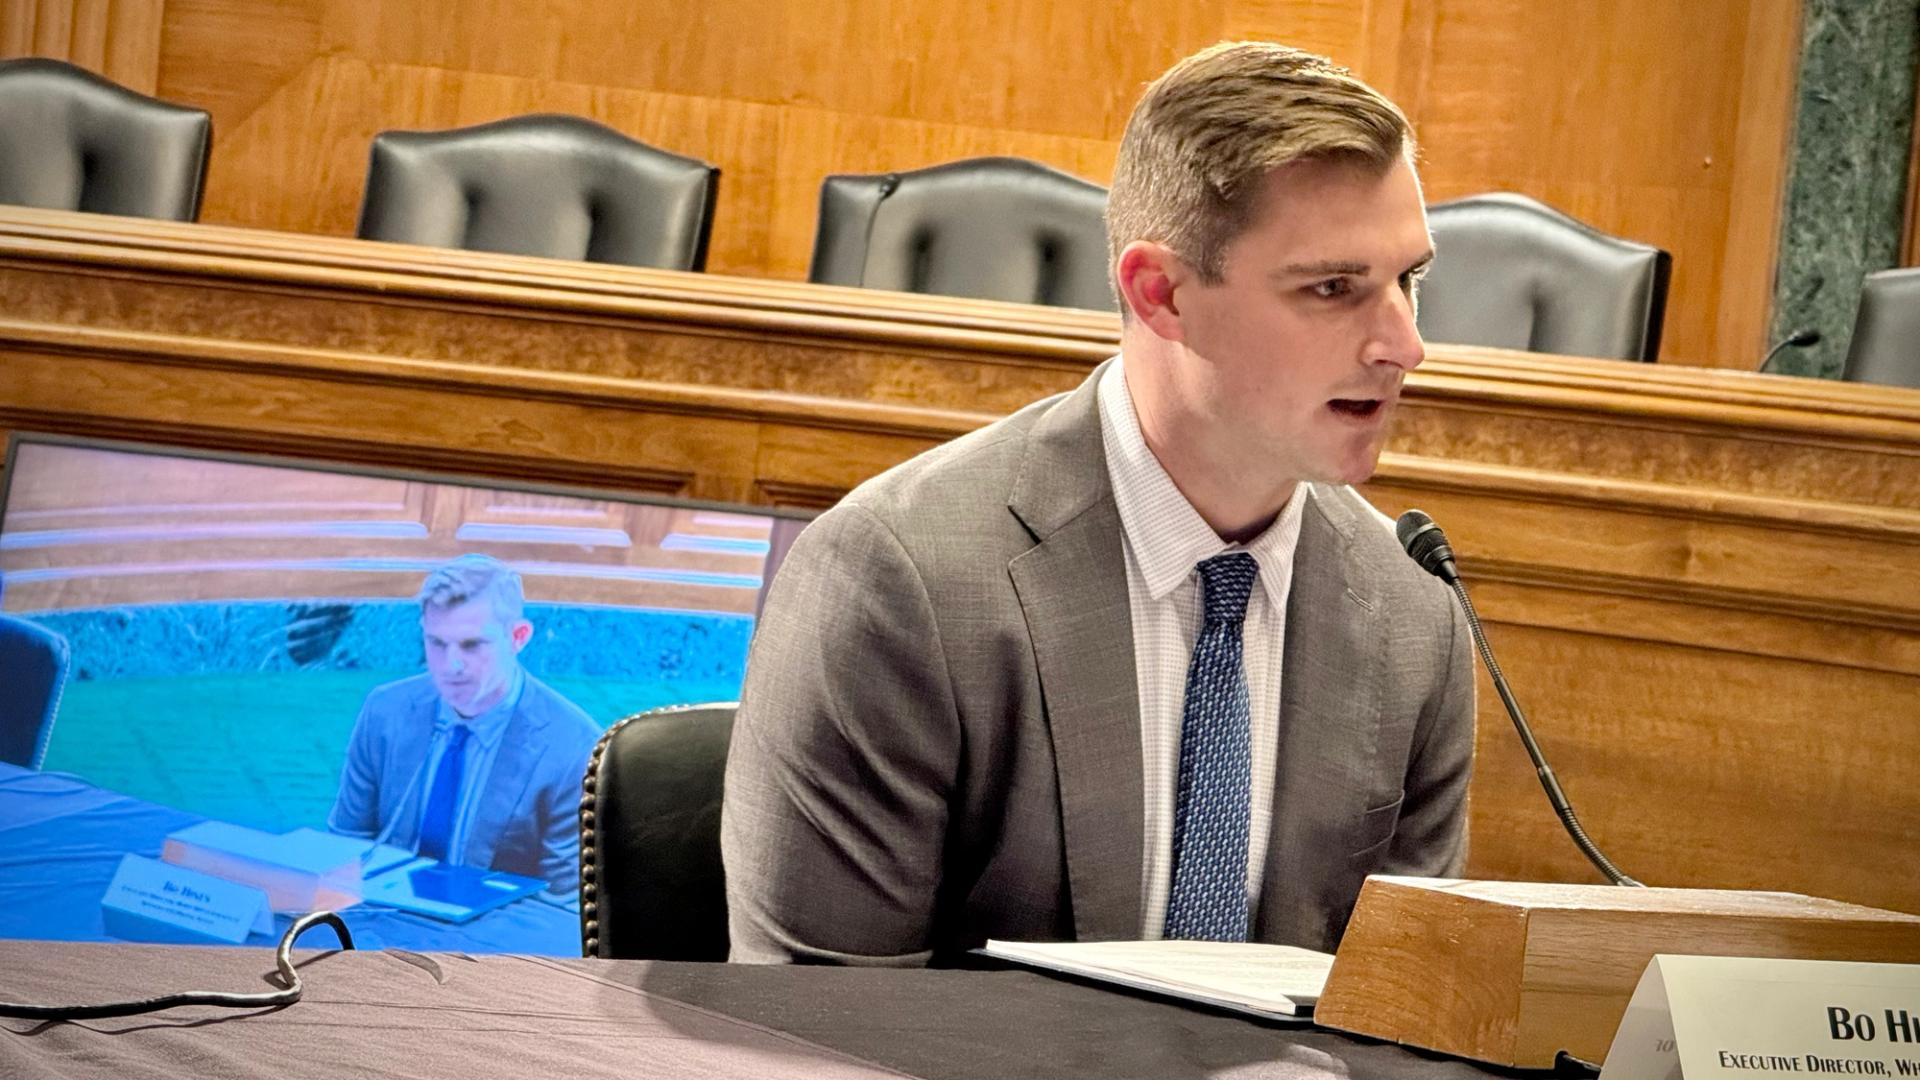

The crypto sector’s new Fellowship political action committee disclosed its first contribution ahead of the 2026 congressional midterm elections, and the $300,000 it spent went to a company co-founded by President Donald Trump’s former crypto adviser, Bo Hines — now chief executive of Tether US.
The Fellowship super PAC had advertised itself as a crypto campaign-finance juggernaut last year but hadn’t yet participated in the U.S. midterm elections until a new federal disclosure indicated it’s signed its first check. From the time the PAC was announced, the effort was reportedly tied to Tether, though the company declined to confirm the connection. On April 1, the PAC named Tether US executive Jesse Spiro as its chairman.
Days later, Fellowship quietly made its first expense filing to the Federal Election Commission, reporting that it bought advertising for Georgia Republican Clay Fuller through Nxum Group — a firm co-founded by Hines, father Todd Hines and a third partner. The PAC, which says it’s “rooted in transparency,” hasn’t responded to CoinDesk questions about its formation and funding, nor about the payment that may benefit the Tether US CEO and his relative.
Setting up a super PAC and paying yourself for services isn’t against U.S. campaign-finance rules, as long as the service is provided at appropriate market value, said Michael Beckel at political reform organization Issue One.
“There is no blanket prohibition on self-dealing when we’re talking about political committees like this,” he said in an interview. “The general rule is that services need to be rendered that are bonafide services — actual services — and those rates that are paid have to be fair-market rates.”
Fellowship’s advertising effort on behalf of House of Representatives candidate Fuller isn’t yet clear, apart from the disclosure the PAC made to the FEC that money was given to the advertisement provider for his primary election effort. The funds changed hands just as Fuller was winning his special election, according to the filing.
However, the PAC’s disclosures don’t yet demonstrate a stockpile of contributions to back other candidates, still showing its current accounts at zero, despite an announcement last year that it would be established with pledges of $100 million.
An outside spokesperson for Tether who was asked about the activity at Fellowship responded that Tether International has no affiliation or oversight over Fellowship PAC. The representative offered no response to additional questions about Tether US, deferring further inquiries to the PAC, which didn’t respond.
Tether ties
The PAC became active again only this month when it announced its chairman would be Spiro, the vice president of regulatory affairs for Tether’s U.S. arm. Fellowship also began listing endorsements for Republican politicians seeking House and Senate seats, plus a candidate for governor in South Carolina, Alan Wilson, on its feed at social media site X. The PAC said it’s backing advocates of emerging digital assets technology.
The Fellowship PAC “will begin actively supporting candidates aligned with this vision — leaders who recognize the importance of fostering economic growth and reinforcing the United States as the global leader in next-generation financial infrastructure,” it said in a statement, though Spiro didn’t respond to an attempt to reach him via social media.
The PAC’s first recipient of financial support, Fuller, is an incoming Republican member of the House of Representatives after he just won a special election to replace firebrand Marjorie Taylor Green. Even after that victory, the Georgia politician — not announced among Fellowship’s endorsements — will still need campaign support for the upcoming primary and general election in that state. The money spent by the Fellowship super PAC was an independent expenditure, meaning it had to be handled without strategizing with Fuller’s campaign.
As a candidate, Fuller hasn’t broadcast a position on crypto and doesn’t have a grade at Stand With Crypto, an advocacy group that evaluates candidates’ views. He does have the backing of Trump, who called him “a wonderful and talented man” in a post on Truth Social.
CEO’s old firm
The firm paid by Fellowship PAC, Nxum, included Bo Hines among its owners when he filed ethics disclosures last year as a White House official, working as a leading adviser trying to push crypto legislative advances. It’s unclear whether financial ties remain between Hines and Nxum.
There’s no federal record for Nxum as a regular service provider for additional political efforts. Before this, the company’s primary claim to fame was when it contributed billboard advertising valued at $1 million for MAGA Inc. in support of Trump in 2024. Less than two months after that, the White House hired Hines as executive director of the President’s Council of Advisers on Digital Assets. After less than a year in which he helped shepherd the 2025 stablecoin law, Hines left the president’s service to take a role at leading stablecoin issuer Tether, which was making a move into the U.S.
The PAC’s treasurer who signed off on its first spending, Mitchell Nobel, is an executive at Cantor Fitzgerald, a firm that manages assets for Tether’s global operation and was run by Trump’s secretary of commerce, Howard Lutnick, before he joined the administration.
When Fellowship was announced as a new PAC last year, it was presented as a contrast from previous political engagement. Without naming Fairshake, it said that unlike past efforts, it would be “defined by transparency and trust,” aimed to help the broader crypto ecosystem and not “narrow or individual interests.”
It’s possible that some or all of the promised $100 million is in the PAC’s coffers already, because federal disclosures typically trail significantly behind the movements of money. When any contributions are made public, they’ll identify the origins of the money, which must be from U.S. sources.
The relatively young Tether US’s stablecoin, USAT, has a market cap of about $37 million so far, suggesting the firm may not have the independent resources yet to fund a major PAC.
“Occasionally, those types of super PAC threats are paper tigers that never materialize,” said Beckel. “But we’re seeing in this day and age that massive spending by an industry is something that lawmakers are taking seriously and taking note of.”
The rival
So far, the amount the Fellowship PAC has spent is still a drop in the bucket compared with the receipts of the leading crypto super PAC, Fairshake.
The U.S. midterm elections are already well underway, with many of the hotly contested primaries already past or about to happen. Fairshake has expended millions in the early contests.
If the U.S. House is taken over by a Democratic majority (an 87% chance according to betting at Polymarket), the committees there will likely shift its agenda to challenge Trump’s legislative efforts and investigate the administration’s actions. Even the difficult lineup of races for Democrats to take the Senate has shifted toward better-than-even odds, suggesting the likelihood that the crypto industry will need a lot of friends from both parties.
It’s not too late for Fellowship to make a splash in a congressional field that’s likely to have major significance for future crypto legislation. So far, the PAC is focusing support only on Republicans, almost all of them said by political analysts to be in deep-red regions. If they win, they may face a challenging shift on Capitol Hill next year.
Read More: A $100 million crypto campaign fund with a pro-Trump vibe so far failed to show up

Donald Trump Warns US Navy Will Block Strait Of Hormuz

2026 Masters purse: Payout breakdown, winner’s share

Dune 3 is coming sooner than its director originally planned

Why Israel is blocking foreign journalists from entering

Bitcoin: We’re Entering The Most Dangerous Phase

Alan Cumming Brands Baftas Ceremony A ‘Triggering S**tshow’

NUR NOCH 30 STUNDEN! Trump droht Iran – Bitcoin vor dem Crash? (Ich sichere mich ab)
![DJ KANJI - MONEY UP (feat. 7 & eyden) [Official Music Video]](https://wordupnews.com/wp-content/uploads/2026/04/1776001891_maxresdefault-80x80.jpg)
DJ KANJI – MONEY UP (feat. 7 & eyden) [Official Music Video]

Live Gold, Crypto Trading | 9 April | #goldtrading #cryptotrading #bitcoin – MANSI
-

 Business7 days ago
Three Gulf funds agree to back Paramount’s $81 billion takeover of Warner, WSJ reports
-

 Politics2 days ago
US brings back mandatory military draft registration
-

 Fashion2 days ago
Weekend Open Thread: Veronica Beard
-

 Tech5 days ago
How Long Can You Drive With Expired Registration? What Florida Law Says
-

 Fashion6 days ago
Massimo Dutti Offers Inspiration for Your Summer Mood Board
-
 Sports2 days ago
Man United discover Nico Schlotterbeck transfer fee as defender reaches Dortmund agreement
-

 Crypto World3 days ago
Canary Capital Files SEC Registration for PEPE ETF
-

 Fashion5 days ago
Let’s Discuss: DEI in 2026
-

 Business2 days ago
Tesla Model Y Tops China Auto Sales in March 2026 With 39,827 Registrations, Beating Cheaper EVs and Gas Cars
-

 Crypto World4 days ago
Bitcoin recovers as US and Iran Agree a Ceasefire Deal
-

 Politics2 days ago
Malcolm In The Middle OG Turned Down ‘Buckets Of Money’ To Appear In Reboot
-

 Business2 days ago
OpenAI Halts Stargate UK Data Centre Project Over Energy Costs and Copyright Row
-

 Business22 hours ago
Ireland Fuel Protests Enter Day 5 as Blockades Spark Shortages and Government Prepares Support Package
-

 Tech6 days ago
Italian court says Netflix must refund customers up to $576 over price hikes
-

 Tech6 days ago
Gamer Restores the Original PlayStation Portal From Two Decades Ago
-

 Tech6 days ago
Haier is betting big that your next TV purchase will be one of these
-

 Tech6 days ago
The Xiaomi 17 Ultra has some impressive add-ons that make snapping photos really fun
-

 Tech6 days ago
Samsung just gave up on its own Messages app
-

 Politics2 days ago
LBC Presenter Mocks Trump Over Iran War Failures
-

 Tech6 days ago
Save $130 on the Samsung Galaxy Watch 8 Classic: rotating bezel, sleep coaching, and running coach for $369
You must be logged in to post a comment Login