
Crypto World
CLARITY Act News: Trump Administration Confronts Banks Over Crypto Banking Access

President Donald Trump has issued a direct warning to the banking industry: stop blocking crypto or face consequences. This came as the CLARITY Act is currently at a standstill, with the President now blaming the banks.
In a late Tuesday statement (March 3), Trump accused major financial institutions of undermining his administration’s digital asset agenda.
This news broke as the crypto market moved higher overnight, surging 2.6% and pushing the total crypto market cap over $2.4 trillion.
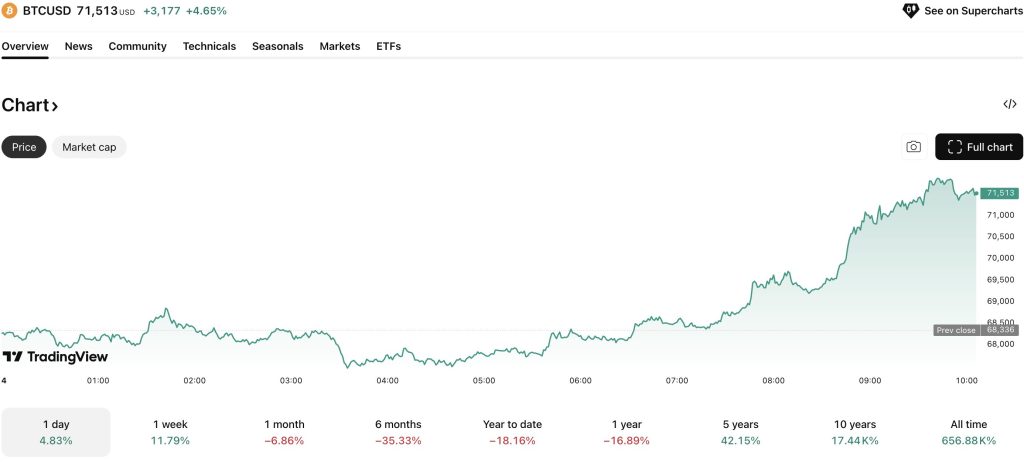
Bitcoin USD has surged in the European morning trading session, flying back above $71,000 with a +6% move, one of its best days in recent weeks.
The Battle for the Clarity Act: Trump Vs. The Banks
The immediate trigger for this confrontation is the stalled CLARITY Act. This market-structure bill, designed to reshape how digital assets are regulated in the US, passed the House last year but has hit a wall in the Senate.
Trump took to his Truth Social platform late on Tuesday to frame the delay as a national security failure:
“The Banks are hitting record profits, and we are not going to allow them to undermine our powerful Crypto Agenda,” Trump wrote. He argued that inaction would cede ground to China, framing the Trump crypto policy as vital to maintaining US financial dominance.
Banks are specifically opposing provisions that would allow crypto exchanges to pay yield to users holding stablecoins. Traditional finance institutions argue this could trigger a deposit flight, draining capital from retail bank crypto accounts into higher-yielding digital asset platforms.
This follows the administration’s earlier legislative win, the Genius Act, signed in July. That law created a framework for issuers but remained silent on whether intermediaries could offer yield. The CLARITY Act aims to close that loop, and banks are scared.
BILLIONAIRE KEVIN O'LEARY SAID THE CLARITY ACT WILL PASS AND SEND BITCOIN TO $200,000 — Crypto Fergani (@cryptofergani) March 3, 2026
TRILLIONS INCOMING  pic.twitter.com/FffPLwwXSv
EXPLORE: Best Crypto Presales to buy in 2026
Reversing Operation Choke Point
The administration is not relying solely on legislation. The White House is actively moving to dismantle the legacy of Operation Choke Point 2.0.
This informal regulatory strategy, utilized during the previous administration under Joe Biden, pressured banks to sever ties with crypto clients under the guise of risk management.
On March 1, the OCC repealed Interpretive Letter #1179. This removed the requirement for banks to seek pre-approval before engaging in crypto activities. Yet, industry reports suggest that despite the regulatory green light, banks remain hesitant.
Trump’s latest comments signal he could be set to go on the offensive to push the CLARITY Act through once and for all. And by now, we all know what Donald wants; he seemingly gets it.
The stakes for the industry are existential. Without reliable banking rails, crypto firms face higher operational costs and settlement risks. While the US struggles with basic access issues, other nations are integrating blockchain at the central bank level.
A similar contrast is evident globally, as the Bank of Japan explores blockchain-based reserve settlement, highlighting that traditional institutions elsewhere are adapting rather than obstructing.
As the CLARITY Act Nears, the Bitcoin Price Surges Past $70,000: What Next for BTC USD?
Bitcoin has resumed its rally, pumping more than 6% overnight and now trading at $71,200, even though sentiment across global equity markets remains risk-averse, as evidenced by falling precious metal prices.
There is a possibility that capital leaving the lagging silver market may be partially rotating into the surprisingly resilient BTC. Since the US attack on Iran, the Bitcoin price has risen by around 10%, after initially dropping to roughly $63,000 in the immediate aftermath.
At the same time, USD strength has not triggered declines in the crypto market, as it often does, potentially signaling renewed belief in crypto as a store-of-value amid growing global tensions.
BTC/USD now needs to hold above $70,000 to signal further upside. A loss here would signal weakness, and a drop back toward support at $66,000 becomes likely.
However, holding $70,000 and a fresh injection of volume could see Bitcoin revisit its February high of $78,600. Macroeconomic news and volume are the two key indicators to watch when plotting BTC’s next move.
DISCOVER: Next Crypto to Explode in 2026
The post CLARITY Act News: Trump Administration Confronts Banks Over Crypto Banking Access appeared first on Cryptonews.

AI and stablecoin segments have outperformed the broader crypto market in 2026, with data pointing to continued usage growth despite declining prices elsewhere.
Key takeaways:
-
AI sector posts smallest loss in Q1/2026, down just 14%.
-
Stablecoin market cap hits a record $320 billion, with monthly transaction volumes at a record $1.8 trillion.
AI and stablecoin sectors buck the trend
Bitcoin (BTC) trades 18.5% lower in 2026, the total crypto market capitalization has slipped to $2.42 trillion, while most altcoins are lagging, as fear and uncertainty surrounding the US and Israel-Iran war and the Fed’s hawkishness grip the market.
Meanwhile, AI and stablecoin businesses continue to defy the trend, recording significant growth and strong fundamentals that highlight a rotation toward infrastructure over speculation.
Related: Circle asks EU to ease crypto thresholds in proposed markets framework
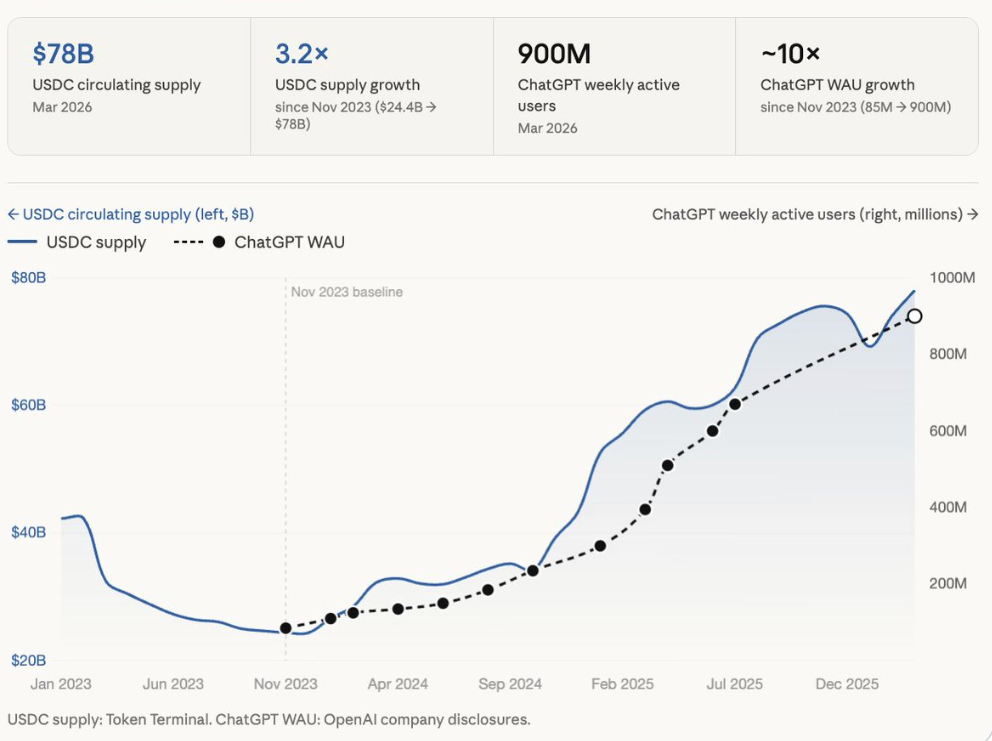
For example, Circle’s USDC (USDC) supply is at $78 billion, a 220% increase since November 2023, data from Token Terminal shows.
ChatGPT’s weekly active users have also grown to 900 million in March 2026 from 85 million in November 2023, a roughly 10x increase over the same period.

Grayscale’s Q1/2026 report reinforces this observation, revealing that the AI sector recorded the smallest loss at 14% during the first three months of the year, compared to Consumer and Culture at 31%, Smart Contract Platforms at 21%, and Currencies at 21%.
This indicates that “investor appetite shifted away from momentum-driven and more speculative segments,” the digital-asset investment manager said, adding:
“Despite subdued overall sentiment, capital appeared to rotate toward projects with stronger fundamentals and those aligned with key themes such as AI and tokenization.”

The market capitalization of AI tokens now stands at $17.4 billion, up 30% over the last 30 days. Bittensor (TAO) and NEAR Protocol (NEAR) lead the growth, with 75% and 30% price increases, respectively, over the same period

Similarly, stablecoins continue to grow, with the total market capitalization hitting a record $320 billion on March 23. Tether’s USDt (USDT) maintains dominance around $184 billion, representing 57% of the total stablecoin supply.
Monthly transaction volumes hit a record $1.8 trillion in February, rivaling traditional payment rails. USDC led supply growth with an 80% month-to-month increase to a $1.26 trillion all-time high last month.

Stablecoins are cryptocurrencies designed to maintain a stable value, typically pegged to fiat currencies like the US dollar, and can be hosted on multiple blockchains.
In a bear market, stablecoins serve as buying power and settlement rails, dominating trading pairs, supporting tokenized real-world assets, and enabling yield-bearing products.
Ethereum and other chains see high transfer volumes, while institutional products from banks and fintechs integrate them for yield and treasury management. This infrastructural role persists even as speculative assets bleed.
“Structural tailwinds” drive growth convergence
The two sectors thrive because they deliver measurable value even after speculation fades.
“AI labs and stablecoin issuers are among the businesses with the strongest structural tailwinds of the 2020s,” Token Terminal said.
They sit at the “intersection of three distinct forces: technology, finance, and geopolitics,” with each of these drivers independently driving demand for these sectors, the crypto data provider said, adding:
“AI drives productivity and defense capabilities, while stablecoins provide financial infrastructure for global dollar distribution.”
In an X post on Monday, Crypto trader Mando CT said AI and stablecoins are among the four dominant sectors in 2026.
Explaining the convergence, the trader said that AI needs instant and low-fees payment systems to operate, while stablecoins are the “internet money” needed to make this happen.
“These trends are connected,” Mando CT said, adding:
“2026 isn’t just another cycle. It’s the transition from: Speculation to Infrastructure.”
Cointelegraph reported that stablecoins could benefit from AI-driven payments by enabling easy, automatic, and rule-based transactions between entities, further driving long-term growth for both sectors.
This article does not contain investment advice or recommendations. Every investment and trading move involves risk, and readers should conduct their own research when making a decision. While we strive to provide accurate and timely information, Cointelegraph does not guarantee the accuracy, completeness, or reliability of any information in this article. This article may contain forward-looking statements that are subject to risks and uncertainties. Cointelegraph will not be liable for any loss or damage arising from your reliance on this information.


Opinion by: Mitchell Amador, founder and CEO of Immunefi
There’s an argument that regulation will split decentralized finance (DeFi) into two separate silos: one regulated and compliant and the other completely open and accessible by anyone, including anonymous participants.
This argument is outdated.
Regulatory pressure in 2026 will reshape DeFi into a network of interoperable, interlinked ecosystems with distinct risk, compliance and access profiles.
Some tiers will become more compliant and institution-friendly, while others will remain open, permissionless and driven by onchain leverage and market experimentation.
This evolution won’t drag DeFi toward TradFi. Rather, it will bring TradFi into DeFi’s orbit.
DeFi already operates in multiple lanes
DeFi has never functioned as a single monolith; it operates across several concurrent compliance tiers.
The first lane is permissionless DeFi, where anyone can deploy a contract, supply liquidity and use leverage. This is the engine of innovation, where price discovery and stress testing happen in public, as does failure. Permissionless pools have no Know Your Customer (KYC), allow pseudonymous users and exist because global markets can move faster than regulated institutions.
The next tier consists of protocols with built-in safeguards, like liquidation rules, governance frameworks and oracle protections, but no identity requirements. These serve people who want liquidity and yield with risk management.
Finally, there is the newer, heavily controlled lane, where KYC checks, geofencing and compliance filters are applied at the access-point level.
The same underlying smart contracts can still be reached, just through different gates.
Liquidity trumps isolation
Full isolation of compliant DeFi is unlikely. Capital seeks liquidity, and liquidity seeks composability. That means the regulated lanes will run through permissionless infrastructure.
Institutions entering digital assets will want access to the scale of liquidity that only onchain markets can provide — 24/7 global access, near-instant settlement and depth that traditional venues cannot match. The passage of the GENIUS Act, which bans yield-bearing stablecoins, has already pushed institutional capital toward DeFi protocols in search of returns.
If the liquidity accessed is compelling enough, institutions will tolerate complexity and innovation risks. Regulation won’t eliminate this incentive.
Security innovation starts in the arena
Institutional and compliant participants care deeply about security, yet the center of gravity for security innovation will sit inside permissionless DeFi.
That may sound counterintuitive, given that over $3.1 billion was lost to hacks and exploits during the first half of 2025 alone.
Related: For Wall Street’s most sophisticated trading firms, the next alpha is onchain
Adversarial conditions are precisely where robust defenses are forged. Bug bounty programs, real-time monitoring tools and AI-driven threat detection were all born in the permissionless environment and stress-tested against live exploits before any compliance framework adopted them.
This pattern will accelerate. New security models that range from automated vulnerability scanning to onchain firewalling will continue to emerge in open DeFi and will then be standardized and adopted by the institutional side once they prove effective.
Regulation will cement DeFi’s central role
Regulation will certainly not fracture DeFi. What we will see instead is how decentralized finance will cement its position at the center of global finance.
The future, to be sure, is not compliant DeFi versus permissionless DeFi, because DeFi has the ability to be interoperable. It’s a network where open markets generate liquidity and innovation, and regulated players selectively plug in. That’s why we will see regulatory pressures mold the ecosystem into interconnected tiers, with some gravitating toward greater compliance and others toward the open marketplace, all of them linked by the composability that makes onchain finance uniquely powerful.
That dynamic will inevitably draw TradFi closer to DeFi as institutions seek out the far greater liquidity, speed and efficiency of decentralized markets.
Opinion by: Mitchell Amador, founder and CEO of Immunefi.
This opinion article presents the author’s expert view, and it may not reflect the views of Cointelegraph.com. This content has undergone editorial review to ensure clarity and relevance. Cointelegraph remains committed to transparent reporting and upholding the highest standards of journalism. Readers are encouraged to conduct their own research before taking any actions related to the company.
Financial technology company Omnes and financial services provider Apex Group said on Tuesday that they plan to issue a tokenized secured debt note backed by Bitcoin hashrate on Base.
The two companies announced that they would tokenize the Omnes Mining Note (OMN), an institutional-grade structured note backed by the Bitcoin (BTC) hashrate. The companies said it will be issued and managed on the Base blockchain, Coinbase’s Ethereum layer-2 network.
Apex said the note is designed to give institutional investors “direct economic exposure to new Bitcoin production measured in hashrate” without the operational burden of managing mining hardware, energy procurement and facilities.
The launch adds a new type of crypto-linked security to the tokenization market by packaging mining output into a regulated investment product that can be transferred onchain between approved investors.
Omnes CEO Emmanuel Montero said the OMN is intended to convert Bitcoin mining output into a structured financial instrument backed by large-scale mining operations. “Bitcoin mining is the only mechanism that creates new Bitcoin through protocol issuance. This is economically distinct from yield strategies that rely on redistributing existing Bitcoin,” he said.
Bitcoin mining exposure packaged into a tokenized debt note
According to the announcement, the OMN is designed to give professional investors outside of the United States economic exposure linked to mining production, using hashrate as its underlying metric. The Bitcoin hashrate is the computational power that secures the network and produces new coins.
The product essentially lets investors benefit from Bitcoin mining activity without running mining operations themselves.
Related: Nasdaq, Talos target collateral bottleneck in institutional tokenization push
Issued as a secured debt note, the product applies a traditional financial structure with blockchain-based features, including onchain transfers between approved investors.
While the product expands access to mining exposure, details on how hashrate translates into investor returns, as well as the note’s liquidity and risk profile, were not fully disclosed.
Cointelegraph reached out to Omnes and Apex Group for more information, but had not received a response by publication.
Tokenized assets climb to over $23 billion in March
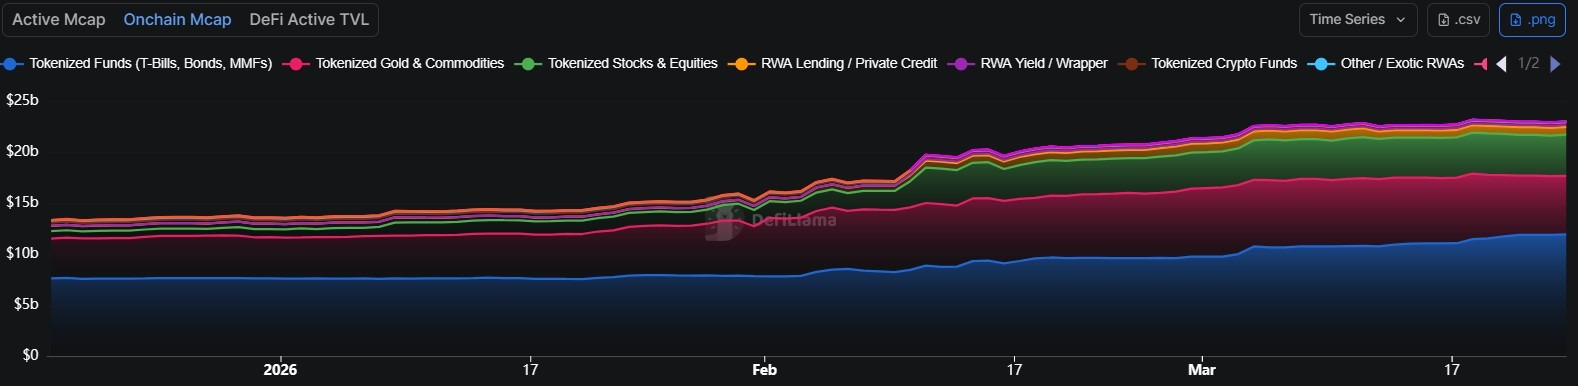
The plans to tokenize Bitcoin mining exposure come amid a rise in tokenized real-world assets (RWAs) in 2026.
On March 11, DefiLlama data showed that the value of tokenized RWAs on public blockchains reached roughly $23.6 billion, up 66% year-to-date.

At the time of writing, the onchain market capitalization for tokenized RWAs stood at around at $23 billion, according to DefiLlama.
Magazine: Animoca teams up with Ava Labs, Shrapnel on Steam: Web3 Gamer


Circle has called on the European Commission to ease parts of its proposed Market Integration Package as the stablecoin issuer pushes for wider institutional use of digital euro and dollar tokens in the region.
Summary
- Circle asked the EU to lower thresholds blocking broader institutional use of e-money tokens.
- The company said current settlement rules could slow growth of euro-denominated stablecoins like EURC.
- Circle also wants crypto service providers included in the EU DLT Pilot Regime.
In a Monday announcement, the company said the package could help connect traditional finance and blockchain systems, but added that some rules still limit access for crypto service providers and slow the growth of euro-backed tokens.
Circle said it sent its feedback to the Commission on March 20. In its response, the company described the package as a “meaningful step toward a digitally enabled financial system” while asking for changes to improve market access and digital asset settlement in Europe.
One of Circle’s main requests focused on the market capitalization threshold tied to e-money tokens used in settlement. The company said limiting settlement use to “significant” e-money tokens could keep euro-denominated tokens out of the market and create what it called a “chicken-and-egg scenario” for growth.
Circle argued that the current threshold creates a structural barrier for institutions that want to use e-money tokens in secondary markets. It said the Commission should use more flexible thresholds based on factors such as market uptake and liquidity conditions rather than relying on a fixed capital benchmark.
The company has a direct interest in that issue because it offers EURC, a euro-backed stablecoin that complies with MiCA rules in Europe. Circle’s MiCA white paper says EURC is an e-money token and states that it does not meet the definition of a “significant e-money token” under current rules.
Circle also wants wider access under DLT rules
Circle also asked the Commission to widen access under the DLT Pilot Regime. It said the current structure limits cash accounts to credit institutions and central securities depositories, and argued that crypto-asset service providers should also be allowed to take part.
The company said these changes would give Europe-based crypto market participants more clarity, especially around which digital assets can be used as collateral and how blockchain-based settlement can work within regulated capital markets. The Commission launched the broader Market Integration Package in December 2025 as part of its plan to deepen EU capital markets integration and supervision.
Europe’s main crypto framework remains the Markets in Crypto-Assets Regulation, which took effect in late 2024. Circle said the new package gives the EU a chance to update parts of its financial system while keeping digital asset rules clear and proportionate for firms operating in the bloc.


Aave’s community has moved a step closer to launching V4 on Ethereum after a governance proposal won near-unanimous backing. The result points to broader support for the upgrade after several weeks of public tension inside the DAO and the exit plans of key contributors.
Summary
- Aave DAO strongly backed V4, moving the protocol closer to Ethereum mainnet deployment.
- The vote followed governance tension and exit plans from key Aave contributors recently.
- Aave V4 introduces modular hubs and spokes for shared liquidity and tailored risk.
A Snapshot vote on Monday showed more than 645,000 votes in favor of moving Aave V4 toward Ethereum mainnet deployment. Fewer than one vote opposed the plan, and there were no abstentions, according to reporting on the outcome.
The vote does not activate the system on its own. Aave founder Stani Kulechov said the proposal is expected to advance to an Aave Improvement Proposal, which would be the binding onchain vote needed to deploy and activate V4 on Ethereum.
Aave Labs presented V4 as a protocol built around a hub-and-spoke structure. Under that model, shared liquidity sits in “Hubs,” while “Spokes” define separate borrowing markets with their own limits and risk settings.
Aave Labs said this structure is meant to keep the benefits of shared liquidity while giving the protocol tighter control over risk across different markets. The design is also intended to support a wider range of use cases, including new collateral types and structured credit markets.
Governance tensions shaped the backdrop
The strong support for V4 follows a period of strain inside Aave governance. In a forum post published on February 20, BGD Labs said it would end its involvement with Aave after nearly four years, citing an “asymmetric organizational scenario” and what it called an “adversarial position” toward its work on V3.
That dispute widened in early March when the Aave Chan Initiative said it would not seek renewal of its engagement with the DAO. Marc Zeller wrote that ACI would wind down over four months after a clash over funding, governance standards, and voting dynamics.
In addition, the latest vote suggests the DAO is now more aligned on the path forward for V4. It also gives Aave Labs a clearer route to seek final approval for Ethereum mainnet activation through the next governance stage.
Why Mastercard’s BVNK acquisition is a strategic shift
Mastercard’s deal to acquire BVNK for up to $1.8 billion goes beyond simply entering the crypto space. It reflects a well-thought-out strategic redirection.
Rather than introducing its own stablecoin, Mastercard has opted to gain control of the underlying infrastructure that links conventional finance to blockchain-enabled payments.
This approach prompts an important question: Why would a major player in payments decide against creating its own digital currency and instead invest in the systems that facilitate its movement?
The explanation centers on regulatory considerations, the ability to scale and sustained influence over the core infrastructure of digital finance.
What BVNK brings to the table
BVNK does not issue stablecoins and operates as a payments infrastructure provider. Robust infrastructure plays an important role in the functioning of the stablecoin ecosystem.
It allows businesses to:
-
Send and receive payments with stablecoins
-
Perform smooth conversions between fiat currencies and crypto
-
Operate in more than 130 countries
As a result, BVNK serves as a connector between two distinct financial ecosystems:
-
Conventional payment networks, including banks, card networks and fiat channels
-
Blockchain networks, including stablecoins, crypto wallets and on-chain transactions
Instead of developing a new form of currency, BVNK helps businesses utilize the ones already available with greater efficiency.
Did you know? Stablecoins process trillions of dollars in annual transaction volume and often rival major card networks. Yet many users do not realize they are interacting with blockchain-based systems behind the scenes when using certain fintech payment services.
Objective of Mastercard: Connecting financial networks
Mastercard serves as a connector of financial networks, functioning as a network of networks. Rather than trying to compete with different forms of digital money, Mastercard aims to play the role of an integrator that links them all seamlessly.
This approach involves bringing together:
-
Traditional card-based payment systems
-
Core banking infrastructure
-
Blockchain-based transaction rails
According to company leadership, the future payments landscape is expected to feature an array of digital money forms, such as:

Why Mastercard has chosen not to issue its own stablecoin
On the surface, creating a stablecoin issued by Mastercard might appear to be a natural step. However, there are compelling reasons the company has decided against it:
Stringent regulatory compliance
Stablecoin issuers are encountering growing regulatory pressure. Emerging frameworks, such as the GENIUS Act (Guiding and Establishing National Innovation for US Stablecoins), are designed to enforce:
-
Strict reserve requirements
-
Enhanced transparency obligations
-
Oversight similar to that applied to traditional banks
By issuing a stablecoin, Mastercard would effectively become a regulated financial issuer, which would introduce substantial operational and compliance complexity.
Risks tied to the balance sheet
Enterprises that issue stablecoins are required to hold reserves, typically in cash or government securities, to fully back the tokens in circulation. This creates several challenges, including:
-
Complex liquidity management
-
Potential redemption pressures
-
Vulnerability to shifts in market conditions
By steering clear of issuance, Mastercard avoids taking on these financial risks and obligations.
Preserving harmony with partners
Mastercard maintains close partnerships with:
Introducing its own stablecoin would risk placing Mastercard in direct competition with these key collaborators within its ecosystem. By focusing on infrastructure instead, Mastercard can remain in a neutral position that serves rather than challenges its partners.
Did you know? The concept of “tokenized deposits” is gaining traction among banks, where traditional money is digitized on a blockchain. However, it remains within regulated banking systems, offering a potential alternative to privately issued stablecoins.
Infrastructure offers Mastercard more leverage
Controlling infrastructure generally delivers greater power than controlling a single asset. A stablecoin issuer earns profits exclusively from its own token. An infrastructure provider, however, captures value from transactions involving multiple tokens.
This model enables Mastercard to:
-
Support Tether USDt (USDT), USDC (USDC) and emerging bank-issued tokens
-
Generate fees from a broad spectrum of use cases
-
Grow in tandem with the entire ecosystem rather than being limited to one product
With this step, Mastercard is positioning itself to capture value across digital payment flows.
Why timing is critical at this juncture
The acquisition aligns with a surge in institutional interest in stablecoins, which have the potential to fundamentally transform global payments over the coming decade.
Several converging trends reinforce this momentum:
-
Significantly faster and more cost-effective cross-border transactions
-
Growing regulatory clarity
-
Expanding adoption among fintech companies and large enterprises
Stablecoins have moved beyond the experimental phase and are increasingly viewed as foundational elements of financial infrastructure.
Did you know? Cross-border payments through traditional banking can involve up to five intermediaries. Stablecoin-based transfers can reduce this to just two endpoints, dramatically cutting both time and cost.
Where Visa, Coinbase and others fit in
Mastercard faces competition in this space. Visa has made investments in BVNK, while Coinbase previously considered acquiring the company before withdrawing.
This reflects a wider industry convergence:
-
Traditional financial institutions are advancing into blockchain territory
-
Crypto-native companies are seeking deeper integration with established payment networks
Nevertheless, approaches vary and many crypto firms prioritize issuing their own tokens. Major payment networks emphasize infrastructure and broad distribution.
Why infrastructure wins in cross-border payments
Conventional cross-border payments are hampered by delays, often spanning days, high fees and the involvement of numerous intermediaries.
On the other hand, stablecoin-based systems deliver:
By incorporating infrastructure such as BVNK, Mastercard can introduce these benefits into its established network without needing to replace it entirely.
Mastercard’s strategy reduces the barriers to adoption. Banks and fintechs gain the ability to:
-
Provide stablecoin services without developing their own blockchain systems
-
Use global payment rails more efficiently
-
Seamlessly incorporate digital currency features into their current offerings
This approach cements Mastercard’s position as a backend enabler for the future of finance.
Associated risks and open questions
Despite the promise of this infrastructure-focused strategy for Mastercard, meaningful challenges and uncertainties remain that could influence its long-term outcome.
These include:
-
Persistent regulatory differences and fragmentation across jurisdictions, creating compliance hurdles and inconsistent operating environments for cross-border activities
-
Heavy reliance on external stablecoins issued and managed by third parties, which introduces dependency risks related to their stability, governance and continued availability
-
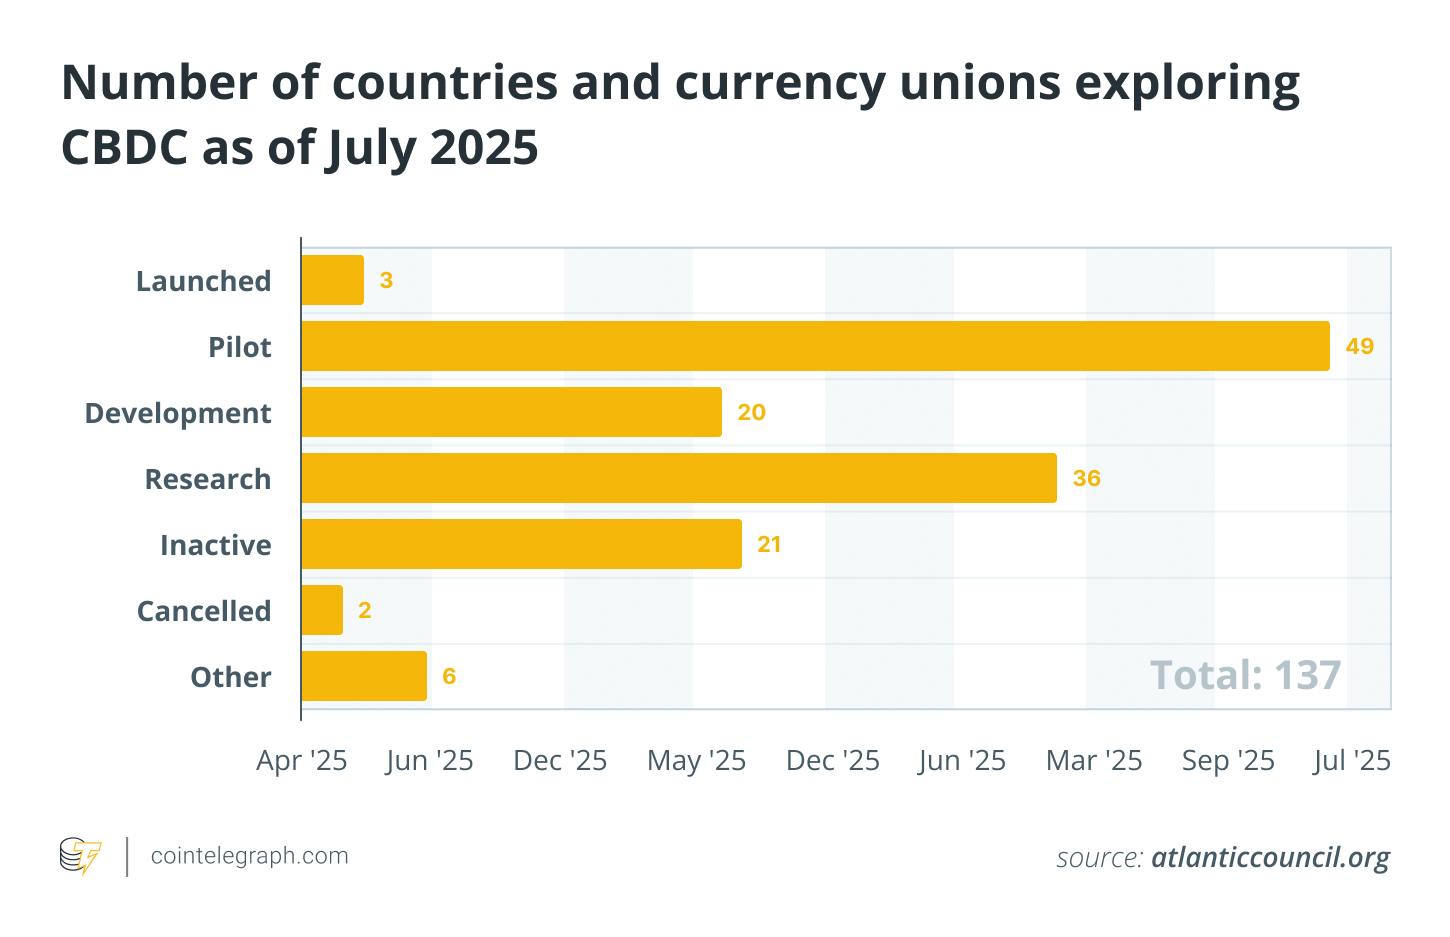
Intensifying competition from CBDCs as well as powerful technology giants entering the payments space with their own solutions and vast user bases
-
Potential margin compression in infrastructure-based services, as increased competition and scale drive fees downward over time
Evolving geopolitical tensions, shifts in monetary policy and unforeseen technological disruptions could further complicate the path forward.
Ultimately, the success and durability of Mastercard’s approach will depend on how the broader stablecoin ecosystem continues to develop and mature.
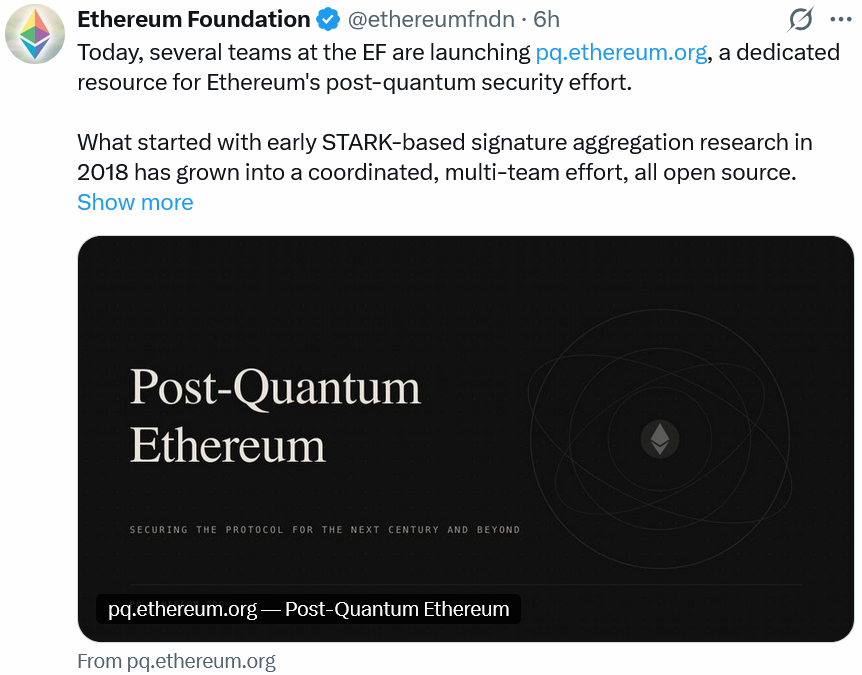
A group of Ethereum developers has launched a resource hub focused on protecting the blockchain from future quantum computing threats and securing the billions of dollars worth of value the network secures.
The “Post-Quantum Ethereum” website, launched on Tuesday by members of the Ethereum Foundation, says the organization’s new Post-Quantum team is planning to implement quantum solutions into Ethereum at the protocol level by 2029, with solutions targeting the execution layer to follow.
While the Post-Quantum team said no imminent quantum threat exists for cryptography-secured blockchains, early action is necessary due to the complexity involved:
“Migrating a decentralized, global protocol takes years of coordination, engineering, and formal verification,” the team said. “The work must begin well before the threat arrives.”

Source: Ethereum Foundation
Concerns that quantum computers could eventually break blockchain cryptography have fueled industry-wide fear around private keys and wallet security, prompting broader debate over how the sector should prepare as the technology develops.
Most industry analysts acknowledge that quantum computing poses some level of threat to crypto. Galaxy Digital analyst Will Owens has said only crypto wallets with exposed public keys are vulnerable, while others, such as Capriole Investments’ Charles Edwards, have said all coins are at risk.
Post-Quantum team building SNARK-based signatures
Many crypto developers are focused on how quantum-safe solutions can be implemented into cryptographic signatures to fight off potential attacks.
However, some solutions are more computationally intensive and could potentially impact blockchain performance by increasing bandwidth and storage.

The Post-Quantum team is integrating SNARK, or Zero-Knowledge Succinct Non-Interactive Argument of Knowledge technology, in an effort to prevent the Ethereum network from experiencing these issues.
Related: Quantum fears aren’t behind Bitcoin’s 46% drop, says developer
Quantum solutions will be implemented into Ethereum’s consensus, execution and data layers, the team said.
The Post-Quantum team said it would prioritize protecting standard Ethereum wallets as it believes that’s where the largest pool of value is, followed by high-value operational wallets tied to crypto exchanges, bridges and custody solutions.
It said that one of the biggest challenges will be to deploy these solutions without disrupting the network.
“Choosing a post-quantum algorithm is only part of the challenge. The harder parts include safely upgrading hundreds of millions of accounts, preventing the migration from introducing new bugs, avoiding new attack surfaces, maintaining performance, and coordinating ecosystem-wide adoption.”
Magazine: Bitcoin faces 6 massive challenges to become quantum secure
BitGo, a digital asset custody and trading platform, and Susquehanna Crypto will collaborate to give institutional clients over-the-counter access to prediction markets, allowing them to trade event-based contracts using cryptocurrency or stablecoins held in custody.
According to Tuesday’s announcement, trades will be routed through BitGo’s platform, with liquidity provided by Susquehanna, which will enable hedge funds, family offices and other large investors to execute bilateral trades without moving assets off platform or converting holdings, including Bitcoin or stablecoin, into cash.
Positions are backed by crypto collateral and documented using derivatives-style agreements, with minimum trade sizes starting at $100,000.

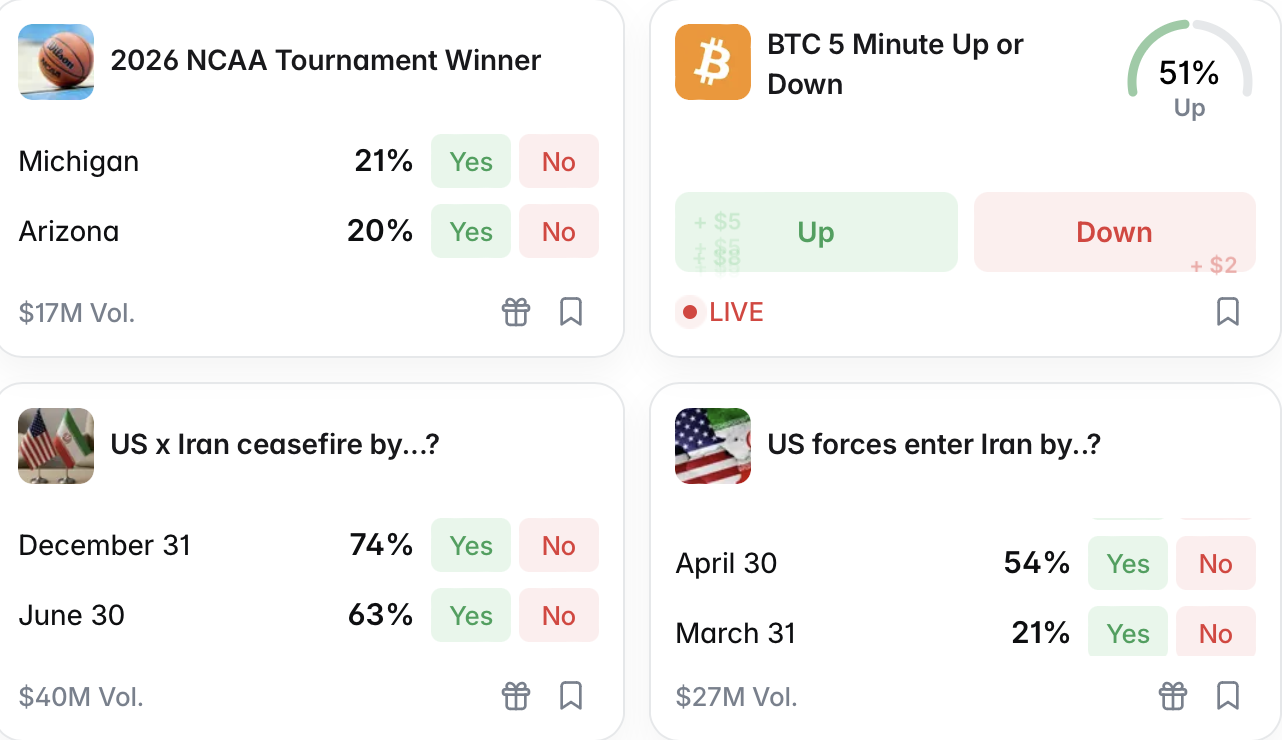
Prediction markets allow users to trade contracts tied to the outcome of real-world events, with prices reflecting the market’s implied probability of an outcome. Contracts can cover everything from sports and geopolitical events to niche outcomes like short-term Bitcoin (BTC) price movements or weather conditions.
While these markets have grown as tools for pricing event-driven risk, institutional participation has remained limited due to gaps in custody, collateral management and execution infrastructure, according to BitGo.
Related: Major League Baseball inks deals with US regulator, Polymarket
Prediction markets face growing regulatory pressure in US
The launch comes as prediction markets face growing legal challenges in the United States, where at least 11 states have taken action against platforms like Kalshi, arguing they operate as unlicensed gambling venues.
In Nevada, a state court issued a temporary ban on Kalshi on March 20, siding with gaming regulators who said the platform offers unlicensed betting on event outcomes. The ruling followed a federal appeals court decision on Thursday to deny Kalshi’s emergency request to pause the case.
In Arizona, authorities filed criminal charges against entities linked to Kalshi, alleging it accepted wagers on elections and sports in violation of state law. However, Kalshi co-founder and CEO Tarek Mansour called the charges a “total overstep,” arguing that his platform’s activity is unrelated to gambling and accusing the state of attempting to bypass the judicial process.
Elsewhere, lawmakers are moving to bring prediction markets under existing gaming frameworks. In Utah, proposed legislation would classify certain event-based contracts as gambling, while in Pennsylvania, lawmakers are preparing a bill that would place the sector under the state’s gaming regulator, including a 34% tax on revenue.
To be sure, not all efforts against prediction market platforms have succeeded. In Tennessee, a federal judge blocked a state attempt in February to halt Kalshi’s operations, ruling that its event contracts fall under the Commodity Exchange Act and are subject to oversight by the Commodity Futures Trading Commission (CFTC) rather than individual states.
Prediction markets have also faced scrutiny over potential insider trading after several well-timed bets appeared to anticipate major events. In response, Kalshi and Polymarket introduced new restrictions on Monday to limit the use of non-public information and prevent participants with direct influence over outcomes from trading.
At the federal level, authorities are evaluating potential regulatory approaches. On March 12, the CFTC published an advance notice of proposed rulemaking seeking public input on how prediction market contracts should be regulated.
Magazine: Banks want to run Vietnam’s crypto exchanges, Boyaa’s $70M BTC plan: Asia Express


Bitcoin (BTC) moved back above $70,000 on March 24 after another sharp swing tied to the latest developments around the US-Iran conflict.
Summary
- Bitcoin reclaimed $70,000 after sharp volatility linked to fresh developments around the US-Iran conflict.
- Ether, Solana, TAO, FET, and APT posted strong gains as altcoin momentum returned.
- The total crypto market added nearly $100 billion while SIREN dropped sharply from highs.
Meanwhile, the rebound also lifted several major altcoins, with Ether, Solana, Aptos, Fetch.ai and Bittensor posting strong daily gains while the wider crypto market added to its value.
Bitcoin traded near $71,000 after briefly dropping below $68,000 and then rising toward $72,000 during the latest session. CoinGecko data showed Bitcoin dominance at 56.7%, while the total crypto market cap stood near $2.51 trillion.
The moves came as markets reacted to mixed signals on the US-Iran situation. President Donald Trump said there had been productive talks, but Iranian officials denied that negotiations had taken place, which kept risk assets volatile across global markets.
Ether and Solana lead large-cap altcoin gains
Ether outperformed Bitcoin over the past 24 hours and traded above $2,150 as buying returned to large-cap tokens. Solana also moved above $90, joining a wider relief rally across the altcoin market.
The broader market move suggested traders were rotating back into higher-risk crypto assets after Bitcoin stabilized above the $70,000 level. The rise in Ether also pushed Ethereum’s market share to 10.4% of the total crypto market, based on CoinGecko data.
FET, APT and TAO post double-digit gains
Among the stronger movers, Bittensor traded above $300 after a double-digit daily rise. Aptos and Fetch.ai also recorded gains of more than 10% during the session, while other altcoins such as Render and LayerZero also moved higher.
These gains came as traders looked beyond Bitcoin and moved into AI-linked and infrastructure-related tokens. CoinGecko’s market pages also showed Bittensor and Siren among the more active names during the day’s rebound.
Not every token joined the rally. Siren dropped sharply from its recent all-time high and traded near $1.04 after a steep pullback.
The uneven price action showed that traders were still taking profits quickly in smaller tokens even as the wider market recovered. For now, Bitcoin’s hold above $70,000 remains central to whether altcoins can extend the current move.
Disclosure: This article does not represent investment advice. The content and materials featured on this page are for educational purposes only.


Cardano (ADA) has stayed under pressure over the past year, even as some market signals point to a possible recovery.
Summary
- ADA holds near $0.25 support after a 40% drop, keeping rebound expectations in focus again.
- Santiment data shows active Cardano wallets averaged negative 43% returns, placing ADA in opportunity zone.
- The SEC classified ADA as a digital commodity on March 17, adding new regulatory context.
The token traded at $0.2628 at the time of reporting, with a 24-hour trading volume of $594.4 million and a market cap of about $9.69 billion. Although ADA gained 0.47% in the past day, it still fell 8.23% over the last seven days.
ADA is now trading close to the $0.25 level, which has become a key support zone in recent weeks. The token has tested this area several times over the past month and has managed to stay above it in most cases.
The only clear break came during the February 6 flash crash, when ADA briefly dropped to $0.22 before moving back above $0.25. That quick recovery kept market focus on whether the current range could again act as a base for a rebound.
Market analyst Ali Martinez said Cardano posted large gains the last two times it bounced from this support area on a higher timeframe. According to his data, ADA rose 85% in early 2023 after holding this zone.
The token also climbed about 200% between October 2023 and March 2024 after another successful defense of the same level. Those earlier moves have drawn fresh attention to the current setup as ADA trades near that support once again.
Another signal came from the weekly chart, where the TD Sequential printed a buy signal after ADA dropped from its mid-January peak of $0.44 to about $0.26. That decline left the token down roughly 40% in two months.
On-chain data has also shown weak positioning among active holders. Santiment reported that wallets active on the Cardano network over the past year are sitting on an average return of negative 43%, based on Market Value to Realized Value data. The firm said this could place ADA in an “opportunity” or “buy” zone.
SEC classification adds a new backdrop
The weak price action has come even after Cardano received positive regulatory news in the United States. On March 17, the U.S. Securities and Exchange Commission classified ADA as a digital commodity.
Disclosure: This article does not represent investment advice. The content and materials featured on this page are for educational purposes only.

Here is Why AI and Stablecoins Defy Crypto Market Weakness in 2026

Real reason for Toni Storm’s shocking AEW hiatus revealed

Arm Is Now Making Its Own Chips


-
 Crypto World4 days ago
NIO (NIO) Stock Plunges 6.5% as Shelf Registration Sparks Dilution Worries
-

 Fashion4 days ago
Weekend Open Thread: Adidas – Corporette.com
-

 Politics4 days ago
Jenni Murray, Long-Serving Woman’s Hour Presenter, Dies Aged 75
-

 Crypto World3 days ago
Best Crypto to Buy Now: Strategy Just Spent $1.57 Billion on Bitcoin During Fear While Early Investors Quietly Enter Pepeto for 150x Potential
-

 News Videos6 days ago
RBA board divided on rate cut, unusually buoyant share market | Finance Report | ABC NEWS
-

 Crypto World3 days ago
Bitcoin Price News: Bhutan Sells $72 Million in BTC Under Fiscal Pressure, but the Smart Money Entering Pepeto Sees What the Market Does Not
-

 Politics7 days ago
The House | The new register to protect children from their abusers shows Parliament at its best
-

 Tech5 days ago
inKONBINI Lets You Spend Summer Days Behind the Register
-

 Crypto World6 days ago
Canada’s FINTRAC revokes registrations of 23 crypto MSBs in AML crackdown
-

 Sports2 days ago
Remo Stars and Kano Pillars Strengthen Survival Hopes in NPFL
-
 NewsBeat6 days ago
Residents in North Lanarkshire reminded to register to vote in Scottish Parliament Election
-

 News Videos7 days ago
PARLIAMENT OF MALAWI – PAC MEETING WITH REGISTRAR OF FINANCIAL ON AMARYLLIS HOTEL – INQUIRY LIVE
-

 Politics5 days ago
Gender equality discussions at UN face pushbacks and US resistance
-

 Business2 days ago
No Winner in March 21 Drawing as Prize Rolls to $133 Million for Next
-

 Business6 days ago
Who Was Alex Pretti? 5 Key Facts About the ICU Nurse Killed by Federal Agents in Minneapolis
-

 Sports2 days ago
Gary Kirsten Accuses Pakistan Cricket Board Of ‘Interference’, Mohsin Naqvi Responds
-

 Tech2 days ago
Give Your Phone a Huge (and Free) Upgrade by Switching to Another Keyboard
-

 Sports4 days ago
2026 Kentucky Derby horses, odds, futures, preview, date: Expert who nailed 12 Derby-Oaks Doubles enters picks
-

 Tech7 days ago
Subnautica 2 might finally be entering early access in May
-
Sports6 days ago
Vikings Free Agency Enters Phase 2 with Key Questions
You must be logged in to post a comment Login