
Crypto World
Consensus Hong Kong 2026: The Institutional Turn

“With each ETF that’s gone live, the money’s a lot more sticky,” in the words of Canary Capital’s CEO Steven McClurg.
This idea represents one of the clearest takeaways from Consensus Hong Kong this year: we’ve finally reached the era of long-term allocation.
Consensus Hong Kong 2026 (Feb 10-12, 2026) brought 11,000 registered attendees from 122+ countries and regions to the Hong Kong Convention and Exhibition Centre. Senior leadership made up a significant share of the audience, along with allocators, operators, and infrastructure builders.
“Digital Assets. Institutional Scale.” was reflected in the programming, and met well on the ground. Panels centered on institutional adoption, stablecoin infrastructure, and the architecture of internet capital markets. There was also a visible attempt to connect blockchain infrastructure with AI agents and robotics, but even those discussions returned to the same constraint: execution and reliability.
What stood out early was how consistently conversations returned to market infrastructure. Across the Future of Finance Summit, the Global Bitcoin Summit, and the Advanced Trading track, it’s clear that the next phase in Web3 is about proving it can operate at scale, under real capital, without breaking.

Sticky money, soft regulation and a dominant U.S. narrative
McClurg used Canary’s own XRP product to illustrate what he meant by ‘stickier’ capital.
“We launched an XRP ETF last year, and even on the biggest down days of the market, we were still getting inflows – meaning that people see an opportunity, they’re buying it.”
Of course, if capital continues to flow in during drawdowns, the market dynamic changes.
The mood at Consensus was the product of such a change, beginning in earnest with the SEC’s approval of spot Bitcoin ETFs in January 2024. Naturally, once exposure could be accessed through a familiar asset, things were shaken up.
As ETF pipelines expanded in the U.S., so did the institutional looking glass. Liquidity quality started to matter more than raw volume, hedging tools became part of the discussion, and market structure moved from the periphery to the center.
Regulation came up repeatedly in Hong Kong, but in a specific tone.
McClurg described the U.S. shift as real, though not fully codified into statute.
“Most of it’s happened, but it’s soft regulation… not necessarily laws that are being passed. It’s via executive orders. It’s via appointments.”
In other words, posture and precedent are shaping the environment as much as formal legislation.
That aligns with developments in Washington since early 2025: executive actions outlining national digital asset frameworks and a reshaped SEC leadership publicly signaling a more workable approach to crypto oversight.
The result is a market that feels more procedural and predictable. That’s what institutions require before size follows – a topic also well discussed at Consensus’ “The Regulatory Shift” panel at the Convergence Stage.
Institutional anxiety about whether the infrastructure is real
Volatility no longer seems to scare serious allocators. At the event, this idea felt like a misconception for the first time.
Cory Loo, Head of APAC at Douro Labs and lead for APAC business development for Pyth Network, commented on this point:
“Institutions understand volatility. What still quietly worries them is whether crypto’s infrastructure and business models are actually institutional-grade – not in marketing language, but in measurable terms. They want to see real revenue, real customers, real compliance, real uptime.”
The hesitation, in his view, is that parts of the industry can still look larger than they are: activity that appears significant on the surface, but doesn’t hold up when institutions pressure-test durability, unit economics, and operational maturity.
That framing matched the agenda-level emphasis at Consensus. The “Advanced Trading” programming was positioned around liquidity mechanics, security considerations, and a shifting regulatory landscape, including the role of cross-chain solutions and emerging protocols in making markets more transparent and efficient.
It felt as though being ‘institutional-grade’ has become a default requirement for projects in the space. Uptime, incident response, governance, and compliance aren’t secondary concerns anymore.
That is also why infrastructure providers that can point to hard usage metrics have gained an edge in these conversations. Pyth Network, for instance, publicly says it has integrated 600+ protocols across 100+ blockchains and delivers thousands of price feeds, with a growing share tied to real-world assets.
Self-custody, the education gap, and why aggregation is becoming the default
One of the more useful signals at Consensus came from Andrey Fedorov, CMO & CBDO of STON.fi Dev, in an exclusive interview with BeInCrypto. He spoke to a product-design tradeoff, where DeFi teams either optimize for user acquisition speed or for principles that hold up when capital and scrutiny arrive:
“We could grow faster if we compromised on custody. But then we wouldn’t be building DeFi infrastructure – we’d be building another fintech layer.”
As more regulated capital comes into the market, the bar rises for what counts as acceptable custody, acceptable risk, and acceptable operational responsibility. A self-custody-first posture is not always the easiest route to distribution, but it seems from the event that that’s what the industry is focusing on building.
Fedorov also put a spotlight on an interesting adoption blocker:
“If someone loses their seed phrase, we can’t restore access. We don’t have it. We’ve never had it. But quite often users still come to us expecting support, like they would from a bank or centralized exchange.”
Essentially, the industry is still training users to understand what self-custody means. It’s clear that work on education is part of the cost of building non-custodial systems at scale.
Fedorov came prepared with a solution, however – distribution and aggregation:
“Make things easier for those who don’t want to think about technical stuff. Get wider distribution by integrating into all the apps. And aggregate liquidity from multiple blockchains, not just one. That’s the roadmap. Now it’s about scaling it.”
That’s also exactly how Consensus framed advanced trading this year – with cross-chain solutions and new protocols positioned as drivers of efficiency and accessibility.
Here, in STON.fi’s case, we could highlight Omniston, which the team positions as a liquidity aggregation protocol designed for TON, connecting multiple liquidity sources through a single integration.
Hong Kong’s welcomes institutional scale, with training wheels
Of course, many of the conference’s institutional conversations centered on the U.S. ETFs, precedent, and what McClurg called “soft regulation”. However, Consensus Hong Kong also had a clear local narrative running through the main stage. Hong Kong wants to be a global hub for digital assets, but it wants that growth routed through licensing, investor protection, and risk management.
In his opening address, John Lee (Chief Executive of the Hong Kong SAR) pitched Hong Kong’s approach as deliberately “steady and sustainable,” pointing to an actively built regulatory framework and a policy direction aimed at turning Web3 potential into real financial-market outcomes.
This all became a little more concrete in remarks by Paul Chan (Financial Secretary), who laid out what the government sees as the major institutional-facing trends: tokenization of real-world assets moving from proof-of-concept to deployment; deeper interaction between TradFi and DeFi (with DeFi also facing growing regulatory pressure); and the accelerating overlap between AI and digital assets, including early ‘machine economy’ concepts where autonomous systems transact on-chain.
Consensus 2026 proved that capital is willing to engage, but it demands environments where rules are legible, and intermediaries are accountable.
Stablecoins and tokenization
Lee also tied Hong Kong’s “hub” ambition directly to its new stablecoin regime. He pointed to the Stablecoins Ordinance and said the HKMA was already processing applications, with the first batch of fiat-referenced stablecoin issuer licences expected “within the next month.”
Eddie Yue, the HKMA’s Chief Executive, separately told lawmakers the first batch is expected in March 2026, and that only a “very small number” of licences will be granted initially. The emphasis is on use cases, risk controls, AML, and reserve backing.
Chan used his keynote to explain what this approach means for institutions. Tokenization is moving from proof-of-concept to deployment, led by on-chain versions of familiar instruments such as government bonds and money market funds.
He supported that framing with local metrics. These included Hong Kong’s tokenized green bond programme, banks holding over HK$14 billion in digital assets under custody by the end of 2025, and tokenized deposits reaching HK$29 billion.
Separately, a main stage conversation on RWA tokenization brought together senior leaders from Securitize, Ondo, and J.P. Morgan’s Kinexys dove deep into how Real World Assets are increasingly being treated as part of familiar institutional categories.
From the event, it was clear that payments, settlement, and regulated issuance are now the main competitive arena. Even the “Machine Economy” discussions (AI agents, robotics, on-chain execution) kept coming back to licensed issuers, enforceable AML and controls, and auditability, among other things.
Risk appetite is back, but it’s not unconditional
The simplest way to describe where the market is heading is that institutional adoption is becoming a procurement game. The checks are on compliance posture, governance, uptime, incident response, and whether the business model survives scrutiny once you strip out cyclical volume.
Two signals made the direction clear. The agenda leaned hard into market structure (liquidity, security, regulation, and cross-chain execution) and made the point that enterprise-grade crypto infrastructure only works with regulatory backing, with Hong Kong’s stablecoin licensing push as the clearest example.
Indeed, risk appetite is returning, but it’s conditional. Capital will move faster when the foundations behave predictably. After all, that’s what makes crypto legible to investment committees and survivable under stress.
Looking ahead to Consensus Miami (May 5-7, 2026), the agenda is set to dive further into stablecoins, tokenization, capital markets, and regulation, with dedicated programming for Bitcoin (including mining and institutional strategy) plus formats like Wealth Management Day, Stablecoin University, PitchFest, and the Hackathon.


Siren price shot up 127% to $2.34 on Monday morning, becoming the best-performing crypto asset of the day.
Summary
- SIREN surged 127% to an intraday high of $2.34, driven by a sharp rise in futures demand, with open interest jumping nearly 120% to $121 million.
- The rally occurred without major fundamental updates, with derivatives positioning showing a bullish bias as the long-short ratio remained above 1.
- The token remains vulnerable to a reversal, with past price action showing a 70% drop from its peak amid concerns over high supply concentration among large holders.
According to data from CoinGecko, Siren (SIREN) price soared to an intraday high of $2.34 on Monday morning before stabilizing at $2.19 at the time of writing. Its market cap stood at $1.56 billion, making it the 50th largest crypto asset in the market.
While there was no particular news on development or ecosystem updates to account for SIREN’s rally today, it was likely linked with significant demand for the token in the futures market.
Notably, data from Coinglass show that SIREN futures open interest surged nearly 120% to $121 million over the past 24 hours. At the same time, the long/short ratio sat at over 1, a sign that more traders were going in with a bullish outlook.
While such rallies often spark excitement, it should be noted that they often face a deep retracement as investors rush to book in profits.
For instance, Siren previously rallied to an all-time high of $3.61 on March 22 after climbing up for several straight days owing to its rebrand into an autonomous AI agent on the BNB Chain and a successive perpetuals listing on multiple major crypto exchanges like Binance, Bybit, and MEXC. However, it came crashing down by over 70% from its peak after concerns about its supply concentration gained traction.
As reported by crypto.news earlier, on-chain data compiled by Bubblemaps revealed that nearly 50% of SIREN’s supply was held in one cluster. Subsequently, later reports revealed that the concentration could be as high as 88% of the total supply.
While the token has regained some momentum as seen by today’s surge, the token could be at risk of a reversal again should those large holders decide to sell off their positions.
Disclosure: This article does not represent investment advice. The content and materials featured on this page are for educational purposes only.

Key Takeaways
- NTGR opened at $24.75 on Tuesday and traded near $25.15 — marking a 15.9% increase
- The FCC instituted restrictions on new consumer router models produced outside the United States due to security vulnerabilities
- Approximately 60% of U.S. routers are believed to originate from Chinese manufacturing facilities
- While NETGEAR produces devices abroad, the company may pursue Conditional Approval through the DoW or DHS to market new products domestically
- Stifel Nicolaus maintains a Buy recommendation on NTGR with a $36 target, suggesting potential upside exceeding 63%
Shares of NETGEAR experienced a remarkable Tuesday session, climbing almost 16% following the Federal Communications Commission’s declaration that it would restrict new consumer routers produced outside American borders. This policy shift created ripples throughout the networking industry and drove investors toward NTGR.
The regulatory agency cited escalating cyberattack incidents targeting American consumers and small enterprises since 2024 as justification for the restriction. The FCC highlighted vulnerabilities associated with internationally-manufactured routers, emphasizing that roughly 60% of U.S. routers originate from China.
The restriction applies exclusively to newly introduced router models. Products already carrying FCC authorization — regardless of their manufacturing origin — retain permission for domestic sales.
NETGEAR develops its technology within the United States but relies on international facilities for production. This business model means its upcoming products would technically fall within the ban’s scope. Nevertheless, the company maintains the option to pursue Conditional Approval through the Department of War or Department of Homeland Security, which would permit continued sales of foreign-manufactured routers domestically.
It bears mentioning that no major networking manufacturers currently produce consumer routers on American soil — placing NETGEAR in the same boat as its competitors.
Market enthusiasm for NTGR seemed rooted in two primary assumptions: international competitors will encounter heightened barriers to the U.S. market, and NETGEAR might ultimately relocate production domestically to circumvent the restriction altogether.
Tuesday’s advance followed a 5.85% gain during the prior session, indicating upward momentum had already begun developing before the FCC’s policy announcement.
Latest Financial Performance
NETGEAR’s latest quarterly earnings provided additional momentum for the stock. The company delivered earnings per share of $0.26, significantly surpassing the $0.05 consensus projection. Revenue reached $182.47 million, outperforming analyst expectations of $177.26 million.
Despite exceeding estimates, the overall financial health presents challenges. NETGEAR operates with a negative net margin of 2.56% and a P/E ratio of -41.24. Market watchers currently project full-year EPS of -1.84.
The stock’s 50-day moving average rests at $21.19, with the 200-day average positioned at $25.82. Tuesday’s closing price of $25.15 returned NTGR to proximity of its long-term average.
Wall Street Perspective
Analyst coverage for NTGR remains sparse. During the previous three months, Stifel Nicolaus analyst Tore Svanberg assigned a Buy rating with a $36 price target — indicating potential appreciation exceeding 63% from present levels.
The overall analyst consensus includes two Buy recommendations, one Hold rating, and one Sell rating, with a mean price target of $36.00. Zacks recently upgraded the security from “strong sell” to “hold” in early March, while Wall Street Zen reversed course, downgrading to “sell” at the month’s beginning.
Institutional stakeholders control approximately 82.97% of NTGR shares. Insider ownership represents 2.3%, though insider Pramod Badjate divested 3,000 shares in early February at $20.97 per share.
For the year-to-date period, NTGR continues trading down 10.07%, and has declined 11.05% across the trailing twelve months despite Tuesday’s substantial gain.


Vienna-based crypto broker Bitpanda is launching a new blockchain network aimed at bringing tokenized assets into Europe’s regulated financial system, as institutions look to move toward always-on markets.
The company said Wednesday that its “Vision Chain,” built with the Vision Web3 Foundation and Optimism , will provide infrastructure for banks and fintechs to issue and settle tokenized assets under EU rules such as MiCA and MiFID II.
The network uses compliant euro-denominated stablecoins for transaction fees to avoid the volatility tied to typical crypto payments on public chains. It also relies on Optimism’s Ethereum-based infrastructure to handle settlement and scaling.
The move comes as firms across global finance push deeper into tokenization to upgrade market plumbing for around-the-clock trading. The technology is widely seen as a way to streamline how assets are issued, traded and recorded, cutting reliance on fragmented legacy systems. It’s potentially a massive market: tokenized assets could grow 53% a year, reaching $18.9 trillion by 2033 across asset classes, a joint report by Boston Consulting Group and Ripple estimated.
The initiative reflects a wider race among financial firms. Rival digital broker Robinhood (HOOD) is currently testing its proprietary blockchain dubbed Robinhood Chain, built specifically for tokenized stocks trading and connecting to decentralized finance (DeFi) applications. Wall Street behemoths such as Nasdaq and NYSE also work on their blockchain platforms for tokenized securities, merging crypto rails with the same compliance and safeguards as for traditional systems.
Bitpanda’s chain fits into the firms broader strategy to bridge crypto rails and traditional finance, offering banks and financial institutions blockchain plumbing to provide digital asset services to their customers.
“Tokenization is expected to redefine capital markets,” Lukas Enzersdorfer-Konrad, CEO of Bitpanda, said in a statement. “European financial institutions have been ready for this shift for years, but the infrastructure has been missing.
“With Vision Chain, we are building a public blockchain designed around Europe’s regulatory standards, combining the openness of public networks with the reliability institutions require,” he added.
Read more: Crypto broker Bitpanda bets on banks and tokenization to expand globally ahead of IPO plans


Irish authorities said they have gained access to one Bitcoin wallet tied to convicted drug dealer Clifton Collins, years after the recovery phrase was believed lost.
Summary
- Irish authorities accessed a lost Bitcoin wallet tied to Clifton Collins with Europol’s technical support.
- The seized wallet held 500 Bitcoin and formed part of Collins’ larger 6,000 Bitcoin stash.
- Blockchain data showed the recovered wallet moved funds to Coinbase Prime after years of silence.
The wallet held 500 Bitcoin, and the seizure followed support from Europol’s European Cybercrime Centre.
Ireland’s Criminal Assets Bureau said on Tuesday that it had “gained access to and seized a cryptocurrency wallet” linked to an earlier criminal case. The bureau said the wallet contained 500 Bitcoin, valued at more than $35 million at current market prices.
The agency said Europol supported the operation through meetings in The Hague and by providing technical help. CAB said Europol offered “highly complex technical expertise and decryption resources vital to the success of the operation.” Authorities did not explain how they gained access to the wallet.
The Irish Times reported that the recovered wallet was one of 12 wallets once linked to Collins. Those wallets reportedly held a combined 6,000 Bitcoin bought in late 2011 and early 2012 using proceeds from a cannabis operation.
According to earlier reports, Collins stored the wallet keys on a single sheet of A4 paper. He hid that paper inside the aluminum cap of a fishing rod case kept at his rented home. The paper later went missing, and access to the Bitcoin was widely believed to be gone.
Moreover, blockchain intelligence platform Arkham labeled one wallet “Clifton Collins: Lost Keys.” On Tuesday, that wallet moved 500 Bitcoin to Coinbase Prime, more than a decade after the coins were first deposited.
Arkham also lists Collins as controlling 14 addresses with total holdings of about 5,500 Bitcoin. Based on current prices, those holdings are worth more than $391 million. Cointelegraph said it contacted CAB and An Garda Síochána for more details on the recovery.
Case dates back to Collins arrest in 2017
The Guardian reported that police arrested Collins in 2017 after searching his car and finding cannabis. He was later sentenced to five years in prison for growing and selling the drug.
After the arrest, Collins said the fishing rod case had been stolen before his landlord cleared out the rental property. Authorities, however, later lost access to the wallets after the printed codes disappeared. The newly seized 500 Bitcoin wallet now marks a rare case where law enforcement recovered access to funds once thought unreachable.
Crypto World
There’s a huge $14 billion bitcoin options expiry this Friday and it points to $75,000 as price magnet
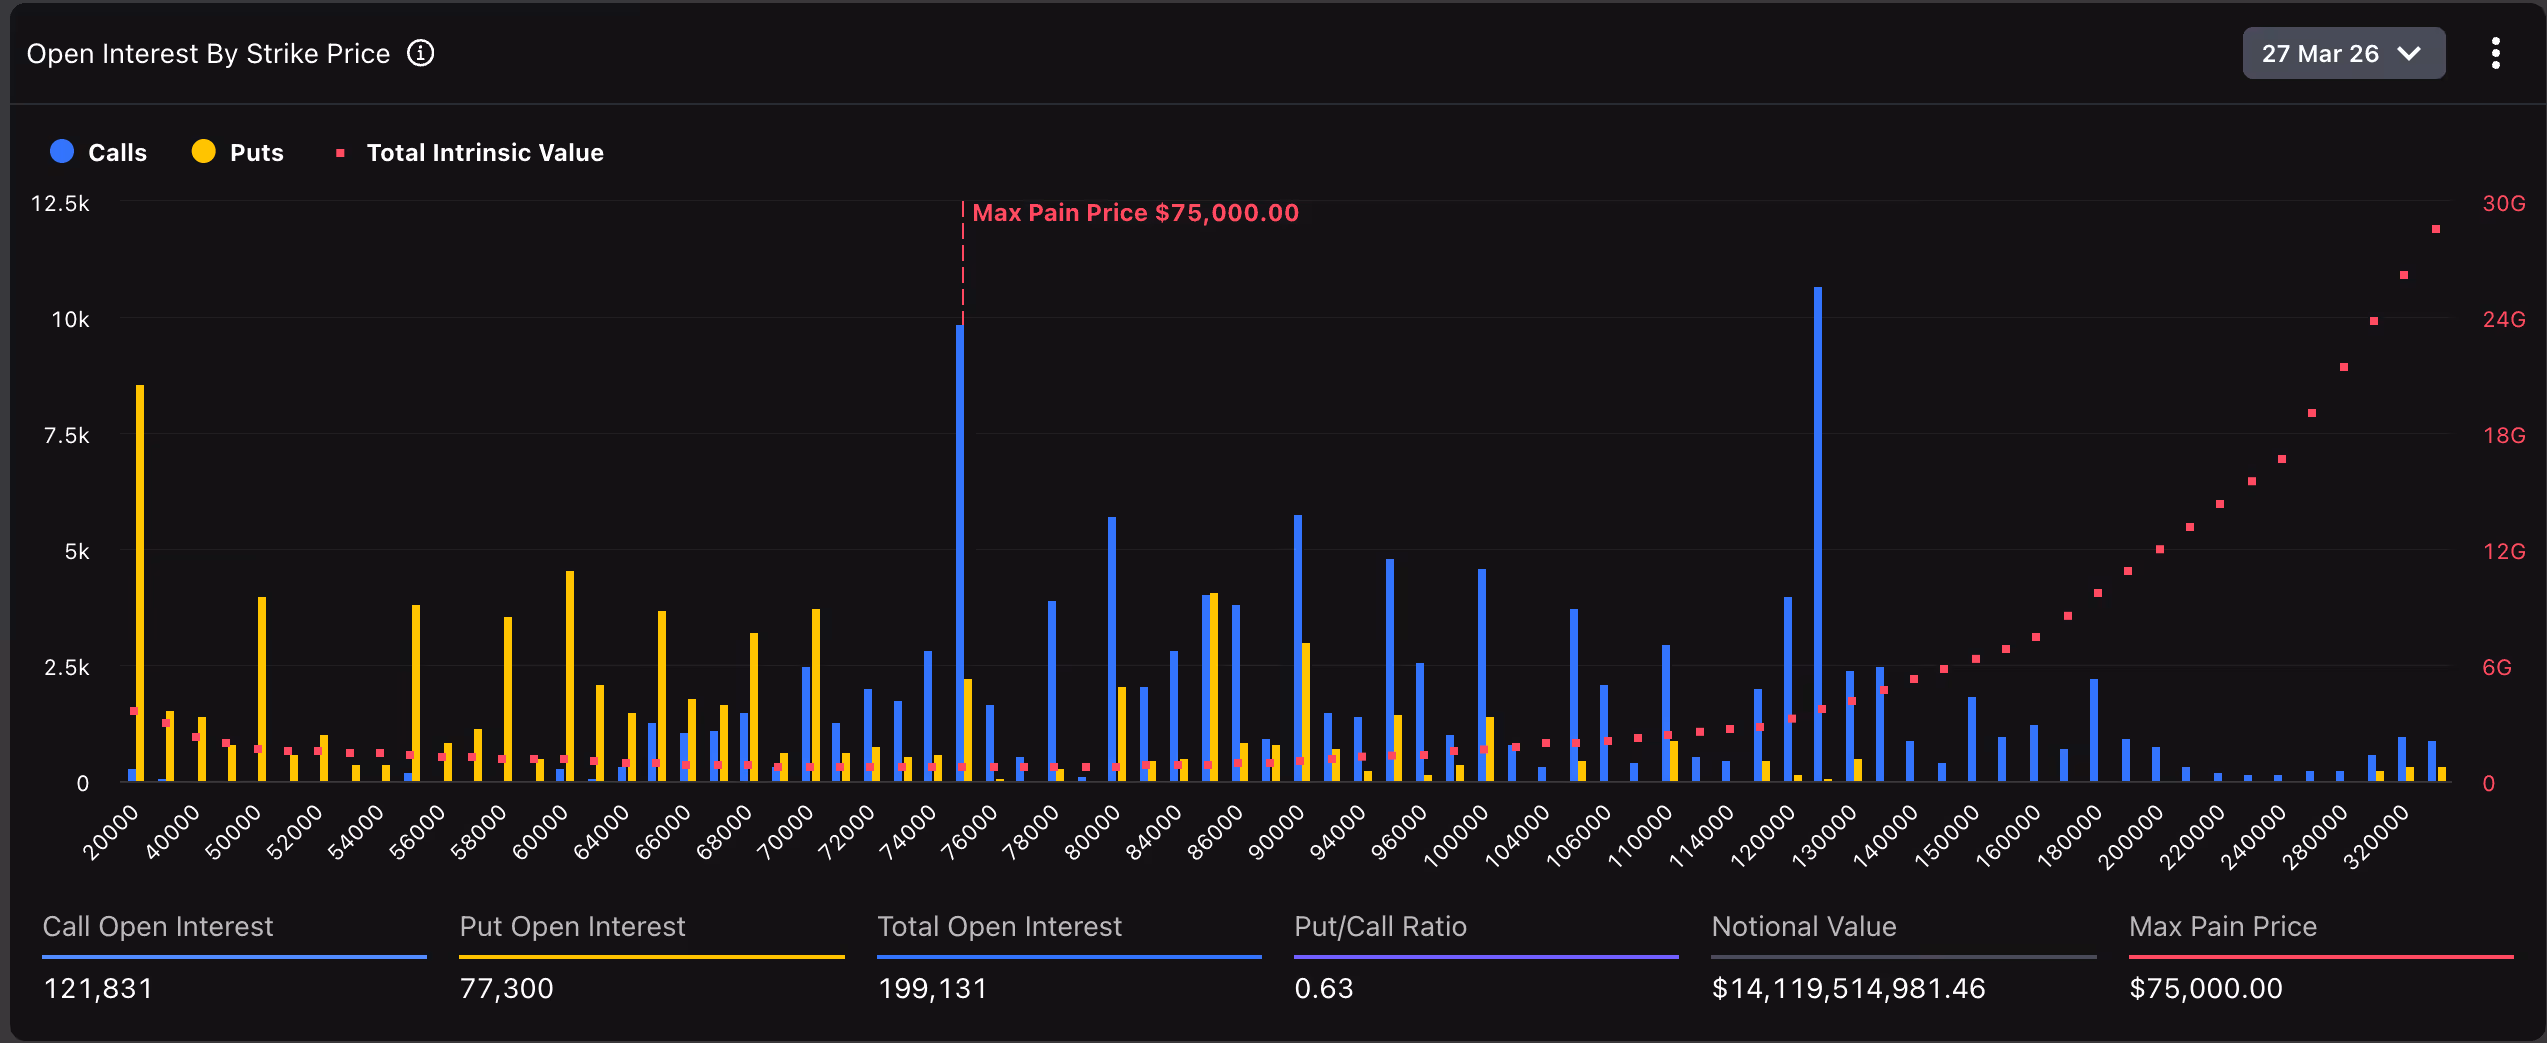
On Friday, bitcoin options or derivative contracts worth billions will expire on crypto exchange Deribit. Traders might want to note that the dynamics of the expiry are such that BTC’s market price could be lifted toward a very specific point: $75,000.
Deribit, the world’s largest crypto options exchange, will settle bitcoin options contracts worth $14.16 billion on Friday at 08:00 UTC. This means nearly 40% of all open interest – the dollar value of all active contracts on the exchange – ware set to expire in roughly 48 hours. On Deribit, one options contract represents one BTC.
Options are contracts that let you bet on whether the price of an asset, such as BTC, will go up or down. A call option is a bet that the price will go up, and a put option is a bet that it will go down. Traders buy options to try to profit from price swings, or write (short) options to earn income while taking on the risk that prices move in favor of the buyer.
Here’s why the expiry matters
According to Deribit’s data, the ‘max pain’ price — the level where the most contracts would expire worthless (lottery tickets that don’t win) — sits right at $75,000.
As such, this level could act as a magnet, according to Deribit’s Chief Commerical Officer Jean-David Péquignot.
“With Bitcoin currently trading near $71k, the $75k Max Pain price represents a gravitational pull. Historically, this encourages delta-hedging by market makers that can drive prices toward the strike where the most options expire worthless,” Péquignot told CoinDesk.

Here’s how it works. As per the max pain theory, option writers — typically large funds, institutions, or market makers with ample capital — control or influence the spot price toward the pain point to limit payouts to buyers and thereby inflict maximum damage on them. This happens through normal trading in the spot or futures markets, rather than as a guaranteed manipulation.
This mechanical buying and selling often pulls the spot price closer to the max pain level, which is $75,000 in bitcoin’s case.
While max pain is well-known in traditional markets, its influence on crypto remains debated. Deribit, however, flags the level as a potential magnet. Adding to the intrigue, several analysts have identified $75,000 as key resistance, above which bitcoin could go into a full-bull mode.
Controlled expiry
Quarterly expiries typically spark massive position adjustments and hedging flows. Still, the impending expiry is likely unfold normally, without an outsized volatility surge.
That’s evident from the decline in the implied volatility index.
“Over the last sessions, we have witnessed an implied volatility (IV) compression, with both BTC and ETH DVOL dropping by ~6 points. This suggests the market is pricing in a controlled expiry rather than an immediate explosion in volatility,” Péquignot said.
He added that the market data suggests that traders aren’t chasing a breakout as geopolitical uncertainty in the form of Iran war lingers. He specifically pointed to call writing by institutions at higher strikes (levels above going spot price) as the evidence of measured bullish sentiment. Traders typically write overhead calls to collect premiums on top of their spot market holdings.
“The Put/Call ratio for Bitcoin options remains healthy (0.63), but the concentration of sell-side calls suggests a ceiling of institutional resistance as traders have been overwriting their positions to bank premium while waiting for the geopolitical clock to run out,” he noted.
All in all, the big expiry with $75,000 acting as a magnet comes at an intriguing juncture: bitcoin has held up remarkably well through the Iran war turbulence, maintaining strength even as equities wobble and energy markets remain fickle.

TLDR:
- Saudi Arabia lost $300 billion in stock market value within 25 days of Gulf conflict escalating regionally.
- Brent crude trading at $90–$110 per barrel turns infrastructure losses into net windfall revenue for Riyadh.
- Saudi’s Red Sea bypass pipeline positions the kingdom as the dominant exporter while Hormuz stays closed.
- MBS continues lobbying Washington for Iran strikes despite Iranian drones hitting Saudi refineries each night.
Saudi Arabia has lost $300 billion in stock market value across 25 days of Gulf conflict. The Tadawul index fell 12 percent in the opening week.
Iranian drone strikes shut down Ras Tanura, the kingdom’s largest refinery, which processes 550,000 barrels daily. Regional output losses reached 10 million barrels per day by March 12.
Despite this damage, Crown Prince Mohammed bin Salman continues pushing Washington for more action against Tehran. The kingdom now serves as the conflict’s victim, beneficiary, and accelerant at once.
Saudi Arabia Bears the Costs While Oil Revenue Climbs
Saudi Arabia’s Vision 2030 megaprojects are currently under formal government review. Capital outflows have risen, and investor confidence has declined sharply in recent weeks.
The Crown Prince spent a decade building the very infrastructure now absorbing nightly drone strikes. Eastern Province oil fields have also taken direct hits alongside the Ras Tanura shutdown.
Analyst Shanaka Anslem Perera described the situation on X with pointed directness. He wrote that Saudi Arabia is “simultaneously the war’s victim, its beneficiary, and its accelerant.”
Interceptor stockpiles defending Saudi airspace are drawing down at a steady pace. Each successful Iranian strike raises fresh questions about the kingdom’s long-term air defense capacity.
Meanwhile, Brent crude is trading between $90 and $110 per barrel on global markets. Saudi Arabia’s national budget was originally calculated on oil at $65 to $70 per barrel.
Every barrel sold above that level adds windfall revenue to the Saudi treasury. At $110 Brent, the kingdom earns a surplus on every barrel it can still export.
Goldman Sachs had forecast a widening fiscal gap before the conflict began. At $80 Brent, that deficit narrows to between 3 and 3.5 percent of GDP.
The war damaging Saudi refineries is simultaneously pushing oil prices well above budget assumptions. Both the losses and the gains appear on the same national balance sheet at once.
Saudi Arabia Gains Structural Ground as Hormuz Stays Contested
Saudi Arabia holds between 2 and 3 million barrels per day of spare production capacity. It also operates an East-West pipeline that bypasses the Strait of Hormuz entirely.
That pipeline routes crude directly to the Yanbu terminal on the Red Sea. Kuwait, Bahrain, and Qatar have no comparable alternative export infrastructure available.
Qatar’s Ras Laffan facility cannot be rebuilt or restored for at least five years. Saudi Arabia’s Red Sea route has become the most critical active export pipeline in the world.
The New York Times reported that MBS sees a “historic opportunity to remake the region.” Saudi Arabia’s Foreign Minister has also publicly stated that the kingdom’s patience is “not unlimited.”
MBS has called Trump multiple times, lobbying for continued military pressure on Iran. Each American strike generates fresh Iranian retaliation against Gulf energy infrastructure in response.
That retaliation pushes oil prices higher, which funds the next Saudi lobbying push in Washington. This cycle has no exit point while MBS continues treating the conflict as strategic opportunity.
Saudi Arabia is positioned to dominate the post-war energy market as regional rivals weaken. A diminished Iran cuts OPEC competition for Riyadh directly going forward.
Qatar’s delayed North Field expansion benefits Saudi gas over the medium term. Every producer dependent on Hormuz concedes further competitive ground to Saudi Arabia’s Red Sea route.

Irish authorities have recovered a portion of a long-dormant Bitcoin stash tied to a convicted drug dealer, signaling a rare success in unlocking a decades-old cryptographic puzzle. The Criminal Assets Bureau (CAB) announced on Tuesday that it had gained access to and seized a cryptocurrency wallet containing 500 BTC, valued at more than $35 million, with crucial assistance from Europol’s European Cybercrime Centre.
Cabinet-level cooperation appears to have been pivotal. Europol reportedly hosted operational briefings at its headquarters in The Hague and supplied specialized technical expertise and decryption resources that supported CAB investigators and analysts in bringing the operation to fruition.
The wallet is part of a cluster of 12 addresses holding a total of about 6,000 BTC once linked to Clifton Collins, a drug dealer who received a five-year prison sentence for cannabis cultivation and distribution. The keys to these wallets were believed to be irretrievable after the paper containing them vanished from a fishing-rod case at Collins’ rental home.
“CAB gained access to and seized a cryptocurrency wallet” containing 500 BTC, the agency said, with support from Europol’s European Cybercrime Centre.
The disclosure underscores the evolving landscape of crypto asset recovery, where authorities increasingly combine off-chain investigations with on-chain tracing to locate and recover illicit funds long after their acquisition.
Key takeaways
- A 500 BTC wallet, one of 12 tied to Clifton Collins, has been seized by Irish authorities with Europol’s help, valued at over $35 million.
- The broader stash comprises about 6,000 BTC spread across 12 wallets, deposited by Collins in 2011–2012 and guarded by a paper key hidden in a fishing-rod case.
- Blockchain analytics firm Arkham has linked a wallet labeled “Clifton Collins: Lost Keys” to recent movement in the wallet cluster, including a transfer to Coinbase Prime.
- Arkham’s data indicate Collins controls 14 addresses with a total of roughly 5,500 BTC, valued at more than $391 million, highlighting the persistence and scale of his holdings despite prior legal actions.
- The case illustrates how cross-border law enforcement collaboration and decryptive capabilities can unlock “lost” crypto memories that were once deemed inaccessible.
Tracing a decade-old stash and its implications
The seizure traces back to a long-running narrative of how crime proceeds were converted into Bitcoin more than a decade ago. The 6,000 BTC in question reportedly flowed to multiple wallets in late 2011 and early 2012. Police describe the storage as an audacious yet ultimately fragile arrangement: private keys scattered across 12 wallets, and crucially, paper-based credentials hidden inside an aluminum cap within a fishing-rod case. When Collins was arrested in 2017, authorities say the landlord cleared out the rental home and discarded many belongings, complicating any effort to recover the keys.
While this story has a long tail in public reporting, the latest development shows that some of those “lost keys” can still unlock real value under the right circumstances. The Guardian’s coverage of Collins’ case provides the background on the criminal operation and the 2017 arrest, underscoring how a single possession—an apparently ordinary fishing-rod case—could become a cryptographic Achilles’ heel decades later.
Fresh on-chain activity and what it signals
Beyond the 500 BTC seizure, on-chain observers have noted movements linked to the Clifton Collins wallet cluster. Arkham, a blockchain analytics platform, traces a transfer of 500 BTC to Coinbase Prime from a wallet labeled “Clifton Collins: Lost Keys” on a recent Tuesday. Arkham’s explorer shows Collins as the controller of 14 addresses holding a combined 5,500 BTC, currently valued at more than $391 million.
The development has several practical implications. For investors and fund managers, it highlights that even “cold” assets tied to past criminal activity can re-enter the market or be moved to regulated custodians, potentially affecting liquidity and spot availability in sensitive coins. For traders and risk managers, it underscores the ongoing risk of asset provenance concerns—an issue that can influence compliance checks, KYC/AML workflows, and the perception of who ultimately controls large, long-dormant holdings.
Context and what to watch next
The case sits at the intersection of criminal finance, digital asset forensics, and international enforcement. It underscores the growing role of institutional-grade assistance in crypto asset recovery, including decryption resources and cross-border coordination. While only a portion of Collins’ original stash has been recovered to date, authorities have signaled that the collaboration with Europol will continue to pursue the remaining wallets where possible.
Readers should monitor further updates from the CAB and Europol as the investigation unfolds. The Arkham disclosures also warrant attention, as additional wallets in the cluster could surface new movements that shed light on the ultimate disposition of the roughly 6,000 BTC tied to Collins’ operations. The broader takeaway is clear: the line between traditional crime and digital assets is continually being redrawn as investigators apply both on-chain analytics and cooperative legal channels to recover illicit proceeds.
In the coming weeks, observers should watch for any additional wallet recoveries, updates on the status of the 12-wallet cluster, and whether more of Collins’ holdings surface in public or institutional custody. The episode serves as a reminder that even long-standing crypto hoards can be traced, unlocked, and, in some cases, repurposed for asset recovery and restitution.


Ripple is moving ahead with new payment plans tied to its RLUSD stablecoin as it targets faster cross-border trade settlement.
Summary
- Ripple and Unloq are testing RLUSD in Singapore to automate trade payments on XRP Ledger.
- BLOOM gives Ripple a regulated sandbox to test settlement tied to shipment verification and financing.
- The pilot adds to Ripple’s broader payments expansion in Asia and planned Australian licensing push.
According to the announcement, the company is working with supply chain finance firm Unloq to test a trade finance model on the XRP Ledger through BLOOM, a sandbox run by the Monetary Authority of Singapore.
Meanwhile, the pilot will examine whether RLUSD can replace manual payment steps that have slowed trade finance for years. Ripple and Unloq said the system can release payments “automatically when predefined conditions are met, such as shipment verification.”
Ripple plans to use RLUSD as the settlement asset in a pilot built with Unloq’s SC+ platform. The project aims to combine trade obligations, settlement rules, and financing workflows in one execution layer on the XRP Ledger.
The companies said current trade finance still depends on manual checks, documentary credits, and correspondent banking links that often take days or weeks to complete. They said the new model seeks to reduce delays by automating payment release once agreed trade conditions are verified.
The pilot will run inside BLOOM, which stands for Borderless, Liquid, Open, Online, Multi-currency. MAS launched the initiative in October 2025 to expand settlement options for tokenized bank liabilities and regulated stablecoins.
Ripple said the test will focus on whether RLUSD can replace manual processes that have “slowed cross-border trade for decades.” The companies also said the model could give firms better visibility into settlement risk while helping smaller businesses access trade-finance services.
RLUSD growth supports Ripple’s wider payments plan
Ripple launched RLUSD in December 2024 with institutional use as its main target. The stablecoin has grown to a market value near $1.5 billion, placing it among the largest stablecoins by market capitalization.
The BLOOM pilot comes less than four months after Ripple said MAS approved an expanded scope of payment activities for Ripple Markets APAC in December 2025. That approval added to Ripple’s push to deepen its role in regulated payment infrastructure in Asia.
As previously reported, Ripple has also outlined plans to expand in Australia through an Australian Financial Services License. The company said it aims to obtain that license by acquiring BC Payments Australia Pty Ltd., subject to the final completion process.


- Bitcoin price rebounds above $71,000 amid cautious market sentiment.
- Exchange outflows suggest long-term accumulation by investors.
- Geopolitical signals and Bitcoin transfers shape near-term trends.
Bitcoin has bounced back above $71,000 after a week of mixed signals in the market.
The move comes as investors closely watch geopolitical developments, particularly efforts to ease tensions in the Middle East.
Notably, a peace proposal between the United States and Iran has sparked cautious optimism, lifting risk assets and sending Bitcoin higher.
Despite the rebound, sentiment remains cautious, with the Fear & Greed Index at 35, signalling that investors are still in the “Fear” zone.
This suggests that while the price has recovered, many market participants are hesitant to commit fully, waiting for clearer direction.
Exchange outflows signal an accumulation phase
Recent on-chain data shows that more bitcoins have been leaving crypto exchanges than entering them.
This trend is often interpreted as a sign of accumulation.
Investors appear to be moving coins into private wallets for long-term holding rather than selling immediately.
The persistent outflows indicate confidence in Bitcoin’s fundamentals and a willingness to weather short-term price swings.
This accumulation behaviour can help reduce selling pressure in the market.
When coins leave exchanges, fewer are available for immediate trading, which often supports the price even during periods of uncertainty.
Bhutan Government moves $37 BTC
Adding another layer to the market dynamic, the Royal Government of Bhutan recently moved roughly $37 million worth of Bitcoin from government-controlled wallets, according to Arkham Intelligence data.
Analysts see this as a structured transfer rather than a sudden liquidation, suggesting careful treasury management.
While the exact motives are not fully public, such large-scale movements highlight that governments and large holders can influence liquidity.
These actions can affect market psychology, especially when combined with broader investor accumulation trends.
Bitcoin price forecast for the coming days
Overall, the market is in a consolidation phase, seeking a catalyst to define the next sustained move.
Exchange outflows, government movements, and geopolitical developments are all factors that could influence the next direction.
The recent Bitcoin price movements suggest that it may have recently hit bottom around $67,500, even though the broader picture is still uncertain.
But whether the current recovery signals a true bottom or just a temporary rebound remains to be seen, although the combination of accumulation behaviour, controlled government movements, and cautious optimism on geopolitical developments has created an environment where Bitcoin can maintain support and potentially build momentum.
A daily close above $73,000 could signal strength and potentially push the price toward $75,000, according to analysts.
Conversely, a break below $70,000 might prompt a retest of $67,500 support, marking a critical line for short-term investors.

European currencies are trading without a clear direction against the US dollar, remaining in a consolidation phase following the earlier decline driven by USD strength. At the start of the week, both EUR/USD and GBP/USD attempted a recovery, but the upside proved limited, and the pairs are now testing the upper boundaries of their short-term trading ranges.
Market participants are adopting a wait-and-see approach ahead of the release of key macroeconomic data, which could determine the next direction for the dollar and major currency pairs. Geopolitical uncertainty in the Middle East remains an additional factor weighing on sentiment. Reports of ongoing tensions and risks to energy supply disruptions continue to support elevated oil prices, fuelling inflation expectations and prompting investors to reassess the outlook for central bank policy.
Today, the focus is on business activity and inflation data from Europe and the UK, as well as housing market and consumer activity figures from the US. These releases could significantly impact interest rate expectations, prompting traders to refrain from opening large positions ahead of the data.
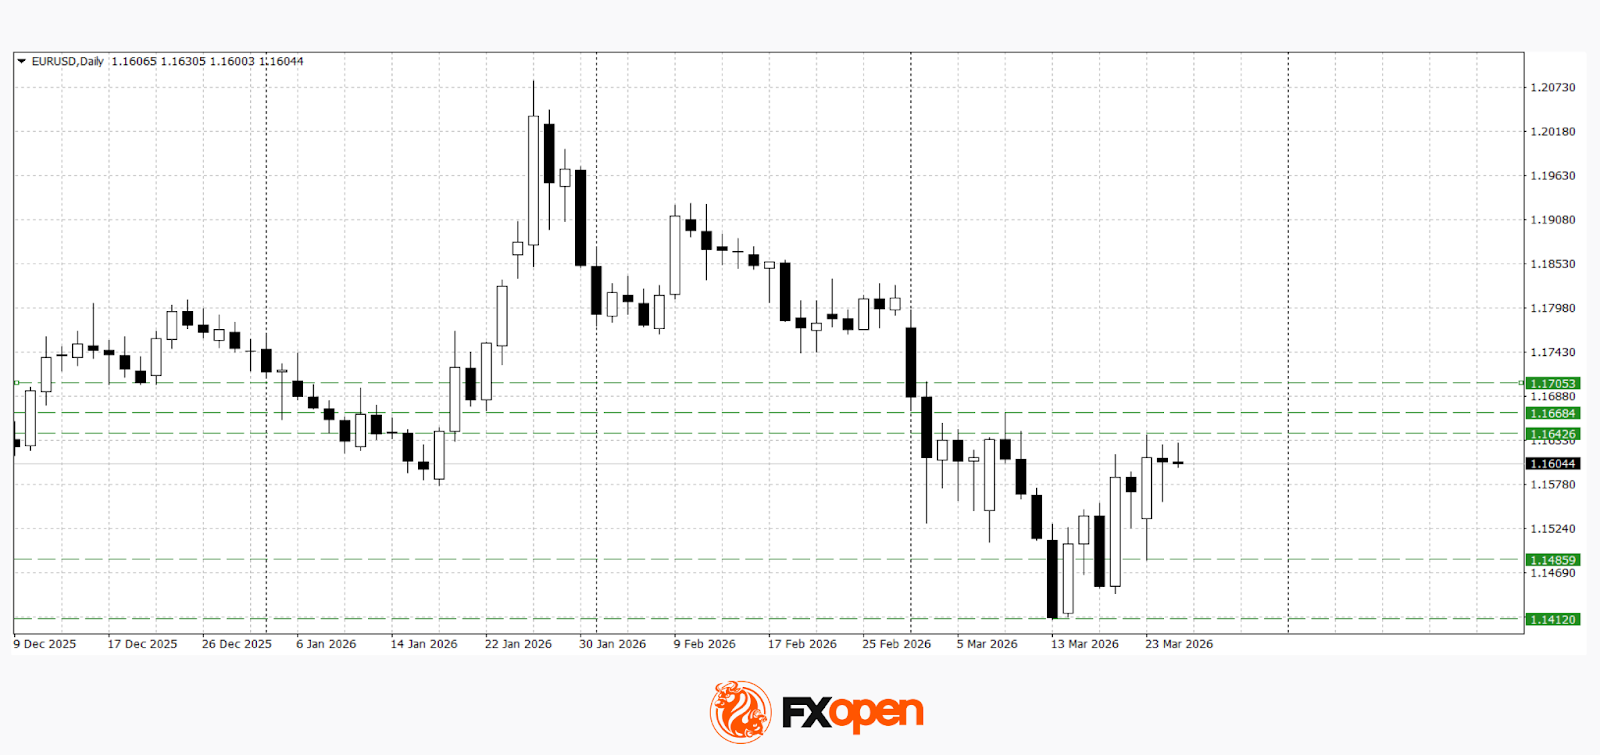
EUR/USD
At the start of the week, EUR/USD tested key support near 1.1480 before rebounding above 1.1600. Technical analysis suggests a range-bound market: a rejection from the key resistance level at 1.1640 could lead to a renewed test of recent lows in the 1.1420–1.1480 area. Conversely, a firm break above 1.1640 and a move out of the range could open the way for further gains towards 1.1680–1.1710.
Key events for EUR/USD:
- Today at 11:00 (GMT+2): Germany business expectations index
- Today at 13:00 (GMT+2): Bundesbank monthly report
- Today at 14:30 (GMT+2): US current account balance
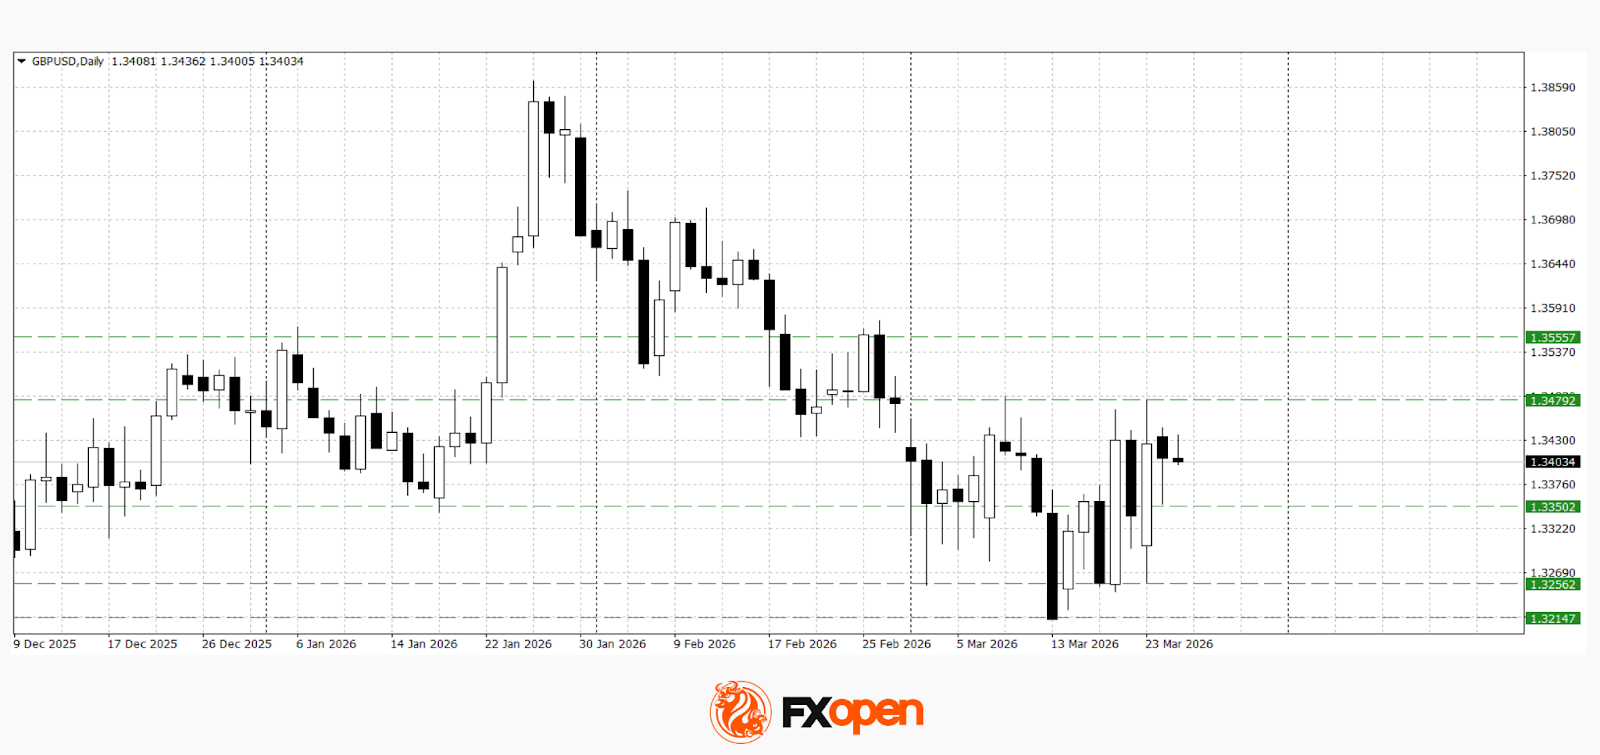
GBP/USD
GBP/USD is also trading within a range. Following last week’s Bank of England meeting, the pair strengthened towards 1.3480 but failed to sustain upward momentum, retreating to 1.3250 on Monday. Technical analysis points to the potential for a retest of the recent high; however, in the event of weak UK data, a move lower towards the 1.3350–1.3250 area is equally possible.
Key events for GBP/USD:
- Today at 09:00 (GMT+2): UK Consumer Price Index (CPI)
- Today at 11:30 (GMT+2): UK house price index
- Tomorrow at 11:30 (GMT+2): Speech by Bank of England Financial Policy Committee member Sarah Breeden
Trade over 50 forex markets 24 hours a day with FXOpen. Take advantage of low commissions, deep liquidity, and spreads from 0.0 pips (additional fees may apply). Open your FXOpen account now or learn more about trading forex with FXOpen.
This article represents the opinion of the Companies operating under the FXOpen brand only. It is not to be construed as an offer, solicitation, or recommendation with respect to products and services provided by the Companies operating under the FXOpen brand, nor is it to be considered financial advice.

Scarborough resident ‘lost faith in democracy’ over council plan

On Holding names co-founders as CEOs

Siren price rallies over 125% to $2.34, is a reversal coming?


-
 Crypto World4 days ago
NIO (NIO) Stock Plunges 6.5% as Shelf Registration Sparks Dilution Worries
-

 Fashion5 days ago
Weekend Open Thread: Adidas – Corporette.com
-

 Politics5 days ago
Jenni Murray, Long-Serving Woman’s Hour Presenter, Dies Aged 75
-

 Crypto World3 days ago
Best Crypto to Buy Now: Strategy Just Spent $1.57 Billion on Bitcoin During Fear While Early Investors Quietly Enter Pepeto for 150x Potential
-

 News Videos7 days ago
RBA board divided on rate cut, unusually buoyant share market | Finance Report | ABC NEWS
-

 Crypto World3 days ago
Bitcoin Price News: Bhutan Sells $72 Million in BTC Under Fiscal Pressure, but the Smart Money Entering Pepeto Sees What the Market Does Not
-

 Politics7 days ago
The House | The new register to protect children from their abusers shows Parliament at its best
-

 Tech5 days ago
inKONBINI Lets You Spend Summer Days Behind the Register
-

 Crypto World7 days ago
Canada’s FINTRAC revokes registrations of 23 crypto MSBs in AML crackdown
-

 Sports2 days ago
Remo Stars and Kano Pillars Strengthen Survival Hopes in NPFL
-
 NewsBeat7 days ago
Residents in North Lanarkshire reminded to register to vote in Scottish Parliament Election
-

 News Videos7 days ago
PARLIAMENT OF MALAWI – PAC MEETING WITH REGISTRAR OF FINANCIAL ON AMARYLLIS HOTEL – INQUIRY LIVE
-

 Politics6 days ago
Gender equality discussions at UN face pushbacks and US resistance
-

 Business3 days ago
No Winner in March 21 Drawing as Prize Rolls to $133 Million for Next
-

 Business7 days ago
Who Was Alex Pretti? 5 Key Facts About the ICU Nurse Killed by Federal Agents in Minneapolis
-

 Sports2 days ago
Gary Kirsten Accuses Pakistan Cricket Board Of ‘Interference’, Mohsin Naqvi Responds
-

 Tech3 days ago
Give Your Phone a Huge (and Free) Upgrade by Switching to Another Keyboard
-

 Tech7 days ago
Inventec’s bizarre VeilBook laptop hides its touchpad under a sliding keyboard just to give cooling fans a little breathing room
-

 Sports5 days ago
2026 Kentucky Derby horses, odds, futures, preview, date: Expert who nailed 12 Derby-Oaks Doubles enters picks
-
Sports6 days ago
Vikings Free Agency Enters Phase 2 with Key Questions
You must be logged in to post a comment Login