Crypto World
CPI Data Countdown: Why the April 10 Print Is Make or Break for Bitcoin’s $75K Push

Bitcoin is consolidating just below $70,000 with one scheduled event this week capable of breaking the pattern in either direction: the March CPI print dropping April 10 at 8:30 AM ET. The binary is clean, if U.S. inflation data comes in soft enough to shift Federal Reserve language toward cuts, BTC $75K becomes an immediate technical target; if core CPI stays sticky above 0.3% month-over-month, the “higher for longer” scenario reasserts itself, and the path of least resistance points back toward $60,000–$62,000.
The Cleveland Fed’s nowcast – built on late-March data – projects a 0.84% monthly headline surge driven by gasoline prices up 26.2% year-over-year and diesel up 50.4%. That reading, if confirmed, would mark a sharp acceleration from February’s 0.27% headline and would effectively freeze any Federal Reserve pivot conversation through at least mid-summer. Macro crypto trading desks are already pricing two radically different worlds into options flow. Thursday’s print decides which one we’re in.
Bitcoin’s $75K Level: Full Technical Breakdown and Price Scenarios
Bitcoin Price Prediction: Reclaim $75,000 or Retreat to $60,000
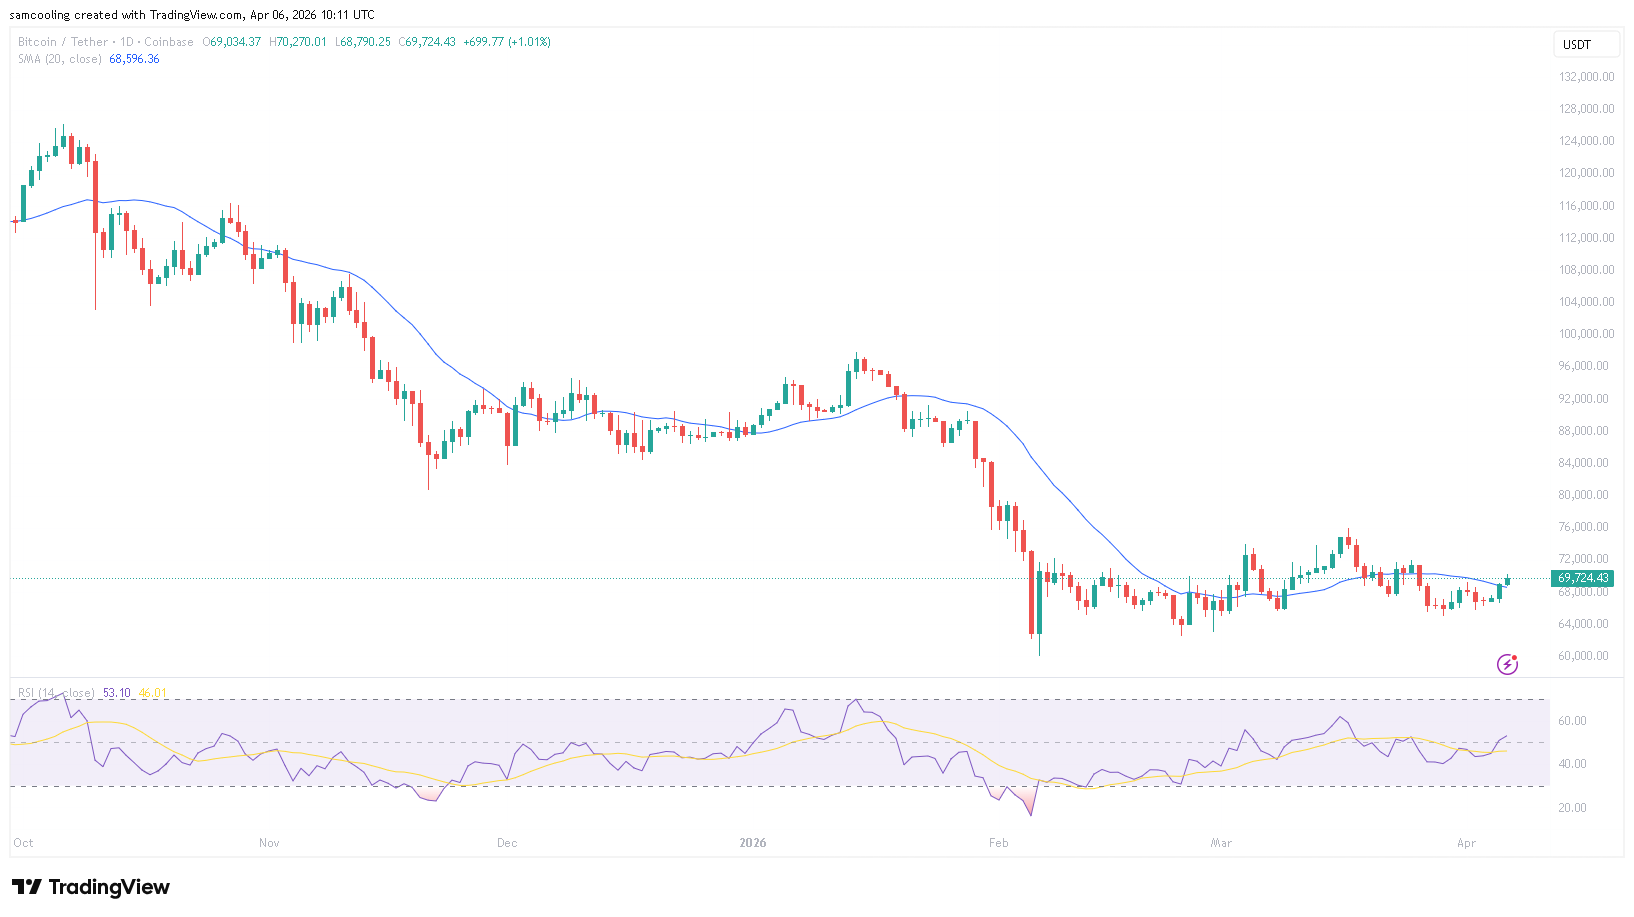

(Source – BTC USD, TradingView)
Bitcoin is currently rangebound between $65,000 and $71,000, a compression zone that has held for several weeks and is coiling into what chart structure suggests is a decision point. The $73,700 level above is the immediate overhead resistance; above that is the $75,000 psychological ceiling, which has acted as a load-bearing level since BTC’s last failed breakout attempt.
A weekly close above $75,000 on CPI-driven volume would be the first structural confirmation that the bull case is intact.
RSI on the daily is sitting near 53 – neutral, not oversold, which means there’s no technical floor being built from momentum exhaustion alone. The 200-day EMA is converging with the $67,500 support zone, making that level load-bearing in the near term. A daily close below $67,500 opens the door to $62,000, where significant order book depth and prior accumulation structure sit. MVRV ratio remains below 1.5, suggesting the market hasn’t reached the euphoria zone – but that also means on-chain buying pressure isn’t yet dominant enough to generate self-sustaining momentum.
The bull case requires a CPI-triggered risk-on move through $71,000, then a reclaim of $73,700 on sustained volume, with $75,000 as the confirming close. The bear case activates on a hot print: a rejection at $71,000 that cascades back through the 200-day EMA and targets the $60,000–$62,000 whale accumulation zone. For traders already holding, the downside scenario below $66,000 deserves serious risk modeling before Thursday. The single most important level: $71,000. Hold it post-print and the bull case lives. Lose it and $62,000 becomes the next anchor.
Why the April 10 CPI Print Resets the Fed Timeline – and Bitcoin’s Ceiling
The Bitcoin CPI relationship isn’t incidental – it’s mechanical. CPI drives Fed rate expectations, rate expectations drive the dollar and treasury yields, and dollar strength directly compresses institutional appetite for risk assets, including BTC. February’s CPI landed at 2.4% year-over-year with core holding at 2.5% annually for the second consecutive month, driven by shelter costs rising 0.2%. That stickiness kept “higher for longer” as the dominant Fed posture heading into April’s data cycle.
The threshold that matters for a Federal Reserve pivot signal is a core monthly reading at or below 0.2% – anything above 0.3% entrenches current policy and delays the first cut. CME FedWatch currently prices fewer than two cuts for 2025, a dramatic repricing from the four-cut consensus that opened the year. Energy is the wild card: the Cleveland Fed’s nowcast is being driven almost entirely by gasoline and diesel spikes, and the Fed has historically looked through volatile energy components when assessing underlying inflation trends. If headline runs hot but core stays controlled, traders may interpret that as a conditional green light.
March payrolls added 178,000 jobs, with unemployment holding at 4.3% – a labor market that doesn’t scream imminent recession and therefore gives the Fed cover to hold. The April 10 U.S. inflation data release won’t just move Bitcoin on the day; it will recalibrate the entire rate-cut timeline that institutional crypto positioning is built on.


(Source – CoinGlass)
Spot Bitcoin ETF inflows from BlackRock’s IBIT and Fidelity’s FBTC have shown direct sensitivity to CPI beats and misses – a hot print tightens that inflow tap immediately.
The post CPI Data Countdown: Why the April 10 Print Is Make or Break for Bitcoin’s $75K Push appeared first on Cryptonews.
You must be logged in to post a comment Login