Crypto exchange pushed back on $1.7 billion Iran-linked flow allegations and called media reports behind the probe “defamatory.”
Mar 6, 2026, 3:01 p.m.


Mar 6, 2026, 3:01 p.m.

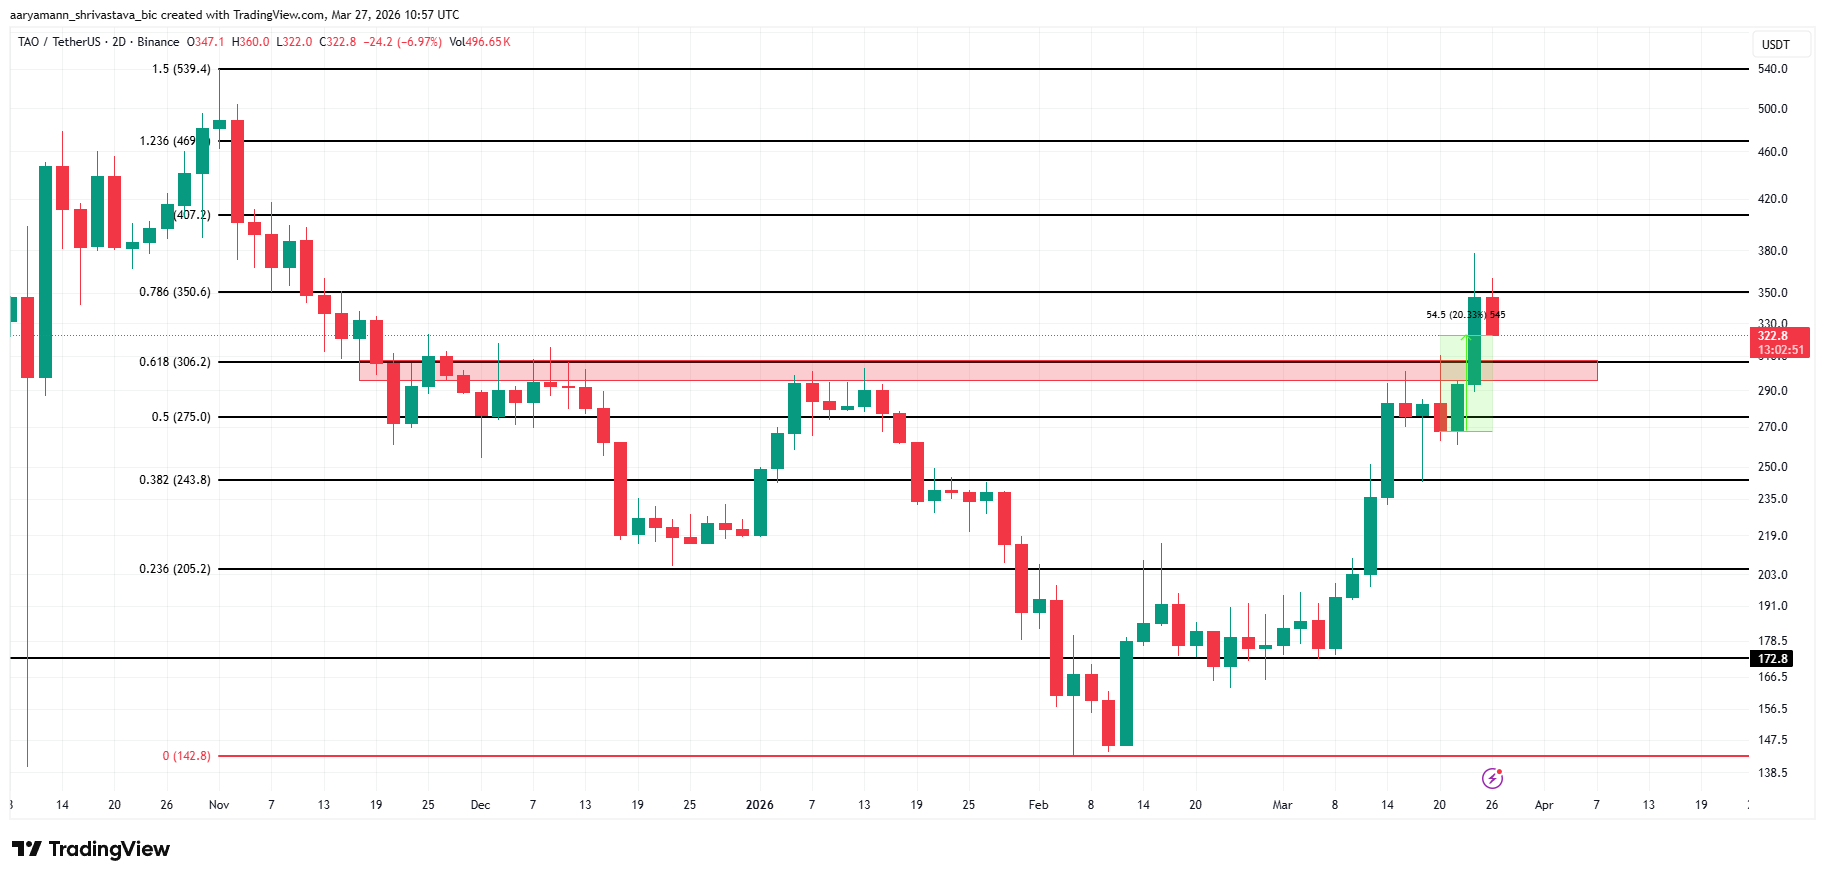
Bittensor (TAO) is trading at $322, down 6.97% on the session after briefly tagging $380 on March 26.
The 2-day chart shows TAO has cleared the 0.618 Fibonacci resistance zone at $306 that capped every rally for four months, but the move above it has immediately stalled.
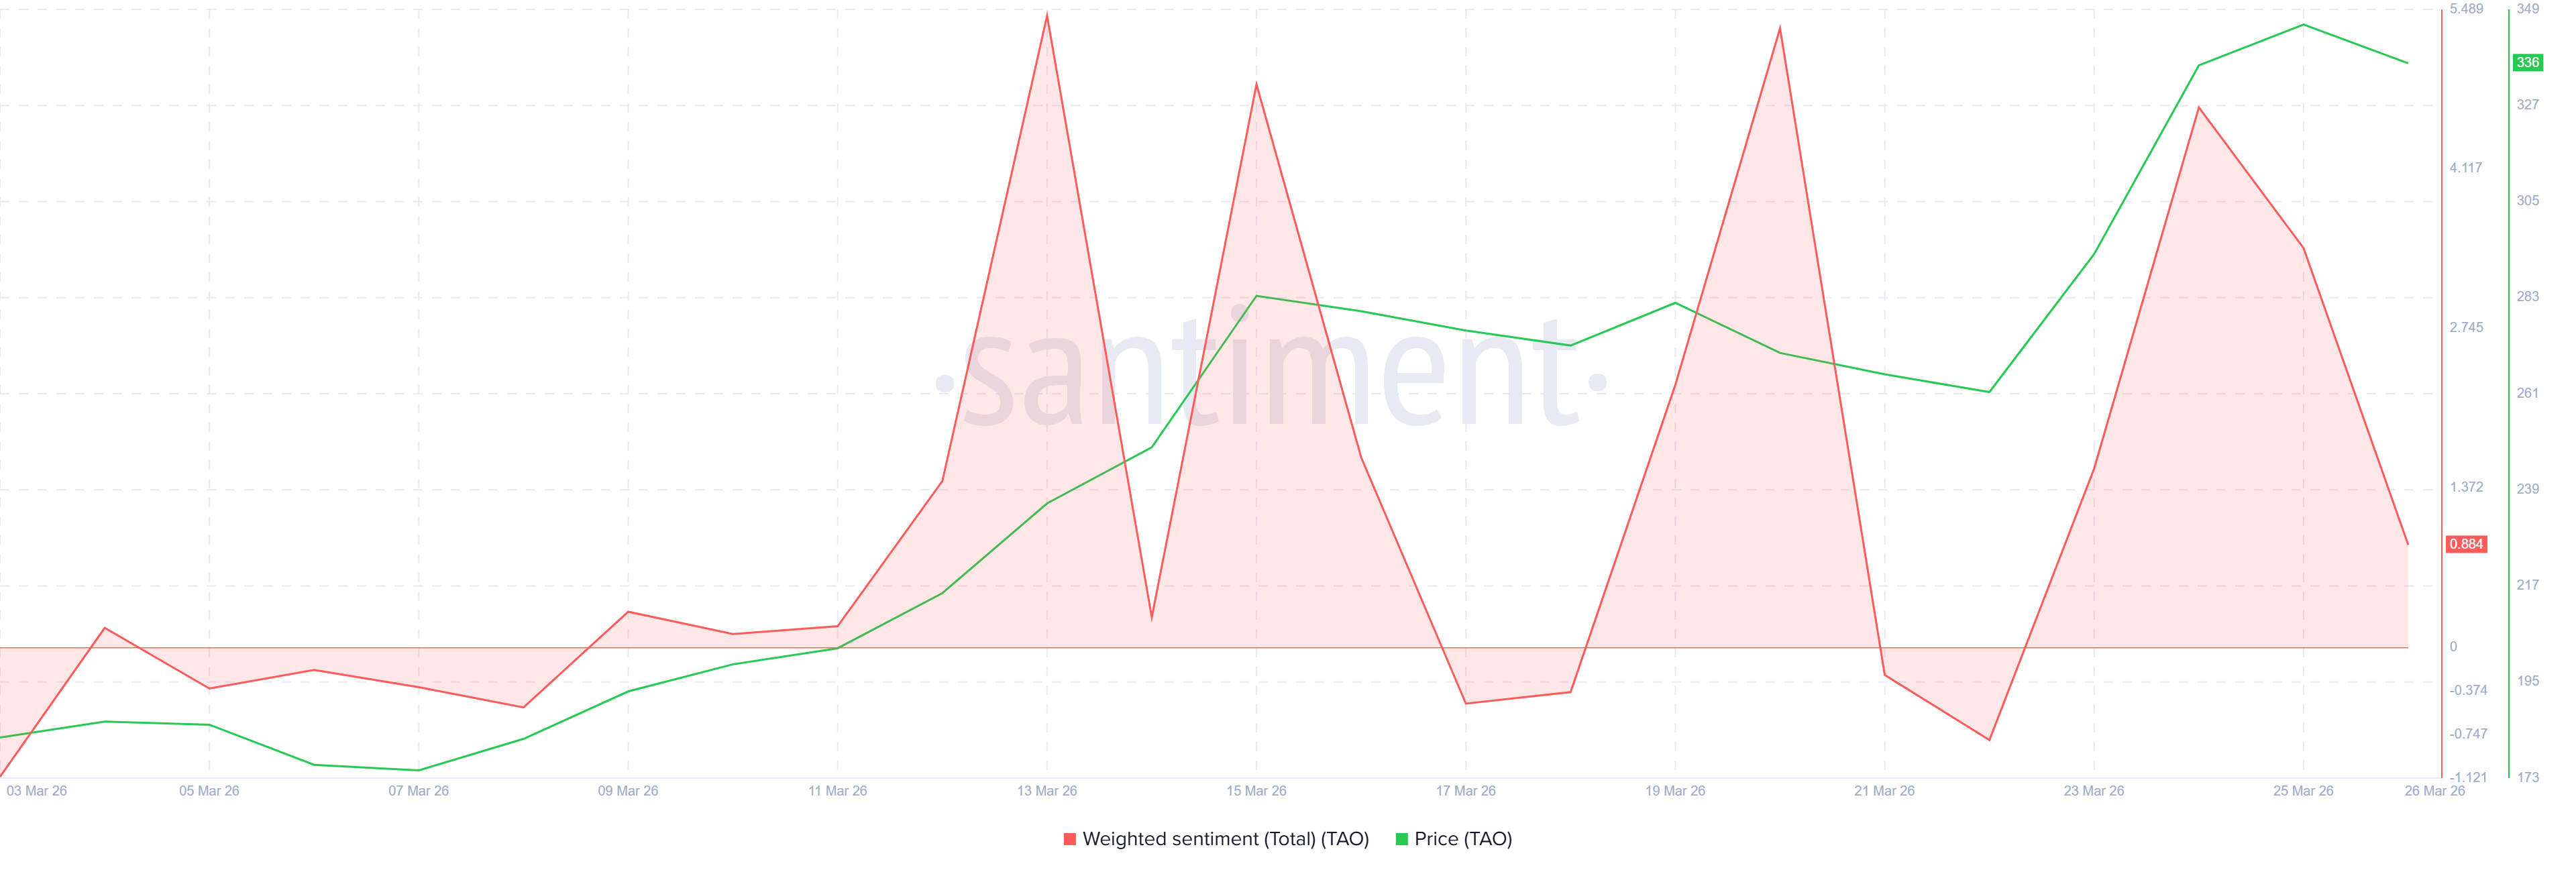
The Santiment weighted sentiment chart covers March 3 through March 26, 2026. TAO sentiment spiked to above 5.0 on March 25 — the highest reading on the chart — as price surged toward $380. By March 26, sentiment had collapsed to 0.684 as price reversed sharply.
This pattern repeated twice earlier in the month. On March 13, sentiment spiked sharply before price reversed from $305 back toward $260. On March 19, another sentiment spike preceded a drop from $290 back toward $250. Each time, elevated sentiment coincided with a local TAO price top rather than sustained upside.
Want more token insights like this? Sign up for Editor Harsh Notariya’s Daily Crypto Newsletter here.
The current reading of 0.684 is not yet negative, but the trajectory from above 5.0 to 0.684 in a single session mirrors the prior reversal patterns precisely. Sentiment drove capital into TAO at elevated prices and is now retreating, removing the buying pressure that generated the move.
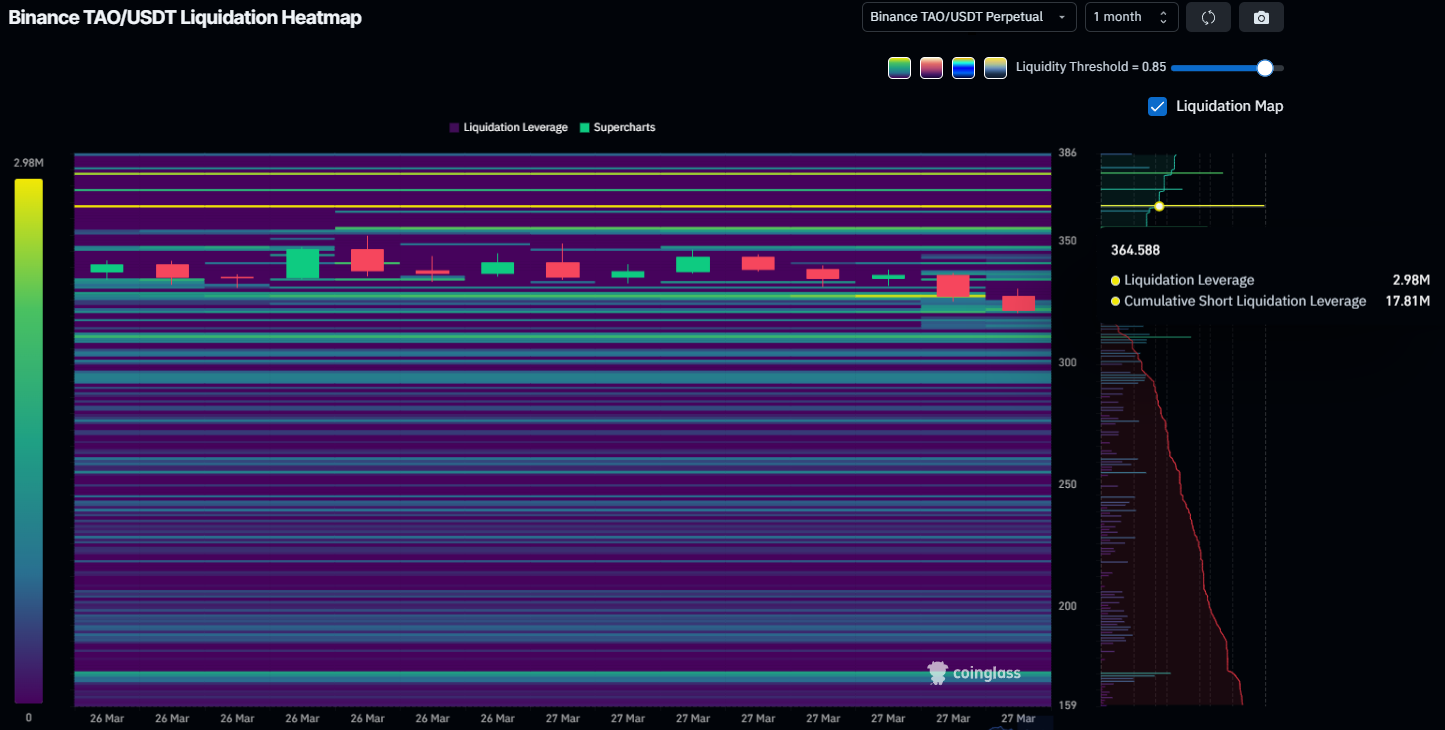
The TAO liquidation heatmap covers March 26 and 27. The brightest concentration of liquidation leverage — shown in yellow on the heatmap — sits at the $364 level, with 2.98 million in liquidation leverage at that exact price. Above $364, the cumulative short liquidation leverage reaches $17.81 million.
That $17.81 million short squeeze would be a powerful catalyst if triggered. A move through $364 would force those short positions closed, mechanically driving the price toward $407 and potentially $469. However, the 2.98 million in leverage concentrated at $364 itself acts as a magnet that also absorbs buying pressure, making it a ceiling before it becomes a springboard.
With sentiment already collapsed and price pulling back from $380 without clearing $364 on a close, the short squeeze scenario requires a fresh wave of buying that is not currently visible in either the sentiment data or the price structure.
TAO spent four months consolidating under the red resistance zone under the 0.618 level at $306. The annotated breakout measured move shows a 20.33% gain over the past week as TAO escaped it.
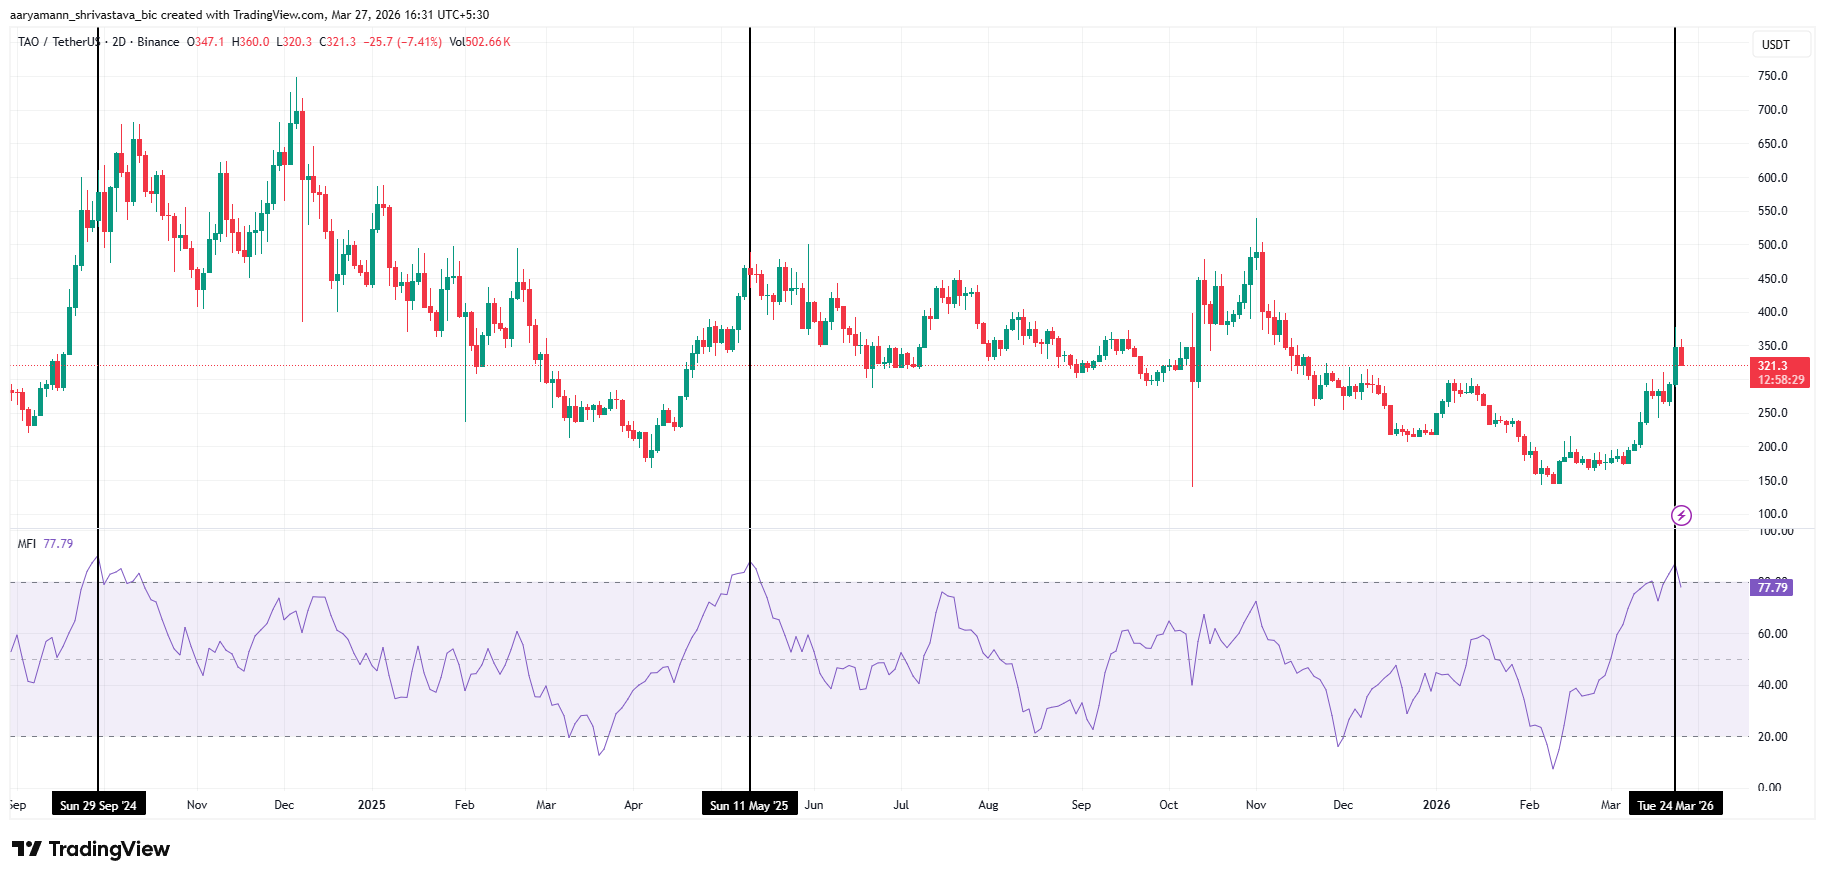
MFI adds further weight to the bearish near-term outlook. MFI reached the overbought threshold last week, and every prior instance where MFI reached this zone coincided with a local price top.
In September 2024, MFI touched the overbought threshold as TAO traded near $700. In May 2025, MFI again reached the same level before the price rolled over from $450 toward $300. The current reading at 77.79 places TAO in identical territory on both occasions that preceded significant drawdowns.
TAO at $322 is above the prior resistance zone. But, a daily close below $306 would confirm the breakout has failed and put the 0.5 level at $275 and then the 0.382 level at $243 in focus as the next support levels.
The bullish invalidation requires a 2-day close above $364. That would trigger the $17.81 million short squeeze and mechanically push the price toward the 1.0 level at $407 and then the 1.236 level at $469. Without that close above $364, the four-month resistance zone that TAO just escaped threatens to reclaim the token.
The post Bittensor (TAO) Escapes 4-Month Long Barrier, Yet Price May Not Reach $400 appeared first on BeInCrypto.


Morgan Stanley plans to price its proposed spot bitcoin exchange-traded fund (ETF) at 14 basis points, a level just below current low-cost options for similar products, according to an amended filing with the U.S. Securities and Exchange Commission (SEC). The move could set off a new round of fee competition among existing funds.
The latest S-1 filing, filed Friday, shows the bank undercutting rivals that charge closer to 15 to 25 basis points. The lowest fee on the market today is Grayscale’s Bitcoin Mini Trust ETF , which carries a 0.15% expense ratio. Larger funds, including BlackRock’s iShares Bitcoin Trust (IBIT), priced their products at 25 basis points.
On paper, the gap looks narrow. In practice, it may be enough to shift money.
Spot bitcoin ETFs offer near-identical exposure. Each fund holds bitcoin and aims to track its price. That leaves cost as one of the few variables investors and advisors can act on. A financial advisor can move a client from one ETF to another with a single trade, keeping the same exposure while lowering annual fees.
That dynamic has shaped the ETF market before, and lower-cost products tend to attract inflows, while higher-fee funds can see assets drift out over time. Grayscale’s flagship product, its Bitcoin Trust (GBTC), holds about $10 billion in assets, down from $29 billion at launch in January 2024.
Morgan Stanley’s scale adds another layer. Its wealth management arm oversees trillions in client assets and has one of the largest adviser networks in the industry. Even small allocation changes across that base could move billions of dollars between funds.
The pricing decision also points to strategy. By entering with a lower fee, Morgan Stanley may be aiming to quickly gain share in a market where products are hard to differentiate. Cost and access, not structure, often decide which funds grow.
The filing follows confirmation from the New York Stock Exchange that it has issued a listing notice for MSBT, signaling the product could begin trading quickly if approved.
If regulators sign off, the fund would be the first spot bitcoin ETF issued directly by a major U.S. bank, setting up a new phase of competition where fees and distribution drive the outcome.
Stablecoins are once again at the center of the crypto business narrative — but for very different reasons.
Circle’s sharp sell-off this week highlights how sensitive crypto equities remain to regulatory headlines, even when the underlying business fundamentals appear unchanged. At the same time, developments in Canada show institutions are moving in the opposite direction, quietly laying the groundwork for stablecoin integration into traditional finance.
Elsewhere, prediction markets are facing growing pressure to clean up their act as regulators zero in on manipulation risks, while a new thesis from Forrester suggests the long-promised micropayments economy may depend less on infrastructure — and more on AI agents.
The latest edition of Crypto Biz points to a market where regulation, automation and institutional adoption are reshaping how value moves across crypto rails.
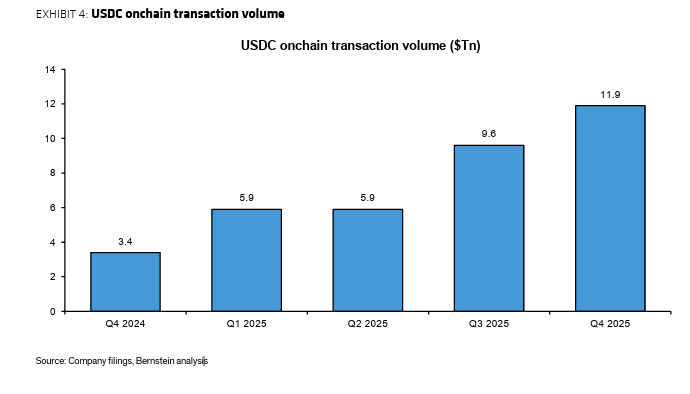
Shares of Circle plunged 20% on Tuesday after reports that a draft of the proposed CLARITY Act could restrict stablecoin rewards, but analysts at Bernstein say the market reaction may be mispriced.
In a Wednesday note, Bernstein analysts said investors are conflating “who earns yield” with “who distributes yield.” The draft legislation targets platforms that pass yield to users, they said, while Circle’s core revenue comes from reserve income on USDC (USDC), not reward distribution.
The legislative proposal would prohibit yield on passive stablecoin holdings or products deemed equivalent to interest, but leaves room for rewards tied to user activity, such as trading or payments. Bernstein said these carve-outs could still allow incentive structures without disrupting issuer economics.
Circle generates revenue primarily from interest on reserves backing USDC, which are largely invested in short-term US Treasurys. Bernstein estimates this income reached about $2.6 billion in 2025, underscoring what it views as limited direct impact from the draft bill.

Deloitte Canada is partnering with Stablecorp to bring stablecoin infrastructure into the country’s financial system, signaling growing institutional readiness ahead of new regulations. The initiative centers on integrating QCAD, a Canadian dollar–pegged stablecoin, into payment and settlement workflows.
The goal is to help financial institutions prepare for stablecoin adoption as Canada moves toward a formal regulatory framework for fiat-backed digital assets. Potential use cases include round-the-clock payments, faster settlement and improved transparency using blockchain-based systems.
QCAD is designed as a fully backed digital version of the Canadian dollar, aligning with expected regulatory requirements around reserves, compliance and risk management. This positions it as a candidate for institutional use once rules are finalized.

Prediction platform Polymarket is overhauling its rulebook amid intensifying scrutiny of allegations of insider trading and market manipulation. The updates apply to both its decentralized platform and its US-regulated exchange, signaling a push toward stronger compliance standards.
The new framework introduces stricter market design rules, clearer criteria for resolving outcomes and expanded surveillance systems to detect suspicious activity. Polymarket is also limiting certain markets considered highly manipulable or ethically sensitive.
The changes come amid mounting concerns that prediction markets may be vulnerable to traders with privileged information — especially in geopolitical or political event markets. Lawmakers and regulators have increasingly questioned whether such platforms blur the line between financial markets and gambling.

AI agents may finally make micropayments viable, according to a new analysis from Forrester, which points to Stripe’s Machine Payments Protocol (MPP) as an early example of the trend.
Forrester analyst Meng Liu said micropayments have historically struggled due to user friction, as consumers are reluctant to repeatedly approve small transactions worth just a few cents or dollars. AI agents change that dynamic by executing payments automatically as part of completing tasks, removing the need for user interaction at checkout.
Stripe’s MPP is designed as a coordination layer that works across existing payment systems rather than a standalone network. Forrester’s Liu views this as a sign that infrastructure is emerging to support machine-to-machine transactions without requiring entirely new rails.
Liu said agent-driven payments could enable new business models, including pay-per-use services and automated digital commerce, while increasing demand for low-cost, high-frequency payment solutions such as stablecoins.

Crypto Biz is your weekly pulse on the business behind blockchain and crypto, delivered directly to your inbox every Thursday.
President Donald Trump just dropped a wild merchandising bombshell on his official website for his meme coin and digital trading cards. Exactly 2,024 physical collectible cards embedded with real fabric swatches from his iconic debate suit.
Worn on June 27, 2024, during the first presidential debate and celebrated as his total “knockout” performance, these ultra-limited editions fuse memorabilia, NFTs, and full-on meme coin frenzy in classic Trump style.
This might very well be the first time an actual sitting president of the United States is selling his wardrobe as collectibles. Who profits from it? Most likely, Trump Family-affiliated ventures.
Although the company says it has no affiliation with Donald Trump, it does promote the product with a direct quote from the President.
From a crypto perspective, the mechanics are deliberate. Buyers can pay via credit card or WETH on Polygon, aligning tightly with Trump’s broader meme coin ecosystem. Some variants reference his July 13 mugshot following the assassination attempt, amplifying scarcity and narrative-driven demand.
It’s peak post-reelection mogul mode. Critics call it “tacky,” while supporters frame it as “genius” — iconic political moments repackaged into ownable assets.
The strategy builds on more than $10 million in past NFT sales and the momentum from his 2025 inauguration, reinforcing a brand that continues to convert attention into revenue.
Sold out already? Previous drops disappeared within minutes. Expect the same pattern here, with MAGA loyalists and crypto-native traders moving quickly to secure supply.
As neobanks tokenize RWAs, Trump’s suit scraps blaze the trail for personal asset tokenization. Physical rarity crashes into digital speculation. The ultimate dealmaker strikes gold again.
The post Trump Auctions 2024 Suit Pieces on Official Meme Coin Site appeared first on BeInCrypto.
The Wyckoff method is a technical analysis framework developed by Richard D. Wyckoff in the early 20th century. It focuses on analysing price and volume to identify institutional activity and market cycles.
The method is based on the idea that large market participants drive trends through accumulation and distribution phases. Traders use this approach to anticipate price movements and identify potential entry and exit points.
This article explains the core principles of the Wyckoff trading method, including its laws, market cycle, and application in modern Wyckoff trading strategies.
The Wyckoff method is a type of technical analysis developed in the early 20th century by Richard D. Wyckoff, a renowned stock market trader and analyst. The method assumes markets are driven by supply and demand, which form repeatable and tradable price patterns.
The Wyckoff methodology provides a structured framework for building trading strategies based on price and volume behaviour. This system includes the relationship between price and volume, the identification of Wyckoff market structure, and the role liquidity plays in financial markets.
The Wyckoff method remains widely referenced in modern technical analysis and institutional trading frameworks. Its principles are closely aligned with price–volume analysis and market structure concepts used across global financial markets.
Large financial institutions need liquidity to execute sizeable orders without excessive slippage. To fill these orders, they require counterparties on the other side of the trade.
Liquidity clusters around predictable levels: above equal highs, below equal lows, beyond trendlines, and at support and resistance zones. Stop-loss orders and breakout entries sit at these levels in high concentration. Institutions target these pools because they provide the volume needed to absorb large positions at favourable prices.
By driving prices through these key levels, institutional participants trigger stops and breakout orders, generating the liquidity they need to build or offload positions. This mechanism of liquidity engineering, driven by institutional trading activity, is the fundamental idea behind the Wyckoff theory in forex, commodities, crypto*, stocks, and more.
There are a few fundamental principles of the Wyckoff methodology that are critical to your understanding: the Composite Man and the three laws.
The Composite Man represents a single dominant market operator whose actions traders analyse to interpret price movements. He is, in essence, the representation of smart money trading activity. Wyckoff believed that the Composite Man carefully plans and executes his trades, encouraging buyers (or sellers) only after he has accumulated a sizable position.
Simply put, if the demand for an asset is larger than its supply, prices will rise. On the other hand, if the supply of an asset is larger than its demand, prices will decrease.
This law states that Wyckoff events, such as accumulation and distribution, act as causes that drive future price movements. It also says that the effect, or the price movements, are proportional to the cause. An accumulation that occurs on the daily timeframe will produce a much more significant effect than one on the 1 minute, for instance.
This law says that price movements are a result of effort, characterised by volume. If a bullish trend is supported by strong volume, it will likely continue. High volume within a range, without price progress, may indicate weakening momentum and a potential trend reversal.

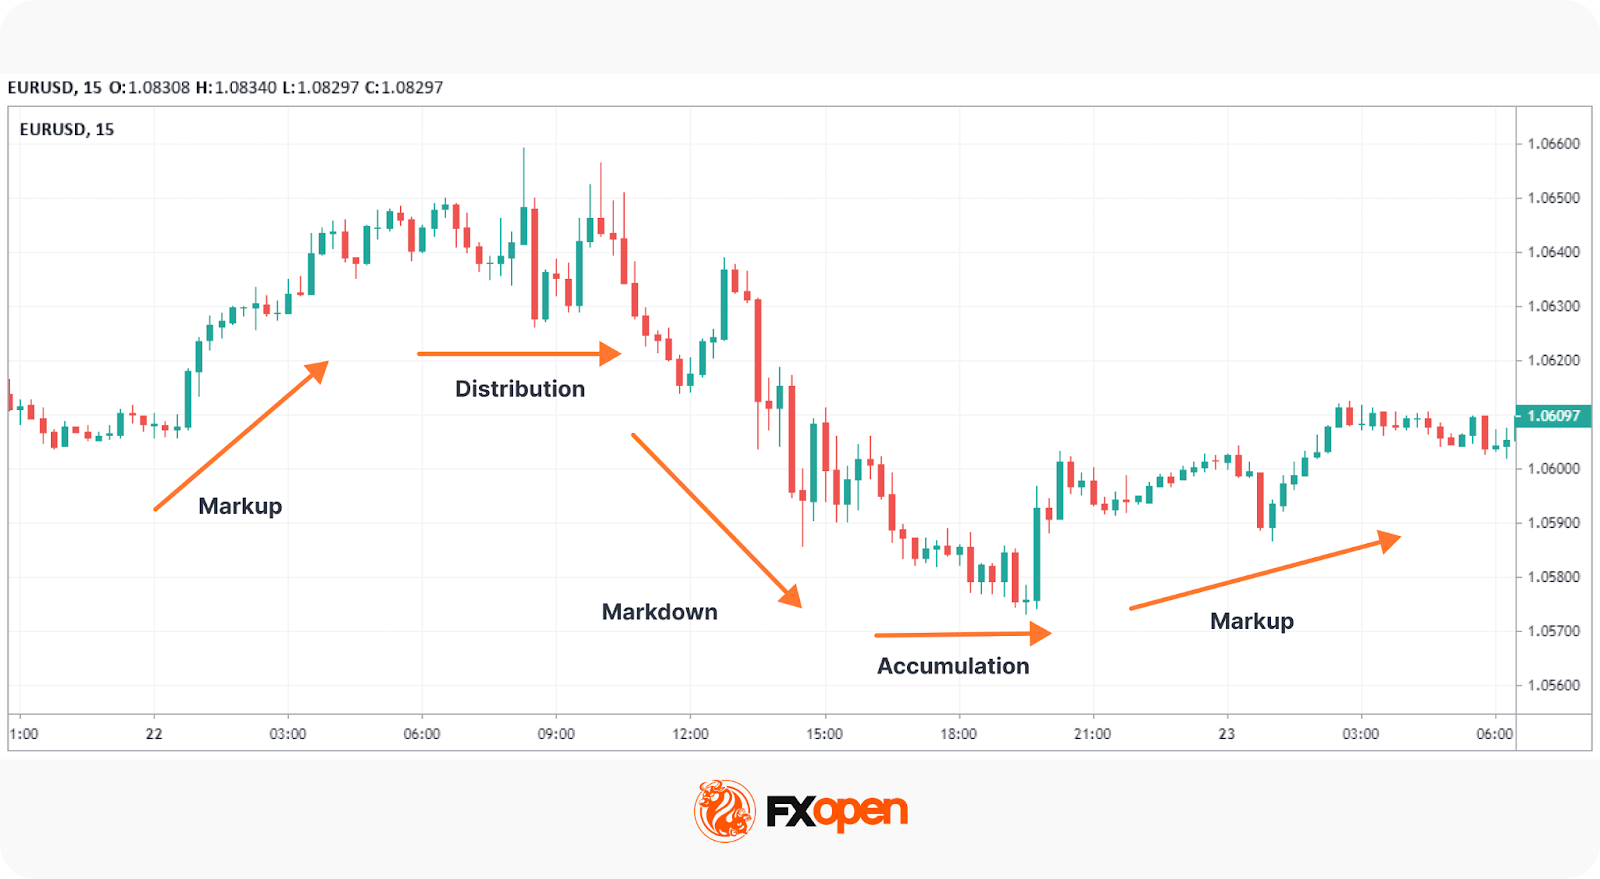
The Wyckoff methodology frames the markets in four repeated phases. These are accumulations, markups, distributions, and markdowns.
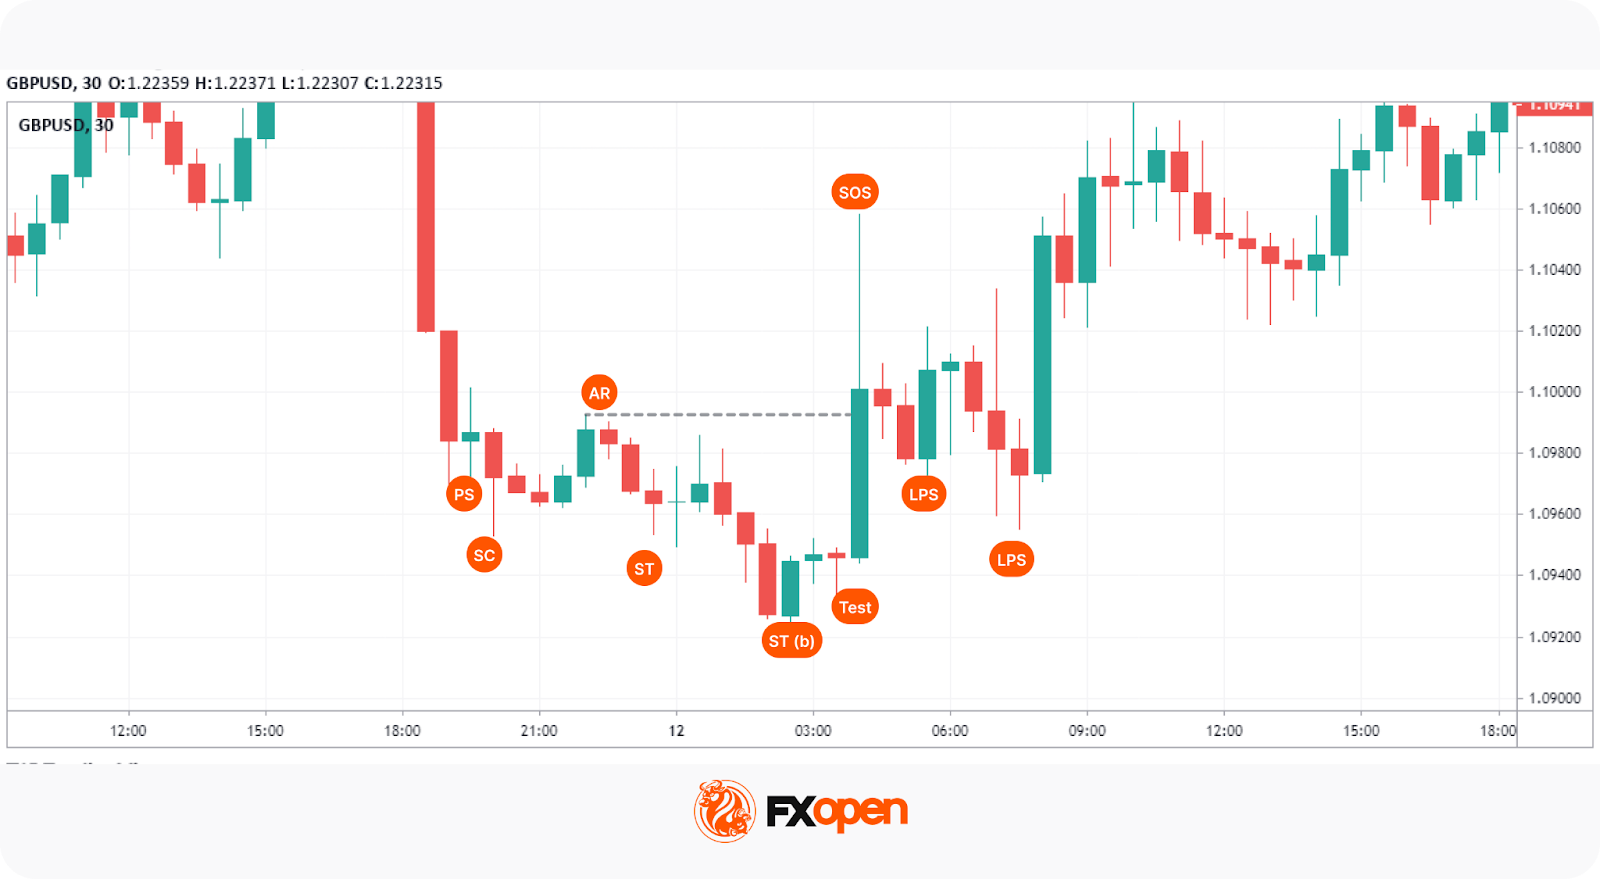
Most often seen in ranges, the Wyckoff accumulation pattern represents areas where large players are building up a position to go long before the market reveals its true direction to other traders.
Once they hold a large enough position, these players start to bid the price up, encouraging other traders to jump in and push the price up further. Increasing participation reinforces upward momentum, pushing price out of the range and initiating a sustained uptrend. Note that a markup may have multiple re-accumulations where it pauses and consolidates before breaking higher.
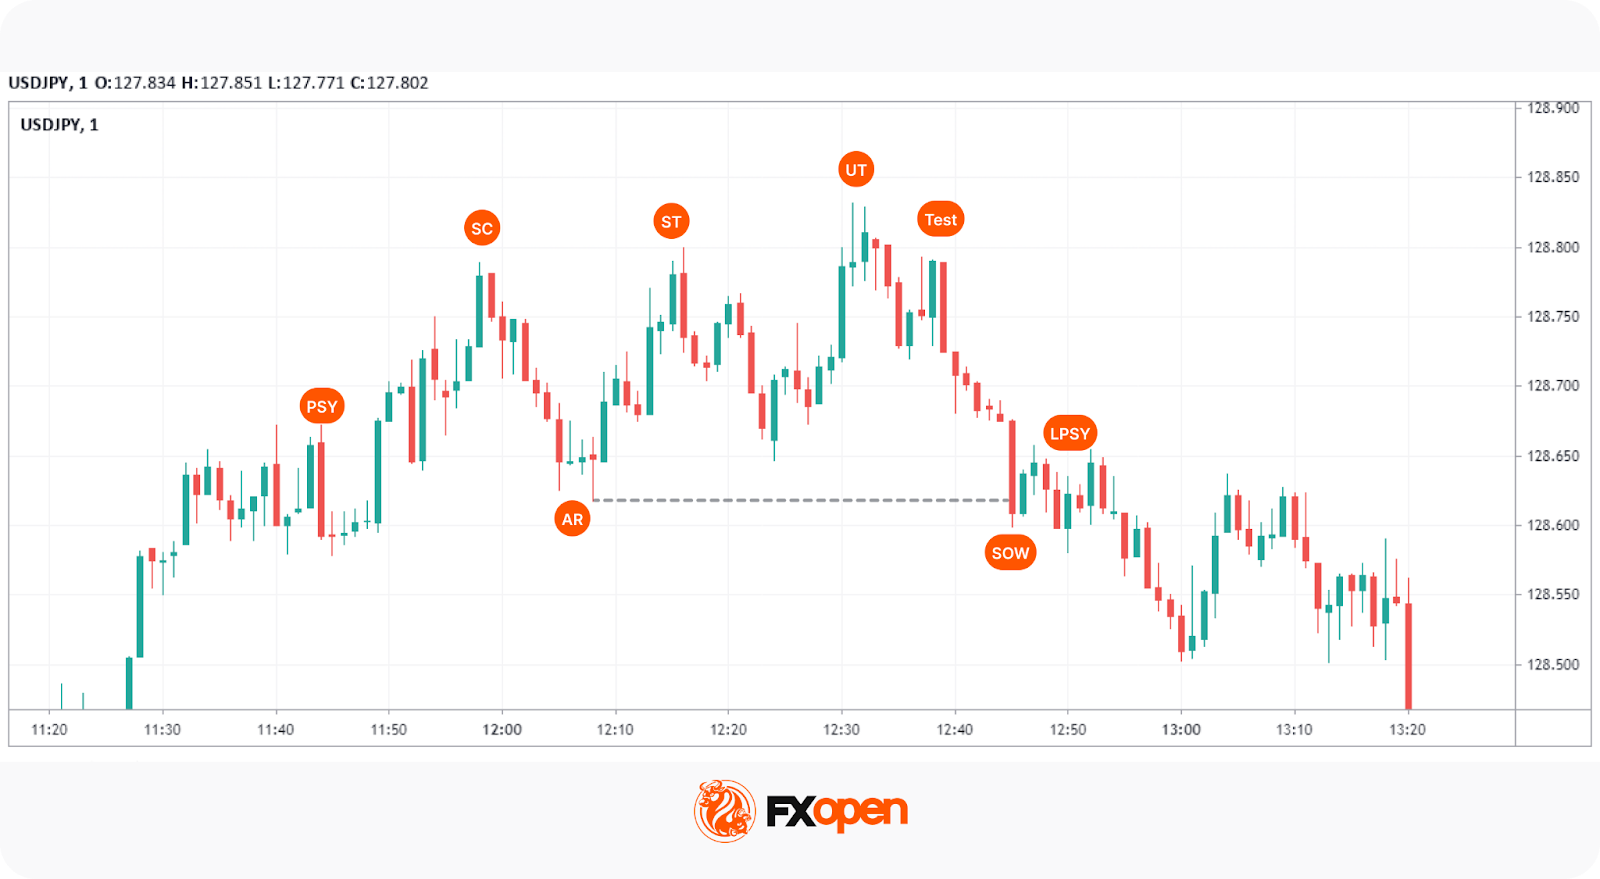
Once the price reaches its target and the buying pressure from other traders subsides, the big players will begin to distribute (sell) their positions while building up shorts. This Wyckoff distribution will, again, look like a range before a sharp move down.
This sharp move down is known as the markdown. It’s essentially the opposite of a markup: financial institutions push the price down and encourage traders to enter short positions to begin a downtrend. Like markups, there are also phases of redistribution that consolidate before moving lower.
While the core principles remain unchanged, traders have adapted the Wyckoff methodology to suit modern markets and tools. Here are the most common applications:
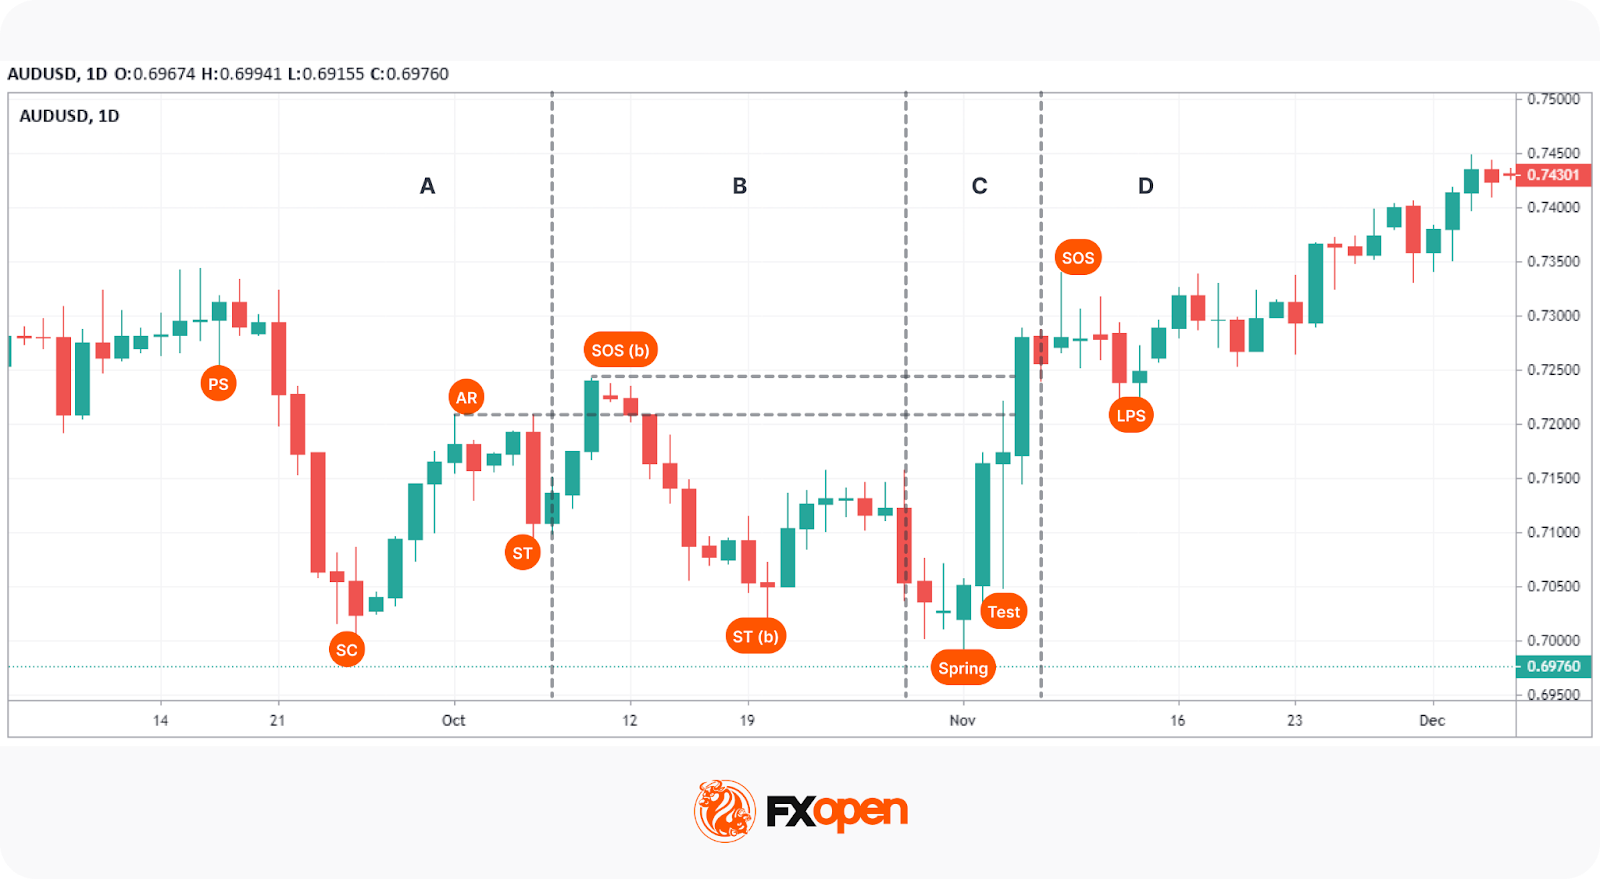
These cycles can be identified using standard Wyckoff chart patterns based on price and volume behaviour. If you want to test your own understanding, you may use the TickTrader platform with us at FXOpen.
Note that Wyckoff accumulations and distributions are practically identical, just flipped upside down. The key concepts, points, and phases across Wyckoff schematics are all the same.
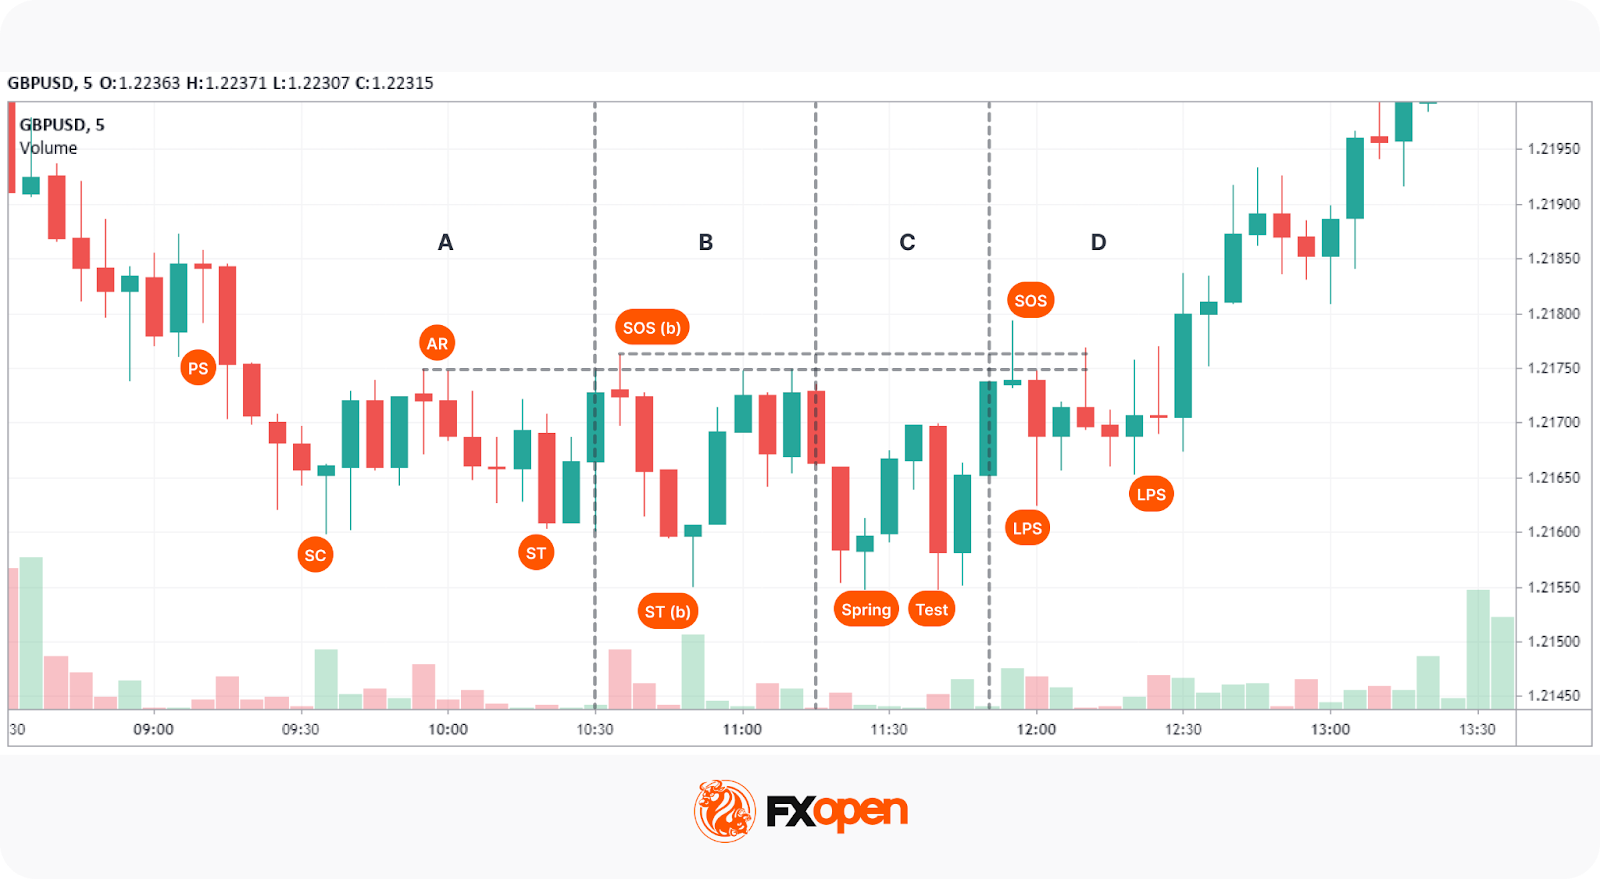
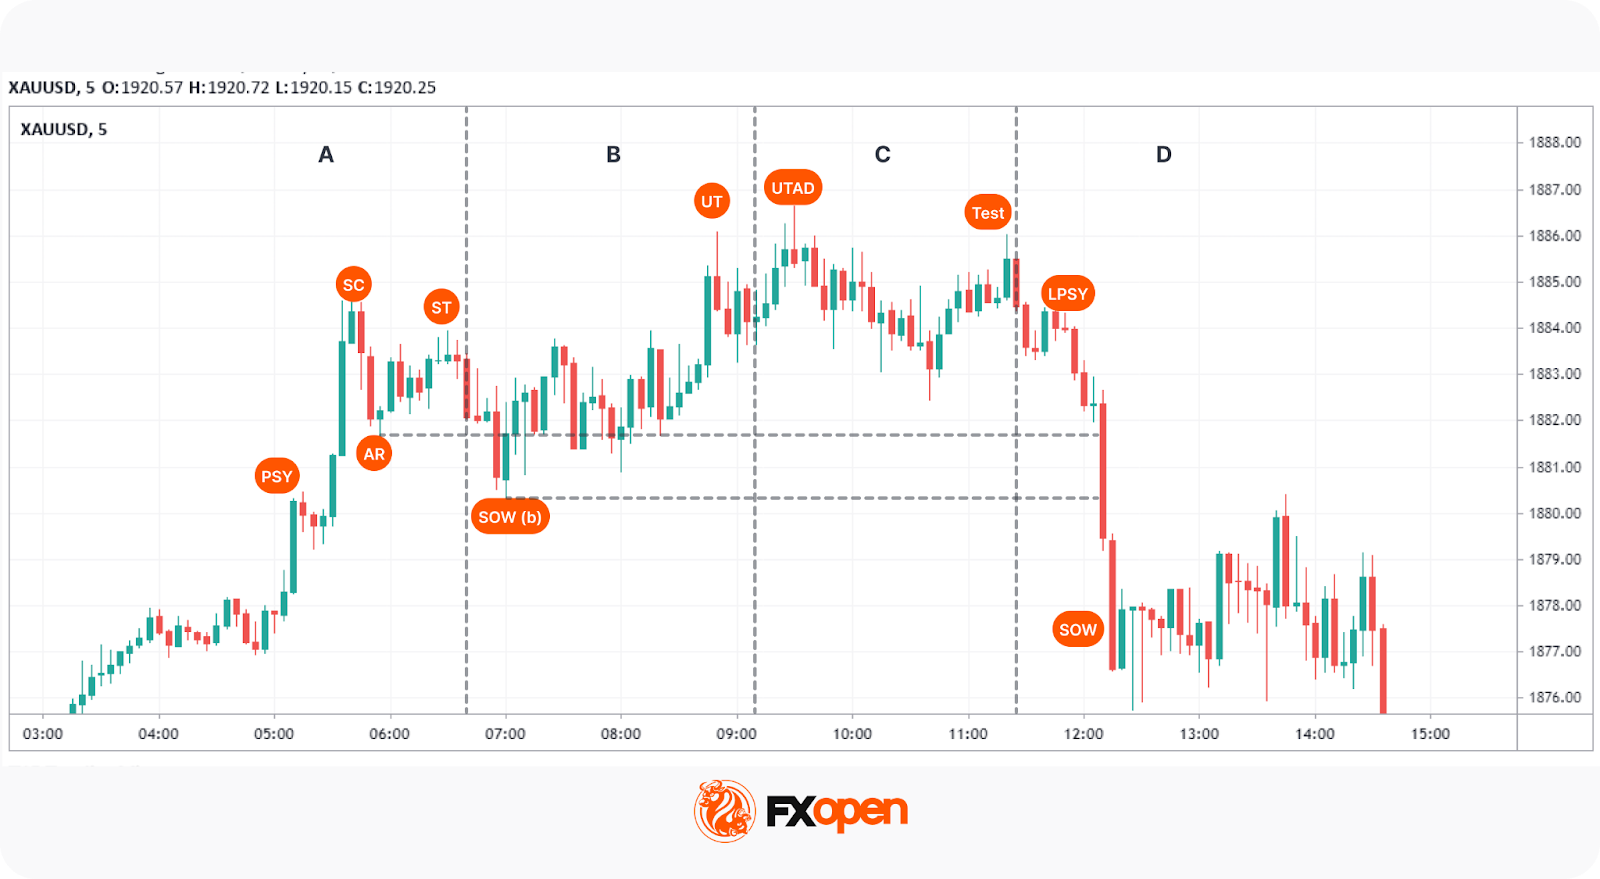
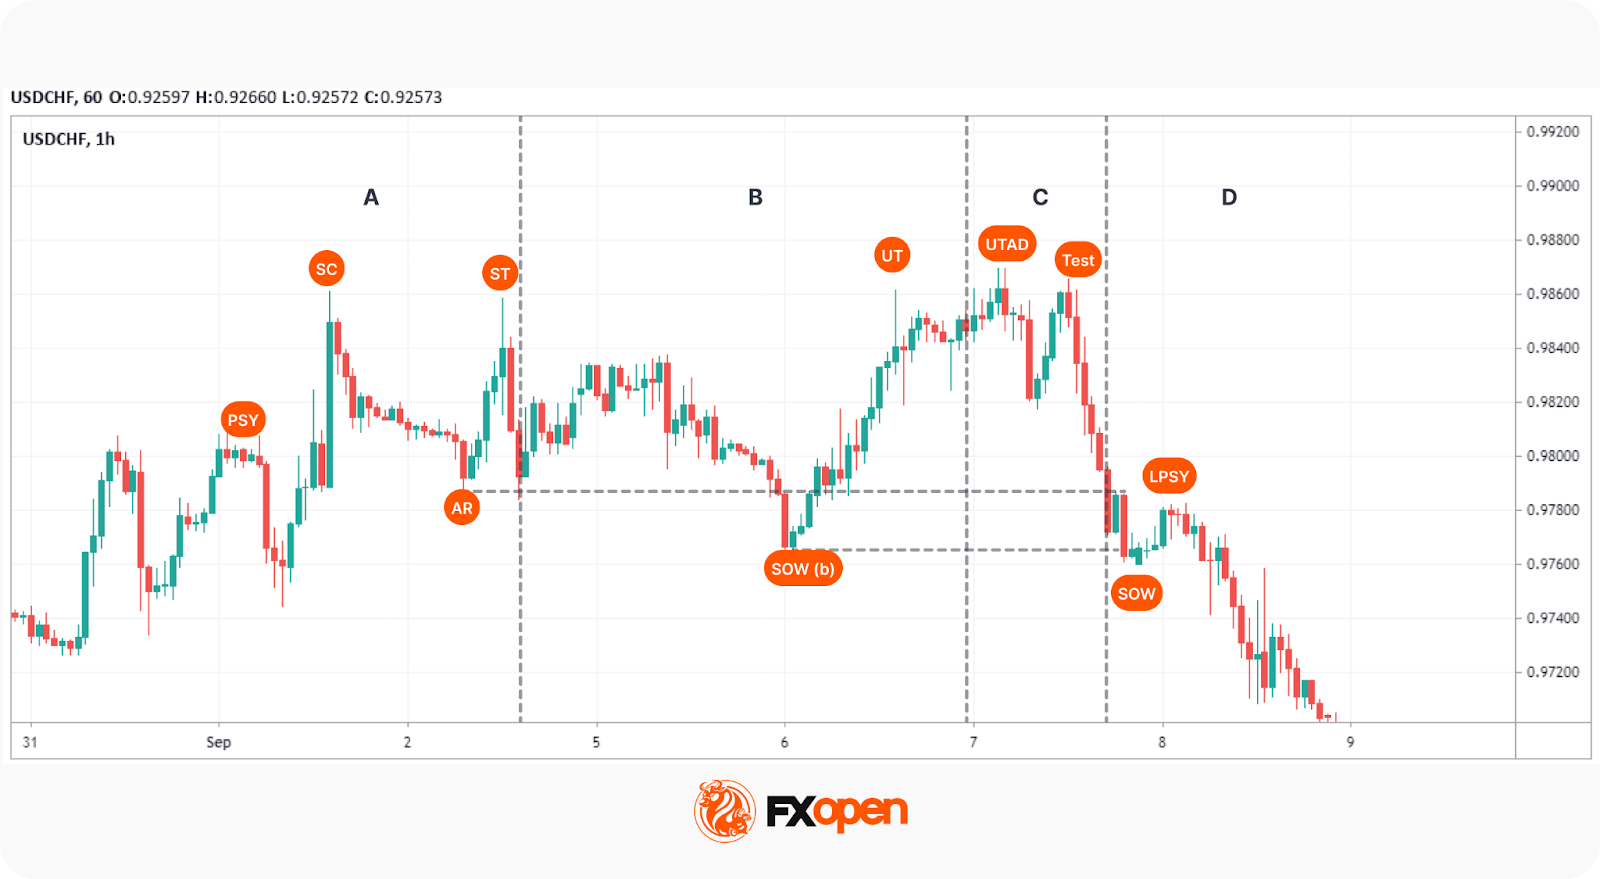
Type 2 Wyckoff schematics have all of the same ingredients, just without a Spring or UTAD. Wait for the SOS or SOW to occur. If you have just a single ST and an ST(b), or an ST and UT, and the markup or markdown begins, you know it’s a Type 2. This is seen in the Wyckoff graph above. Both can be traded in the same ways as a Type 1.
The Wyckoff trading method offers a systematic approach to analysing market trends and making trading decisions. Like any trading strategy, it comes with its advantages and disadvantages that traders often consider.
Luckily, Wyckoff developed a five-step framework for applying his methodology. The following structure outlines how traders build Wyckoff trading strategies using price and volume analysis. It can be adapted to develop a Wyckoff forex trading strategy.
1. Determine the current market trend. Assess whether the overall market is bullish or bearish.
2. Choose your market. Find a pair that strongly correlates to this overall trend.
3. Find a pair currently undergoing accumulation or distribution.
4. Determine the pair’s readiness to move. This involves examining the Wyckoff phase of the asset and volume. If a Spring or UTAD has just occurred, you could consider it viable.
5. Find your entry. Traders often enter on Tests or LPS/LPSYs.
Despite its age, Wyckoff’s logic in forex trading remains relevant. It reflects important price–volume relationships and market structure, which support traders when determining key turning points. It may form the basis of a trading approach when combined with other types of technical analysis, such as harmonic patterns, indicators, and support/resistance levels.
If you want to apply the Wyckoff method or test other trading approaches, you can consider opening an FXOpen account to trade over 700 markets with tight spreads and low commissions.
The Wyckoff cycle is a four-phase model that describes how markets move from consolidation to trend and back again. The four stages are accumulation (where institutional players build positions), markup (the resulting uptrend), distribution (where those positions are sold), and markdown (the subsequent downtrend).
The three laws of Wyckoff are foundational principles that govern price behaviour within the methodology. The Law of Supply and Demand determines the direction of price. The Law of Cause and Effect links the size of an accumulation or distribution phase to the magnitude of the resulting move. The Law of Effort vs Results compares volume (effort) to price movement (result) to assess whether a trend is likely to continue or reverse.
The Wyckoff trading range is a consolidation phase where accumulation or distribution occurs before a trend develops. It reflects a balance between supply and demand, often preceding a breakout or reversal.
The Wyckoff method is a multi-timeframe approach, though daily and weekly charts are the most commonly referenced. Patterns on higher timeframes tend to produce more defined schematics and more significant price moves.
Day trading with the Wyckoff method is possible, though it demands a strong grasp of short-term market structure and fast interpretation of price and volume shifts. Traders typically apply Wyckoff schematics on intraday charts (e.g., 5-minute or 15-minute) while referencing higher timeframes for context.
Wyckoff trading strategies are systematic approaches built around identifying accumulation and distribution phases using price and volume analysis. They typically involve recognising a Wyckoff schematic, confirming its phase, and acting on key events like Springs, Tests, or Signs of Strength.
*Important: At FXOpen UK, Cryptocurrency trading via CFDs is only available to our Professional clients. They are not available for trading by Retail clients. To find out more information about how this may affect you, please get in touch with our team.
This article represents the opinion of the Companies operating under the FXOpen brand only. It is not to be construed as an offer, solicitation, or recommendation with respect to products and services provided by the Companies operating under the FXOpen brand, nor is it to be considered financial advice.
Update (March 27, 2026, 10:52 am UTC: This article has been updated to include comments from Shawn Young, chief analyst at MEXC Research.
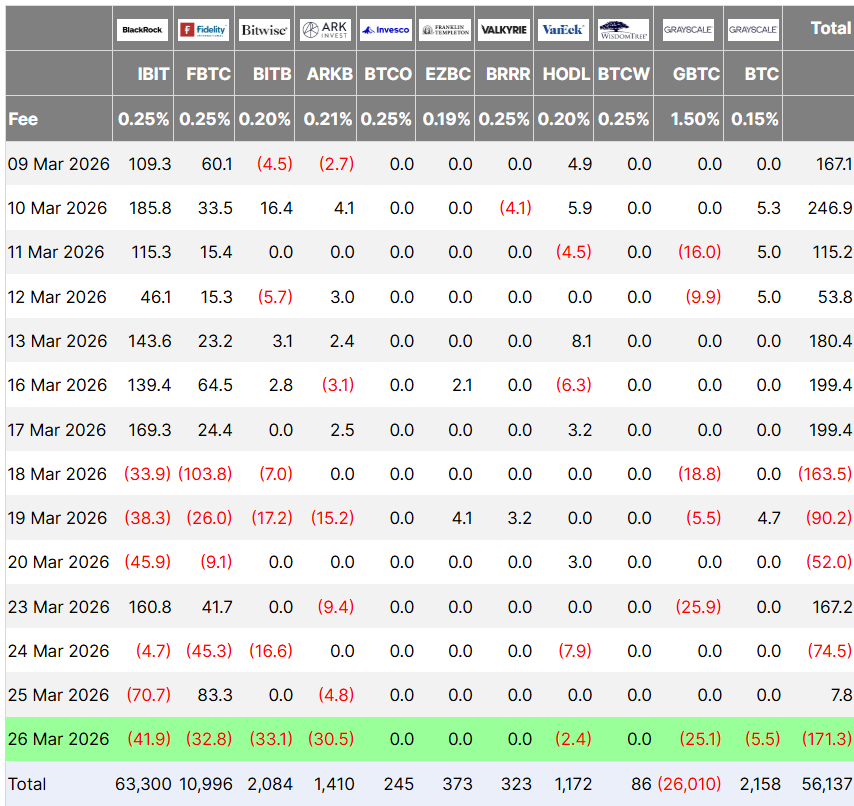
US spot Bitcoin exchange-traded funds (ETFs) logged $171 million in outflows on Thursday, their biggest day of redemptions since March 3, when they posted $348 million in outflows.
BlackRock’s iShares Bitcoin Trust ETF (IBIT) led the outflows with $41 million, Fidelity’s Wise Origin Bitcoin Fund (FBTC) followed with $32 million, the ARK 21Shares Bitcoin ETF (ARKB) sold $30.5 million, and Grayscale’s Bitcoin Trust ETF (GBTC) sold $24 million, according to data from Farside Investors.
The outflows follow a period of demand for Bitcoin ETFs, which attracted $1.36 billion in monthly inflows so far in March and are on track for their first month of net accumulation since October 2025, when ETFs clocked $3.42 billion in net inflows, according to Sosovalue data.
US-listed spot Bitcoin ETFs are a signal of institutional demand for Bitcoin (BTC), which fell below the $70,000 mark on Thursday. BTC fell 4.7% over the past week and traded at $67,780 at the time of writing, according to CoinMarketCap.

The $171 million in outflows signals that Bitcoin ETF investors are “beginning to pull back” and hedge against geopolitical escalations in the US-Israeli conflict with Iran, Shawn Young, chief analyst at MEXC Research, told Cointelegraph, but added that net ETF flows remained positive since the beginning of the conflict.
Still, Bitcoin ETFs are just “one good day away” from reversing their year-to-date outflows, said senior Bloomberg ETF analyst Eric Balchunas, who praised the ETFs for their “incredible fortitude” amid Bitcoin’s 46% correction from the $126,198 all-time high in October 2025.
“For context, when gold fell 40% in a short time frame about 10 years ago, it saw 1/3 of its investors bail,” said Balchunas in a Tuesday X post.
Related: Morgan Stanley files amended S-1 for MSBT Bitcoin ETF
The Bitcoin ETF sell-off follows reports that the US Department of Defense is sending thousands of soldiers to the Middle East, sources familiar with the matter told Reuters on Tuesday.
On Thursday, US President Donald Trump announced an extension to the ceasefire on Iranian energy infrastructure by 10 days to April 6, citing constructive ongoing negotiations.

Despite the announcement by Trump, market participants remain worried about another unexpected weekend escalation, Kyle Rodda, senior financial analyst at Capital.com, told Cointelegraph. He said:
“Amidst the headline risk and he-said, she-said games about whether negotiations between the US and Iran are taking place, the US is moving assets and personnel towards the Middle East to prepare for what looks like a limited ground invasion.”
Investors are jittery about any potential escalation after being caught off guard by the initial US and Israeli strikes on Iran on Feb. 28, which occurred in the middle of constructive negotiations, Rodda added.
Magazine: Bitcoin’s ‘biggest bull catalyst’ would be Saylor’s liquidation — Santiment founder


Michael Saylor quoted a CNBC TV anchor who repeated his marketing spiel about STRC on live television.
On Thursday’s edition of CNBC’s Power Lunch, Saylor was asked by host Brian Sullivan, “Am I offending you if I call it a money market fund?”
Sullivan was referencing Strategy’s publicly-traded STRC, a 11.5% dividend-paying preferred share that is definitely not a money market fund.
Saylor, who’s spent months likening his uninsured STRC to insured savings products like FDIC-insured bank accounts and SIPC-insured money markets happily agreed.
“It’s meant to be like a money market,” Saylor replied, continuing months of misleading statements about the shares that are supposed to trade near $100 yet have traded beneath $93.50 on 10 separate days.
He later tweeted the clip, declaring that his company’s digital credit products are somehow “redefining” yield.
Unfortunately, STRC is paying 11.5% for a reason, mostly because Strategy hasn’t been able to lower that rate and sustain demand for STRC’s share price near its intended $100 stated amount.
STRC is also nothing like a money market fund, and according to Bloomberg, 80% of STRC buyers have been retail investors, rather than sophisticated institutions.
Read more: Strategy is paying credit card rates to keep STRC at $100
Unlike a money market fund, Strategy isn’t required to hold full assets to back STRC’s par value, has no bid in the Nasdaq market to support its share price, isn’t required to maintain any particular pricing value of investors’ principal, and has no liquidity requirement to support redemptions.
SEC-registered money market funds must comply with Rule 2a-7 and its liquidity minimums and asset diversification rules.
Money markets maintain stable net asset values by investing in short-term, high-quality debt.
STRC, in contrast, doesn’t comply with money market regulations and invests in one of the most volatile assets in history, bitcoin (BTC).
Unlike a money market fund, STRC pays a dividend from a company with a junk “B-” credit rating from S&P analysts. That same company reported a $12.4 billion net loss in a single quarter.
US money market funds carry SIPC protections when purchased through a registered US brokerage. Bank money market accounts carry FDIC insurance. STRC carries no insurance.
Strategy itself admitted on page 90 of its earnings presentation that STRC isn’t a money market fund.
The company conceded that it’s “not required to hold any assets to back the STRC Stock.” That disclosure didn’t stop Saylor and Sullivan from floating the comparison on national television.
Nor did it stop Saylor from enthusiastically agreeing.
Money market funds shouldn’t lose more than 7% of their value in a few hours. STRC has, repeatedly.
The stock fell to $90.52 in November 2025 and to $93.10 in February 2026. Strategy hiked its dividend rate seven times since launch to encourage secondary trading closer to $100.
Its dividend rate, which started at 9% in July 2025, now sits at 11.5%, a 250 basis point increase.
Meanwhile, BTC trades near $66,000, well below Strategy’s average purchase cost of $75,694 per coin. The company’s entire BTC operation has lost money since inception, while MSTR common stock has declined 74% from its November 2024 high.
Saylor told Sullivan that BTC needs to appreciate just 2% a year to cover STRC’s dividends forever.
However, he conveniently omitted that his model only works for MSTR shareholders if BTC rallies 30% annually, a forecast he has repeated for years but that BTC’s five-year annualized return hasn’t delivered.
Indeed, Saylor has compared STRC to insured products for months.
He described it on CNBC as “a bank that pays you 20% interest.” On an earnings call, he recommended STRC “for your family treasury.”
Incredibly, STRC raised over $1.18 billion in a single week this month, suggesting that comparisons like Sullivan’s are working exactly as intended.
Sullivan’s framing of STRC as a money market fund may have been casual. For the retail investors buying STRC on the basis of these comparisons, the difference between a money market fund and a junk-rated perpetual preferred stock is anything but.
Got a tip? Send us an email securely via Protos Leaks. For more informed news and investigations, follow us on X, Bluesky, and Google News, or subscribe to our YouTube channel.

In this video, we’ll explore the key economic events and market trends, shaping the financial landscape. Get ready for insights into financial markets to help you navigate the week ahead. Let’s dive in!
In this episode of Market Insights, Gary Thomson breaks down what moved the markets over the past few days and unpacks the strategic implications of the most critical events driving global markets.
👉 Key topics covered in this episode:
✔️ What Happened in the Markets Over the Past Few Days
US-Iran tensions are fueling market uncertainty, with shifting headlines, mixed negotiation signals, and no clear resolution. Oil remains volatile, and equities reflect fragile sentiment rather than a trend. Will markets find direction, or will uncertainty keep prices unstable?
✔️ US Retail Sales
US Retail Sales data on 1 April could signal shifts in consumer demand, following weak growth in recent months and a decline in January. The US dollar may react sharply if the new figures diverge from expectations. Will retail sales show a rebound, or continue the trend of weakening consumer demand?
✔️ US Nonfarm Payrolls and Unemployment Rate
US Nonfarm Payrolls and the Unemployment Rate on 3 April could reveal whether the labour market is weakening or stabilising, after February’s 92,000-job loss and a rise in unemployment to 4.4%. Will the data show further deterioration, or a surprising rebound in US employment?
In summary, next week markets face a balance between elevated volatility from geopolitical risks and potential direction from upcoming macroeconomic data.
Gain insights to strengthen your trading knowledge.
💬 Don’t forget to like, comment, and subscribe for more market insights every week.
Watch it now and stay updated with FXOpen.
This article represents the opinion of the Companies operating under the FXOpen brand only. It is not to be construed as an offer, solicitation, or recommendation with respect to products and services provided by the Companies operating under the FXOpen brand, nor is it to be considered financial advice.
Swiss-based DeFi infrastructure provider THORWallet is expanding into Asia, with South Korea emerging as a key focus market for its mobile-first crypto platform.
The company, known for its non-custodial wallet that integrates decentralized finance services with traditional banking features, says the move reflects growing demand in Asia for tools that connect centralized crypto markets with global DeFi liquidity.
South Korea is widely considered one of the most active retail crypto markets globally, with millions of traders and some of the highest digital asset participation rates in the world.
One of THORWallet’s distinguishing features is the integration of Swiss banking functionality directly within a non-custodial crypto wallet.
Eligible users can access a Swiss IBAN, a multi-currency account, and a global payment card, allowing them to move between crypto assets, decentralized finance, and traditional financial infrastructure within a single interface.
The company believes this hybrid approach may appeal to users in Asia seeking more seamless ways to connect digital assets with everyday financial services.
“Many crypto users want access to both DeFi and traditional financial rails without giving up custody of their assets,” said Marcel Harmann, founder of THORWallet. “Combining a non-custodial wallet with banking functionality helps close that gap.”
THORWallet positions its platform as DeFi infrastructure rather than a traditional crypto wallet, aiming to serve as a gateway through which users and applications can access decentralized liquidity networks.
The mobile wallet has processed more than $1.5 billion in cross-chain swap volume, highlighting its role as an active interface connecting users to decentralized liquidity protocols.
THORWallet integrates cross-chain liquidity networks such as THORChain, Maya Protocol, and NEAR Intents, enabling users to swap native assets across different blockchains without relying on wrapped tokens or centralized bridges.
As liquidity continues to fragment across multiple chains, cross-chain swaps—such as exchanging Bitcoin for Ether across networks—are becoming an increasingly important component of the broader DeFi ecosystem.
By connecting directly to decentralized liquidity networks, THORWallet allows users to access cross-chain trading functionality via a mobile interface while retaining full custody of their assets.
The company has focused heavily on mobile design, reflecting the view that the next wave of DeFi adoption will depend on simplifying complex blockchain interactions for everyday users.
This approach aligns with usage patterns in South Korea, where a significant share of cryptocurrency trading already takes place via mobile applications.
“Our goal is to provide a simple gateway that allows users to move from centralized exchanges into global DeFi liquidity,” Harmann added.
South Korea has long been one of the most influential cryptocurrency markets globally. Local exchanges such as Upbit and Bithumb consistently rank among the largest platforms by trading volume, and the country is home to millions of active retail traders.
Despite high participation, much of the activity remains concentrated on centralized exchanges, while access to decentralized finance tools is still relatively limited for many users.
THORWallet sees an opportunity to position its platform as a mobile gateway between centralized exchange liquidity and global DeFi infrastructure.
The company identifies South Korea as a strategic entry point for its broader expansion across Asia, where crypto adoption continues to grow and retail participation remains strong.
Asia is widely viewed as one of the most dynamic regions for cryptocurrency innovation, with major user bases across markets such as South Korea, Japan, Singapore, and Taiwan.
“We see Korea as an important starting point,” Harmann said. “From there, we plan to expand further across Asia as demand grows for mobile access to decentralized financial infrastructure.”
As the digital asset ecosystem expands across multiple blockchains, demand for solutions enabling native cross-chain liquidity and interoperability continues to increase.
THORWallet positions itself as a mobile interface connecting users to decentralized cross-chain liquidity networks, with a long-term strategy focused on building infrastructure that allows interaction with multiple blockchains, financial services, and liquidity sources through a single platform.
The post Swiss DeFi Infrastructure Provider THORWallet Expands into Asia, Targeting South Korea’s Crypto Market appeared first on BeInCrypto.
Pi Network price is stalling near $0.18 as bearish models flag a possible drop toward $0.14, even as mainnet upgrades, a DEX launch and a Consensus 2026 push aim to anchor real‑world Web3 use.
Summary
Pi Network’s PI (PI) token, the native asset of the mobile‑first smart contract and payments ecosystem, is trading at about $0.1795 today after losing 4.68% in the last 24 hours, extending a pullback from this month’s high near $0.2850.
CoinCodex data shows PI underperformed the broader crypto market, which declined 3.56% over the same period, while PI also dropped 2.65% against BTC and 2.01% versus ETH, reflecting relative weakness across pairs. According to CoinLore, the first recorded exchange rate for PI on its platform was $0.7821, with a cycle low at $0.1317 in February 2026 and a historic high above $3.00, placing the current price roughly 77% below that initial print but still 36% above the February low. Functionally, PI is positioned as a layer‑1 smart contract and payments token aimed at bringing everyday users into Web3 via mobile mining, app‑layer utility and, increasingly, real‑world financial integration.
From a technical perspective, short‑term signals are leaning defensive. CoinCodex’s March 26 update expects PI to fall to $0.138387 by April 1, 2026, implying a 23.23% decline from today’s levels and summarizing the current outlook as bearish. The same dashboard shows PI trading at $0.179471 with a 14‑day RSI of 51.09, a neutral reading that suggests neither deep oversold conditions nor overbought exhaustion, while most short‑term moving averages—from the 3‑day MA at $0.1973 to the 50‑day MA at $0.1826—are flashing sell signals. Structurally, PI remains above the 200‑day simple moving average at $0.269050, which CoinCodex interprets as a longer‑term bullish trendline despite the near‑term bearish bias in the next‑five‑days forecast.
The project’s fundamentals are evolving in parallel with the price chop. AInvest’s March 1 analysis notes that Pi Network is entering a critical phase in 2026, moving from experimental development to real‑world utility with infrastructure upgrades and ecosystem expansion explicitly designed to support financial integration and practical applications. CoinMarketCap’s latest Pi update details several key milestones: completion of the mainnet Protocol 20.2 upgrade on March 18, 2026, which lays the foundation for smart contract functionality; a major node upgrade roadmap targeting version 23.0 by May; and a sponsorship at Consensus 2026 in Miami, including a 20‑minute main‑stage session that will spotlight Pi and artificial intelligence alongside sponsors such as Grayscale and Google Cloud. Separately, MEXC’s February 17 report frames March 12, 2026—the activation date for Pi DEX and related liquidity infrastructure—as a “decisive” turning point for the ecosystem, emphasizing that successful execution will be treated as a confidence event by users and developers monitoring throughput, stability and engagement.
These network‑level developments highlight a familiar tension between narrative and tape. On one hand, Pi Network is signaling a shift toward concrete utility—through protocol upgrades, DEX activation and high‑profile conference exposure—just as the broader market increasingly rewards projects with real‑world use cases over pure speculative hype. On the other hand, CoinCodex’s bearish near‑term projection and the dense cluster of “sell” signals across key moving averages underline the risk that, absent clear evidence of adoption and on‑chain liquidity growth, PI’s price could retest lower support closer to the $0.14 area before any durable repricing can take hold.


NIO (NIO) Stock Plunges 6.5% as Shelf Registration Sparks Dilution Worries

Manchester United reach agreement with Casemiro over contract clause amid transfer speculation


Best Crypto to Buy Now: Strategy Just Spent $1.57 Billion on Bitcoin During Fear While Early Investors Quietly Enter Pepeto for 150x Potential


Bitcoin Price News: Bhutan Sells $72 Million in BTC Under Fiscal Pressure, but the Smart Money Entering Pepeto Sees What the Market Does Not


Parliament publishes latest register of MPs’ financial interests


Remo Stars and Kano Pillars Strengthen Survival Hopes in NPFL


Gary Kirsten Accuses Pakistan Cricket Board Of ‘Interference’, Mohsin Naqvi Responds


No Winner in March 21 Drawing as Prize Rolls to $133 Million for Next


Give Your Phone a Huge (and Free) Upgrade by Switching to Another Keyboard


AI enters the chat: New Seattle dating app relies on tech to facilitate meaningful human connections


Ch 9 Financial Management Part 1 | Detailed One Shot | Class 12 Business Studies Boards 2026
Columbia Sportswear enters $500 million credit agreement with JPMorgan Chase


Today’s NYT Connections Hints, Answers for March 22 #1015


Instagram, YouTube Found Responsible for Teen’s Mental Health Struggle in Historic Ruling


Will Duke Basketball Win It All? Duke Basketball Enters Second Round as Third Favorite to Claim NCAA Title


2026 Kentucky Derby horses, odds, futures, preview, date: Expert who hit 12 Derby-Oaks Doubles enters picks

Update on Wisbech river crash as search for teenage boy enters fifth day

Cynthia Bailey Dishes on ‘RHOA’ Season 17, Discusses Kandi

Tesco is selling new Cadbury Dairy Milk bar and people can’t wait to try it


Samsung will soon let you control smart home devices from your car’s dashboard


You must be logged in to post a comment Login