

Crypto World
Crypto price prediction as hawkish FOMC minutes sparks market sell-off

The latest Federal Open Market Committee minutes struck a hawkish tone, pressuring risk assets including cryptocurrencies.
Summary
- Policymakers warned inflation progress may be “slower and more uneven,” signaling rate cuts are not imminent and that hikes have not been fully ruled out.
- With Treasury yields rising and easing deemed potentially premature, high-beta assets like Bitcoin, Ethereum and XRP faced renewed selling pressure.
- BTC holds near $66.8K but remains below its 50-day SMA; ETH consolidates near $1,960 with weak inflows; XRP trades under key Bollinger resistance near $1.46.
Policymakers acknowledged that while inflation has cooled from its highs, progress toward the Fed’s 2% target “might be slower and more uneven than generally expected,” and warned that the risk of inflation remaining persistently above target “was meaningful.”
That language reinforced expectations that rate cuts are not imminent and that policymakers remain cautious about declaring victory over price pressures.
The minutes also revealed that several participants would have supported a “two-sided” description of risks, signaling that further rate hikes have not been fully ruled out if inflation reaccelerates. At the same time, officials indicated that additional policy easing “may not be warranted” until there is clear evidence that disinflation is firmly back on track.
While two members dissented in favor of an immediate cut, the broader message emphasized patience and vigilance, a stance that typically tightens financial conditions and weighs on high-beta assets such as crypto.
With Treasury yields climbing and expectations for near-term liquidity fading, digital assets faced renewed selling pressure. This sets the stage for a closer look at how Bitcoin (BTC), Ethereum (ETH) and XRP (XRP) are reacting on the charts.
Crypto price prediction: Bitcoin (BTC)
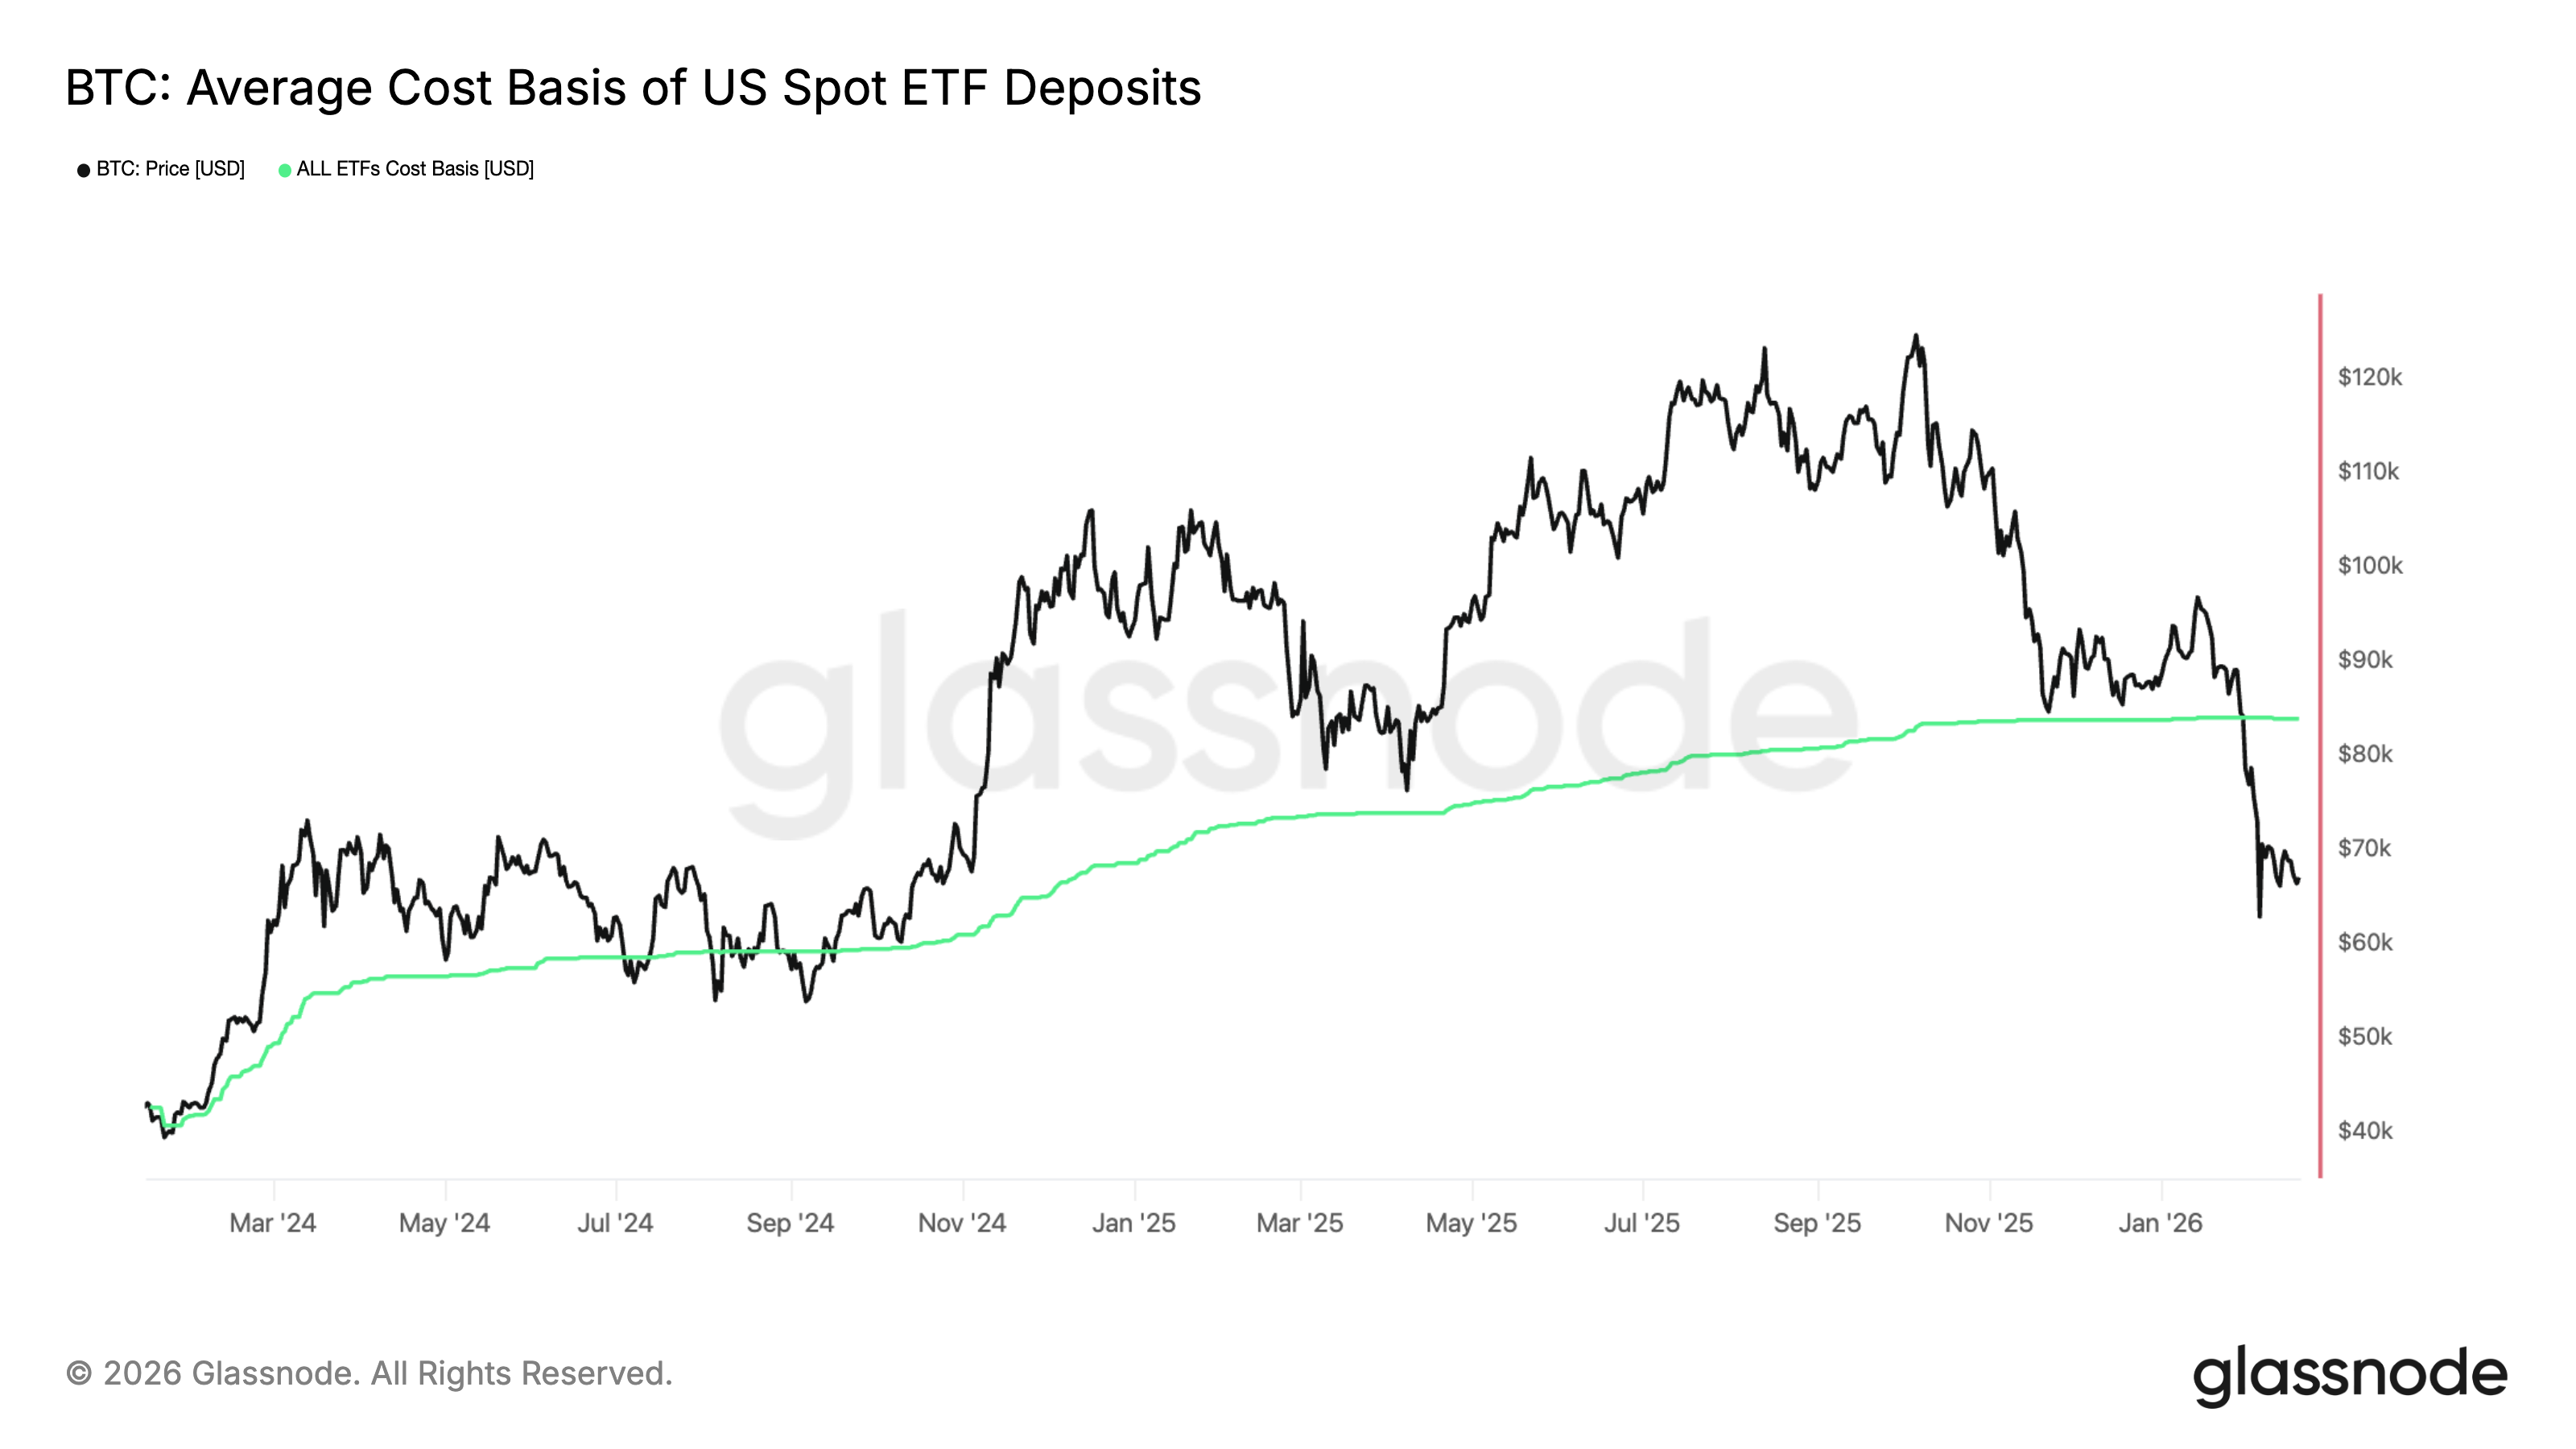
Bitcoin extended its pullback following the hawkish Fed minutes, briefly dipping toward $65,000 before stabilizing before staging a rebound. It is currently trading around $66,800, but remains well below the 50-day SMA near $82,600, which signals that the broader short-term trend is still bearish.
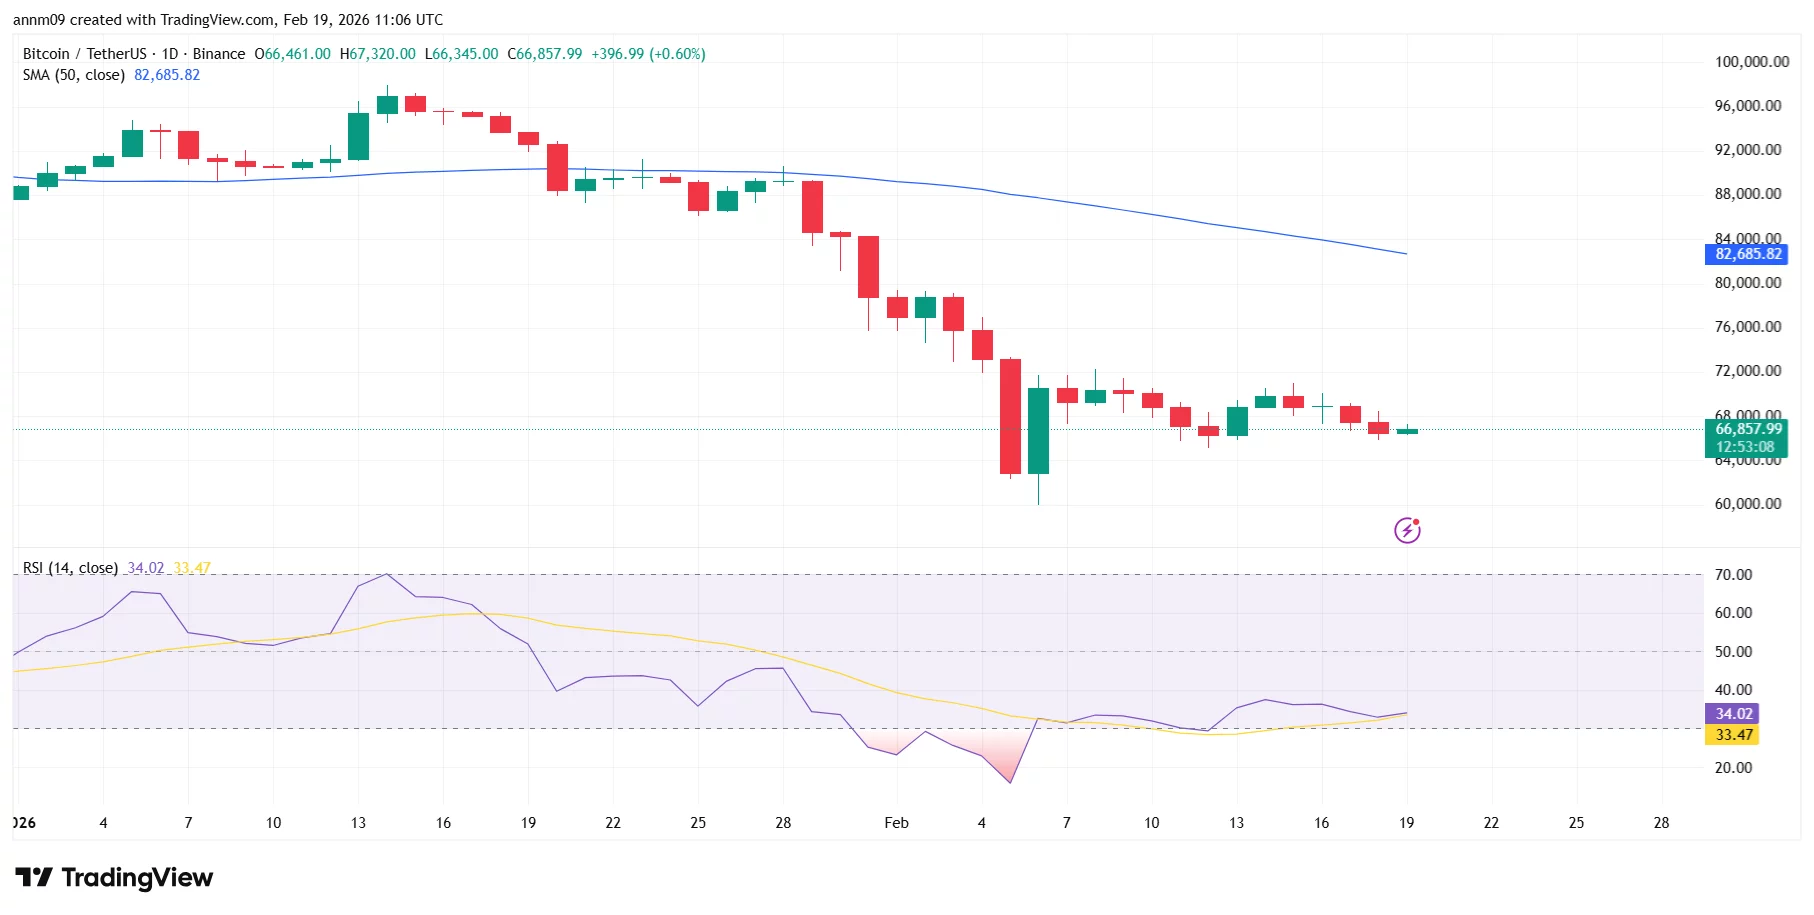
The RSI is hovering around 34, recovering from near-oversold territory but still below the neutral 50 level, suggesting weak momentum despite the bounce. Immediate support sits near $64,000, followed by the recent low around $60,000.
On the upside, resistance is seen near $70,000, with stronger structural resistance around $75,000–$76,000. Unless BTC reclaims those levels, rallies may continue to face selling pressure.
Ethereum (ETH)
Ethereum saw a sharp sell-off in early February, dropping toward the $1,900 zone before stabilizing. It is now trading around $1,960, consolidating in a tight range amid the Fed-driven volatility.
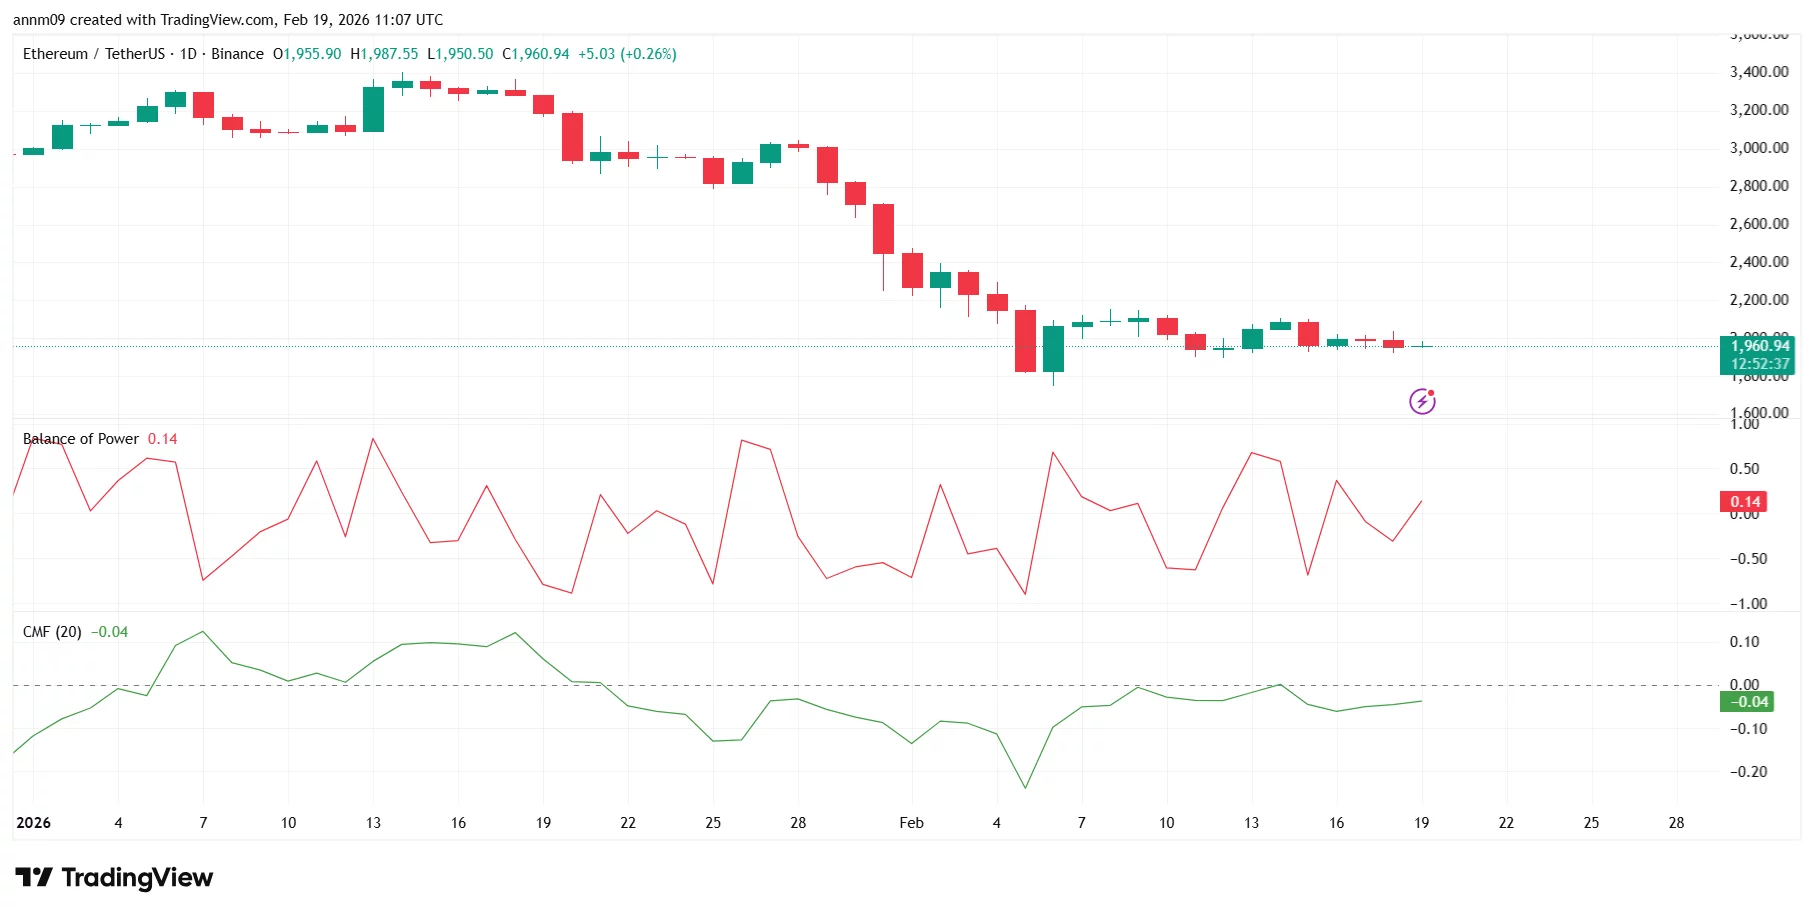
The Balance of Power indicator has turned slightly positive, hinting at mild buying pressure, but CMF remains marginally negative, suggesting capital inflows are still weak. Immediate support lies at $1,900, with a deeper floor around $1,800.
On the upside, ETH faces resistance near $2,050, followed by $2,200, where prior breakdown levels sit.
XRP
XRP remains under pressure compared to BTC and ETH. After sliding from above $2.00 earlier in the year, it recently bounced from the $1.20–$1.25 area and is currently trading near $1.41.
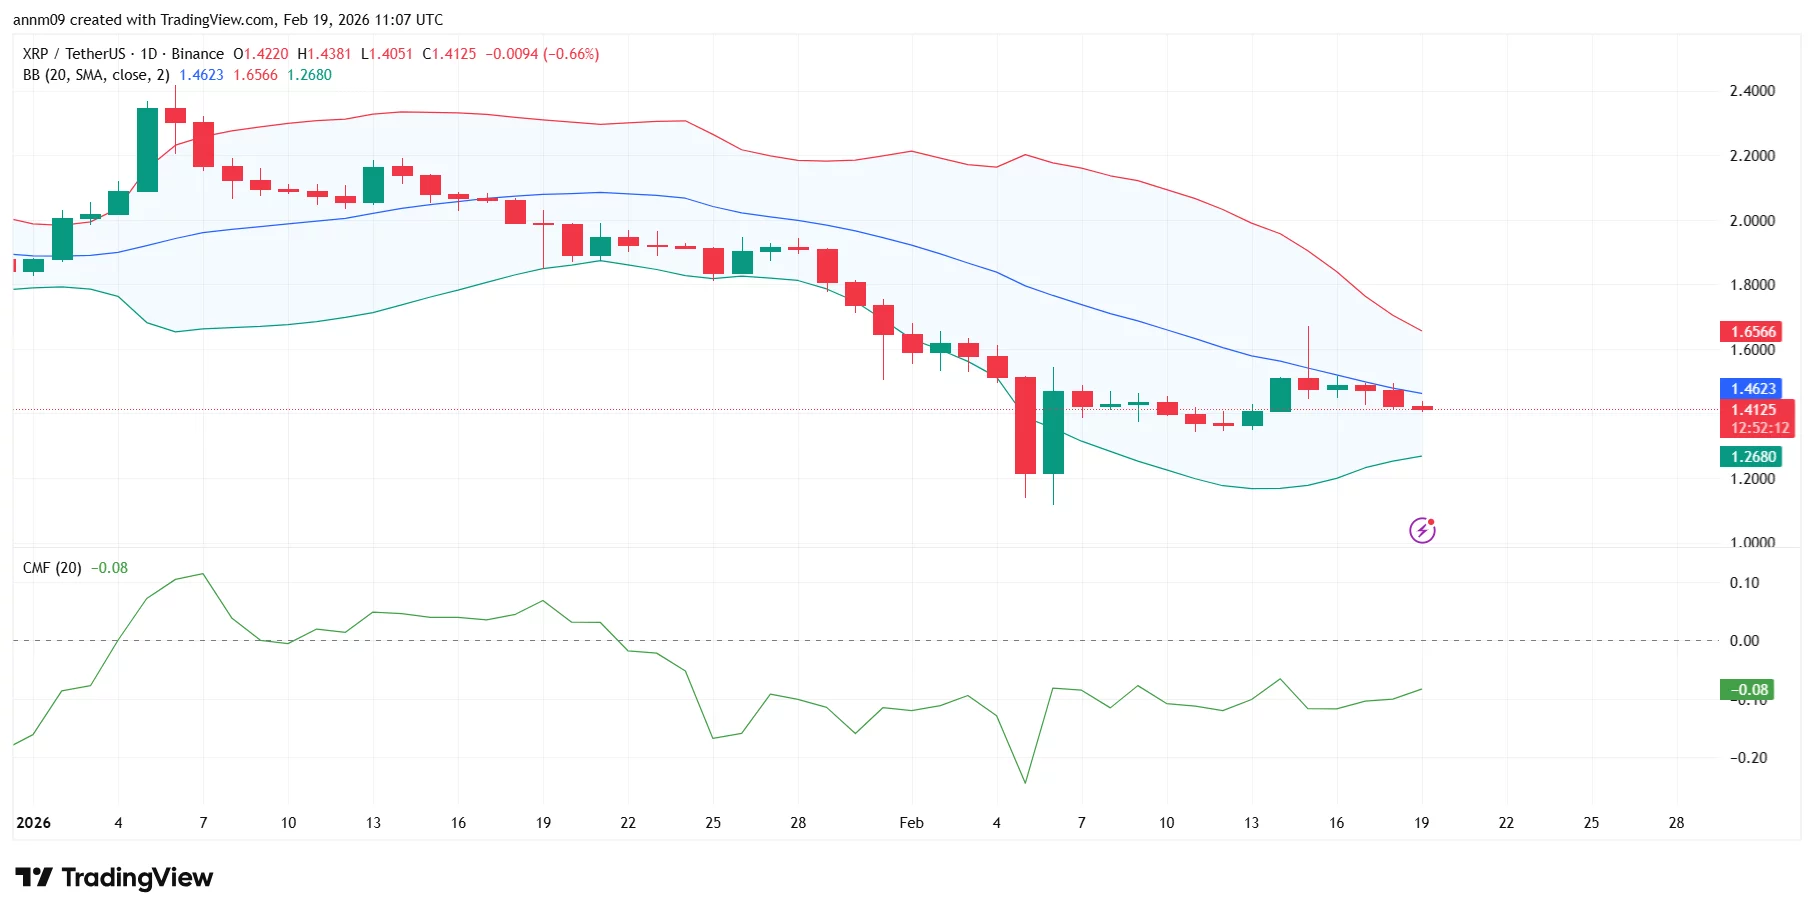
Price is sitting below the mid-Bollinger Band (around $1.46), while the upper band near $1.65 acts as dynamic resistance.
CMF remains slightly negative, indicating limited buying conviction. Immediate support rests at $1.35, followed by the recent swing low near $1.25. Resistance is seen at $1.46, with a stronger barrier at $1.60–$1.65.

Bitcoin’s (BTC) market structure shifted into a corrective phase after losing a key onchain valuation level in late January.
Glassnode data shows that BTC’s price is compressing within a 2024-era demand zone as liquidity conditions soften. At the same time, BTC’s supply is steadily shifting into long-term, retail-linked wallets while exchange activity has cooled.
This mix of technical and onchain data, along with the current capital rotation, may shape the next steps for Bitcoin price.
Bitcoin lost its active supply cost price, but holders defend $60,000
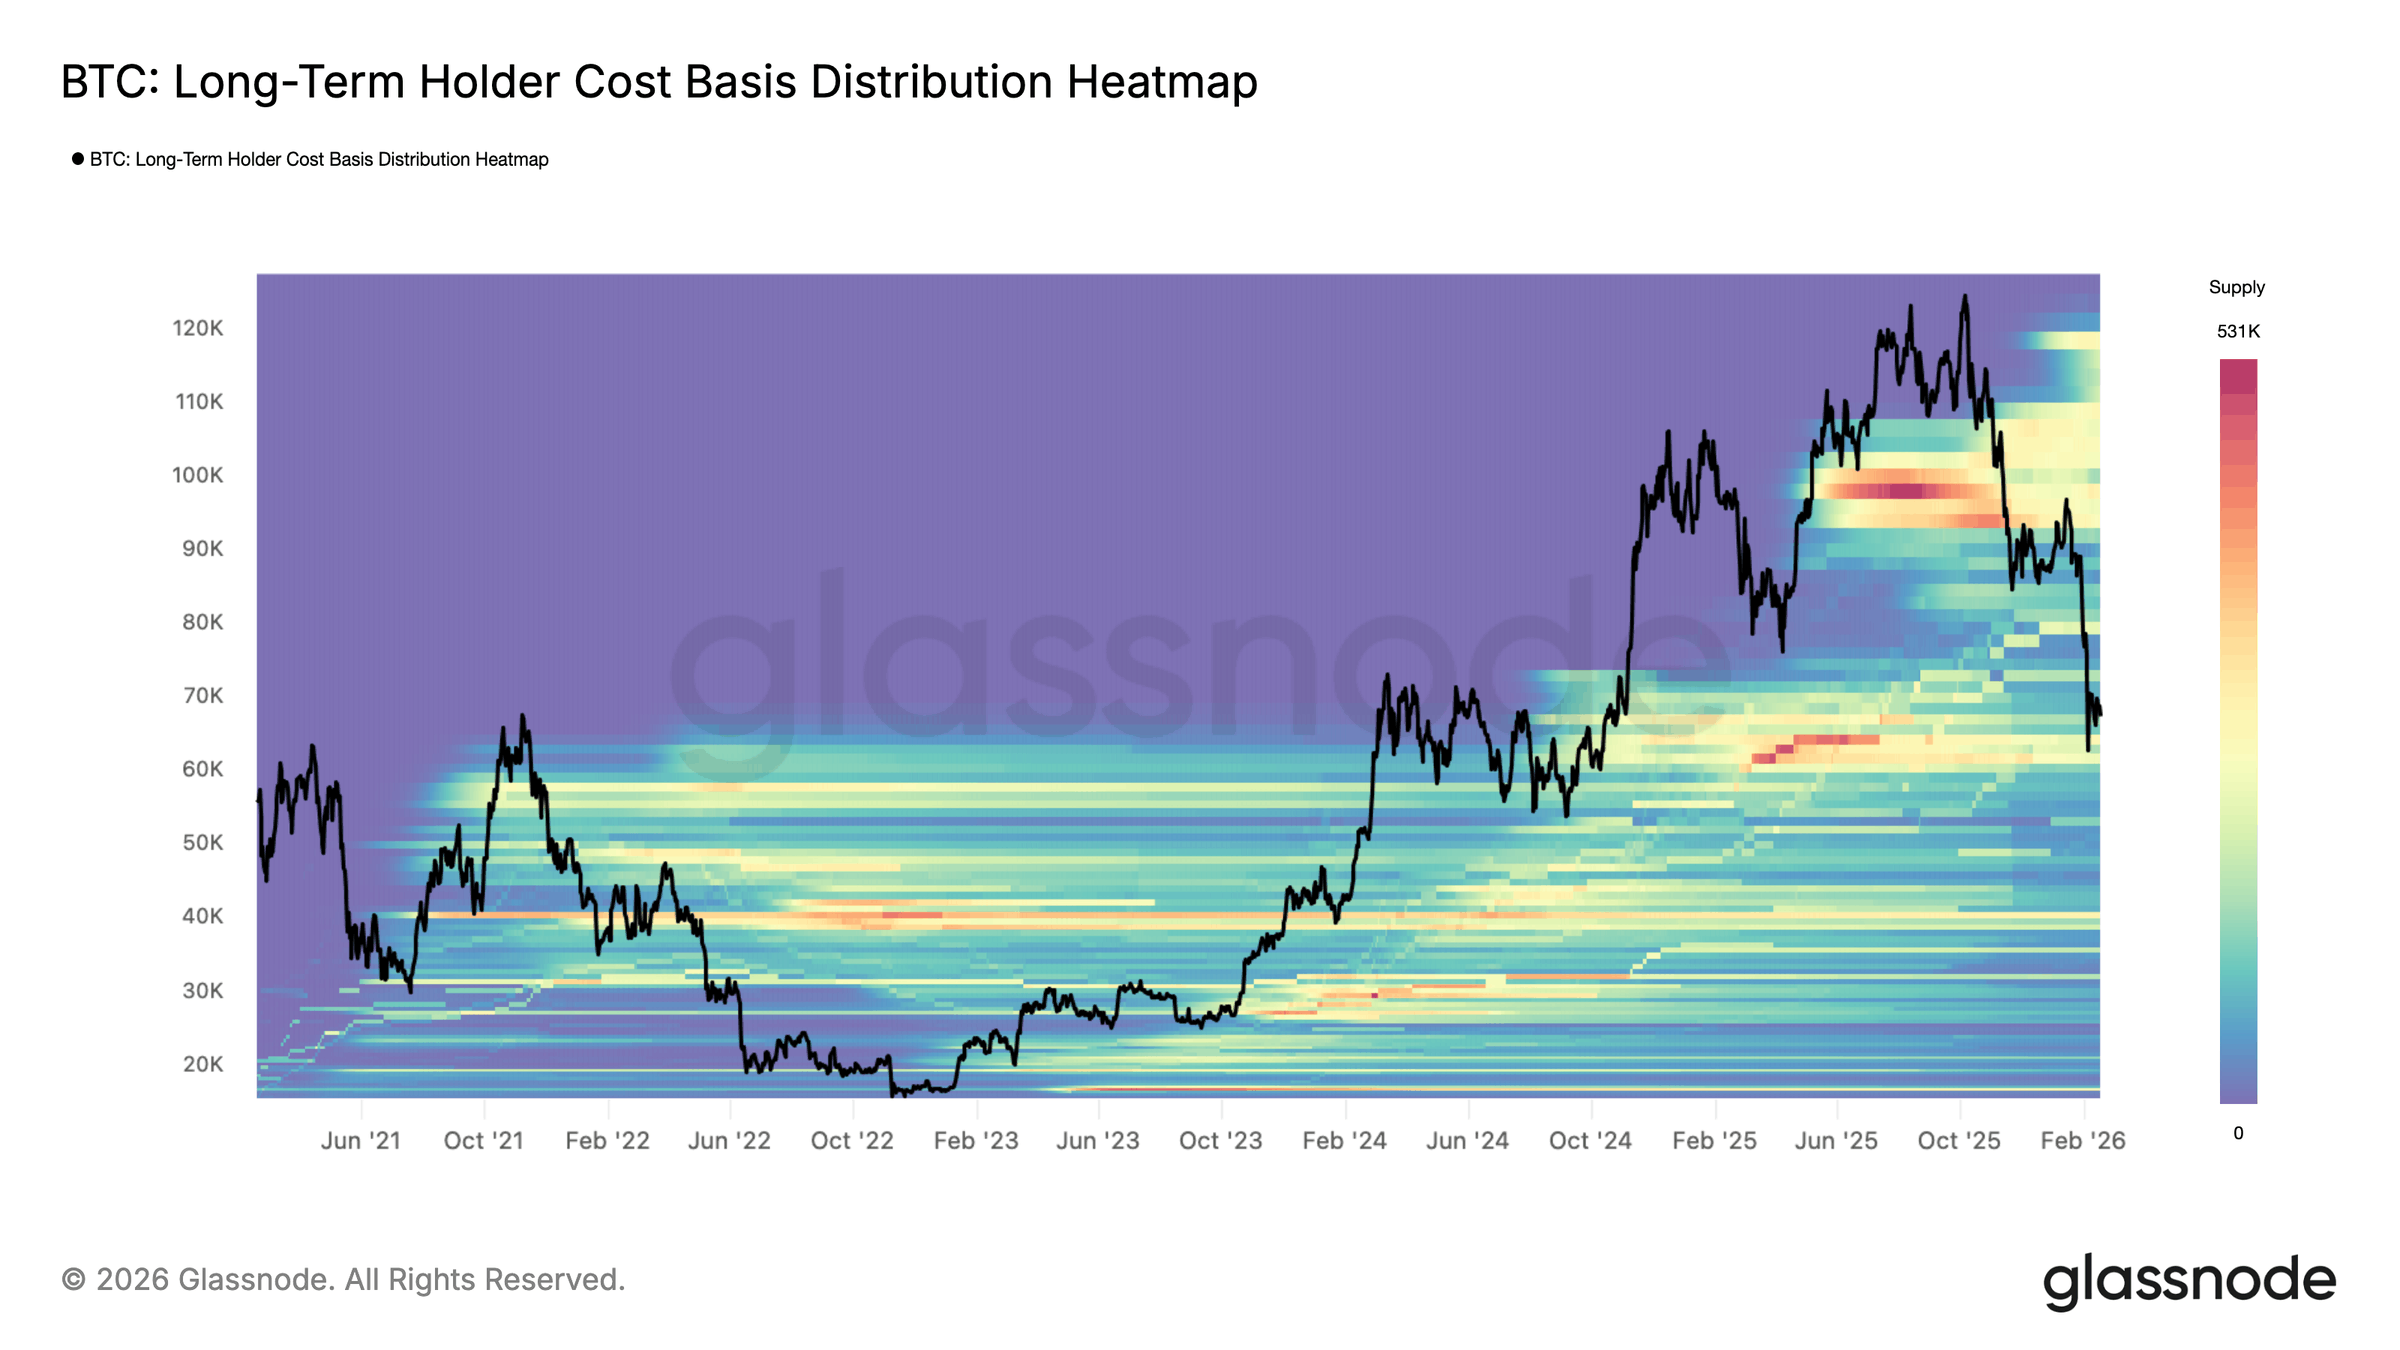
In its weekly “The Week On-chain” report, Glassnode said that BTC’s recent price dip accelerated due to breaking below its true market mean near $79,000 in January, which is the cost basis of the tracked active supply.
Since then, the price has stabilized inside a dense $60,000 to $69,000 range, which is being defended by medium-term holders. One of the reasons this zone has been a strong support is because of the age of coins within this range for the majority of 2024.

Coins accumulated in that range have aged more than a year, placing a large cohort close to breakeven. This supply may be acting as a backstop on the current sell pressure.
Market analyst Ardi pointed to a similar dynamic, writing on X:
“We’re trading inside the same $53-73K range that took 245 days to build last year. Think about how much volume went through this zone. This is the most contested zone on BTC’s entire chart right now.”
Glassnode also highlighted that, in past cycles, deeper bear phases have gravitated toward the realized price, which now stands near $54,900. The metric estimates the average acquisition cost of all circulating coins.
Bitcoin’s liquidity conditions also remain compressed. The 90-day realized profit/loss ratio has declined back into the 1–2 range, a level associated with limited capital rotation. A sustained move below 1 has aligned with stressed bear environments.

Related: Google searches for ‘Bitcoin going to zero’ at highest since 2022
BTC accumulation rises even as activity slows down
CryptoQuant data shows that the balances held by accumulating address cohorts have continued rising into early 2026. Total BTC held by these cohorts has expanded to over 4 million BTC, up from roughly 2 million BTC in early 2024, which reflects a steady supply absorption.

The retail-linked accumulation addresses have increased their holdings by 850,000 BTC, while the accumulating pattern wallets, addresses that steadily add BTC in recurring intervals with minimal outflows, increased their size to 1.27 million BTC. This expansion occurred even as the price dropped in 2026.
In contrast, the inflows from centralized-exchange addresses and highly active addresses have moderated. Compared with the 2023 to 2024 expansion phases, where inflow spikes frequently exceeded 1.2 million to 1.5 million BTC, the recent activity has remained significantly lower, averaging 300,000 BTC to 400,000 BTC.

The divergence shows that more BTC is being absorbed into long-term wallets while fewer coins are rotating through major exchanges. That reduces the liquid supply and slows down short-term trading activity.
Related: Bitcoin’s consolidation nears ‘turning point’ as $70K comes in focus: Analyst
This article does not contain investment advice or recommendations. Every investment and trading move involves risk, and readers should conduct their own research when making a decision. While we strive to provide accurate and timely information, Cointelegraph does not guarantee the accuracy, completeness, or reliability of any information in this article. This article may contain forward-looking statements that are subject to risks and uncertainties. Cointelegraph will not be liable for any loss or damage arising from your reliance on this information.

TLDR:
- Metaplanet CEO Simon Gerovich rejects anonymous claims of hidden Bitcoin buys and poor disclosure practices.
- Four September Bitcoin purchases were each disclosed promptly via the company’s live public dashboard.
- Selling put options lowers Bitcoin acquisition costs below spot, not a directional price bet.
- Metaplanet’s Bitcoin-per-share KPI surged over 500% in 2025 despite stock price volatility.
Metaplanet’s CEO has gone on the offensive. Simon Gerovich addressed a wave of anonymous allegations targeting the Japanese Bitcoin treasury firm.
The criticism questioned the company’s disclosure practices, options trading approach, and September Bitcoin purchases. Gerovich pushed back point by point, calling several claims factually inaccurate.
Metaplanet CEO Challenges Claims Over Bitcoin Purchases and Disclosure Practices
The September Bitcoin purchases drew particular scrutiny. Critics alleged the company bought near a local price peak and stayed quiet about it.
Gerovich acknowledged the timing but rejected the narrative entirely. He confirmed four separate purchases were made that month, each disclosed promptly through the company’s public dashboard.
Metaplanet publishes all Bitcoin wallet addresses openly. Shareholders can verify holdings in real time through a live dashboard the firm maintains.
Gerovich cited this as evidence the company operates with unusual transparency for a listed entity. He described it as one of the most open corporate structures in the market.
The company’s accumulation approach is systematic, not speculative. Gerovich emphasized that Metaplanet does not attempt to time Bitcoin’s price.
Every purchase gets disclosed regardless of prevailing market conditions. That policy has remained consistent throughout the firm’s accumulation period.
Gerovich took direct aim at anonymous accounts spreading the allegations. He stated he would not tolerate the distribution of false information to shareholders navigating a volatile market.
He also noted his personal financial exposure as a major shareholder, having invested his own capital into the company.
Options Trading Strategy and Financial Metrics Addressed Directly
The criticism around options trading reflected a misreading of strategy, according to Gerovich.
Selling put options is not a directional bet on Bitcoin rising. It is a method to acquire Bitcoin below the spot price by collecting option premiums upfront. He walked through a specific example to illustrate the mechanics.
In his post, Gerovich described a scenario where spot Bitcoin trades at $80,000.
Selling a put at that strike and collecting a $10,000 premium brings the effective acquisition cost to $70,000. The strategy exploits elevated volatility to lower average entry prices. In Q4, he said, the approach meaningfully reduced Metaplanet’s effective Bitcoin costs.
On financials, Gerovich challenged the use of net profit as an evaluation metric. He pointed to 6.2 billion yen in operating profit, representing 1,694% year-over-year growth.
Ordinary losses stem from unrealized valuation changes on long-term Bitcoin holdings the company has no plans to sell. He called drawing negative conclusions from that line item a misreading of the statements.
Bitcoin per share, the company’s primary KPI, rose over 500% in 2025. The hotel business generated 437 million yen in sales revenue and 169 million yen in operating profit. Borrowing arrangements were disclosed three times across facility establishment and two drawdowns.
Specific lender details and interest rates were withheld at the counterparty’s request, Gerovich said.


The White House is pressing ahead with negotiations between crypto industry representatives and banking lobbyists to shape stablecoin provisions within a broader crypto market-structure bill. In the third face-to-face session held in about two weeks, participants attempted to close gaps that have stalled the legislation amid broader regulatory scrutiny. While no deal emerged on Thursday, attendees signaled progress as a White House adviser urged a compromise: allow third parties, such as exchanges, to offer stablecoin rewards only in connection with transaction activity rather than linking yields to customers’ idle balances. The talks followed earlier meetings on February 2 and February 10, underscoring the urgency of delivering a coherent framework for how U.S. regulators would police the evolving crypto landscape.
Key takeaways
- The current round of talks produced incremental language alignment but stopped short of a binding agreement on how stablecoin rewards should be governed under the market-structure bill.
- A prominent proposal centers on tying stablecoin rewards to transactional activity rather than balances, a stance intended to address banking concerns about competitive pressures.
- Participants highlighted the need for clear legislative language to unlock broader crypto-market structure reform, with industry and banking voices urging pragmatism and collaboration.
- Public remarks from executives at Coinbase (EXCHANGE: COIN) and Ripple underscored a constructive and cooperative tone, even as substantive policy divides remain.
- The Senate’s path for the related market-structure bill remains uncertain, with prior House passage of a CLARITY Act variant not yet mirrored in Senate approval.
- Plans for continued negotiations were already on the table, with banks slated to reconvene to decide whether the trade-off could win broader support.
Tickers mentioned: $COIN
Sentiment: Neutral
Market context: The unfolding discussions sit at the crossroads of regulatory clarity, innovation incentives, and risk management as policymakers weigh how to normalize stablecoins within the traditional financial system while maintaining consumer protections and financial stability.
Why it matters
At stake is a path to regulatory clarity that could unlock broader participation in the crypto economy while preserving the safeguards that lawmakers insist are necessary for a rapidly evolving sector. The debate over stablecoin rewards directly touches liquidity, market integrity, and how digitized fiat-backed assets integrate with traditional banking rails. By steering a compromise toward transaction-based rewards rather than balance-based yields, policymakers aim to strike a balance between incentivizing innovative finance and preventing scenarios that could undermine deposit stability or create unfair competitive dynamics for banks.
The discussions reflect a broader tension in Washington: policymakers want to enable responsible innovation without ceding market stability or consumer protection. The involvement of high-profile industry players signals that the issue has moved beyond a narrow policy skirmish and into a cornerstone debate about how stablecoins will function within the U.S. financial system over the coming years. As negotiators press on, the outcome could influence how wallets, exchanges, and other third parties design reward structures and attract user participation in a regulated, compliant manner.
Observers note that the White House is prioritizing a pragmatic, language-driven approach—one that narrows disagreements step by step while keeping the door open to a broader legislative package. The degree of progress achieved in the latest talks—though not a resolution—suggests that a consensus on core concepts may still be within reach, provided sufficient alignment on the role of third-party reward programs and the safeguards designed to protect depositors and the broader financial system.
What to watch next
- Whether banks will sign off on the transaction-based rewards framework and what concessions might be required to gain bipartisan support.
- The timing and framing of the next White House-facilitated session, including any public statements from the involved parties.
- Any movement in the Senate on the market-structure bill or related amendments, following earlier House passage of a CLARITY Act variant.
- Follow-up remarks from Coinbase (EXCHANGE: COIN) and Ripple, and whether new language clarifies the role of third-party reward programs.
Sources & verification
Progress, trade-offs shape White House discussions on stablecoins and market structure
The third formal session between White House policy staff, crypto executives, and banking lobbyists unfolded as part of a broader push to finalize language for a market-structure bill that would redefine how regulators oversee the crypto sector. The gathering, described as constructive but inconclusive, occurred roughly 16 days after the initial February meeting and followed a second discussion eight days later. A central theme was a proposed compromise that would permit third parties—such as exchanges and other service providers—to offer stablecoin rewards only in relation to transaction activity, not as returns on idle balance holdings. This shift aims to dampen potential incentives for large sums to accumulate in wallets simply to generate yield, a factor cited by banks as a competitive pressure that could distort traditional banking models.
During the talks, participants signaled progress in narrowing differences on language that would codify how stablecoins are treated within the broader regulatory framework. The dynamic highlighted the delicate balance between fostering innovation and maintaining financial stability. In a notable development, the session included representatives from the crypto industry who advocate for reward programs that align with transaction-based engagement, balanced by bankers’ concerns about depositor protection and systemic risk. The discussions also foregrounded the practical role of third-party platforms in delivering stablecoin rewards, a line of inquiry that could influence how wallets, exchanges, and payment rails interoperate under a regulated regime.
On the record, executives from the involved crypto firms described the session as a step forward. After the meeting, Ripple’s chief legal officer offered a succinct update: the teams had “rolled up our sleeves and went through language today,” signaling that specifics were being mapped out in detail. In parallel, Coinbase described the tone as constructive and cooperative, underscoring a shared interest in advancing policy that would provide clarity without stifling innovation. A separate note from the Blockchain Association framed the meeting as a productive progression toward resolving outstanding questions about stablecoin rewards and moving the legislation closer to a vote.
The concessions under discussion would have to survive scrutiny from both chambers of Congress and the White House, given the competing priorities that have characterized crypto regulation for years. A point of friction remains the concept of “idle balance yields” versus activity-based rewards, a distinction that lawmakers and industry participants have wrestled with since early discussions. Semafor’s coverage referenced internal discussions and comments from participants indicating that the debate has shifted toward activity-based incentives, while the idea of earning yield simply from holding stablecoins has been effectively sidelined in the near term.
The banking sector has framed its concerns around competitive pressures more than deposit flight, a nuance echoed by some participants who emphasized that the issue is as much about maintaining a level playing field as about liquidity risk. The broader regulatory conversation includes a separate line of analysis around the potential macro implications of widespread stablecoin use, with Treasury authorities having previously estimated that rapid mass adoption could catalyze significant deployment shifts within the traditional banking system. Those considerations underscore why the White House and lawmakers are approaching the negotiation with both urgency and caution, seeking a policy that can be implemented without triggering abrupt dislocations in financial markets.
Looking ahead, observers expect another round of discussions among banking groups to determine whether the proposed language can gain acceptance. The next steps will likely hinge on a mutual willingness to compromise on the reward structure, as well as a clear signal from lawmakers about how quickly the bill could progress through committee and to a floor vote. The ongoing negotiations illustrate the complexity of delivering a unified U.S. stance on stablecoins—one that accommodates the rapid evolution of digital assets while preserving the oversight and safeguards that underpin the mainstream financial system.
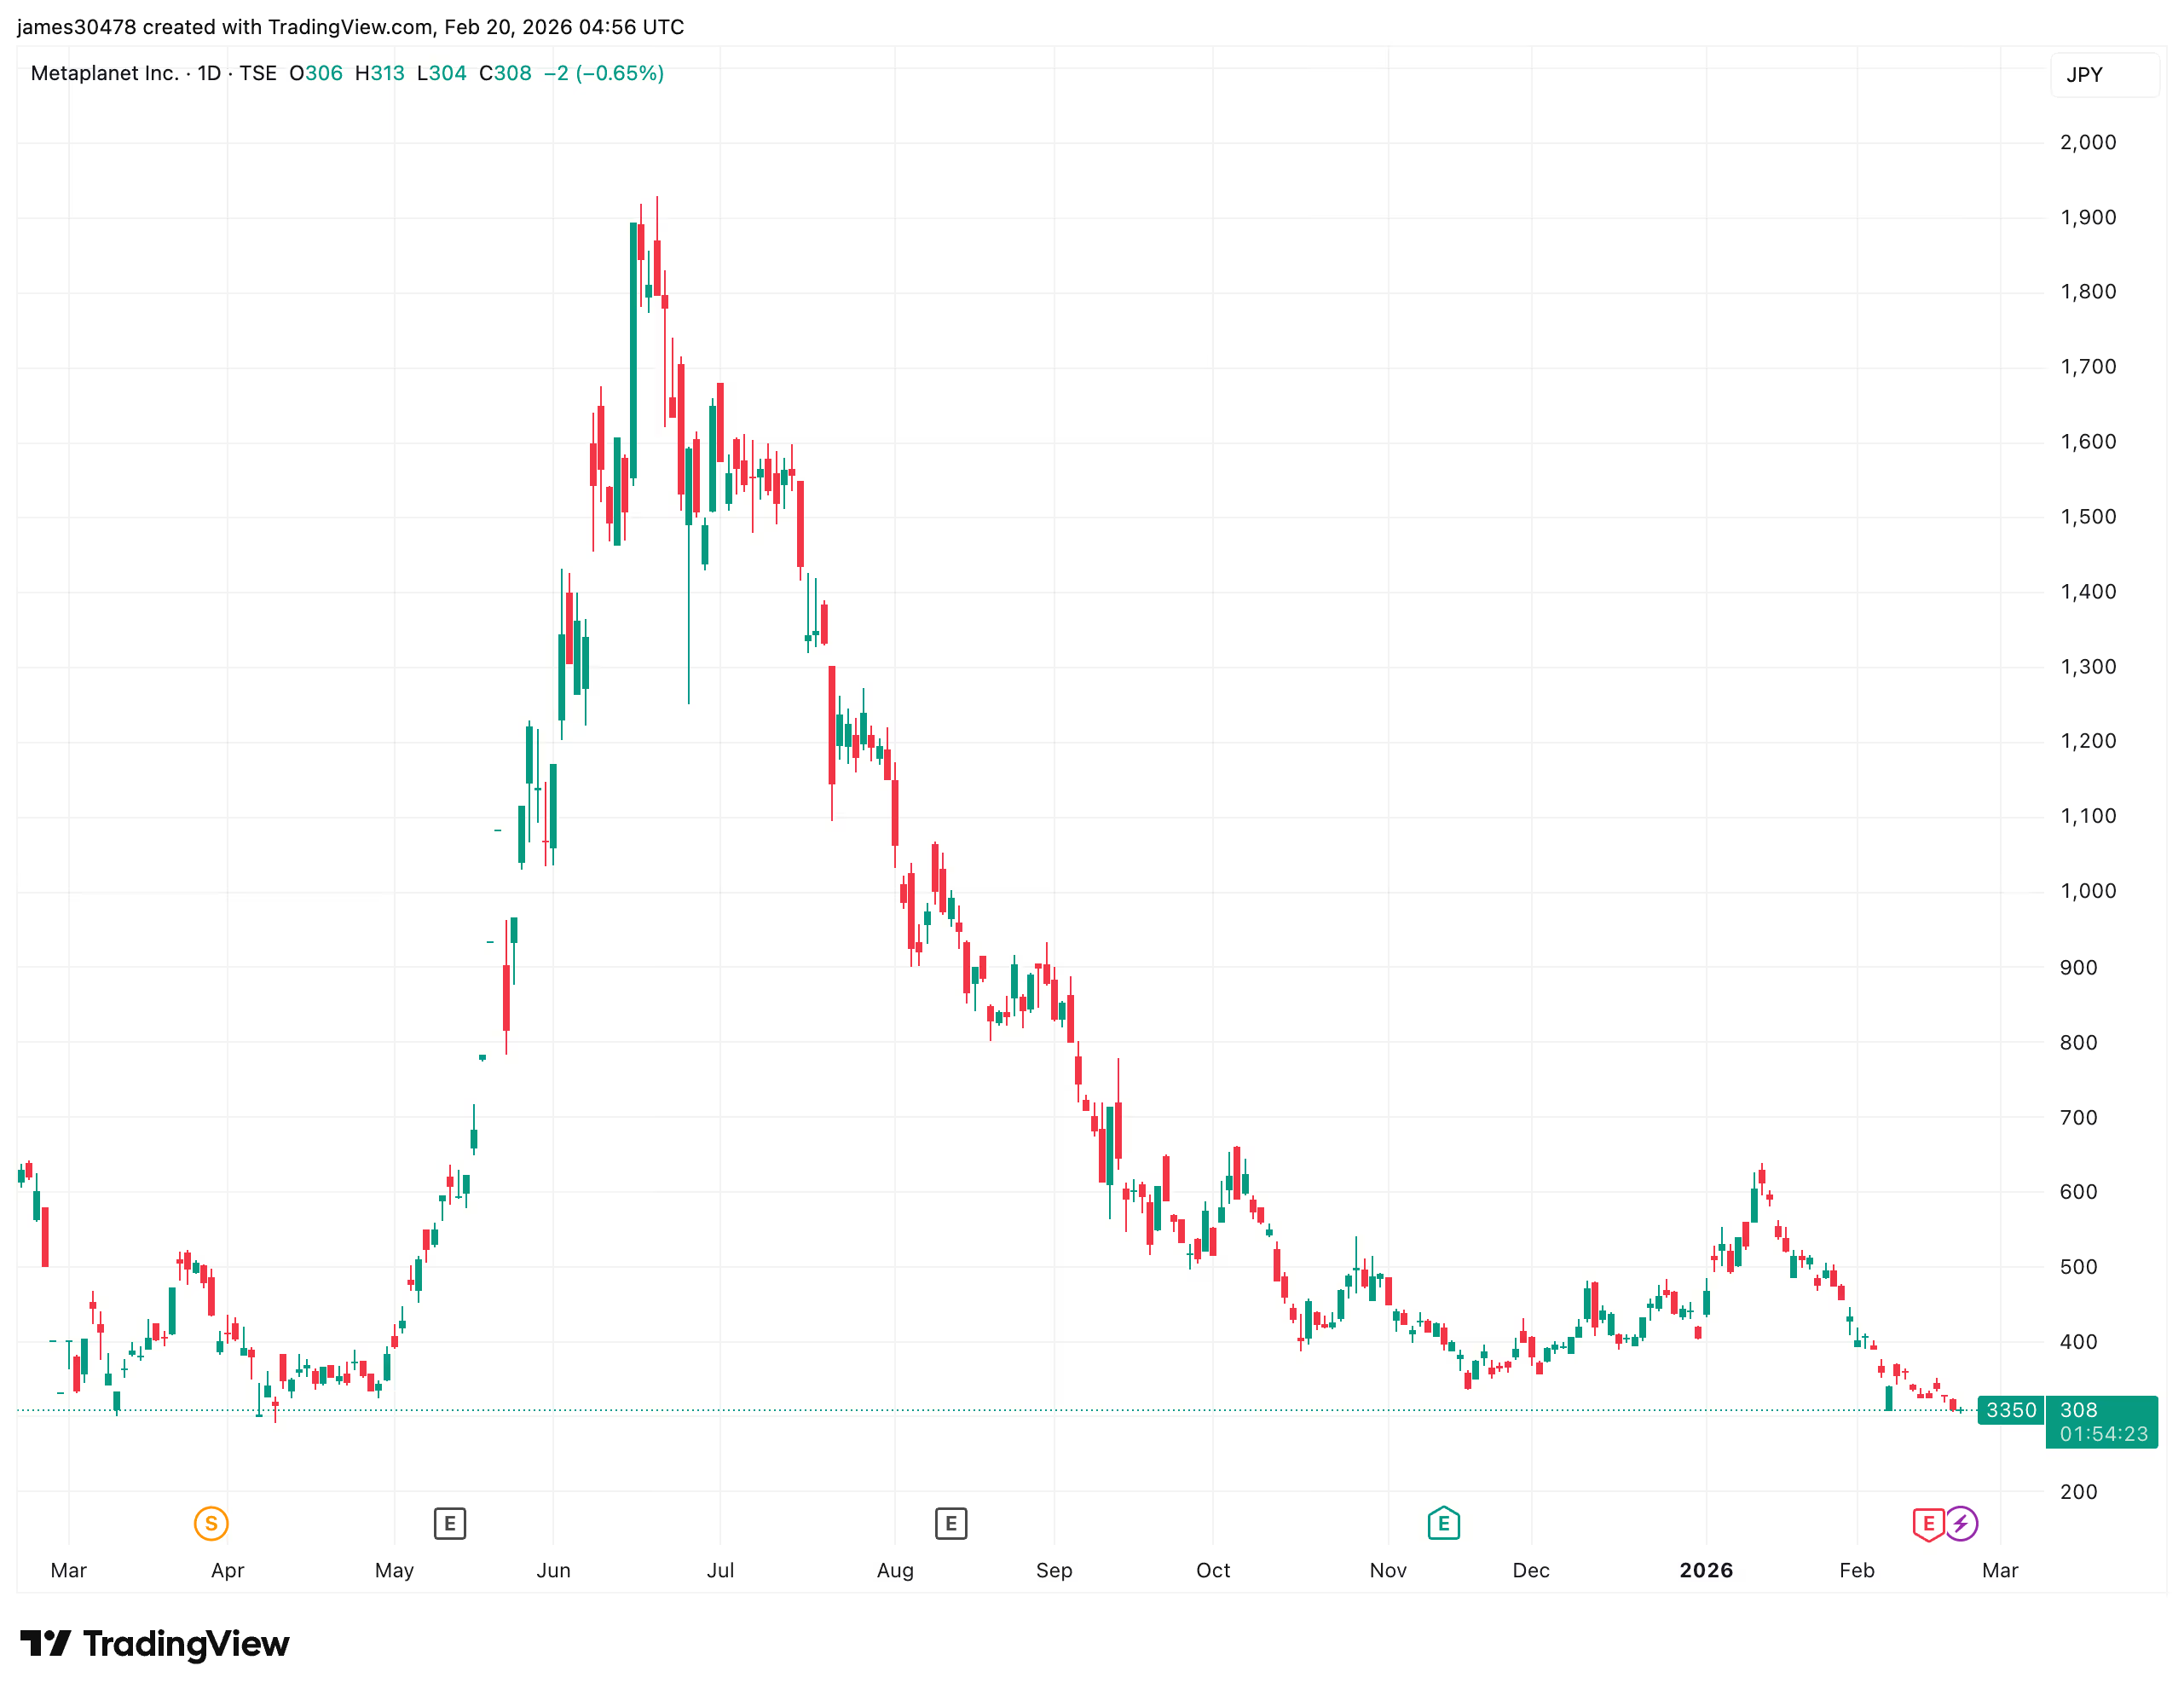
Simon Gerovich, CEO of Metaplanet (3350), has responded to online criticism of the Tokyo-listed bitcoin treasury company, as bitcoin is down almost 50% from its October all-time high and now trading near $67,000, while Metaplanet shares have fallen roughly 85% from their 2025 all-time high.
Addressing anonymous critics, Gerovich said, “It’s easy to hide behind anonymous accounts, criticize others, and incite outrage without taking any responsibility.” Gerovich added, “I have no qualms about taking public responsibility for all my statements and Metaplanet’s actions.”
匿名アカウントの裏に隠れて、何の責任も負うことなく他者を非難し、炎上させることは簡単です。しかし、私は自らの発言とメタプラネットの行動すべてに対して公の場で責任を負うことに何の抵抗もありません。そのため、寄せられている各主張に対して、直接お答えします。… https://t.co/e0ieMGq29N
— Simon Gerovich (@gerovich) February 20, 2026
Metaplanet uses options, specifically selling put options and put spreads, to generate premium income and potentially acquire bitcoin below the prevailing market price.
Defending this approach, Gerovich said, “Selling put options is not a bet on bitcoin’s price rising.”
Gerovich explained that the strategy is designed to lower the company’s effective purchase cost and monetise volatility.

On transparency, Gerovich said, “we are one of the most transparent listed companies in the world.” Gerovich pointed to real-time wallet disclosure and repeated announcements of purchases, including those made in September.
Gerovich also acknowledged market timing concerns, he said, “September marked a local peak. I have no intention of denying that.” Gerovich stressed that the strategy is systematic accumulation, not short-term trading.
Lastly, Gerovich responded to criticism of financial results, saying, “Net profit is not an appropriate metric for evaluating a bitcoin treasury company.” Gerovich also rejected claims about the hotel division, stating the business is not in ruins and highlighting its profitability.
Metaplanet shares trade at 307 yen, while the company holds 35,102 BTC.

The White House has reportedly refocused talks between crypto and bank lobbyists on limiting how stablecoin rewards should be paid in the third meeting between the two groups over a crypto market structure bill.
Crypto and banking industry representatives met at the White House on Thursday for the third time in 16 days to discuss stablecoin provisions that have stalled the crypto bill which the Senate is looking to pass.
No agreement was reached on Thursday, but executives at Coinbase and Ripple said progress was made as one of the White House’s crypto advisers urged a trade-off to let third parties, such as exchanges, offer stablecoin rewards only on transaction activity, not balances.
“We rolled up our sleeves and went through specific language today,” Ripple’s chief legal officer, Stuart Alderoty, posted to X on Thursday. Coinbase’s legal head, Paul Grewal, said the meeting was “constructive and the tone cooperative.”
Blockchain Association CEO Summer Mersinger said the meeting was a “step forward” in resolving issues related to stablecoin rewards and ensuring that crypto market structure legislation is advanced.

It’s the third meeting between the three parties, who first met on Feb. 2 and again eight days later on Feb. 10, as the Senate is looking to pass a bill to define how US market regulators will police crypto.
The House passed a similar version of the bill, called the CLARITY Act, in July, but the effort has stalled as the Senate Banking Committee has not yet secured enough bipartisan support to move it forward.
Semafor reporter Eleanor Mueller and journalist Eleanor Terrett both reported that White House crypto adviser Patrick Witt drove the discussion at the latest meeting.
Witt pushed for a previously pitched proposal that would allow third parties to offer stablecoin rewards to customers tied to transactions and activity, and not balances, the latter of which has been a sticking point for banks.
“Earning yield on idle balances, a key crypto industry goal, is effectively off the table,” Terrett said, citing those who attended the meeting. “The debate has narrowed to whether firms can offer rewards linked to certain activities.”
Semafor’s Mueller reported that the banks will start meeting tomorrow to decide whether to agree to the trade-off, and added that discussions would continue in the coming days.
Related: Banks can’t seem to service crypto, even as it goes mainstream
The Bank Policy Institute, American Bankers Association and Independent Community Bankers of America represented the banking industry, none of which have publicly commented on the latest White House meeting.
Banks fear competitive pressures, not deposit flight risk
Banking groups have argued that stablecoin rewards will compete with and undermine the banking system and lead to bank deposits shifting to stablecoins.
The US Treasury estimated in April that mass stablecoin adoption could trigger $6.6 trillion in deposit outflows from the banking system.
However, according to Terrett, one banking member at the meeting said their concerns stem more from competitive pressures than from deposit flight.
Magazine: South Korea gets rich from crypto… North Korea gets weapons
Nearly $2.5 billion in Bitcoin and Ethereum options expire today, setting up a potentially volatile end to the month as traders juggle upside bets with deep downside insurance.
On the surface, positioning appears constructive. But beneath the call-heavy skew lies a striking anomaly: one of the largest open interest clusters in Bitcoin sits far below spot — at the $40,000 strike.
Calls Dominate, But Max Pain Sits Higher
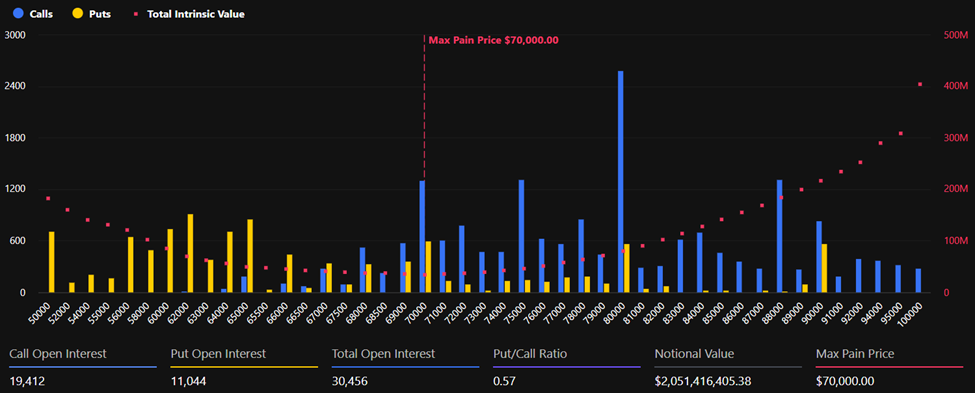
Bitcoin is currently trading around $67,271, with max pain positioned at $70,000. Open interest shows 19,412 call contracts and 11,044 put contracts. This gives a put-to-call ratio of 0.57 and reflects an overall upside bias. The total notional volume tied to the expiry is roughly $2.05 billion.

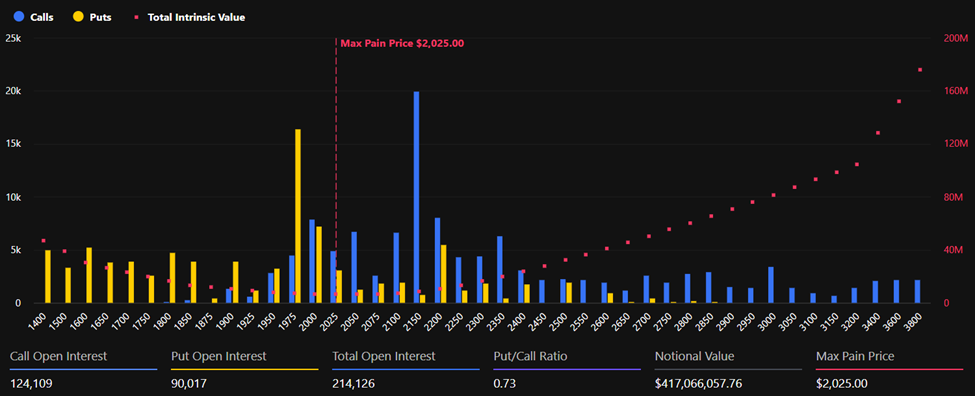
Ethereum mirrors that constructive tilt, though in a more balanced fashion. ETH trades near $1,948, with max pain at $2,025.
Calls (124,109 contracts) outnumber puts (90,017), resulting in a put-to-call ratio of 0.73 and a notional value of approximately $417 million.
“…positioning skews call heavy across both assets, with BTC showing the stronger upside skew. Max pain levels sit below dominant call open interest in BTC, while ETH positioning is more balanced but still constructive,” analysts at Deribit noted.
Max pain refers to the price at which the greatest number of options expire worthless, minimizing payouts to buyers.
With both BTC and ETH trading below their respective max pain levels, price gravitation toward those strikes into expiry could reduce losses for option sellers.
The $40,000 Put: A Tail-Risk Signal
Despite the headline bullish skew, a massive concentration of puts at the $40,000 strike has caught market attention.
The $40,000 Bitcoin put is now the second-largest strike by open interest, representing roughly $490 million in notional value. This comes after Bitcoin’s sharp retracement from prior highs, which reshaped hedging demand across the board.
“While aggregate positioning into expiry skews call heavy, one strike stands out: The $40K BTC put remains among the largest open interest strikes ahead of February expiry. Deep OTM downside protection demand remains visible on the board, even as headline put/call ratios lean constructive,” Deribit analysts indicated, highlighting the unusual size of the position.
In short, traders may be positioned for upside, but they are unwilling to rule out another volatility shock.
Hedging, Premium, and Structural Implications
The dynamic suggests a broader change in Bitcoin’s derivatives market. Options are increasingly used for directional bets, yield strategies, and volatility management.
Analyst Jeff Liang argued that extracting premium from the options market could reduce structural selling pressure.
“If we can stably extract the premium from the options market and empower Bitcoin HODLers, it means: HODLers no longer need to sell their Bitcoin to improve their lives… Selling pressure on Bitcoin will reduce… This will further drive Bitcoin’s price upward,” he stated.
The analyst described options premium as a “localized pump” driven by fear and greed, one that redistributes value to long-term holders without contradicting Bitcoin’s fixed supply cap.
Overall, calls outweigh puts across both BTC and ETH, signaling that traders retain exposure to a rebound. Yet the sheer scale of deep out-of-the-money hedges reveals a market that remains cautious.
With billions in notional value set to expire, the key question is whether prices drift toward max pain—or whether hidden crash-protection demand proves prescient, reigniting volatility just as traders expect calm.

According to data from Glassnode, US spot Bitcoin exchange-traded funds (ETFs) have recorded their largest balance drawdown of the current market cycle following the early October all-time high.
Nonetheless, despite the recent outflows, the broader ETF picture still remains constructive.
Bitcoin ETFs See Deepest Cycle Pullback as Balances Fall to 1.26 Million BTC
Glassnode data shows that since October, US spot Bitcoin ETF balances have declined by roughly 100,300 BTC. At press time, total holdings stood at approximately 1.26 million BTC.
The contraction reflects sustained net outflows, as investors have withdrawn capital from spot ETFs, leading funds to reduce holdings. According to SoSoValue, $1.6 billion was pulled from these products in January alone, extending a streak of monthly outflows that began in November 2025.
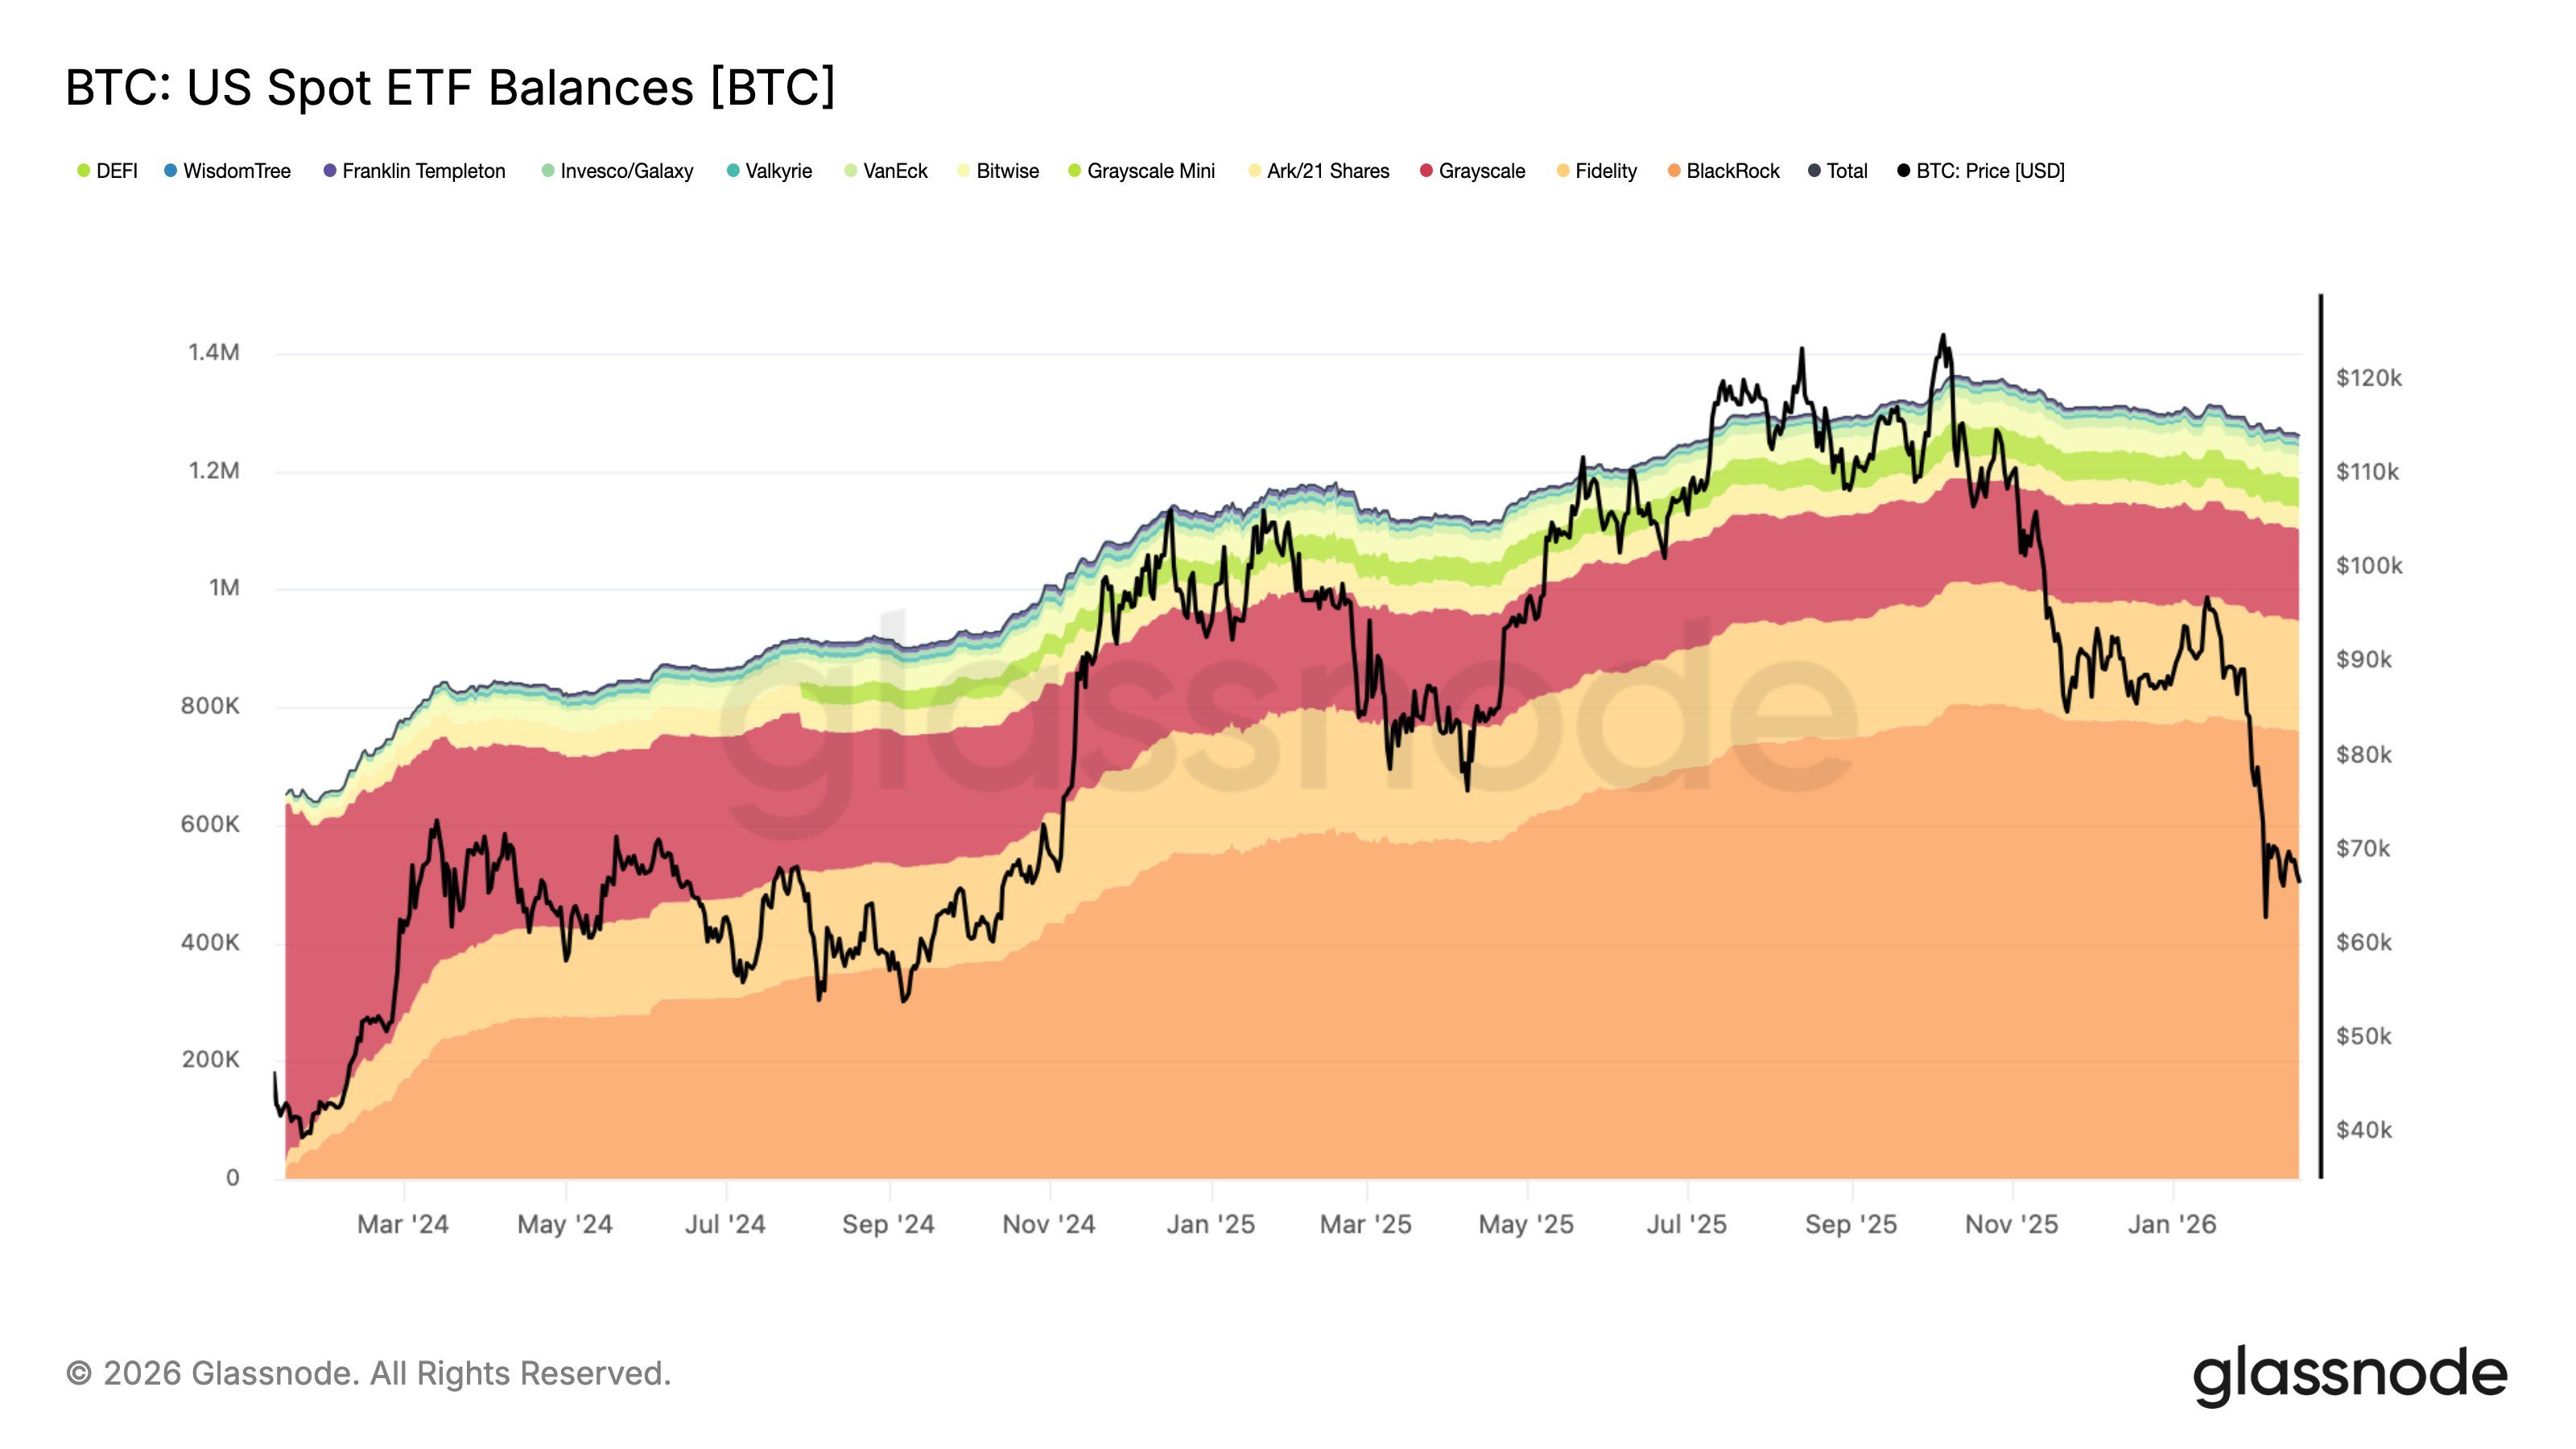
The decline in ETF balances has unfolded alongside a broader market downturn. Bitcoin has trended lower since reaching its record high of $126,000 in October. The weakness has spilled into 2026, fueling elevated fear and uncertainty across the market.
Although spot ETFs were widely seen as a structural catalyst during Bitcoin’s rally, experts suggest the same mechanism may have intensified downside pressure during periods of redemptions. In early February, Arthur Hayes argued that institutional dealer hedging activity is amplifying downward pressure on BTC prices.
“Institutional de-risking has added structural weight to the ongoing weakness, reinforcing the broader risk-off environment,” Glassnode added.
The strain extends beyond ETF outflows and into mounting unrealized losses. According to Glassnode, the average entry price for US spot Bitcoin ETF investors stands at approximately $83,980 per BTC.
With Bitcoin trading at $67,349 at the time of writing, this cohort is currently sitting on paper losses of roughly 20%.
Meanwhile, the outflows are not isolated to Bitcoin. BeInCrypto reported $173 million exited digital asset funds last week. This marked the fourth consecutive week of redemptions, totaling $3.7 billion for the period.
Bitcoin ETF Net Inflows Still at $53 Billion Despite Recent Outflows
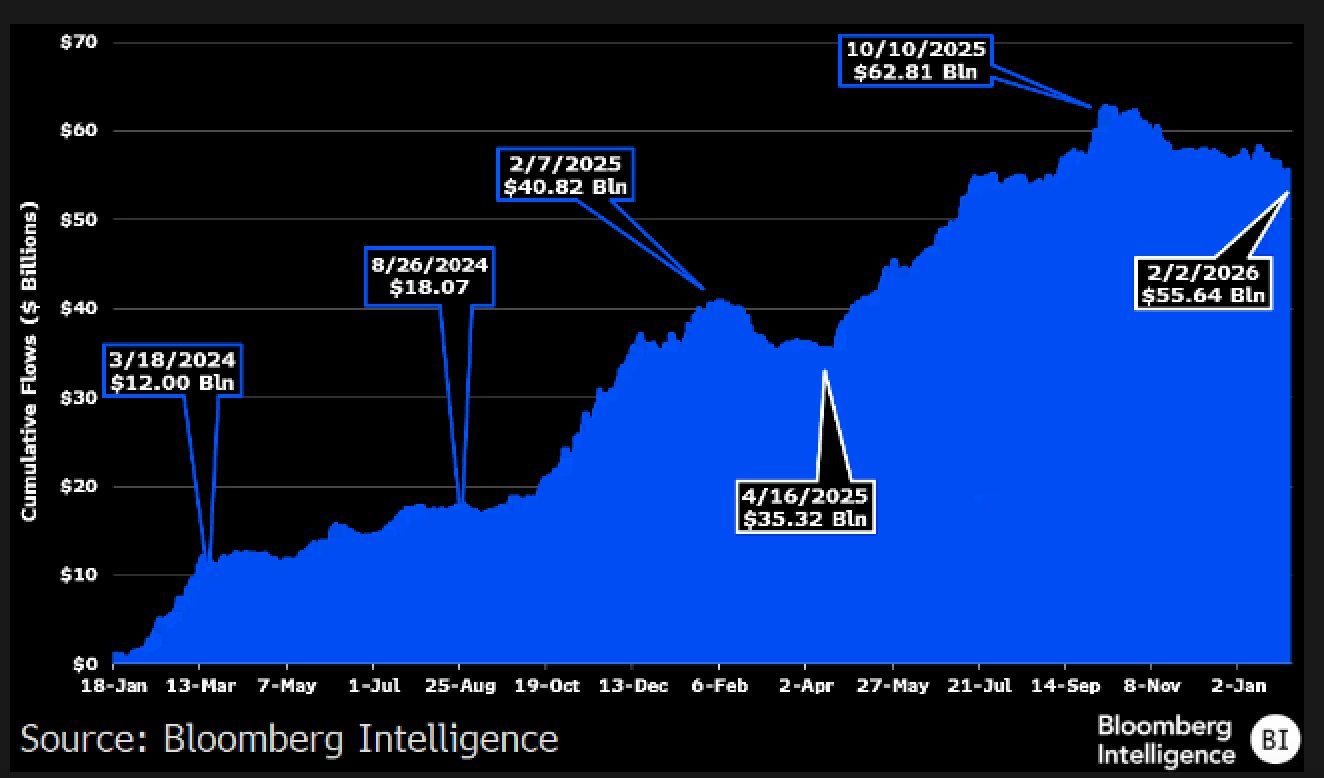
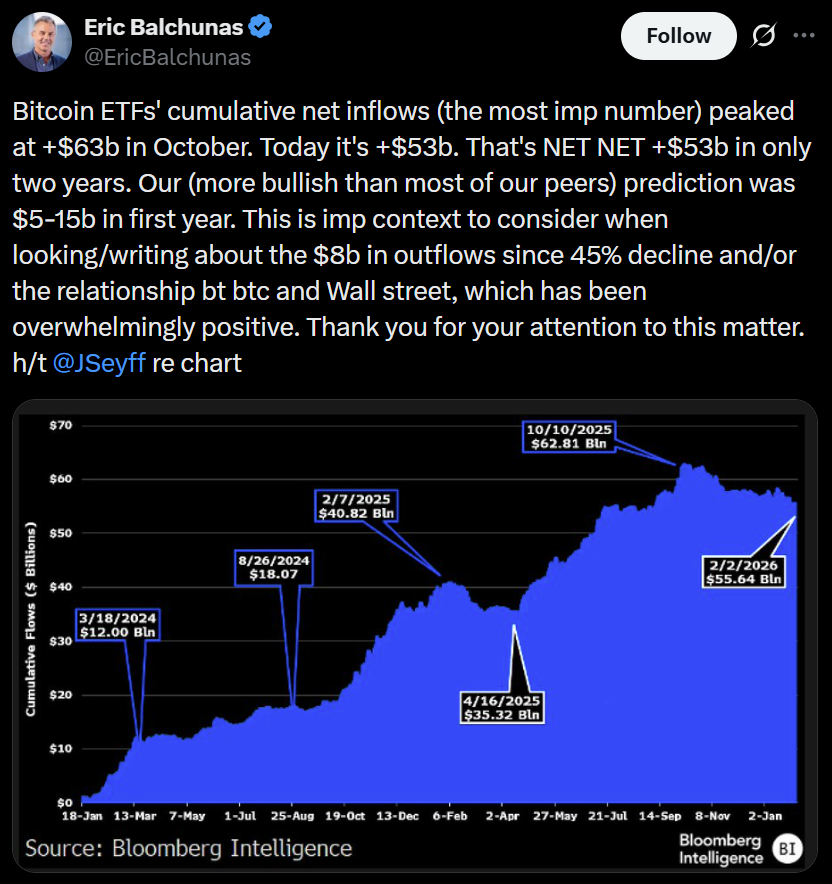
Despite the pessimism, some analysts continue to emphasize the longer-term picture. Bloomberg senior ETF analyst Eric Balchunas noted that cumulative net inflows into Bitcoin ETFs still stand at roughly $53 billion, down from a peak of over $63 billion in October 2025, even after recent outflows.
“Our (more bullish than most of our peers) prediction was $5-15b in first year. This is imp context to consider when looking/writing about the $8b in outflows since 45% decline and/or the relationship bt btc and Wall street, which has been overwhelmingly positive,” he added.
Taken together, the data suggest the current retracement reflects cyclical risk reduction rather than a structural reversal. ETF flows have amplified both upside and downside moves, embedding Bitcoin more deeply into traditional capital markets dynamics.
While short-term pressure may persist amid broader macro uncertainty, the scale and speed of institutional adoption since launch indicate that Bitcoin’s integration into Wall Street portfolios remains intact.


Metaplanet Chief Executive Simon Gerovich has rejected claims that the company lacks transparency in its Bitcoin investment strategy, following criticism shared on X.
Summary
- Metaplanet CEO Simon Gerovich denied claims that the company hides Bitcoin purchases, saying all transactions and wallet addresses are publicly disclosed.
- He defended the firm’s options strategy and financial reporting, arguing they reduce costs and reflect long-term holdings rather than short-term speculation.
- Management re-affirmed its commitment to Bitcoin accumulation while addressing concerns over borrowing, profits, and shareholder funding.
In a detailed public response, Gerovich addressed allegations that Metaplanet failed to disclose purchases, mismanaged options trading, and withheld key financial information. He said the claims were misleading and ignored data already available to shareholders.
The comments came after an anonymous post accused the company of hiding losses and buying Bitcoin at market peaks using shareholder funds.
CEO responds to disclosure and trading claims
Gerovich said Metaplanet has consistently announced all Bitcoin (BTC) purchases when they were made. He added that the company maintains a public dashboard showing wallet addresses and holdings in real time.
According to him, four Bitcoin purchases made in September were disclosed promptly, even though prices were near local highs at the time. He said the company’s strategy does not focus on short-term market timing, but on long-term accumulation.
He also pushed back against criticism of the firm’s options activity. Gerovich explained that selling put options is meant to lower the effective cost of acquiring Bitcoin through premium income.
As an example, he said selling a put at $80,000 with a $10,000 premium would reduce the effective purchase price to $70,000. He argued that this approach benefited shareholders during periods of high volatility.
The CEO said this strategy helped raise Bitcoin per share by more than 500% in 2025, which remains the company’s main performance indicator.
Financial results, borrowing, and shareholder concerns
Gerovich also addressed concerns about Metaplanet’s financial statements. He said net profit figures do not accurately reflect the performance of a Bitcoin-focused treasury company, due to unrealized valuation changes.
He pointed instead to operating profit, which rose sharply year over year, as evidence that the business remains healthy. Losses, he said, were mainly accounting adjustments on long-term Bitcoin holdings that the company does not plan to sell.
On borrowing practices, Gerovich said Metaplanet disclosed its credit facility, drawdowns, and collateral terms when they occurred. However, he noted that lender identities and exact interest rates were withheld at the counterparty’s request.
He added that the terms were favorable and fully approved under disclosure rules.
The CEO also responded to claims that the firm relies solely on shareholder funding. He said he is a major shareholder and has invested personal funds in the company. He pointed to the hotel business, which recorded solid revenue and profit in 2025, as proof that Metaplanet still operates outside crypto.
Gerovich concluded by saying he remains open to direct questions from investors and will continue publishing detailed updates on the company’s activities.
US spot Bitcoin exchange-traded funds (ETFs) may be seeing heavy outflows lately, but the broader picture tells a different story.
According to Bloomberg ETF analyst Eric Balchunas, cumulative net inflows into Bitcoin (BTC) ETFs peaked at $63 billion in October and now stand at about $53 billion, even after months of redemptions.
“That’s NET NET +$53b in only two years,” Balchunas wrote on X, sharing data compiled by fellow analyst James Seyffart.
The figure far exceeds Bloomberg’s early projections, which had called for inflows of $5 billion to $15 billion over that time frame.
In other words, recent withdrawals haven’t erased the bigger success story. Despite Bitcoin’s roughly 50% pullback from its highs, institutional money hasn’t fled at the same pace, suggesting many investors are holding for the long term rather than panic selling.

The US spot Bitcoin ETFs were approved in early 2024 and quickly became a dominant force in the market. Bitcoin went on to hit new all-time highs ahead of its April 2024 halving event, breaking historical trends, with ETF accumulation accelerating through 2025 and peaking in October as prices surged past $126,000.
The launches are widely considered among the most successful in US ETF history. BlackRock’s iShares Bitcoin Trust, in particular, became the fastest ETF ever to surpass $70 billion in assets, reaching the milestone in under a year.
Related: BlackRock sees record quarter for iShares ETFs as Bitcoin, Ether demand surges
Bitcoin faces an uncertain 2026 as cycle debate intensifies
To be sure, 2026 is shaping up to be a challenging year for Bitcoin and the broader digital asset market, following a renewed sell-off in late January and early February that sent the biggest cryptocurrency to about $60,000.
Investor sentiment remains fragile, prompting some analysts to argue that the latest bull market, consistent with Bitcoin’s historical four-year cycle, may have run its course.
Others contend the cycle is simply evolving. They argue that a longer business cycle and changing macro conditions could be stretching Bitcoin’s traditional rhythm rather than ending it.
Bitwise analysts Matt Hougan and Ryan Rasmussen go further, suggesting Bitcoin may be breaking from its long-standing four-year pattern altogether due to the growing influence of institutional capital.
“The wave of institutional capital that began entering the space in 2024 is likely to accelerate in 2026,” the analysts said, pointing to expanded access on major wealth platforms such as Morgan Stanley and Merrill Lynch.

Despite rapid institutional adoption through spot ETFs, Bitcoin appeared to lose retail attention in 2025 as investors gravitated toward other high-growth themes, according to data from crypto market maker Wintermute.
Related: Bitcoin mining’s 2026 reckoning: AI pivots, margin pressure and a fight to survive


ProShares has launched a new money market exchange-traded fund designed to help stablecoin issuers manage regulatory-compliant reserves backed by short-term U.S. Treasuries.
Summary
- ProShares has introduced the IQMM ETF to meet reserve rules for stablecoin issuers under the GENIUS Act framework.
- The fund invests only in short-term U.S. government securities and offers intraday trading and same-day settlement.
- The product reflects growing ties between traditional asset managers and the digital asset sector.
The company said in a Feb. 19 statement that the ProShares GENIUS Money Market ETF, trading under the ticker IQMM, is built to meet reserve rules under the GENIUS Act. The fund invests only in short-term U.S. Treasury securities and is designed to serve as a low-risk cash management option.
ProShares described IQMM as a conservative product for institutions, financial advisers, and individual investors. A key target group is companies that issue dollar-backed stablecoins and need compliant ways to manage large reserve balances.
Focus on stablecoin reserve management
IQMM holds only short-term government-backed securities, including Treasury bills and related instruments. This structure allows the fund to qualify as eligible backing for payment stablecoins.
Under current U.S. rules, stablecoin issuers must maintain one-to-one reserves in safe and liquid assets. These requirements have increased demand for products that combine regulatory compliance with operational flexibility.
The ETF allows investors to trade throughout the day and settle transactions on the same day. Weekly income distributions are planned, giving holders a steady return on idle funds.
IQMM also uses a floating net asset value and dual NAV options. These features are intended to help institutions move large cash positions without disrupting daily operations.
ProShares said the fund carries a net expense ratio of 0.15%. While retail investors can access the product, the main focus remains on firms managing large reserve pools. Industry estimates suggest stablecoin issuers held more than $150 billion in U.S. Treasuries by late 2025.
“We believe that IQMM will be an attractive cash management alternative for institutional investors, including stablecoin treasuries,” said ProShares chief executive Michael L. Sapir.
Traditional finance deepens its crypto ties
The launch reflects closer links between traditional asset managers and the digital asset industry, as regulators demand higher standards for stablecoin backing.
With IQMM, ProShares is offering a ready-made option for companies that prefer not to manage Treasury portfolios on their own. The ETF structure allows issuers to meet reserve rules while relying on familiar market infrastructure.
Analysts say such products could make compliance easier for crypto firms entering more regulated environments. Instead of building internal treasury operations, issuers can place reserves in approved funds with clear reporting and oversight.
Some market observers, however, note that heavy redemptions during periods of stress could put pressure on money market ETFs tied to stablecoin activity. Managing liquidity during volatile conditions will remain an important test.
ProShares manages more than $95 billion across its ETF and mutual fund platforms. In recent years, the firm has expanded into crypto-linked, income-focused, and tactical investment strategies.
12 best clothes steamers, tried and tested
The luxury Wiltshire hotel that is one of the best family-friendly escapes in the UK

Bitcoin Holders Defend Range as $55K Floor Looms: Glassnode

Smart energy pays enters the US market, targeting scalable financial infrastructure

Why Israel is blocking foreign journalists from entering
Software stocks enter bear market on AI disruption fear with ServiceNow plunging 10%

UPSC Economy – 16th Finance Commission – One Shot Summary for Prelims & Mains by Dr. Mrunal Patel

BITCOIN: It’s Happening AGAIN (History Repeating)!!! – Bitcoin News Today, Ethereum & Altcoins

Ripple XRP $589+ CONFIRMED THIS YEAR WE WERE USING THE WRONG CALENDAR OMG WAIT WHAT!
-

 Video4 days ago
Bitcoin: We’re Entering The Most Dangerous Phase
-

 Tech5 days ago
Luxman Enters Its Second Century with the D-100 SACD Player and L-100 Integrated Amplifier
-

 Crypto World3 days ago
Can XRP Price Successfully Register a 33% Breakout Past $2?
-

 Sports3 days ago
GB's semi-final hopes hang by thread after loss to Switzerland
-

 Video7 days ago
The Final Warning: XRP Is Entering The Chaos Zone
-

 Video4 hours ago
XRP News: XRP Just Entered a New Phase (Almost Nobody Noticed)
-
 Tech3 days ago
The Music Industry Enters Its Less-Is-More Era
-

 Business2 days ago
Infosys Limited (INFY) Discusses Tech Transitions and the Unique Aspects of the AI Era Transcript
-

 Entertainment2 days ago
Kunal Nayyar’s Secret Acts Of Kindness Sparks Online Discussion
-

 Video3 days ago
Financial Statement Analysis | Complete Chapter Revision in 10 Minutes | Class 12 Board exam 2026
-

 Tech2 days ago
Retro Rover: LT6502 Laptop Packs 8-Bit Power On The Go
-
 Crypto World6 days ago
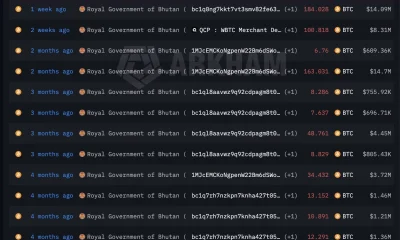
Bhutan’s Bitcoin sales enter third straight week with $6.7M BTC offload
-
 Sports1 day ago
Clearing the boundary, crossing into history: J&K end 67-year wait, enter maiden Ranji Trophy final | Cricket News
-

 Crypto World7 days ago
Kalshi enters $9B sports insurance market with new brokerage deal
-

 Entertainment1 day ago
Dolores Catania Blasts Rob Rausch For Turning On ‘Housewives’ On ‘Traitors’
-

 Business2 days ago
Tesla avoids California suspension after ending ‘autopilot’ marketing
-
 NewsBeat5 days ago
The strange Cambridgeshire cemetery that forbade church rectors from entering
-

 Crypto World1 day ago
WLFI Crypto Surges Toward $0.12 as Whale Buys $2.75M Before Trump-Linked Forum
-
 NewsBeat5 days ago
Man dies after entering floodwater during police pursuit
-

 Crypto World8 hours ago
83% of Altcoins Enter Bear Trend as Liquidity Crunch Tightens Grip on Crypto Market