

Crypto World
Crypto Whales Are Buying These 3 Altcoins After Trump’s Tariff Ban
The Supreme Court’s decision to ban Donald Trump’s tariffs has quietly shifted global market sentiment. Stocks reacted first, but crypto whales appear to be moving as well. BeInCrypto analysts tracking blockchain flows have identified early accumulation across three altcoins, signaling positioning ahead of a potential liquidity shift.
Tariff removal can ease inflation pressure and improve risk appetite, conditions that often favor speculative assets. This suggests crypto whales may already be preparing for the next phase of macro-driven crypto momentum, provided the positive sentiment holds.
Pump.fun (PUMP)
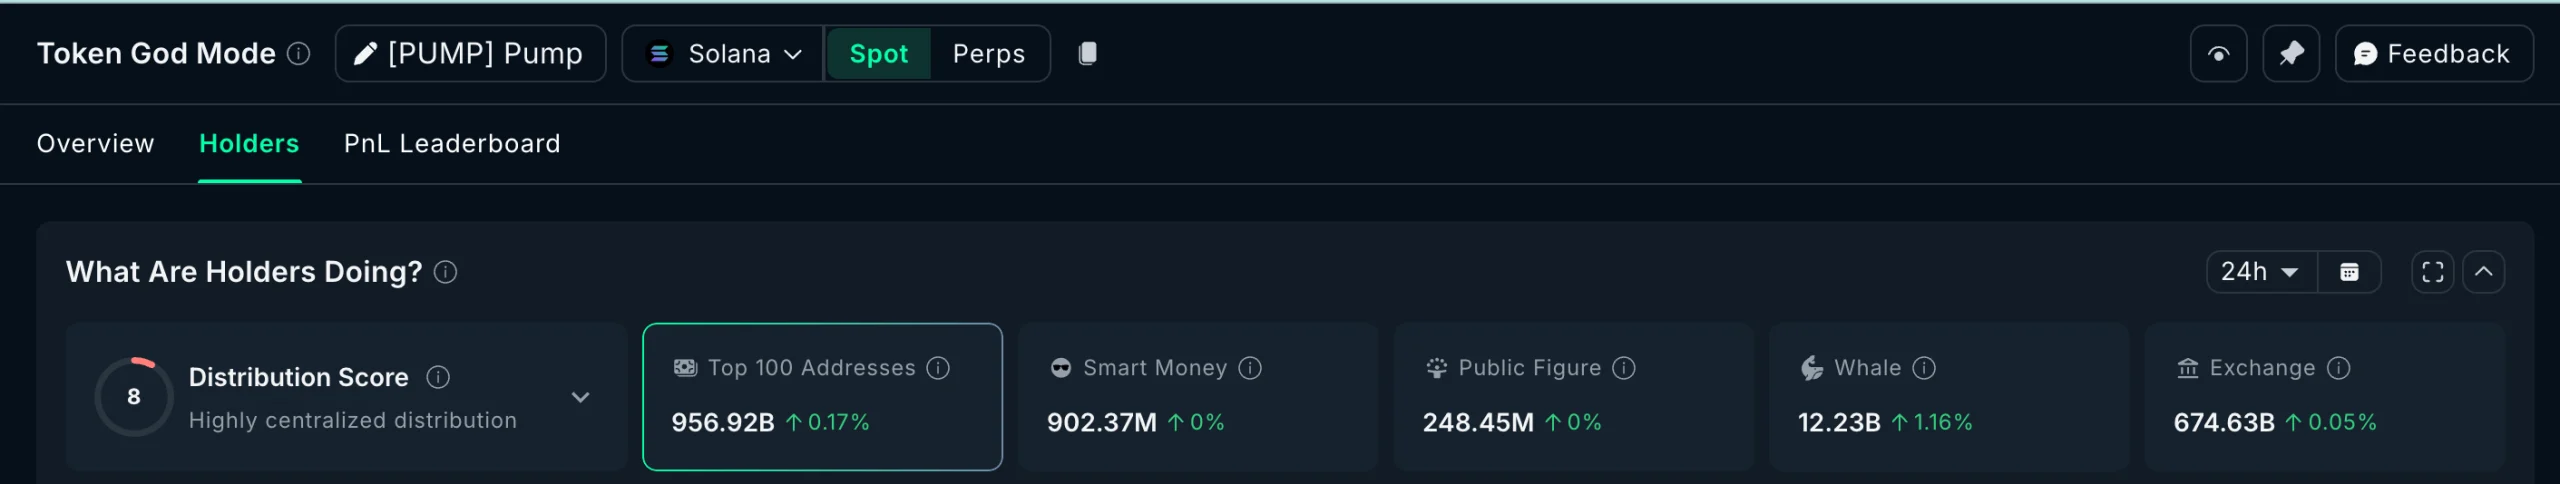
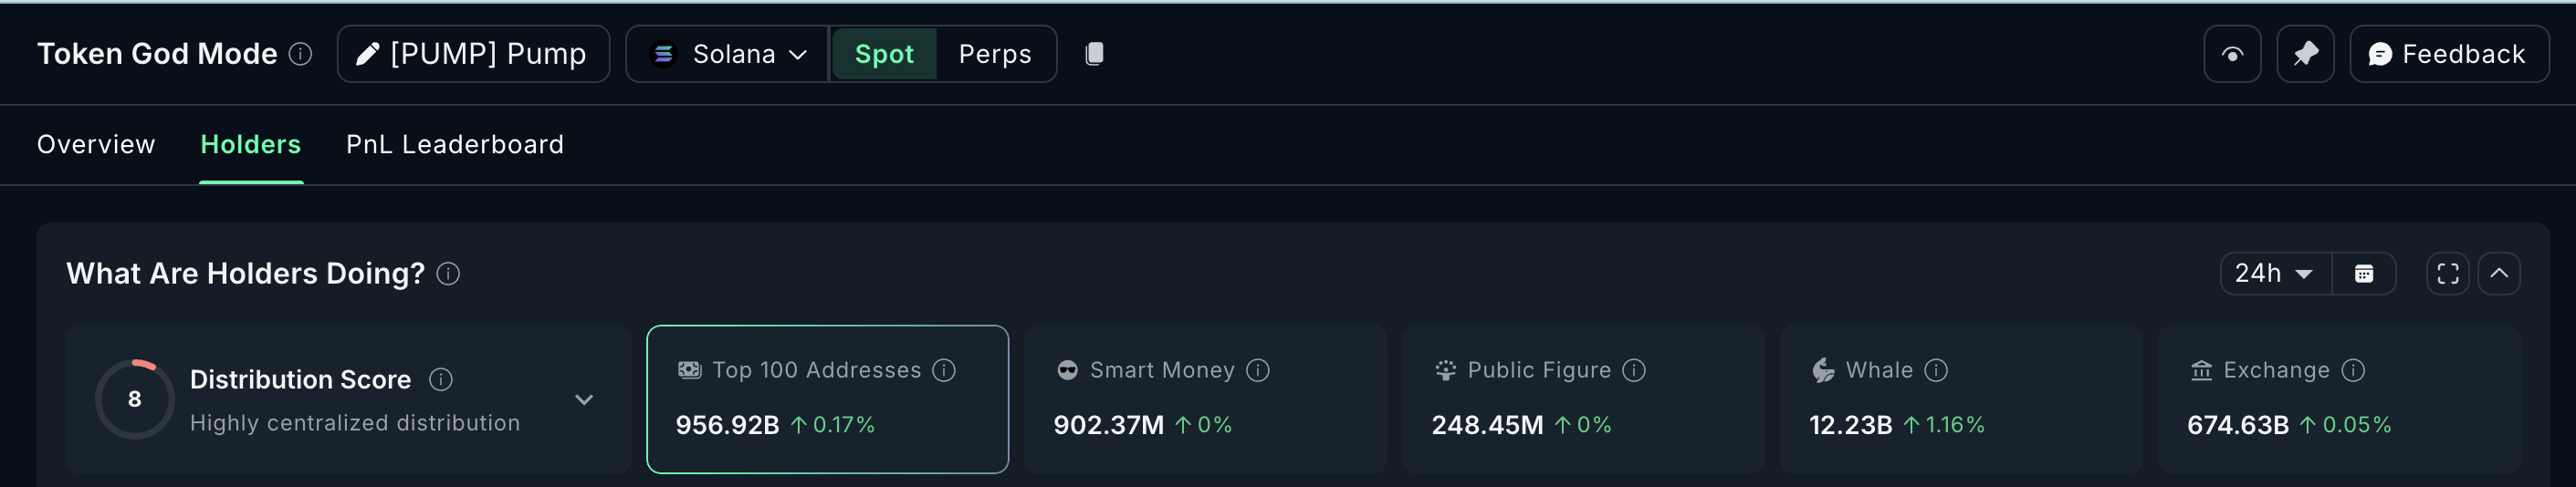
Crypto whales are buying Pump.fun (PUMP), one of the earliest infrastructure plays tied to speculative activity. Platforms like Pump.fun tend to benefit first when risk appetite improves, because they sit at the center of high-risk token launches.
On-chain data shows whale holdings rose 1.16% in the past 24 hours, bringing their total stash to 12.23 billion PUMP. This means whales added roughly 140 million PUMP tokens in a single day.
At the current price, this equals about $280,000 worth of accumulation. While not an aggressive spike, it signals early positioning rather than late chasing, reflecting cautious optimism.
The answer behind this behavior may lie in the price chart. PUMP is currently forming an inverse head-and-shoulders pattern on the 12-hour chart. This is a bullish reversal structure that appears when selling pressure fades and buyers begin regaining control.
The neckline resistance sits near $0.0022, and a confirmed breakout above this level could open the path toward $0.0035, representing a potential upside of over 55%
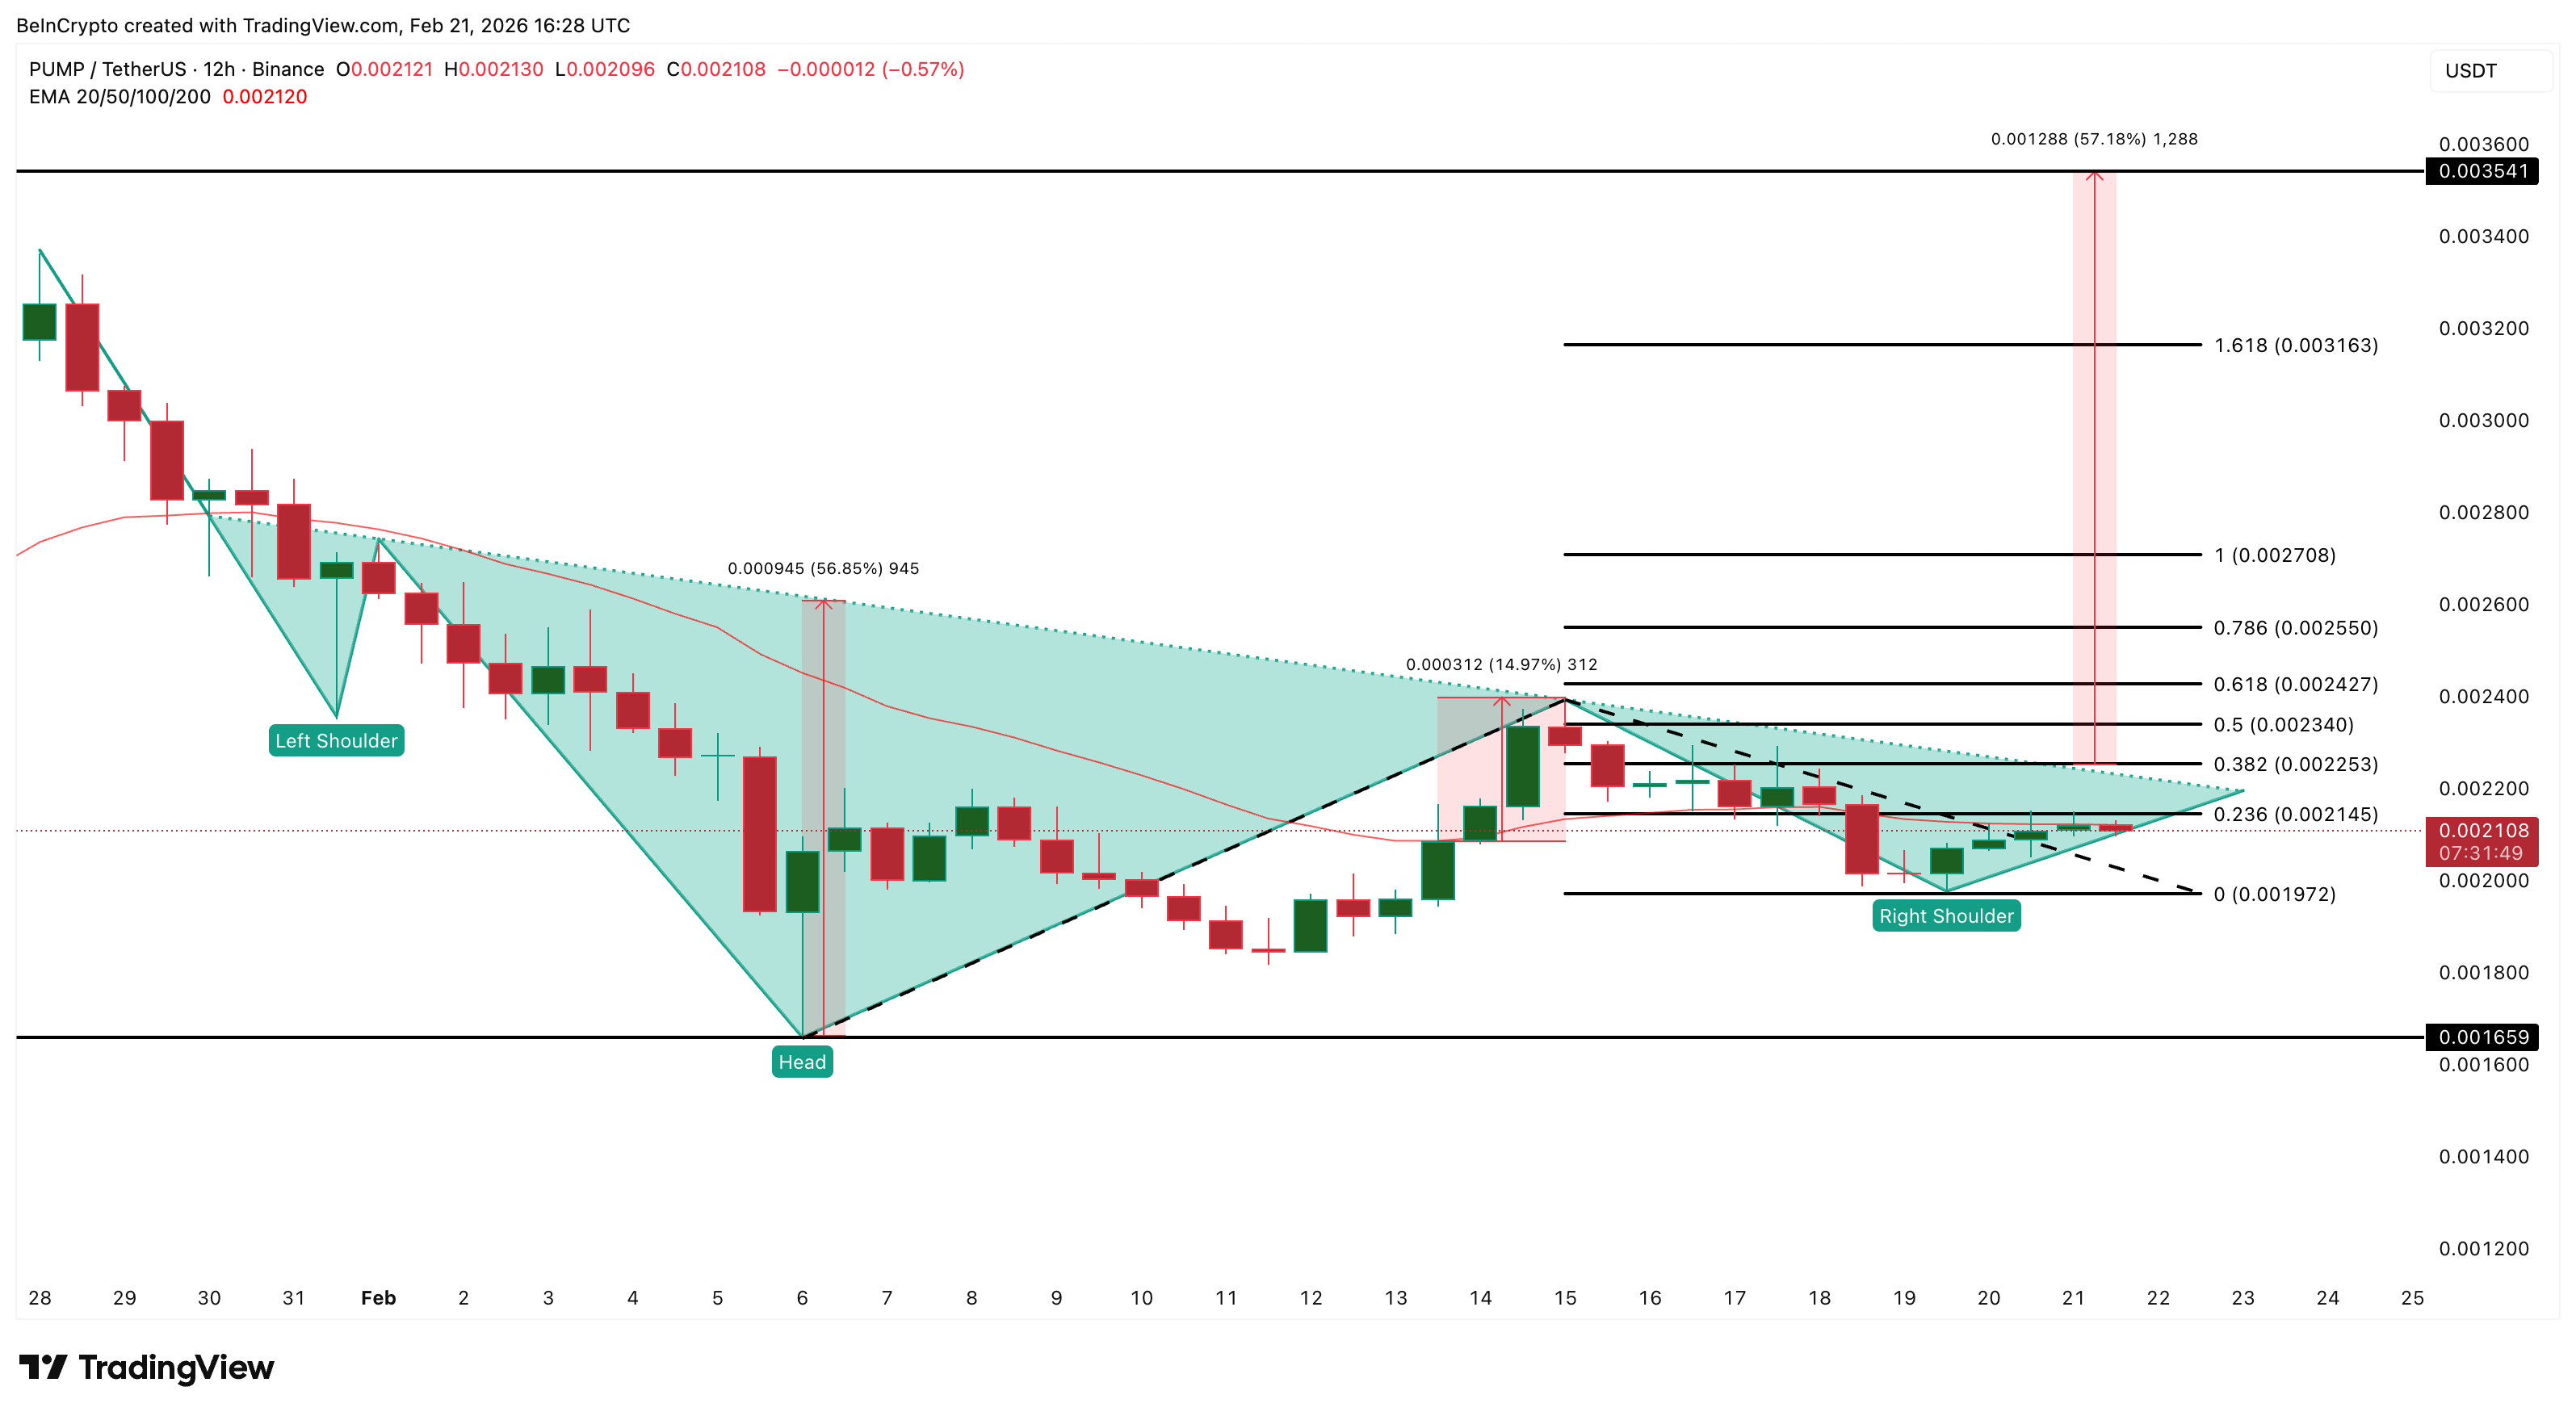
Momentum is already building. PUMP is now testing its 20-period Exponential Moving Average (EMA), which tracks the average price while giving more weight to recent moves.
Traders use this level to judge short-term strength. The last time PUMP reclaimed this EMA on February 13, it rallied nearly 15% shortly after. A similar rally can push the PUMP price past the neckline.
However, risks remain. A drop below $0.0019 would weaken momentum, while a fall under $0.0016 would invalidate the bullish setup entirely.
This explains why crypto whales are accumulating gradually. They appear to be positioning early for a PUMP price breakout, but are still respecting the current market structure.
Synthetix (SNX)
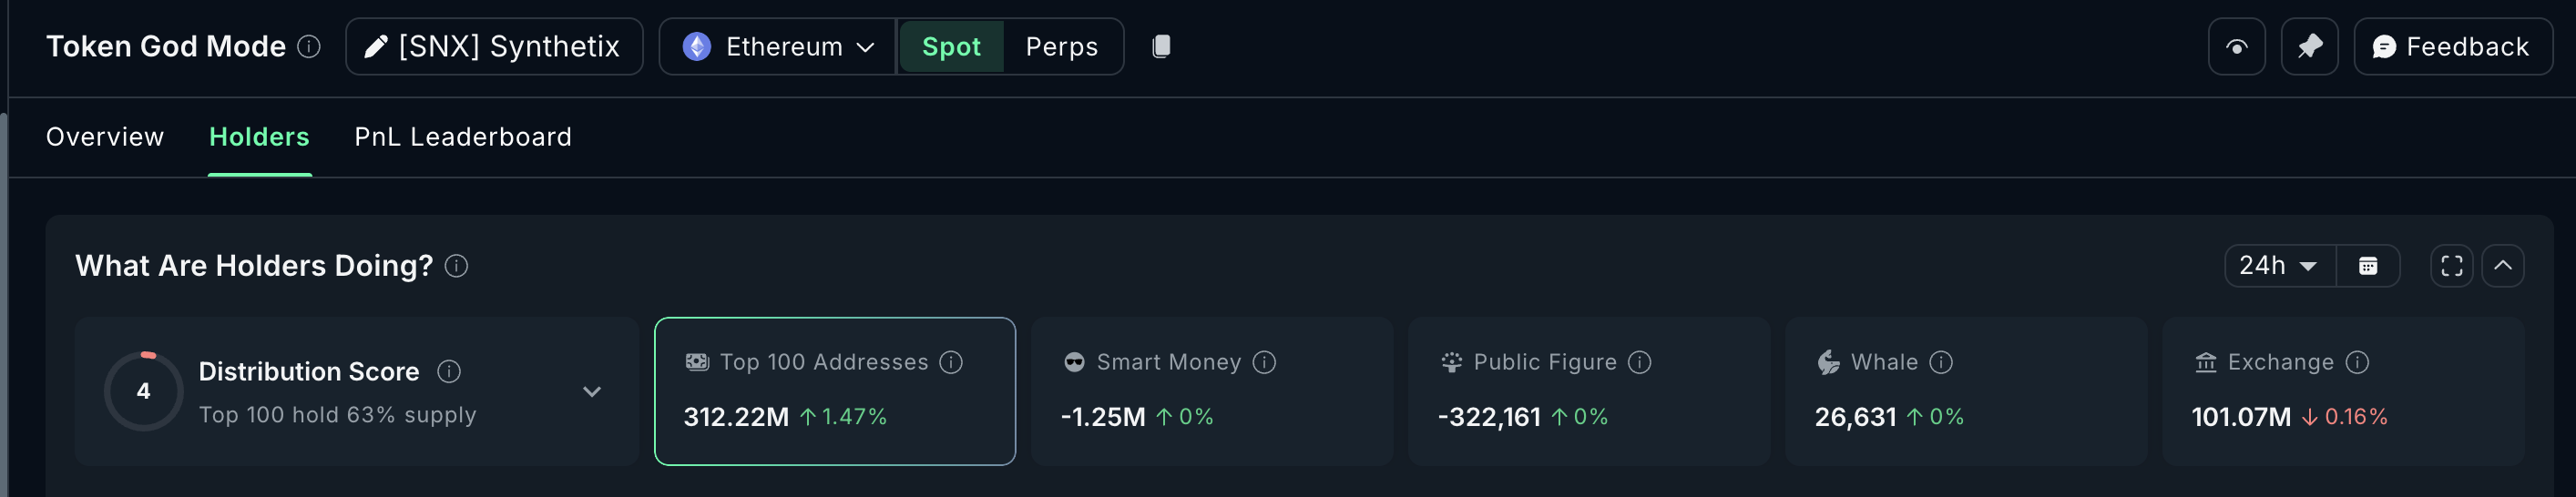
Crypto whales are buying Synthetix (SNX), but a deeper look shows it is mainly mega whales leading the move. This shift comes after the Supreme Court’s Trump tariff ban improved risk appetite. When macro uncertainty drops, large investors often rotate into higher-beta DeFi tokens that can rise faster.
Synthetix fits this profile because it powers synthetic assets, which tend to attract activity when traders expect stronger market momentum.
The data confirms this selective accumulation. The top 100 addresses increased their holdings by 1.47%, bringing their total stash to 312.22 million SNX.
Want more token insights like this? Sign up for Editor Harsh Notariya’s Daily Crypto Newsletter here.
That means they added roughly 4.52 million SNX in the past 24 hours. At the current price, this equals about $1.83 million worth of SNX accumulated. This is important because mega whales are buying during strength, not weakness. This usually signals positioning for continuation, not just dip buying.
The chart explains why.
SNX appears to be forming a cup and handle pattern, which is a bullish continuation structure. This pattern starts with a rounded recovery, followed by a smaller pullback called the handle. The handle might soon be forming, which means consolidation may happen before the next move.
The key breakout level sits at $0.42. If SNX breaks and shows acceptance above this level, the pattern projection suggests a possible 72% rally toward $0.73.
This potential explains why mega whales are positioning early. They are likely willing to sit through consolidation, while smaller whales hesitate.
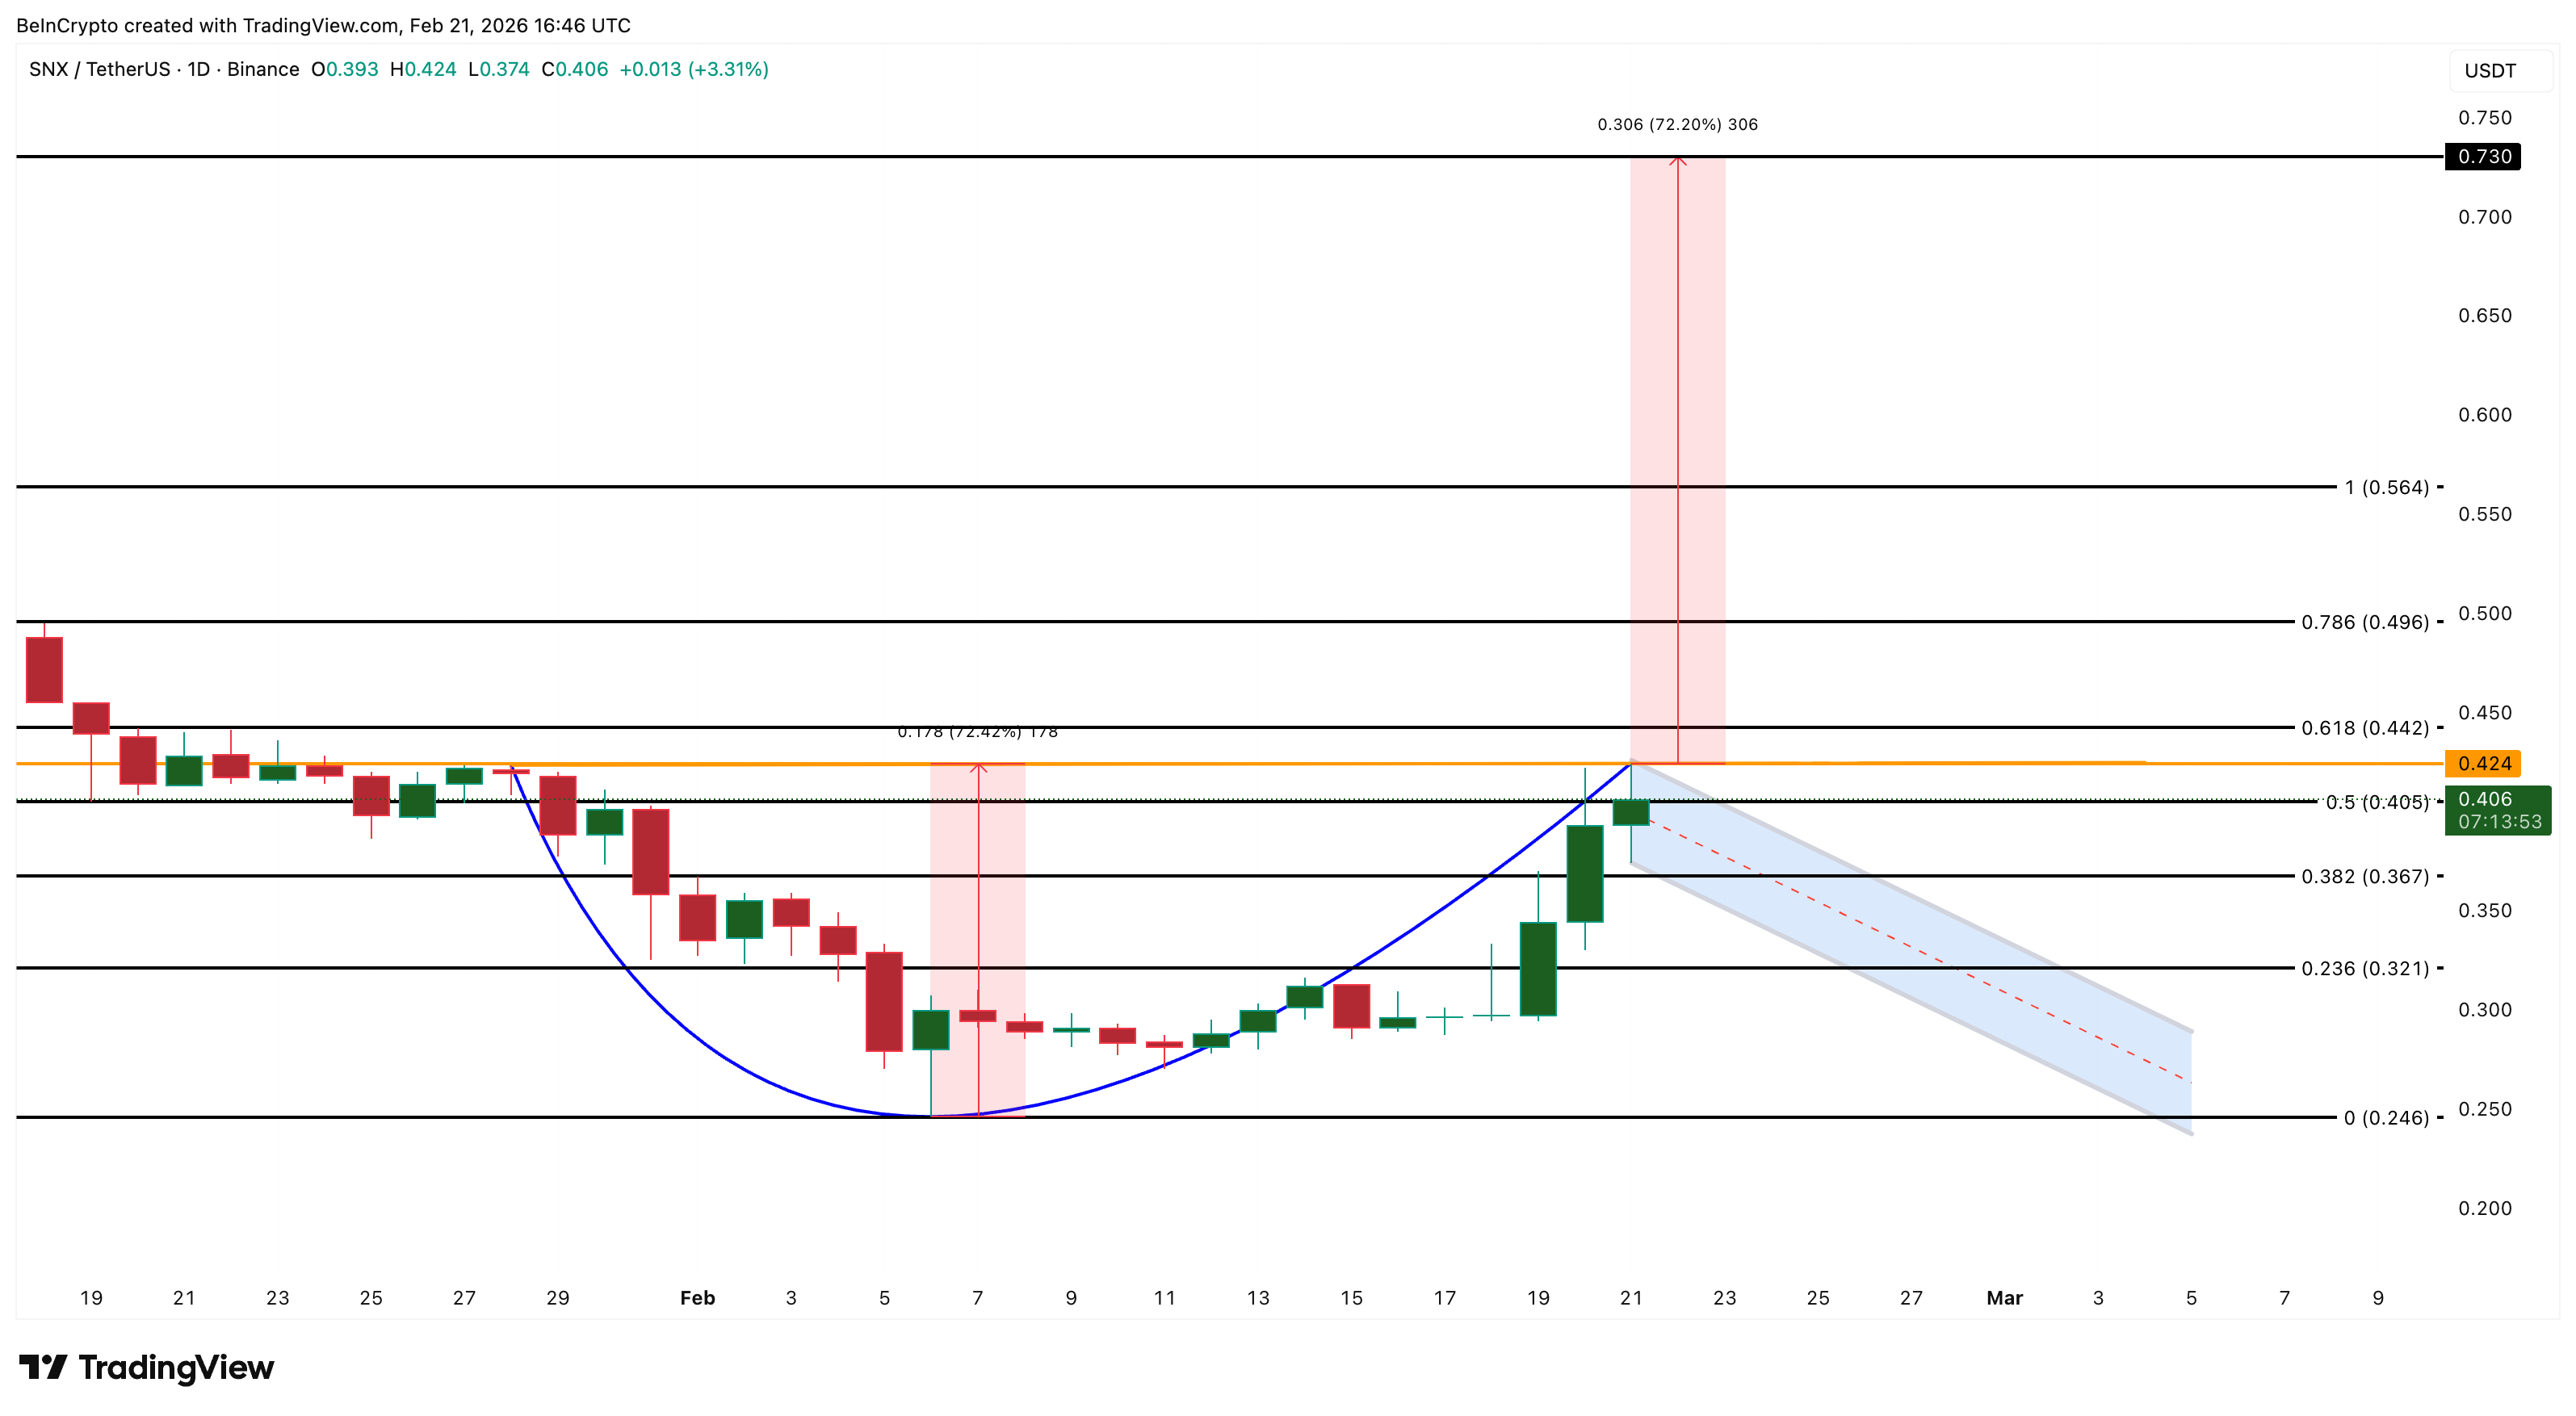
On the downside, $0.36 and $0.32 are important support levels during consolidation. These levels allow the handle to form normally. However, a drop below $0.24 would invalidate the bullish pattern completely.
Onyxcoin (XCN)
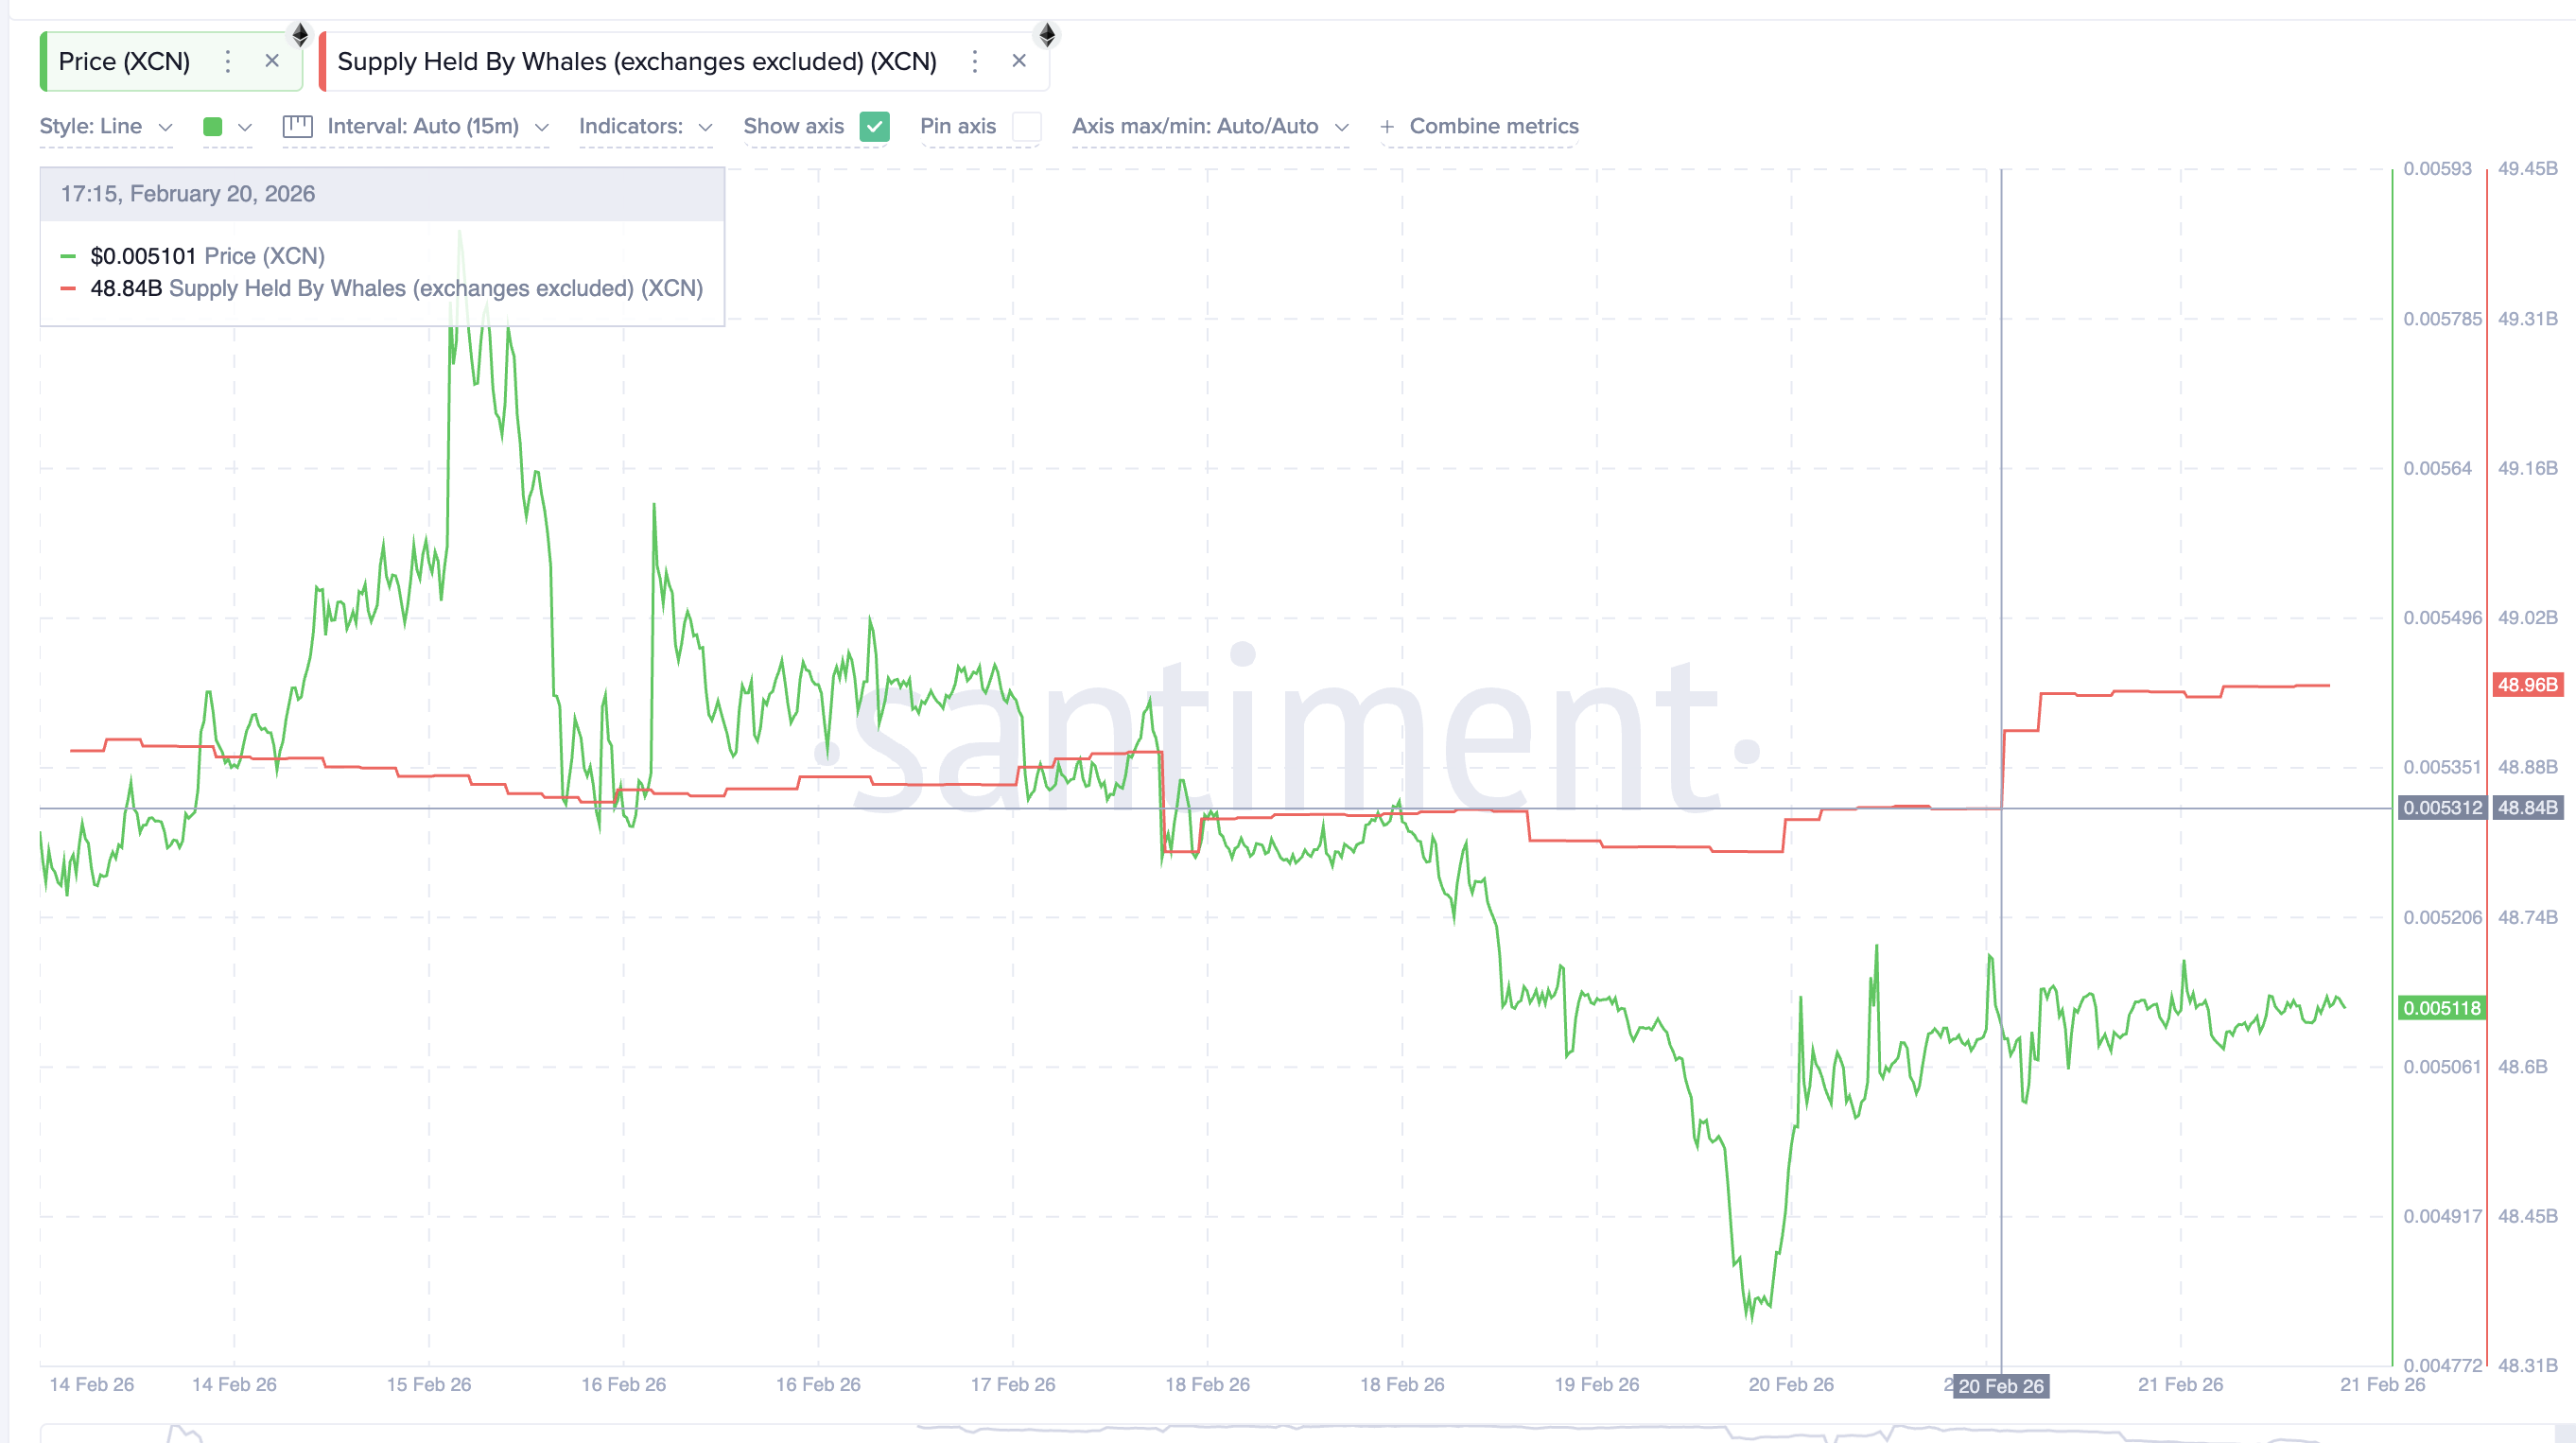
Onyxcoin (XCN) is the third token where crypto whales have quietly increased exposure after the Supreme Court’s Trump tariff ban. Whale holdings rose from 48.84 billion to 48.96 billion XCN, adding 120 million tokens in one day. At the current price, this amounts to roughly $612,000 in XCN accumulated.
This buying comes despite weak recent performance, suggesting whales may be positioning early for a reversal rather than reacting to strength.
One possible reason lies in Onyxcoin’s core role. The project focuses on blockchain-based financial infrastructure, including payments and settlement systems. If tariff restrictions ease and global trade improves, demand for blockchain settlement networks could rise. Whales may see XCN as a leveraged bet on that long-term macro shift.
The XCN price chart also supports this early positioning. Between November 4 and February 19, XCN formed a lower low in price, while the Relative Strength Index (RSI) formed a higher low.
RSI measures momentum. When RSI rises while price falls, it signals that selling pressure is weakening. This pattern often appears before a trend reversal. Importantly, the earlier RSI low was deep in the oversold zone, which strengthens the reversal signal.
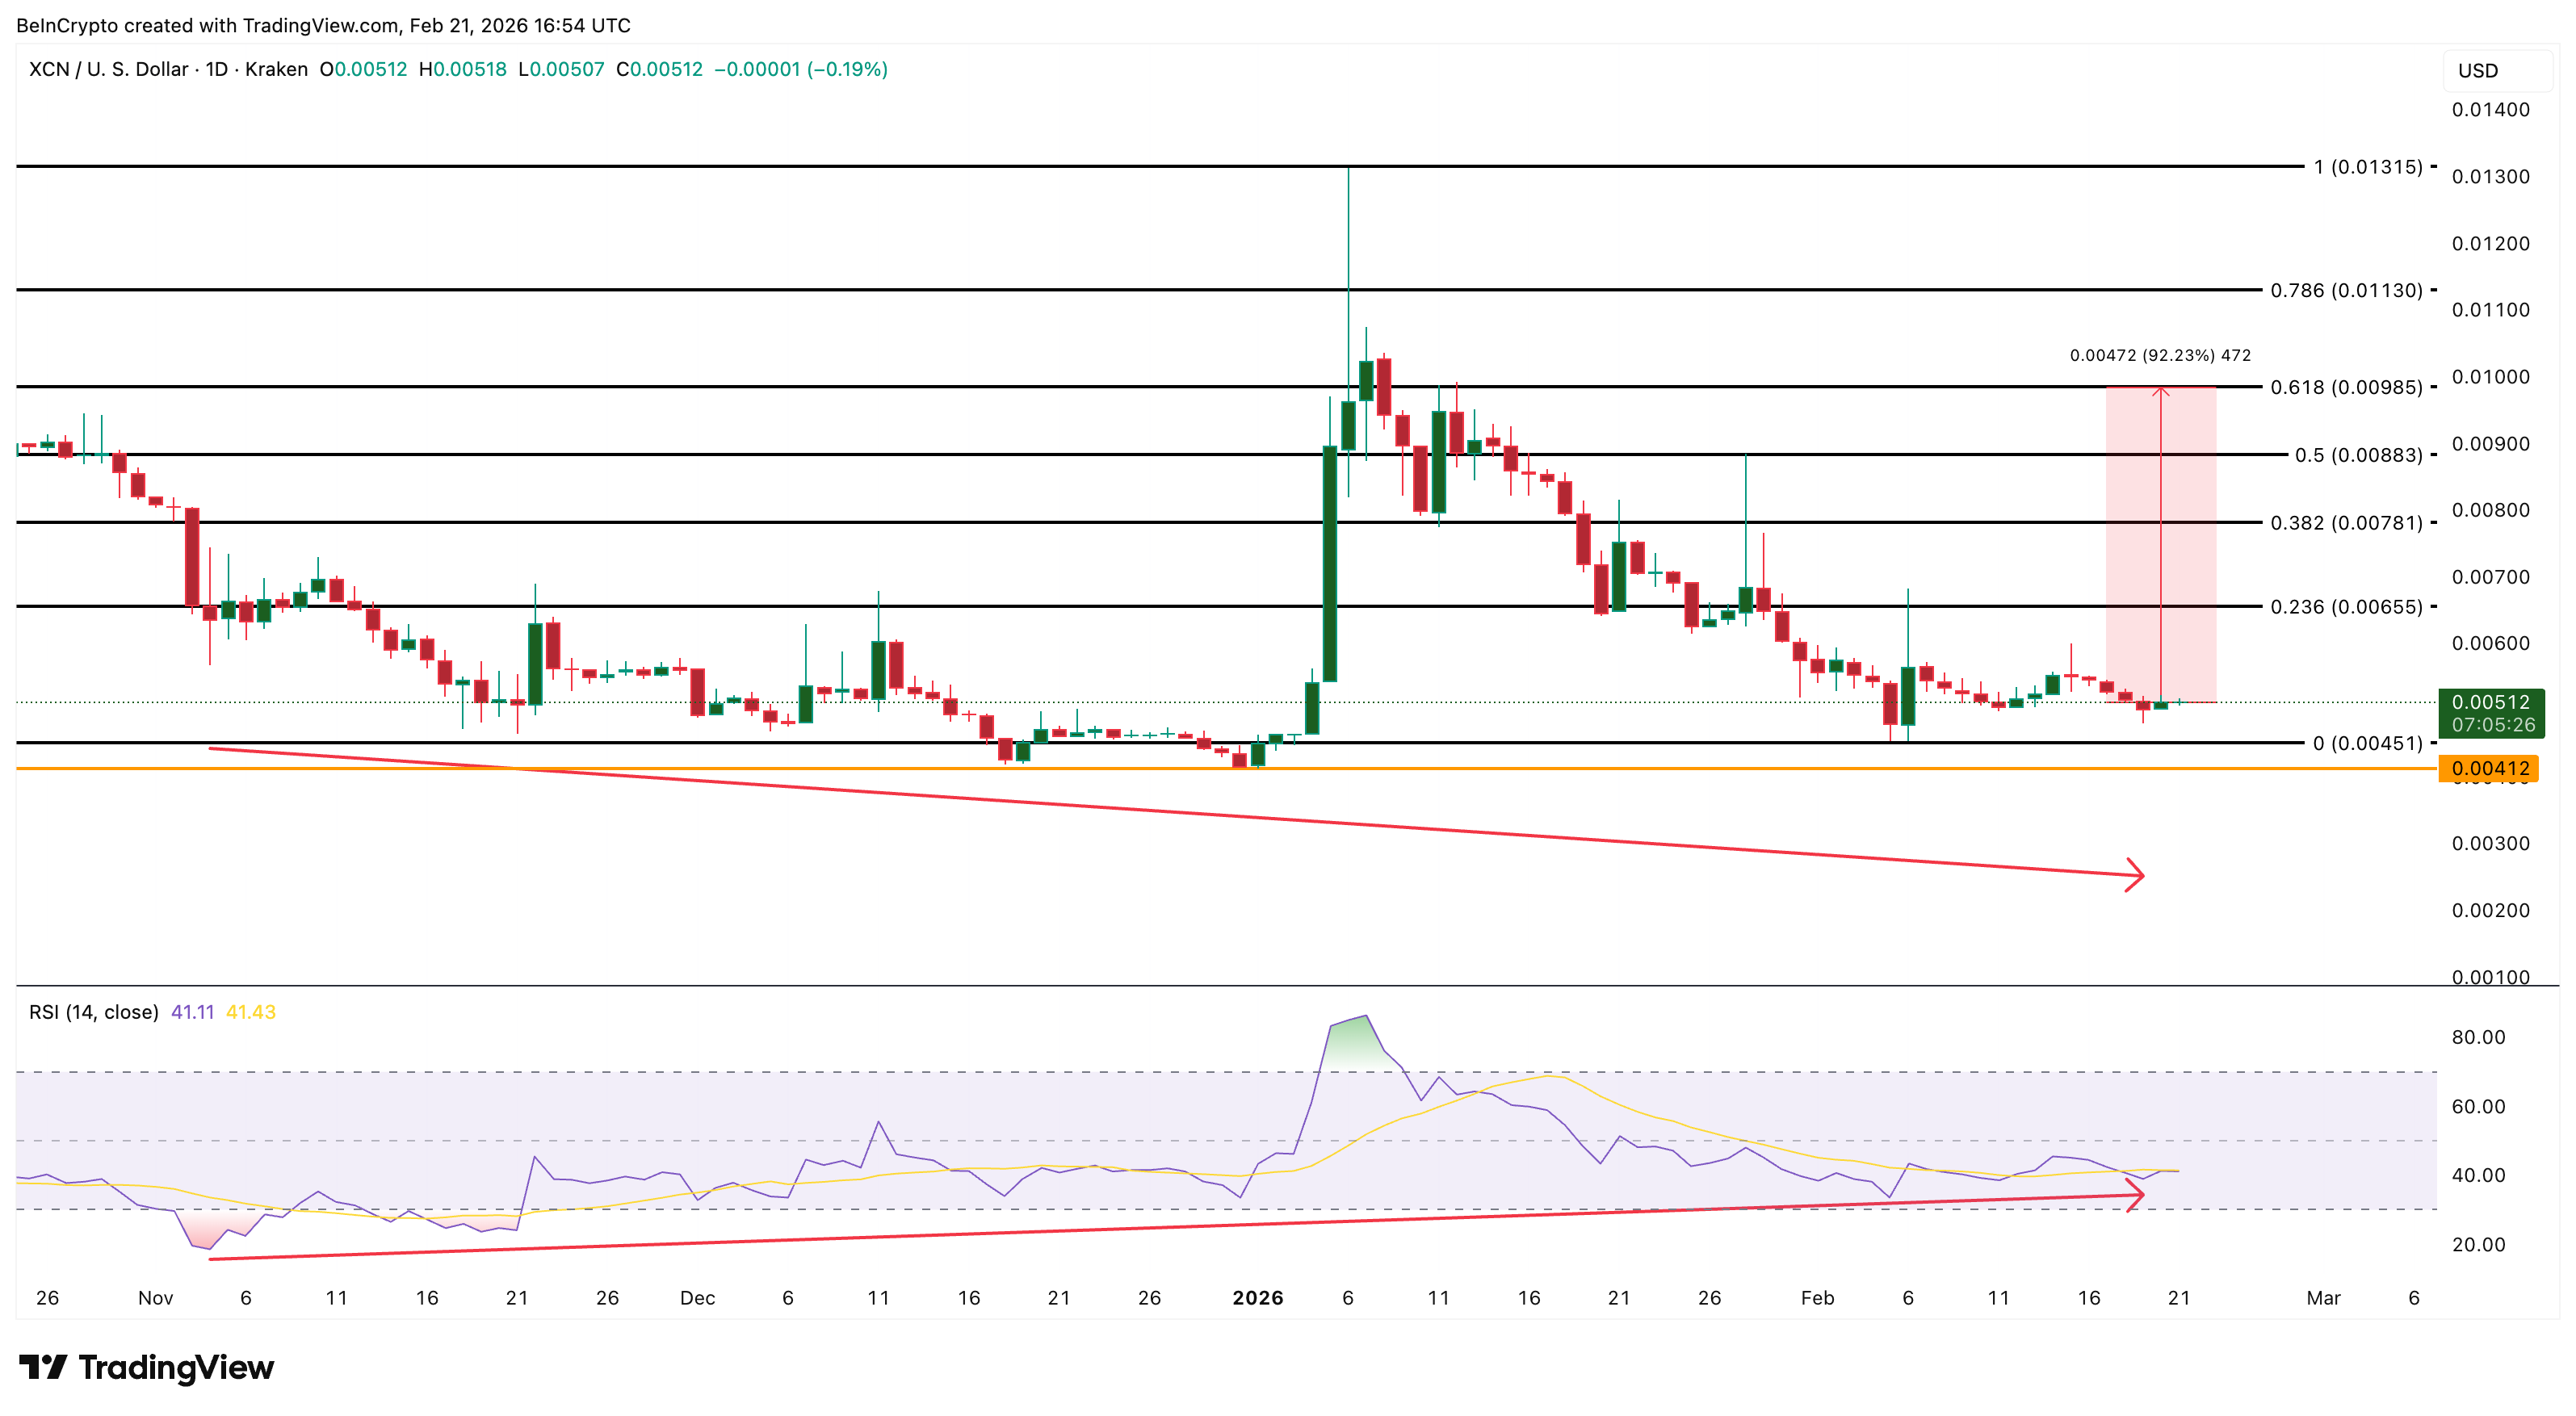
Some recovery has already started. The next key breakout level sits at $0.0065. If XCN moves above this level, it could target $0.0098, which aligns with a key Fibonacci retracement level. This would represent a potential 92% rally from current levels.
However, risks remain. If XCN falls below $0.0045, the reversal structure weakens. A deeper drop toward $0.0041 could follow.

Bitcoin’s monthly performance pattern has become a focal point for investors trying to gauge the near-term trajectory of the market. An economist’s simple metric — counting how many months within a rolling two-year window produced gains — has sparked renewed debate about the odds of higher prices in the months ahead. The analysis comes as BTC has pulled back from peaks earlier in the year and as traders weigh a mix of seasonal tendencies, on-chain signals, and sentiment indicators that oscillate between caution and the prospect of a rebound. In 2025, BTC showed gains in six of the 12 months, a backdrop that shapes expectations for a market that remains highly sensitive to macro developments and liquidity conditions.
Key takeaways
- Bitcoin’s (CRYPTO: BTC) longer-run pattern shows that 50% of the last 24 months included positive monthly performance, a signal cited by economist Timothy Peterson to suggest a high probability of higher prices within the near term.
- Peterson’s method implies an approximately 88% chance that BTC will be higher 10 months from the reference point, highlighting how simple month-count metrics can inform timing debates in a volatile market.
- Polymarket currently assigns a 17% probability to December becoming Bitcoin’s best month of 2026, narrowly trailing November’s 18% odds.
- November remains historically strong for BTC, with CoinGlass data showing it as the best performing month on average since 2013, delivering substantial gains on many occasions.
- BTC was trading near $68,173 at the time of reporting, about a quarter below its level at the start of the year, underscoring the scale of retracement and the potential for a range-bound setup into year-end.
- Market sentiment appears mixed: the Crypto Fear & Greed Index signaled “Extreme Fear,” while sentiment analytics firm Santiment noted a cooling of price-predictive chatter, signaling a move toward neutral territory.
Tickers mentioned: $BTC
Market context: The data-driven debate unfolds as traders balance seasonal tendencies with a backdrop of cautious risk appetite. While one set of metrics points to upside potential, broader sentiment and liquidity considerations continue to weigh on positioning, making near-term moves more data-dependent than traditional catalysts alone.
Why it matters
The discussion around BTC’s month-to-month cadence matters because it reframes how investors think about timing in a market known for abrupt shifts. If the 24-month positive-month metric holds, the odds of a continuation of higher prices could tilt decisions toward positioning strategies that benefit from gradual upside rather than sharp, binary breakouts. The nuance matters for miners, traders, and institutions alike, because it suggests a probabilistic framework rather than a single price target. It also highlights how macro factors — such as liquidity cycles, macro risk sentiment, and regulatory signals — interact with seasonality to shape price expectations in a market where many participants rely on models that blend on-chain signals with traditional indicators.
The split among analysts adds texture to the risk assessment. Some optimists, like Michael van de Poppe, have cautioned that the near term could see a green week for BTC, pointing to potential candles that could buttress a broader rebound after a stretch of red months. Others, including veteran traders, have warned that a definitive bottom may not come quickly and suggested that a deeper or more drawn-out phase of weakness could precede a real recovery. In this tug-of-war, investors are watching not only price action but also how social sentiment evolves and whether institutional demand returns as volatility moderates.
Beyond Bitcoin’s price action, the narrative is influenced by how the market interprets data points from data providers and prediction markets. For instance, the December outlook on Polymarket reflects a probabilistic expectation rather than a verdict, with traders pricing in a non-trivial chance that the final month of the year outperforms others in 2026. Meanwhile, the long-run tail risk — often discussed in the context of macro liquidity and regulatory clarity — remains a factor that can alter the pace and composition of investor inflows or withdrawals. The interplay between these signals is what keeps BTC in a dynamic, data-driven environment rather than a static price path.
On-chain measurements and sentiment trackers add further texture. The Fear & Greed Index, a gauge of overall market mood, landed in a rare phase of extreme caution, underscoring the risk-off leaning prevailing in many corners of the crypto space. Yet, sentiment analytics outfit Santiment has noted a trend toward a more neutral stance as the crowd reduces speculative chatter around price predictions. This combination — cautious macro mood with subdued but stabilizing on-chain signals — helps explain why the market is watching for confirmatory catalysts that could turn pessimism into a more constructive price trajectory.
As traders parse these competing signals, the price backdrop remains a real-time constraint. BTC hovered around $68,173 at the time of publication, a level that sits noticeably below the year’s start and well under the all-time highs seen in late 2023 and early 2024. The current chapter is not about a single event but about a mosaic of indicators that could tip the balance toward a steadier ascent or a renewed period of consolidation. The breadth of opinions among seasoned traders reflects the broader reality: in a market as data-rich and narrative-driven as crypto, many of the strongest moves are born from a confluence of timing, sentiment, and macro liquidity rather than from any one signal alone.
In sum, the BTC narrative remains a study in contrasts — data points suggesting upside probability allied with cautionary sentiment and a price backdrop that invites patience. The coming weeks and months will test whether the 88% horizon implied by Peterson’s monthly-count framework materializes, or whether outcomes align more closely with the more conservative, risk-off mood reflected in short-term volatility measures. For market participants, the takeaway is to blend probabilistic thinking with disciplined risk management, rather than rely on a single data point to forecast the next leg of Bitcoin’s journey.
https://platform.twitter.com/widgets.js
What to watch next
- December’s outcome for BTC’s performance on Polymarket’s “best month in 2026” event (current odds: 17%), and whether November’s 18% edge holds.
- BTC’s price trajectory toward or away from the $70,000 level and how it interacts with the 10-month horizon referenced in Peterson’s metric.
- The evolution of market sentiment indicators, including the Fear & Greed Index and Santiment’s readings on sentiment normalization.
- On-chain activity and liquidity signals that could accompany a sustained price move, especially as macro factors influence risk appetite.
Sources & verification
- Timothy Peterson’s X post citing the 50% positive-month metric and the ~88% odds window: https://x.com/nsquaredvalue/status/2025275842394251560?s=20
- CoinGlass data on BTC’s 2025 monthly performance: https://www.coinglass.com/today
- Polymarket event page for “Bitcoin best month in 2026”: https://polymarket.com/event/bitcoin-best-month-in-2026
- Bitcoin price reference as of publication on CoinMarketCap: https://coinmarketcap.com/currencies/bitcoin/
- Crypto Fear & Greed Index for market sentiment: https://alternative.me/crypto/fear-and-greed-index/
Market reaction and key details
Bitcoin (CRYPTO: BTC) has traded within a data-rich framework that blends seasonal expectations with a skeptical sentiment backdrop. The 50% positive-month metric over the preceding 24 months, highlighted by Peterson in his X post, is not a price forecast but a probability-driven lens that can inform timing considerations. The implication that BTC has roughly an 88% chance of being higher in ten months is based on counting the number of positive months; such a metric is best viewed as one among many tools, not a standalone predictor. It underscores how revenue-focused and risk-managed investors may frame potential upside in a market known for abrupt swings.
Traders on prediction platforms see a nuanced picture for December. Polymarket’s pricing places a 17% probability on December becoming BTC’s best month of 2026, a signal that the market assigns to rare, outsized upside relative to other months, though still modest in absolute terms. November remains a benchmark; history shows it as the strongest calendar month for BTC on average since 2013, often delivering outsized gains. This historical context helps frame the December odds as part of a longer cycle rather than a stand-alone bet. The juxtaposition of seasonality against structural market fragility is why many market participants approach the next few weeks with hedged expectations.
From a price perspective, BTC hovered around $68,173 at press time, a level that sits well below the early-year peak and marks a sharp retracement from February’s ~$80,000 starting point. The pullback doesn’t negate the strategic value of the month-to-month dynamism; instead, it highlights the need for patience and disciplined risk controls as the market tests whether a base forms or if buyers should wait for a clearer signal. In this environment, the interplay between seasonal patterns and sentiment becomes particularly meaningful: a favorable November-to-December transition could set the stage for a more sustained move, but a reiteration of caution could prolong a period of consolidation as liquidity conditions remain sensitive to global macro developments.
Analysts remain divided on the near-term path. While some traders anticipate a green week for BTC and a potential extension of gains, others project further downside before a genuine bottom takes hold. The divergent views reflect a broader truth about crypto markets: price action is increasingly influenced by a combination of on-chain signals, probabilistic forecasting, and evolving investor psychology. The result is a market that rewards prudent risk management and flexible positioning, rather than single-factor bets. As the narrative evolves, investors will be watching not only price levels but also how sentiment metrics shift and whether predicted outcomes in prediction markets begin to align with actual market moves.
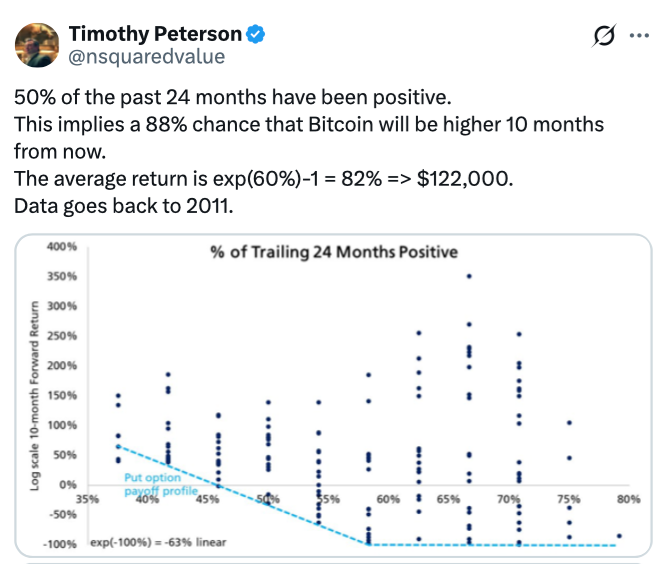
Half of the months over the past two years have delivered positive returns for Bitcoin, which may be a strong sign that it will be higher than its current price in December, an economist said.
“50% of the past 24 months have been positive. This implies a 88% chance that Bitcoin will be higher 10 months from now,” economist Timothy Peterson said in an X post on Saturday. In 2025, Bitcoin posted gains in January, April, May, June, July, and September, while the other six months ended lower, according to CoinGlass.
Peterson explained that he uses the metric to count the number of positive months in any 24-month period to identify possible inflection points.

Traders on crypto prediction platform Polymarket are giving December a 17% chance of being Bitcoin’s (BTC) best month of 2026, just behind November at 18%.
Historically, November has been Bitcoin’s strongest-performing month on average since 2013, with an average return of 41.13%, according to CoinGlass.
Peterson’s forecast comes as Bitcoin’s price trades almost 25% below its level at the beginning of this year, at $68,173 at the time of publication, according to CoinMarketCap.

Analysts are divided on how the asset will perform in the near future. MN Trading Capital founder Michael van de Poppe said on Friday, “I would expect next week to be green for BTC.” “Finalizing this month with a massive candle and a streak of five red months,” he said.
Meanwhile, other analysts see more downside ahead. Veteran trader Peter Brand recently told Magazine that Bitcoin’s “real bottom will not occur until October 2026.”
Related: Crypto market retraces almost all 2024-2025 US election pump gains
Peterson’s forecast comes as crypto market sentiment continues to decline. The Crypto Fear & Greed Index, which measures overall crypto market sentiment, posted an “Extreme Fear” score of 9 on Sunday, signaling extreme caution among investors.
However, crypto sentiment platform Santiment said on Friday that the “drying up” of Bitcoin price predictions on social media among crypto market participants is a healthy indicator as sentiment returns to “neutral” territory.
Magazine: 6 massive challenges Bitcoin faces on the road to quantum security

Crypto markets have wiped out roughly $1 trillion in value over the past month, underscoring a broad risk-off mood that has weighed on spot prices. Yet not all corners of the industry are moving in lockstep with price drops. Infrastructure plays, venture activity focused on on-chain finance, and the tokenization of real-world assets (RWAs) are signaling a different rhythm, with capital continuing to flow into areas believed to bolster liquidity and revenue-generating capabilities. In this week’s overview, Nakamoto’s $107 million push to acquire BTC Inc and UTXO Management highlights consolidation at the intersection of media, events, and asset advisory services. Separately, Dragonfly Capital’s $650 million fund signals ongoing institutional interest in on-chain rails, while tokenized RWAs persist as a buoyant sub-sector even as broader markets stall. At the same time, Paradigm is emphasizing a potentially pivotal yet debated role for Bitcoin mining in stabilizing energy grids as AI demand for power climbs. Bitcoin (CRYPTO: BTC) (the technology’s flagship token) remains a focal point for investors eyeing resilience amid volatility, and the broader ecosystem continues to explore how on-chain solutions can support traditional financial operations.
Key takeaways
- Nakamoto to acquire BTC Inc and UTXO Management in a $107 million deal, issuing 363,589,819 shares of Nakamoto common stock at a $1.12 strike under a call option structure.
- Dragonfly Capital closes its fourth fund at $650 million, reinforcing appetite for infrastructure and real-world asset-based financial products built on blockchain rails.
- Tokenized RWAs mark a contrasting trend to the broader market: the total value of tokenized RWAs rose about 13.5% in the last 30 days, while the aggregate crypto market retraced roughly $1 trillion.
- Tokenized US Treasurys, private credit, and tokenized stocks are expanding, suggesting fixed-income-style products remain a magnet for capital even during downturns.
- Paradigm argues that Bitcoin mining can serve as a flexible load on the electric grid, potentially aiding utilities as AI infrastructure expands—but the practicality hinges on contracts and energy-market economics.
Tickers mentioned: $BTC, $ETH, $ARB, $SOL
Sentiment: Neutral
Price impact: Negative. Broad market declines have outweighed pockets of institutional investment and RWA growth.
Market context: The sector is bifurcated, with price volatility contrasting against sustained interest in on-chain infrastructure, tokenized assets, and grid-services concepts as AI-driven demand reshapes energy markets.
Why it matters
The juxtaposition of a broad price downturn with continued deal flow and asset tokenization highlights a longer-term shift in crypto economics. While spot markets have faced pressure, the underlying demand for on-chain mechanisms that can replicate or enhance traditional finance—such as yield generation, asset securitization, and liquidity provisioning—appears persistent. The Nakamoto transaction exemplifies a strategy to vertically integrate media, events, and financial services around Bitcoin’s ecosystem, signaling a belief that value accrues not only from price appreciation but also from owning and coordinating the ecosystem’s narrative and services. By acquiring BTC Inc and UTXO Management, Nakamoto seeks to expand its footprint in media reach, advisory capabilities, and asset management, potentially shaping how market participants access information, analysis, and structured products related to Bitcoin and its broader ecosystem.
Meanwhile, Dragonfly’s $650 million fund underscores a continued appetite among seasoned investors for infrastructure-stage bets that can deliver revenue through on-chain rails, rather than pure token appreciation. The emphasis on financial products—payments, stablecoins, lending, and RWAs—reflects a strategic shift toward platforms that generate ongoing cash flows even when token prices are under pressure. This aligns with a broader industry pivot toward sustainable business models that can operate across cycles, providing a counterweight to the volatility inherent in token markets.
The tokenized RWA space remains a bright spot within crypto, underscoring the market’s belief that pegging traditional assets like Treasurys, private credit, and even equities to on-chain representations can lower borrowing costs, improve liquidity, and broaden accessibility. Data from RWA.xyz shows a 13.5% rise in the total value of tokenized RWAs over the past 30 days, a period when the wider market saw a substantial decline. This divergence suggests that investors are differentiating between immediate price action and the longer-term utility of tokenized fixed-income and collateralized assets. If realized, such dynamics could help stabilize portions of the crypto economy by providing yield anchors and more predictable cash flows, even as risk sentiment remains fragile.
Paradigm’s view on Bitcoin mining as a grid-stabilizing asset adds another layer to the conversation. The firm contends that miners can act as flexible capacity—scaling up during periods of excess generation and scaling down when demand tightens—thereby smoothing fluctuations in electricity markets. The concept is attractive in a moment when AI data centers are driving electricity demand higher, potentially straining local grids. However, turning this into scalable, contractually reliable grid support hinges on the economics of energy markets, regulatory frameworks, and the terms miners can secure with grid operators. Critics point to variability in energy pricing, the need for long-term power purchase agreements, and the challenge of coordinating multiple players across a fragmented grid landscape. Yet the idea continues to gain traction as utilities, policymakers, and investors explore pragmatic ways to monetize energy resources through decentralized blockchain infrastructure. As with all these use cases, the actual impact will depend on regulatory clarity, energy markets, and the ability of on-chain participants to demonstrate measurable reliability.
What to watch next
- Closing details and execution timeline of Nakamoto’s acquisition of BTC Inc and UTXO Management, including any regulatory approvals.
- Dragonfly Capital’s fund deployment plans, with a focus on real-world asset tokenization and on-chain financial products.
- Updates from RWA.xyz on tokenized asset value flows, especially around tokenized Treasurys, private credit, and tokenized stocks.
- Progress and practical implementation of Paradigm’s grid-stabilization thesis, including utility partnerships, contracts, and regional deployments.
Sources & verification
- Nakamoto’s announced acquisition of BTC Inc and UTXO Management and the terms of the deal, as reported in primary communications.
- Dragonfly Capital’s fund-raising announcement and alignment with on-chain infrastructure and RWAs.
- RWA.xyz data on the 30-day change in tokenized RWAs value and the broader comparison to the crypto market rout.
- Paradigm’s report advocating Bitcoin mining as a flexible grid load and its accompanying analysis of grid economics and energy demand.
Tokenized asset momentum amid a crypto market rout
In the broader narrative, the market is quiet on the price front, while the engine behind tokenized assets continues to hum. The first major narrative is Nakamoto’s strategic expansion into the Bitcoin ecosystem. By consolidating BTC Inc and UTXO Management under a single umbrella, Nakamoto is positioning itself to control more of the information, expertise, and advisory services surrounding Bitcoin’s commercial and financial utilities. This move could influence how media, events, and asset management are integrated—an important consideration for institutions seeking coherent exposure to Bitcoin and its ancillary services. The transaction structure, which assigns shares to BTC Inc and UTXO investors at an elevated strike price, also signals a willingness to pay a premium for control over talent, brand, and distribution channels in a market that remains highly fragmented at the corporate level.
On the venture side, Dragonfly’s continued commitment to on-chain financial infrastructure speaks to a belief that the real economy will increasingly transact through tokenized rails. The fund’s focus on real-world assets and fixed-incomelike products aligns with a broader industry trend toward sustainability and revenue-generating models. In practical terms, this could translate into more accessible yield products, more robust tokenized securitization, and greater liquidity for traditional assets via blockchain representations. As capital flows into this space, the potential for broader adoption grows, even if token prices for major coins remain under pressure in the near term.
Tokenized RWAs have become a barometer for how the crypto economy is maturing beyond speculative trading. The 13.5% uptick in tokenized RWA value over the last 30 days—outpacing a market that shed roughly $1 trillion—illustrates a degree of resilience in fixed-income-like digital assets. Much of this growth has centered on tokenized U.S. Treasurys and private credit products, with tokenized equities gaining traction as well. The trend suggests that investors are willing to diversify into on-chain yield strategies, which could help stabilize liquidity in networks that have historically leaned on speculative activity for value creation. If sustained, tokenized RWAs could broaden the base of crypto-native investors and institutions seeking predictable cash flows rather than purely price appreciation.
The narrative around Bitcoin mining’s grid role remains nuanced. Paradigm’s proposition hinges on practical contracts with grid operators and the economics of energy markets rather than a purely technical capability. If validated, miners could become a strategic adjunct to traditional grid resources, reducing the need for abrupt capacity curtailments and enabling a more adaptive energy network in the face of AI-driven demand surges. Yet scaling such a model will require collaboration across utilities, regulators, and energy providers to ensure reliability and financial viability. The coming quarters should reveal whether pilots materialize into scalable programs with measurable environmental and economic benefits.
What it means for investors and builders
For investors, the bifurcation between price action and value formation suggests a nuanced approach to risk. A diversified strategy that weighs tokenized RWAs and on-chain infrastructure alongside core crypto assets could offer a more resilient footprint. Builders working on tokenized finance, regulatory-compliant asset representations, and grid-friendly mining solutions may find favorable tailwinds if these structural trends persist. Regulators will also play a crucial role, particularly around securities classifications for RWAs and the permitting framework for large-scale grid participation by miners.
What to watch next
- Regulatory developments affecting tokenized asset classes and exchange-traded representations in major markets.
- Deployment milestones for tokenized U.S. Treasurys and private credit products, including on-chain yield benchmarks.
- Operational pilots or partnerships linking Bitcoin mining operations with grid stability initiatives.
- Further announcements from Nakamoto regarding integration of media, events, and asset-management services within Bitcoin-focused ecosystems.
https://abs.twimg.com/responsive-web/client-web/twitter-widget.js
OSI Systems (OSIS) stock saw a welcome improvement to its Relative Strength (RS) Rating on Friday, with an increase from 78 to 83. Hone Your Stock-Picking Skills By Focusing On These Factors IBD’s unique rating tracks market leadership with a 1 (worst) to 99 (best) score. The grade shows how a stock’s price behavior over the trailing 52 weeks…
The crypto market has pulled back after the aggressive rally that followed the 2024 U.S. elections, trimming a sizable portion of gains from late 2024. The Total3 Market Cap, which excludes ETH and BTC, surged more than 90% in the immediate wake of the election, topping $1.16 trillion by December 2024. By contrast, the level just before the pump hovered around $600 billion. After a volatile stretch into early 2025, the aggregate measure hovered in the $700–$750 billion zone and remained at roughly $713 billion at the time of publication. Bitcoin and Ethereum likewise retraced most gains, with BTC dipping toward $60,000 and ETH retreating from its all-time high near $5,000 during the August 2025 cycle.
Key takeaways
- The Total3 Market Cap peaked at about $1.16 trillion in December 2024, then settled near $713 billion, signaling a broad, incomplete recovery from the late-2024 surge.
- Bitcoin (CRYPTO: BTC) retraced more than half of its peak-to-trough move, bottoming near $60,000 before a modest bounce to the high $60,000s.
- Ether (CRYPTO: ETH) dropped roughly 60% from its August 2025 high of close to $5,000, leaving prices around the low $2,000s.
- Market sentiment sits at multi-year lows, with the Fear and Greed Index registering extreme fear (14) and, at times, dropping to record lows in early 2026.
- After a fleeting October 2025 peak near $1.19 trillion, the market faced a disruptive correction that challenged the sustainability of the prior up move.
Tickers mentioned: $BTC, $ETH
Sentiment: Bearish
Price impact: Negative. Broad market liquidity and flagship assets retreated from recent highs, underscoring caution among investors.
Trading idea (Not Financial Advice): Hold. The market appears rangebound with limited catalysts for a decisive breakout in the near term, suggesting patience over chasing momentum.
Market context: The recent price action unfolds amid a broader reevaluation of risk appetite, macro uncertainty, and shifting policy signals that influence crypto flows, including ETF dynamics and regulatory expectations.
Why it matters
The retreat from the late-2024 rally matters for a broad set of market participants. Investors who chased the cycle now confront a more cautious environment where liquidity is thinner and conviction is tested by macro headlines and policy signals. Miners, who historically respond to both price and energy costs, may adjust capital expenditure and mine-sourcing strategies as profitability metrics tighten. Developers and ecosystem builders could face tighter funding cycles if risk sentiment remains fragile, potentially slowing launches and network upgrades. On the regulatory front, the trajectory of ETF approvals and inflows continues to influence institutional exposure, and traders will watch any policy clarity that could unlock or cap new capital inflows.
From a price-structure perspective, the contrast between the Total3 Market Cap’s bounce and the more persistent weakness in flagship assets underscores a nuanced market dynamic: capital is chasing selective exposure, while a broad-based risk-off mood persists. The October 2025 peak near $1.19 trillion followed by a sharp correction demonstrated that even after a multi-quarter expansion, the crypto market remains highly sensitive to sentiment shifts and macro shocks. The narrative around ESG concerns, energy costs, and geopolitical tensions has not vanished; rather, it has been reframed within a sector that still depends on liquidity cycles and narrative-driven flows.
For traders and researchers, the data points—BTC and ETH price trajectories, fear/greed signals, and the total market’s relative strength or weakness—offer a lens into how much of the 2024–2025 exuberance was constructive long-term adoption versus a cyclical liquidity-driven impulse. The persistence of a sub-70% rebound in the Total3 Market Cap, along with the subdued sentiment, suggests that this is less a moment of breakout and more a phase of consolidation and reassessment.
What to watch next
- Total3 Market Cap: Monitor whether liquidity returns and if the metric can establish a sustained floor above $700 billion or test a new resistance above $750 billion in the coming months.
- Bitcoin price action: Look for stabilization above $60,000 and evidence of renewed strength toward prior highs, which would signal renewed buyer conviction.
- Ethereum price path: Track whether ETH can reclaim the $2,000 level decisively and approach the $2,500–$3,000 zone as demand for smart-contracts and DeFi ramps up.
- Market sentiment: Watch the Fear and Greed Index for improvements from extreme fear, which could precede broader price rebounds if macro conditions improve.
- Regulatory and product flows: Stay alert for any concrete ETF approvals, filings, or inflows that could catalyze fresh capital and shift risk appetite.
Sources & verification
- Total3 Market Cap history showing the peak near $1.16 trillion in December 2024 and a later level around $713 billion.
- Bitcoin price action data reflecting a move toward $60,000 and a bounce to the high $60,000s.
- Ethereum price trajectory from a peak near $5,000 in August 2025 to the current range around $2,000.
- Fear and Greed Index readings around 14, indicating extreme fear, and the record-low level observed in early 2026.
- Visuals and charts from TradingView illustrating Total3 and major asset movements.
Market reaction and the current state of the crypto market
Bitcoin (CRYPTO: BTC) and Ethereum (CRYPTO: ETH) have underlined a broader market reality: the 2024–2025 rally did not translate into an uninterrupted, self-sustaining uptrend. After the US election-driven surge, the market’s trajectory mutated into a more cautious pattern, with the Total3 Market Cap retreating from its late-2024 peak and hovering in the low-to-mid trillions for much of 2025 before slipping again. The October 2025 high near $1.19 trillion illustrated that demand existed—enough to push the aggregate higher—but the subsequent collapse reminded traders that liquidity, momentum, and macro confidence are integral to sustaining a long-term breakout.
In the wake of the drawdown, BTC has registered a classic risk-off response: a steep correction from the prior highs, a dip toward the $60,000 mark, and a tentative recovery that stops short of confirming a durable bottom. ETH has followed a similar path, with the asset’s decline reflecting both the overall market cooling and evolving demand for decentralized finance and smart-contract activity. These price actions are not merely a function of a single catalyst; they reflect a confluence of sentiment erosion, shifting macro cues, and the dynamic behavior of crypto-capital allocation.
What makes the current moment distinct is the interplay between a still-active long-run narrative—ledger transparency, programmable money, and cross-border settlement use cases—and the short-term realities of liquidity and risk appetite. The Fear and Greed Index, which had surfaced repeatedly as a contrarian signal during prior cycles, has sat in “extreme fear” territory for an extended period. This dynamic often corresponds with periods of price consolidation or continued volatility, as investors weigh whether macro tailwinds or policy shifts will re-ignite speculative demand. The market’s tone remains cautious, even as certain on-chain metrics suggest that real user activity and long-term investor participation have not vanished.
From a broader market-context standpoint, the present environment underscores why sector watchers emphasize patience and disciplined risk management. The prior cycle’s exuberance is not guaranteed to recur in a straight line, and the path toward a new cycle could hinge on a combination of macro stabilization, clearer regulatory clarity, and the emergence of product structures that can sustain institutional interest. As traders parse every headline and data release, the core takeaway remains: the crypto market, while larger and more mature than in early cycles, is still evolving toward a point where sustained fundamentals—rather than episodic euphoria—drive longer-term value.


“In a space that is just completely flooded with bulls**t and with fakers and self-promoters, I think that has actually been a superpower.”
Crypto venture capital firm Dragonfly Capital has closed its fourth fund at $650 million.
The fund comes as the broader cryptocurrency market faces a severe downturn, with token prices declining and investor enthusiasm weakened.
$650 Million Fund
Dragonfly’s previous fund, its third, deployed $500 million into startups such as Polymarket, Rain, and Ethena. The new $650 million vehicle aims to continue that trajectory and will provide capital for the firm to pursue early-stage investments at a time when the crypto venture sector is experiencing a slowdown as deal activity declines and firms face challenges in raising additional capital from investors, according to Fortune.
Speaking about the latest development, co-founder Haseeb Qureshi commented,
“We talk out loud and we say what we think. In a space that is just completely flooded with bulls**t and with fakers and self-promoters, I think that has actually been a superpower.”
The firm’s investments have included Layer 1 blockchain projects such as Avalanche, financial services firms like Amber Group, and other crypto projects. Besides, Dragonfly’s operations have continued through multiple market disruptions, such as the collapse of the Terra Luna ecosystem, the FTX bankruptcy, and a move away from China amid a local crypto crackdown.
Scrutiny Linked to Tornado Cash Investment
It has also faced regulatory scrutiny from the Department of Justice (DOJ). In July 2025, prosecutors informed a federal judge that they were considering criminal charges against employees of the crypto venture firm, including general partner Tom Schmidt, in relation to the 2020 investment in Tornado Cash.
The statement was made by prosecutor Nathan Rehn to District Judge Katherine Polk Failla of the Southern District of New York during a break in the trial of Tornado Cash developer Roman Storm, who was later convicted of operating an unlicensed money transmission. Dragonfly co-founder Haseeb Qureshi clarified that the firm has fully cooperated with the government investigation, which began in 2023. He had then stated that if charges are filed, they intend to defend themselves.
You may also like:
The Justice Department later backtracked, and no charges were filed against Schmidt.
SECRET PARTNERSHIP BONUS for CryptoPotato readers: Use this link to register and unlock $1,500 in exclusive BingX Exchange rewards (limited time offer).

“In a decentralized governance system, it’s unavoidable to develop politics.”
Rune Christensen explains why DAO governance becomes a struggle for resources, how the “iron law of bureaucracy” emerges, and why Sky redesigned its architecture to survive it.

Global tariff policy dominated the weekend news cycle as the United States further expanded a tariff strategy that has rattled risk assets, including crypto markets. In a late-Friday move, a 10% global tariff was announced, layered atop existing duties. On Saturday, President Donald Trump signaled an immediate increase to 15% and intensified his critique of the Supreme Court’s ruling that he believed restricted his power under the International Emergency Economic Powers Act (IEEPA). The constitutional and statutory questions remain contested, with critics arguing the scope and duration of such tariffs can be constrained by courts and Congress. Against this backdrop, traders watched how policy risk would filter through liquidity, leverage, and investor sentiment across traditional and digital markets, even as some crypto assets showed notable resilience amid the headlines.
Key takeaways
- The president raised the global tariff from 10% to 15% with immediate effect, expanding a policy stance that officials described as a corrective measure against perceived imbalances.
- The legal basis for broad tariffs remains under dispute, with proponents pointing to the Trade Expansion Act of 1962 and the Trade Act of 1974, while critics highlight limits identified by the Supreme Court and calls for congressional oversight.
- Crypto markets showed relative composure despite the tariff news: Bitcoin traded near $68,000 and Ethereum remained broadly unchanged, even as the broader market indicator Total3 slid less than 1% to around $713 billion.
- Analysts highlighted that the legal mechanism cited by the administration could constrain the duration and scope of tariffs, particularly for deficits with specific countries, a point underscored by a prominent crypto attorney.
- Historically, tariff announcements have stirred volatility in crypto and equities, but this episode illustrated a degree of resilience in the sector as policy uncertainty persisted.
Sentiment: Neutral
Price impact: Neutral. Crypto assets showed limited immediate reaction, with BTC hovering around the prior level and ETH largely stable.
Trading idea (Not Financial Advice): Hold. In the absence of a clear macro-trigger for a sustained move, maintaining existing exposure and watching policy developments is prudent.
Market context: The tariff news appeared to translate into modest shifts within the crypto complex, with BTC and ETH holding their ground while the broader market cap (as measured by TOTAL3) softened only slightly, suggesting a measured risk stance among traders amid regulatory maneuvering.
Why it matters
The episode underscores the sensitivity of crypto assets to macro and regulatory developments, even when specific policy actions are framed as targeted or temporary. While the immediate tariff step and the surrounding legal debates may appear distant from on-chain activity, macro risk sentiment often travels through asset classes in tandem. The resilience observed in major digital assets during the latest headlines points to a broader trend: liquidity and risk appetite in crypto can persist even amid policy shocks, at least in the near term.
From a policy perspective, the episode highlights the complex interplay between executive authority, judicial interpretation, and congressional checks. The administration’s reliance on IEEPA and related statutes has long been a point of contention among legal scholars and market participants alike. Crypto advocates and lawyers have argued that the scope of such powers is inherently limited and time-bound, which can mitigate longer-term distortions in markets. The discussion around duration—cited as potentially 150 days or a finite window—appears to be a critical variable for traders monitoring macro risk in the coming months.
For investors, the news reinforces the importance of differentiating policy risk from sector fundamentals. While tariffs can trigger short-lived liquidity hits, many crypto participants emphasize that network fundamentals, adoption pace, and institutional interest remain drivers of longer-term price trajectories. The incident also brings attention to the role of public commentary and official communications in shaping risk premiums, as market participants parse statements from presidents, lawmakers, and legal commentators for clues about future policy steps.
What to watch next
- Monitoring any additional tariff announcements or amendments to the policy framework, including statements from the White House and Congress.
- Watch for updates on the legal interpretation of IEEPA authority and potential judicial checks that could constrain the administration’s tariff powers.
- Track market liquidity and risk sentiment across crypto and traditional markets as traders digest policy signals and macro data releases.
- Follow commentary from legal scholars and industry attorneys about the duration and geographic scope of tariffs, and whether carve-outs or exemptions emerge.
- Observe on-chain indicators and exchange flows that may reveal subtle shifts in demand for flagship assets like Bitcoin and Ether as policy risk evolves.
Sources & verification
- Official statements and post-announcements from the Trump administration regarding the 15% tariff level and the rationale behind the move.
- Legal analysis and public commentary on IEEPA authority, including references to the Supreme Court decision that framed the scope of presidential tariff power.
- Crypto market data and price movements for Bitcoin and Ethereum around the tariff headlines, including price levels cited (BTC near $68,000; ETH broadly unchanged) and the TOTAL3 market-cap indicator around $713 billion.
- Public remarks from Adam Cochran on the limits of the tariff powers and the 150-day window for any measures under the cited statutes.
- Trade and market coverage documenting the relationship between tariff announcements and moves in crypto and traditional asset classes.
Tariff escalation tests crypto risk appetite
In a move that intensified an ongoing policy debate, President Donald Trump announced on Saturday that the 10% global tariff would be raised to 15% with immediate effect. The action extended a tariff framework that had already unsettled markets when new levies were proposed and when the courts weighed in on the administration’s authority. The president framed the increase as a legally tested step, asserting that it targets deficits with various countries and would be calibrated within the boundaries of the law. In a Saturday Truth Social post, he declared that he would be “effective immediately, raising the 10% worldwide tariff on countries, many of which have been ‘ripping’ the US off for decades, without retribution, until I came along, to the fully allowed, and legally tested, 15% level.”
“As President of the United States of America, I will be, effective immediately, raising the 10% worldwide tariff on countries, many of which have been ‘ripping’ the US off for decades, without retribution, until I came along, to the fully allowed, and legally tested, 15% level.”
Earlier on Friday, the administration had signaled a 10% global tariff as a base level, to be added to pre-existing duties, and had invoked legal measures under the Trade Expansion Act of 1962 and the Trade Act of 1974. The move followed a ruling from the Supreme Court that some argued curtailed presidential authority under IEEPA, complicating the administration’s ability to enact sweeping levies without further legislative action. Crypto enthusiasts and industry observers noted that the legal framing matters because it could limit the duration and reach of the tariffs, particularly for deficits with specific partners. Pro-crypto attorney Adam Cochran highlighted the practical constraints, noting that the law in question applies to a defined set of countries for a finite period and at a capped rate, reducing the likelihood of unfettered, long-term application.
Markets often respond to tariff developments with a tilt toward risk-off behavior, and the immediate reaction can be pronounced in sectors sensitive to global liquidity, leverage, and cross-border trade dynamics. Yet in this cycle, the crypto space demonstrated relative steadiness in the face of the tariff news. Bitcoin (CRYPTO: BTC) price movements remained largely tethered to prior levels, while Ethereum (CRYPTO: ETH) exhibited similar resilience. Data from market trackers showed BTC near the $68,000 mark and ETH holding broadly steady, with the Total3 indicator—representing the combined market capitalization of crypto assets excluding BTC and ETH—falling less than 1% to roughly $713 billion, suggesting that investors differentiated policy risk from fundamental demand for large-cap digital assets.
The narrative around policy power and market impact is ongoing. The tariff announcements have sparked discussions among lawmakers about potential economic consequences, and observers will be watching for signals about the trajectory of regulatory policy, potential exemptions, and the duration of any temporary measures. In the meantime, traders are parsing the implications for risk sentiment, liquidity, and cross-asset correlations as the policy landscape continues to evolve. The interplay between legal interpretation and executive action will likely shape the near-term volatility spectrum for crypto and traditional markets alike.

Japanese financial conglomerate SBI Holdings is aggressively deepening its integration with the XRP ecosystem through calculated new moves.
These strategic initiatives aim to drive both retail crypto onboarding and corporate developer adoption.
SBI Offers $64 Million Bond With XRP Rewards
On February 20, SBI revealed a 10 billion yen ($64.5 million) blockchain-based security token bond offering that rewards retail investors with XRP.
The three-year debt instrument, branded as SBI START Bonds, officially prices on March 10 and issues on March 24. It promises conventional fixed-income investors an indicative annual interest rate between 1.85% and 2.45%.
“The SBI Group believes that the continued development of the ST bond market in Japan will contribute to the revitalization of the capital markets and, ultimately, to the sustainable growth of the real economy,” it stated.
However, the XRP rewards serve a much deeper purpose than simple yield enhancement.
To qualify for the cryptocurrency payouts, which are distributed annually through 2029, domestic investors must open and verify an account with SBI VC Trade, the firm’s cryptocurrency brokerage subsidiary, by May 11.
By mandating this crucial step, SBI implements a highly efficient customer-acquisition strategy.
The firm uses a safe, regulated, yen-denominated corporate bond to funnel conservative retail money into its digital asset platform. Once these users enter the ecosystem, SBI can aggressively cross-sell them spot trading, staking, and margin services.
SBI to Support XRPL-Focused Startups Through New Partnership
Simultaneously, SBI Ripple Asia signed a memorandum of understanding with the Asia Web3 Alliance Japan (AWAJ).
The partners aim to establish a specialized venture studio model that provides hands-on technical and regulatory support to regional startups.
“In this initiative, the two companies will work together to provide technical support as ‘technical support partners’ to businesses aiming to implement financial services using blockchain,” the firms stated.
Crucially, the initiative expressly requires these startups to build their financial services natively on the XRP Ledger (XRPL).
Unlike rival networks such as Ethereum or Solana, which boast organic developer momentum and robust smart contract activity, XRPL lacks a thriving decentralized finance ecosystem.
However, the blockchain network has recently introduced several new features designed to attract institutional interest.
By funding a venture studio explicitly tied to the ledger, SBI essentially attempts to further fuel developer momentum on the blockchain network.
The firm recognizes that without startups actively building on the chain, the network will remain underutilized for complex financial applications.
“Through our collaboration, we will support the creation of practical use cases utilizing XRPL that contribute to the financial and industrial sectors, aiming to realize globally applicable financial use cases originating in Japan,” they explained.

TLDR:
- Algorand warns that smart contract vulnerabilities cause immediate, irreversible fund loss with no legal recovery path available.
- AI tools may store user data in LocalState, a flawed pattern where ClearState drains critical accounting data permanently.
- Algorand recommends using Plan Mode and agent skills to design secure contract architecture before writing a single line of code.
- Private keys must stay out of AI reach entirely, with OS-level keyrings handling all transaction signing away from the agent.
Algorand is urging blockchain developers to adopt disciplined, AI-assisted practices before deploying smart contracts to MainNet.
The blockchain platform has drawn a clear line between reckless AI-generated code and responsible agentic engineering.
With AI agents now capable of building and deploying contracts in a single conversation, the stakes have never been higher. Deploying vulnerable smart contracts means immediate, irreversible loss of funds with no path to recovery.
The Risk of Unreviewed AI-Generated Code
Algorand developers have identified a growing problem in the broader web3 space. AI coding tools allow developers to ship products faster, but unchecked code carries serious risk.
Unlike web2 breaches, smart contract vulnerabilities cannot be patched after the fact. Funds drained from a poorly written contract are gone permanently, with no legal recourse available.
The Algorand team shared a concrete example of how AI can mislead developers. An AI might store user balances in LocalState, which appears to be the correct pattern.
However, users can clear local state at any time, and ClearState succeeds even when a program rejects it. This means critical accounting data can disappear without warning. Developers who do not understand the code they ship are exposed to exactly this kind of subtle failure.
Algorand’s developers formalized this concern through a public post from the @algodevs account. The post draws from Addy Osmani’s distinction between “vibe coding” and “agentic engineering.”
Vibe coding means accepting all AI output without review. Agentic engineering means the developer remains the architect and final decision-maker throughout the process.
The platform advises developers to use BoxMap instead of LocalState for data that cannot be lost. This kind of nuance is what separates a working contract from a broken one.
AI tools trained on outdated patterns will not flag these issues automatically. Developers must bring their own understanding to every deployment.
How Algorand Recommends Building Safely With AI
Algorand outlines several practices to keep AI-assisted development secure and maintainable. Developers should use Plan Mode before writing any code, allowing the agent to design architecture first.
This produces a spec covering state schema, method signatures, and access control. Reviewing this plan catches design flaws before any implementation begins.
Agent skills play a major role in guiding AI toward correct Algorand patterns. These are curated instructions that encode current best practices directly into the development workflow.
Without them, AI is likely to use deprecated APIs or outdated patterns. Structured prompts reduce hallucinations and produce more reliable contract code.
Private keys must remain completely out of reach of AI agents at all times. Tools like VibeKit use OS-level keyrings so that AI requests transactions without ever accessing signing credentials.
Additionally, developers should use algokit task analyze and simulate calls to catch edge cases. Testing should mirror how an attacker would approach the contract, not just how a user would.

Bill Maher responds to Trump's rant about their White House dinner: 'Bulls—'
Chemours Stock Tumbles After Earnings. Data-Center Cooling Couldn’t Save the Quarter.

Late-game sequence ignites brawl in heated college basketball game


-

 Video6 days ago
Bitcoin: We’re Entering The Most Dangerous Phase
-

 Crypto World5 days ago
Can XRP Price Successfully Register a 33% Breakout Past $2?
-

 Fashion1 day ago
Weekend Open Thread: Boden – Corporette.com
-

 Sports5 days ago
GB's semi-final hopes hang by thread after loss to Switzerland
-

 Video2 days ago
XRP News: XRP Just Entered a New Phase (Almost Nobody Noticed)
-
 Tech5 days ago
The Music Industry Enters Its Less-Is-More Era
-

 Business4 days ago
Infosys Limited (INFY) Discusses Tech Transitions and the Unique Aspects of the AI Era Transcript
-

 Entertainment4 days ago
Kunal Nayyar’s Secret Acts Of Kindness Sparks Online Discussion
-

 Video5 days ago
Financial Statement Analysis | Complete Chapter Revision in 10 Minutes | Class 12 Board exam 2026
-

 Tech4 days ago
Retro Rover: LT6502 Laptop Packs 8-Bit Power On The Go
-
 Sports3 days ago
Clearing the boundary, crossing into history: J&K end 67-year wait, enter maiden Ranji Trophy final | Cricket News
-

 Entertainment3 days ago
Dolores Catania Blasts Rob Rausch For Turning On ‘Housewives’ On ‘Traitors’
-

 Business4 days ago
Tesla avoids California suspension after ending ‘autopilot’ marketing
-
 NewsBeat6 days ago
The strange Cambridgeshire cemetery that forbade church rectors from entering
-

 Politics5 days ago
Eurovision Announces UK Act For 2026 Song Contest
-

 Crypto World3 days ago
WLFI Crypto Surges Toward $0.12 as Whale Buys $2.75M Before Trump-Linked Forum
-
 NewsBeat7 days ago
Man dies after entering floodwater during police pursuit
-

 Crypto World2 days ago
83% of Altcoins Enter Bear Trend as Liquidity Crunch Tightens Grip on Crypto Market
-
 NewsBeat2 days ago
Andrew Mountbatten-Windsor latest: Police search of Royal Lodge enters second day after Andrew released from custody
-

 Business4 days ago
School's 'cost of living cupboard' helps families