

Crypto World
Crypto Whales Are Waching 3 Tokens for Possible March Gains
With just days left in February, crypto whales are quietly repositioning. The broader market remains uncertain, but on-chain data tells a different story. Large holders are selectively adding exposure across three tokens — one seeking direction, one seeking a breakout, and one targeting greater upside.
As March approaches, the big holders appear to be making their move early.
Uniswap (UNI)
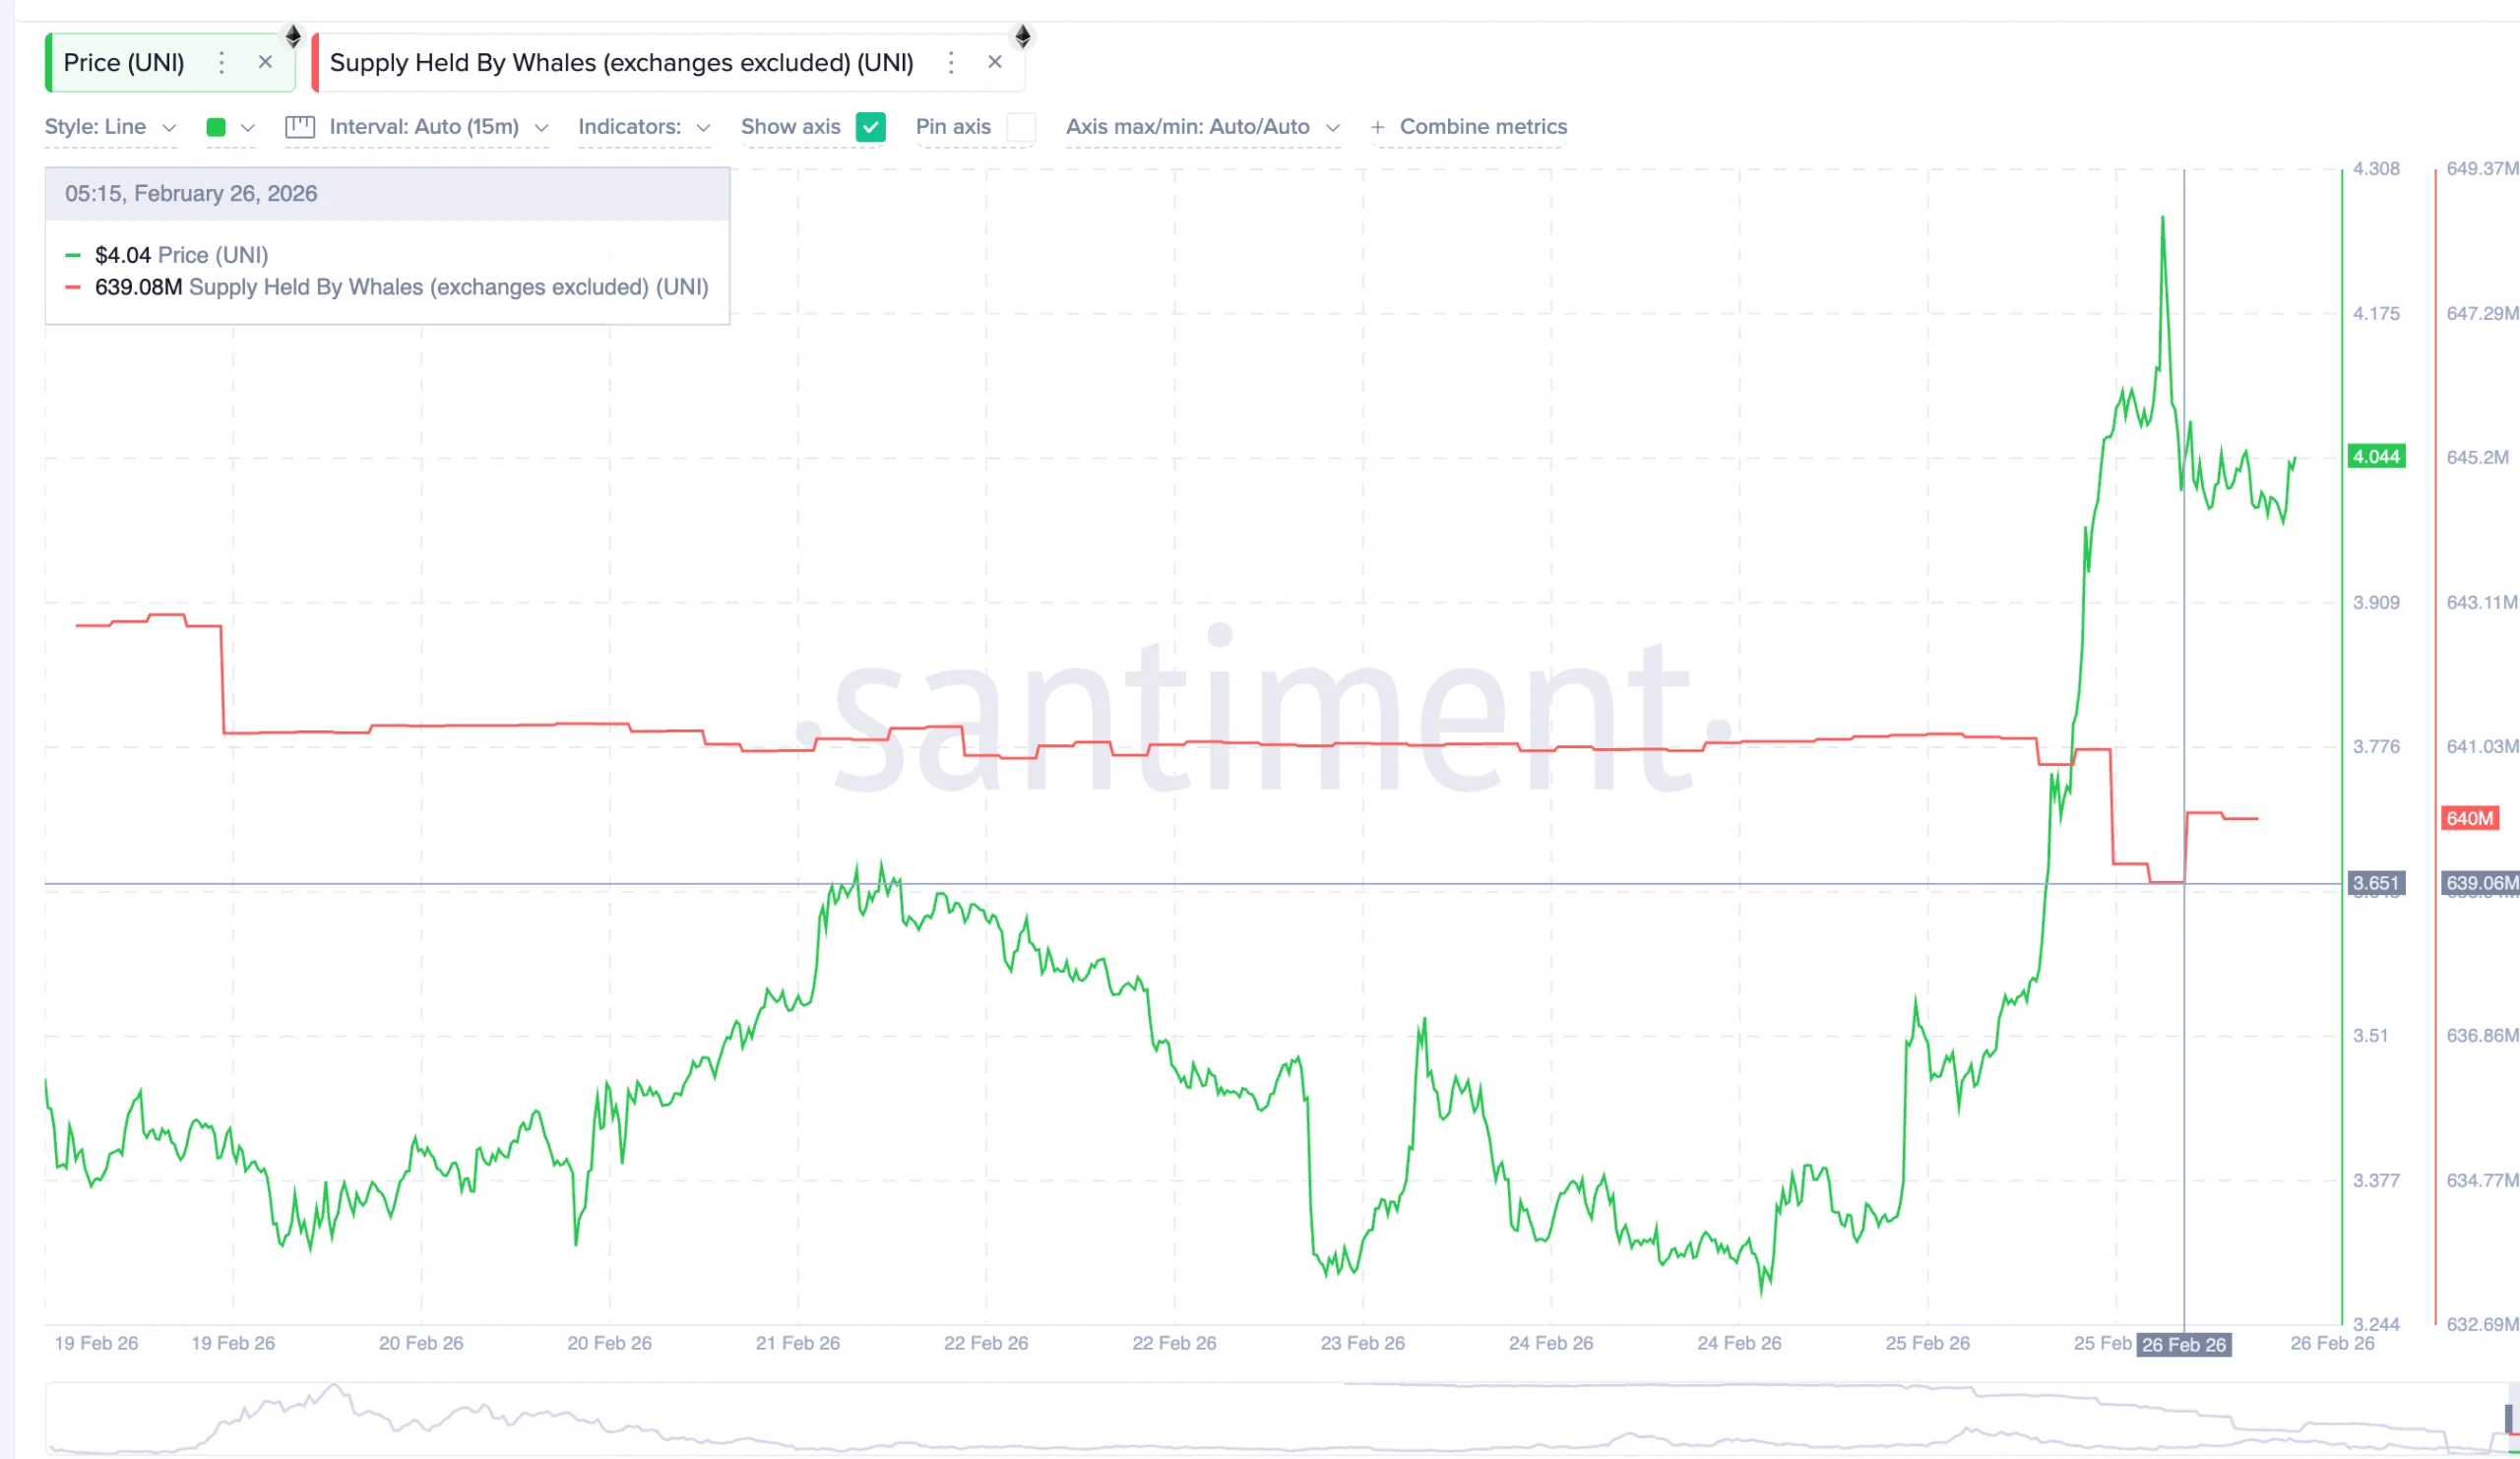
Uniswap is among the more interesting names showing crypto whale activity heading into March. Despite a broader market pullback, UNI is up nearly 15.5% over the past 24 hours, briefly spiking to $4.29 before pulling back sharply.
Yet crypto whales are not flinching. On-chain data shows large holders increased their UNI holdings from 639.06 million to 640 million tokens. And they did all of that on February 26 alone. At the current price, that sudden accumulation is worth roughly $1 million over a few hours, reflecting quiet conviction even as the price corrected from its intraday high.
The chart context explains why. UNI has been consolidating inside a developing symmetrical triangle, with lower highs being met by higher lows as both trendlines converge. The past two attempts to break above the upper resistance were rejected hard, with sellers stepping in precisely at the triangle boundary. The large wick from today’s session is a direct reflection of that dynamic — momentum pushing up, supply pushing back.
However, smart money positioning remains aggressive, as the Smart Money Index is still way above the signal line. This keeps the possibility of a breakout alive if broader market conditions improve. A confirmed 12-hour close above $4.21 would validate the breakout and give UNI a possible bullish direction. That would open upside toward $4.88 and potentially $5.95 if DeFi rotation picks up meaningfully through March.
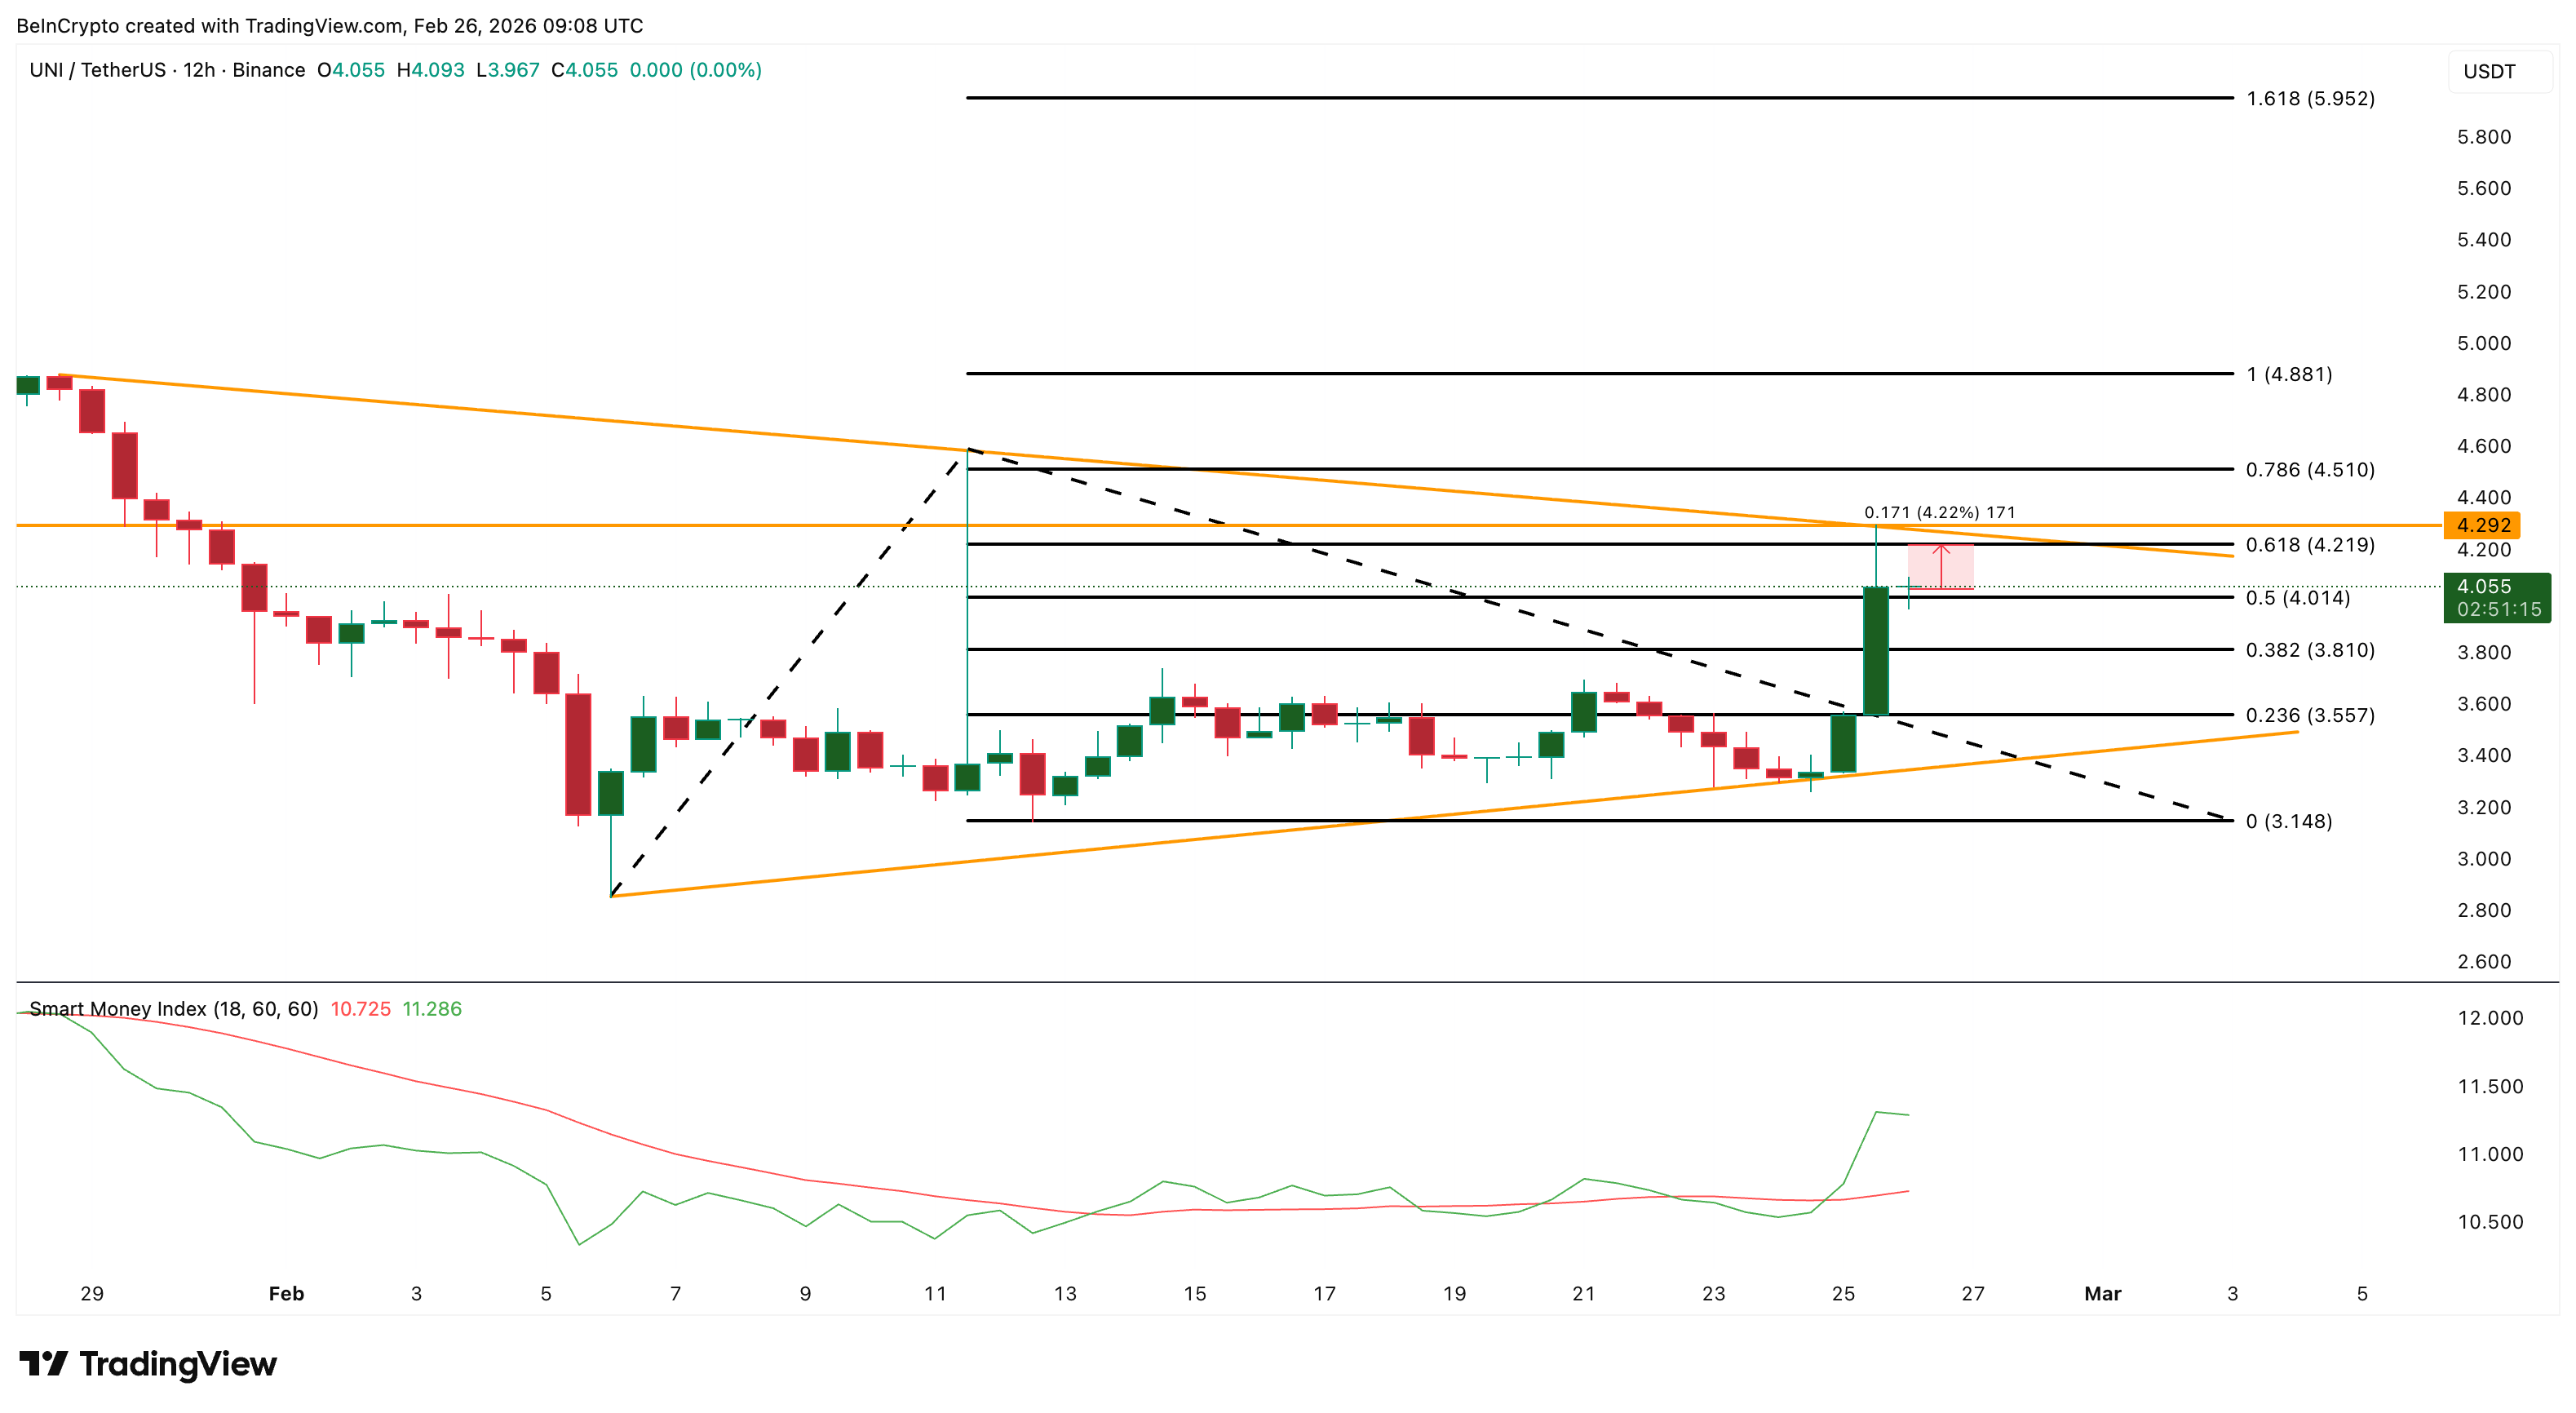
On the downside, $3.81 is the key support. A break there risks pushing UNI toward the lower triangle boundary. However, buyers have consistently defended that zone since early February, suggesting the symmetrical structure remains intact and continues narrowing. However, if the broader market sell-off begins, traders need to keep a close eye on whale and smart money positioning.
Bitcoin Cash (BCH)
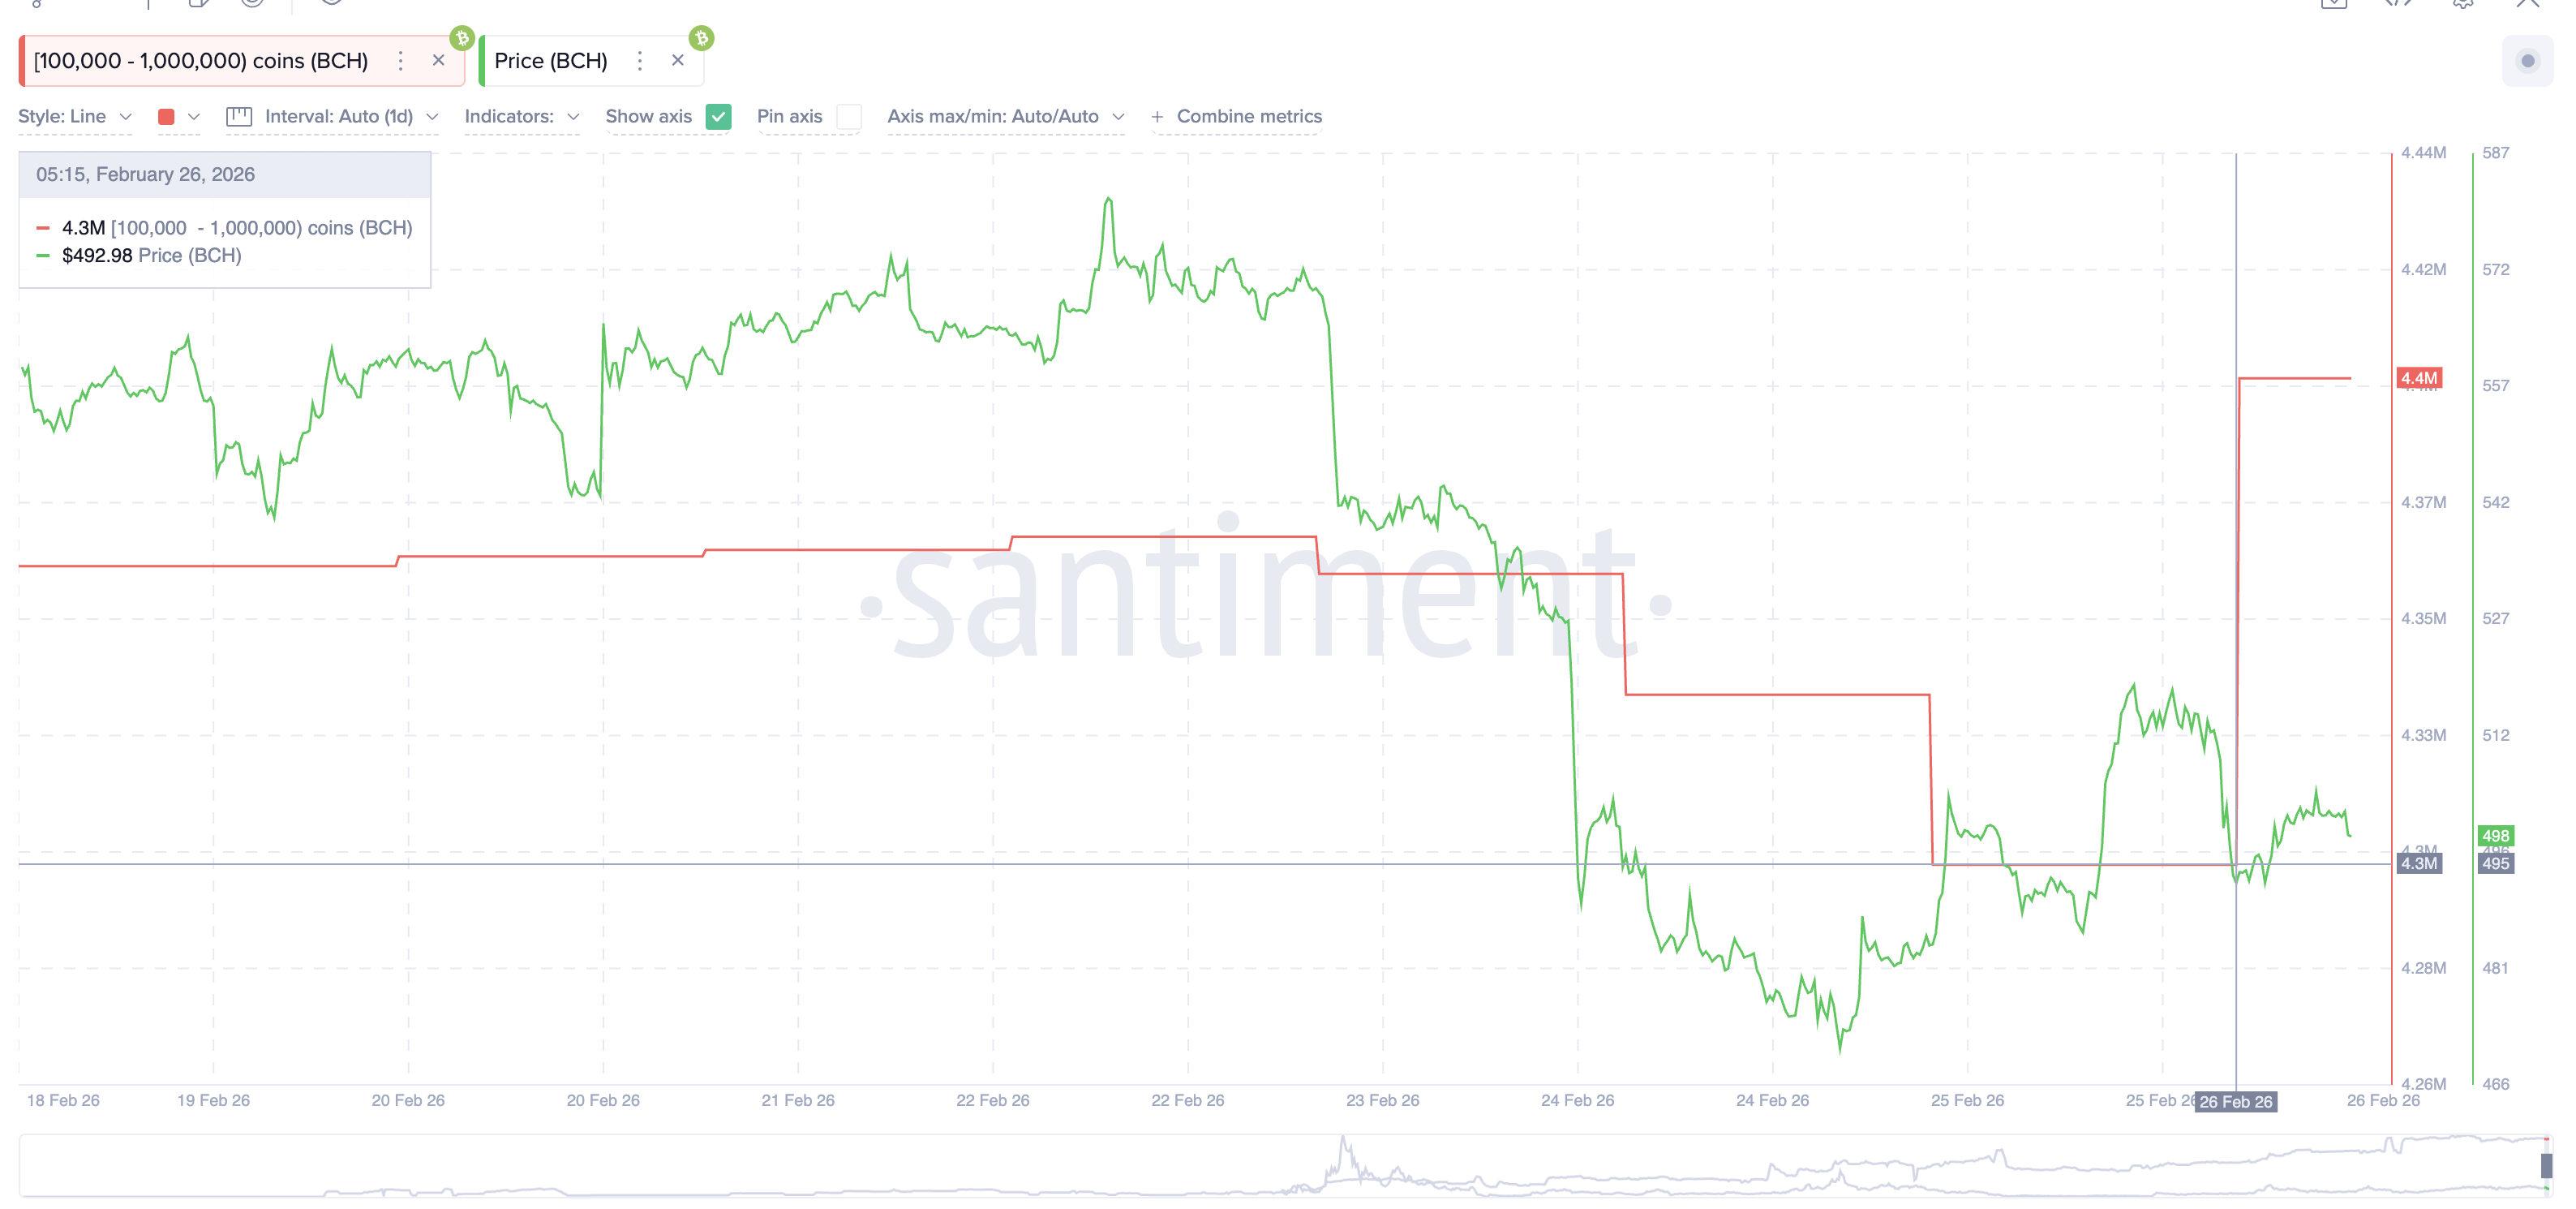
Bitcoin Cash is another name where whale accumulation has turned suddenly aggressive. BCH is up just 1.5% in the past 24 hours, underperforming the broader market. But zoom out, and Bitcoin Cash is up nearly 70% year-on-year. That is a standout number. Most major crypto names cannot say the same.
That long-term strength appears to be driving fresh conviction. The largest BCH holder cohort, wallets holding between 100,000 and 1,000,000 coins, increased their stash from 4.3 million to 4.4 million today, almost $50 million. The move was rapid and decisive. Notably, these whales were steadily reducing holdings until February 25. Then the shoulder of an inverse head-and-shoulders pattern formed.
Want more token insights like this? Sign up for Editor Harsh Notariya’s Daily Crypto Newsletter here.
Price began moving on February 24. By February 26, accumulation kicked in sharply. The timing is deliberate. Whales waited for the pattern to develop before committing. That is disciplined positioning, not reactive buying. On the 8-hour chart, BCH has rallied roughly 10% since February 24, only to pull back.
It is now approaching the neckline of that inverse head-and-shoulders formation. A confirmed break above $598 would signal a breach of the neckline, which BCH could attempt in March. Based on pattern projection, that opens a path toward $777. However, it would first need to push past $570, a strong technical resistance, before that.
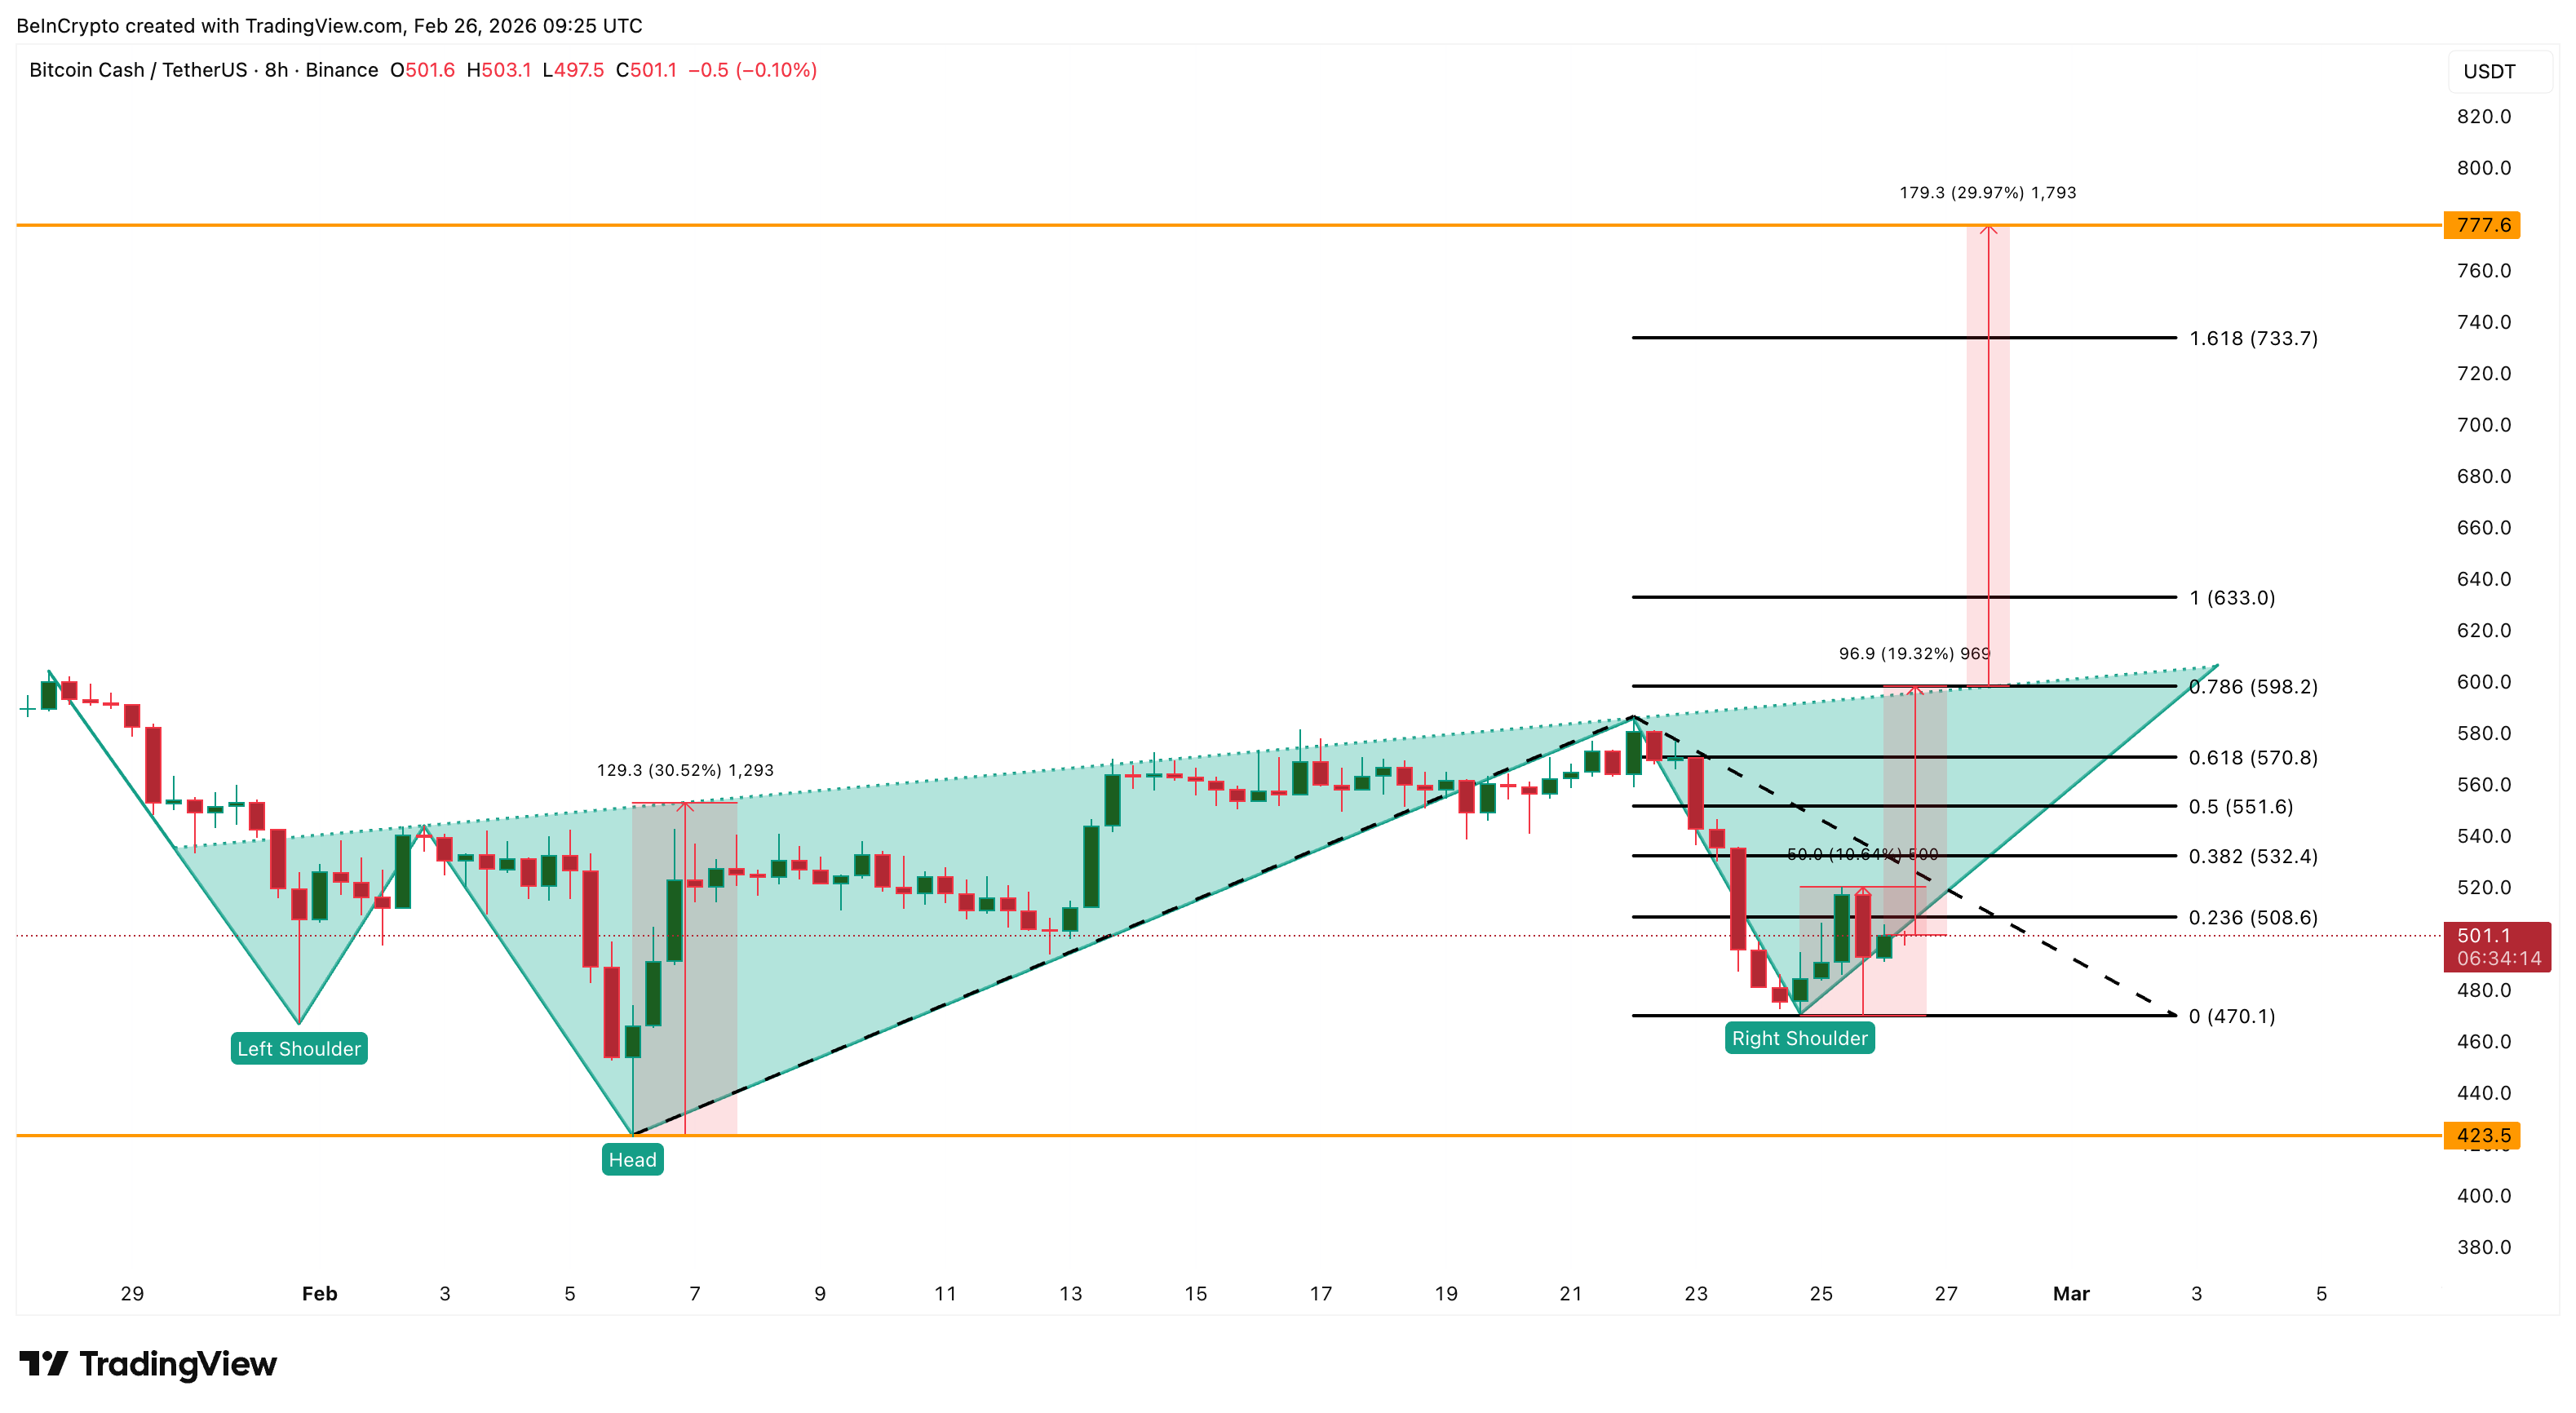
Given BCH’s year-on-year track record, both the targets, first the neckline at 19% and then the target, are not far-fetched. However, the setup has clear invalidation levels. Failure to reclaim $508 would be an early warning sign. A drop below $470 weakens the pattern meaningfully. A close under $423 invalidates the structure entirely, and the whale thesis unravels with it.
Chainlink (LINK)
Chainlink rounds out the three tokens where crypto whale accumulation has turned decisive heading into March. LINK saw continuous whale selling through February 25. That changed on February 26. Large holders increased their stash from 591.96 million to 592.33 million tokens. That is an addition of 370,000 LINK. At the current price, that accumulation is worth roughly $3.5 million — a sudden shift in positioning.
The trigger is clear. On the 12-hour chart, Chainlink broke out of an inverse head and shoulders pattern yesterday, as predicted by BeInCrypto Analysts. This is not anticipatory buying. Whales moved after the breakout was confirmed, adding on evidence rather than speculation.
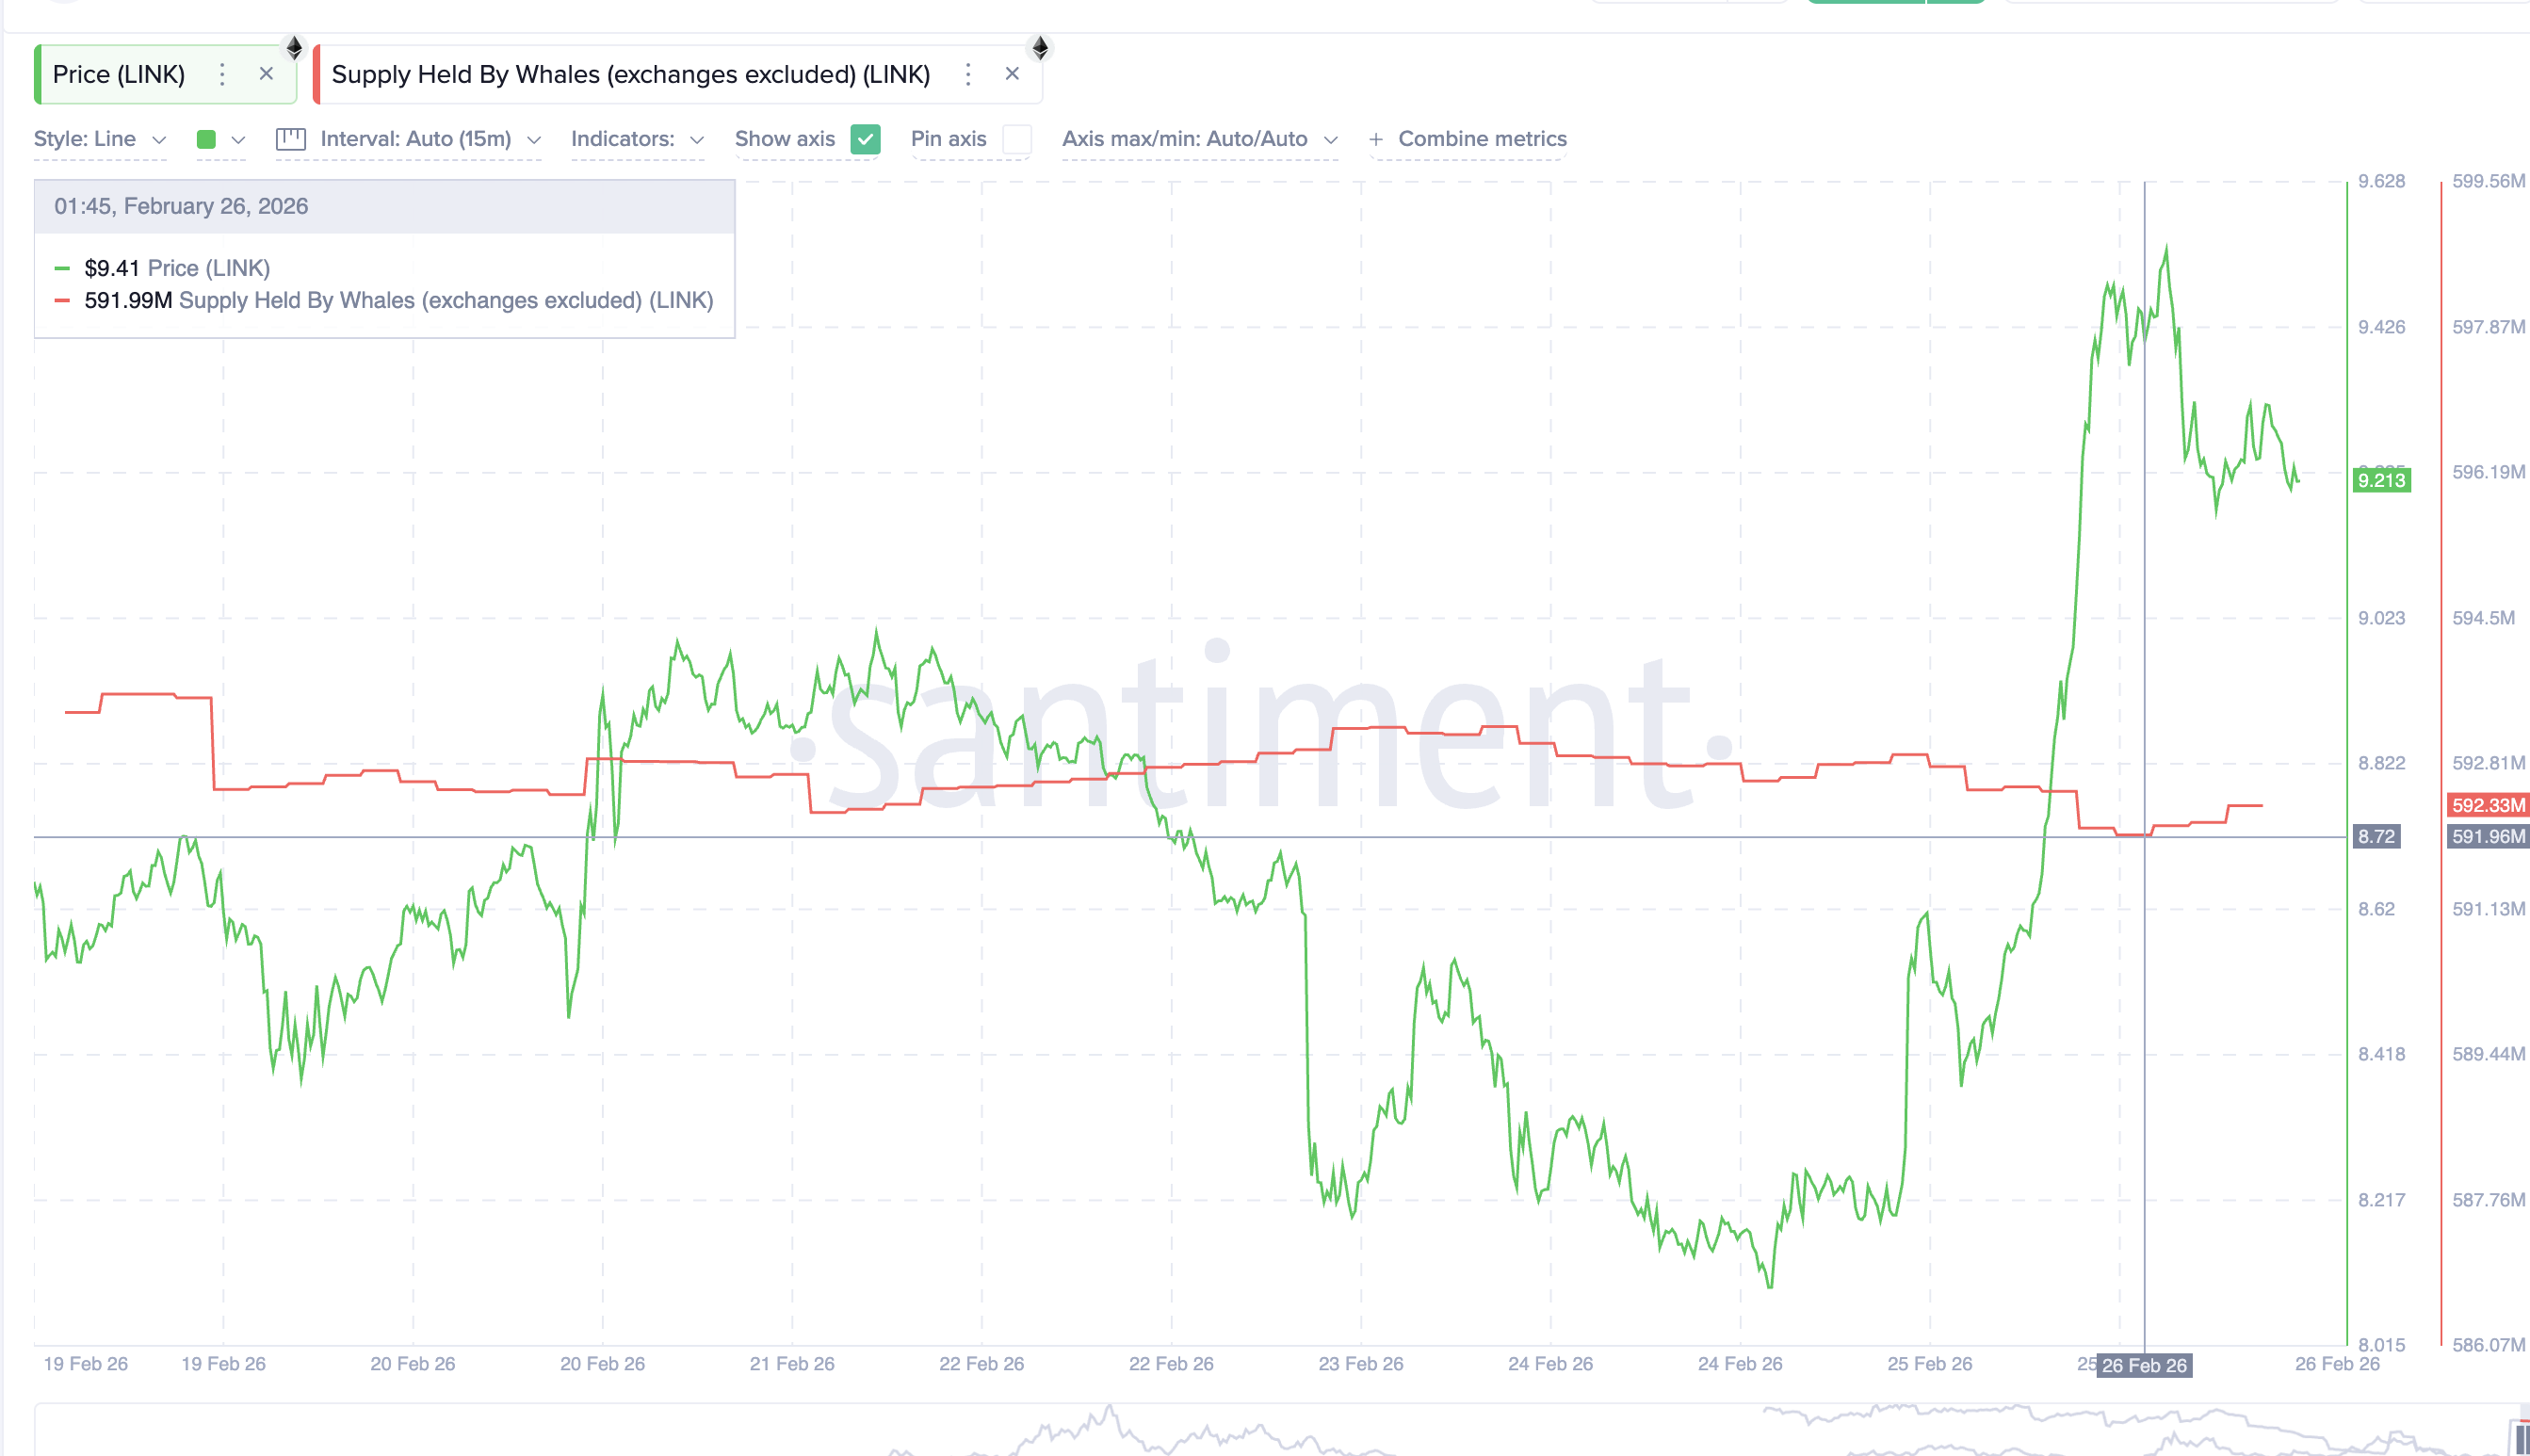
Since the breakout, LINK has met resistance at $9.62 and pulled back, possibly due to profit-taking. However, it is holding firmly near $9.28, a strong support zone. That level needs to hold for the bullish structure to remain intact.
There is another layer of strength here. The Chaikin Money Flow, or CMF, crossed above the zero line on February 20. That cross preceded the breakout, signaling institutional money flowing into LINK before the price moved. CMF currently sits at 0.13.
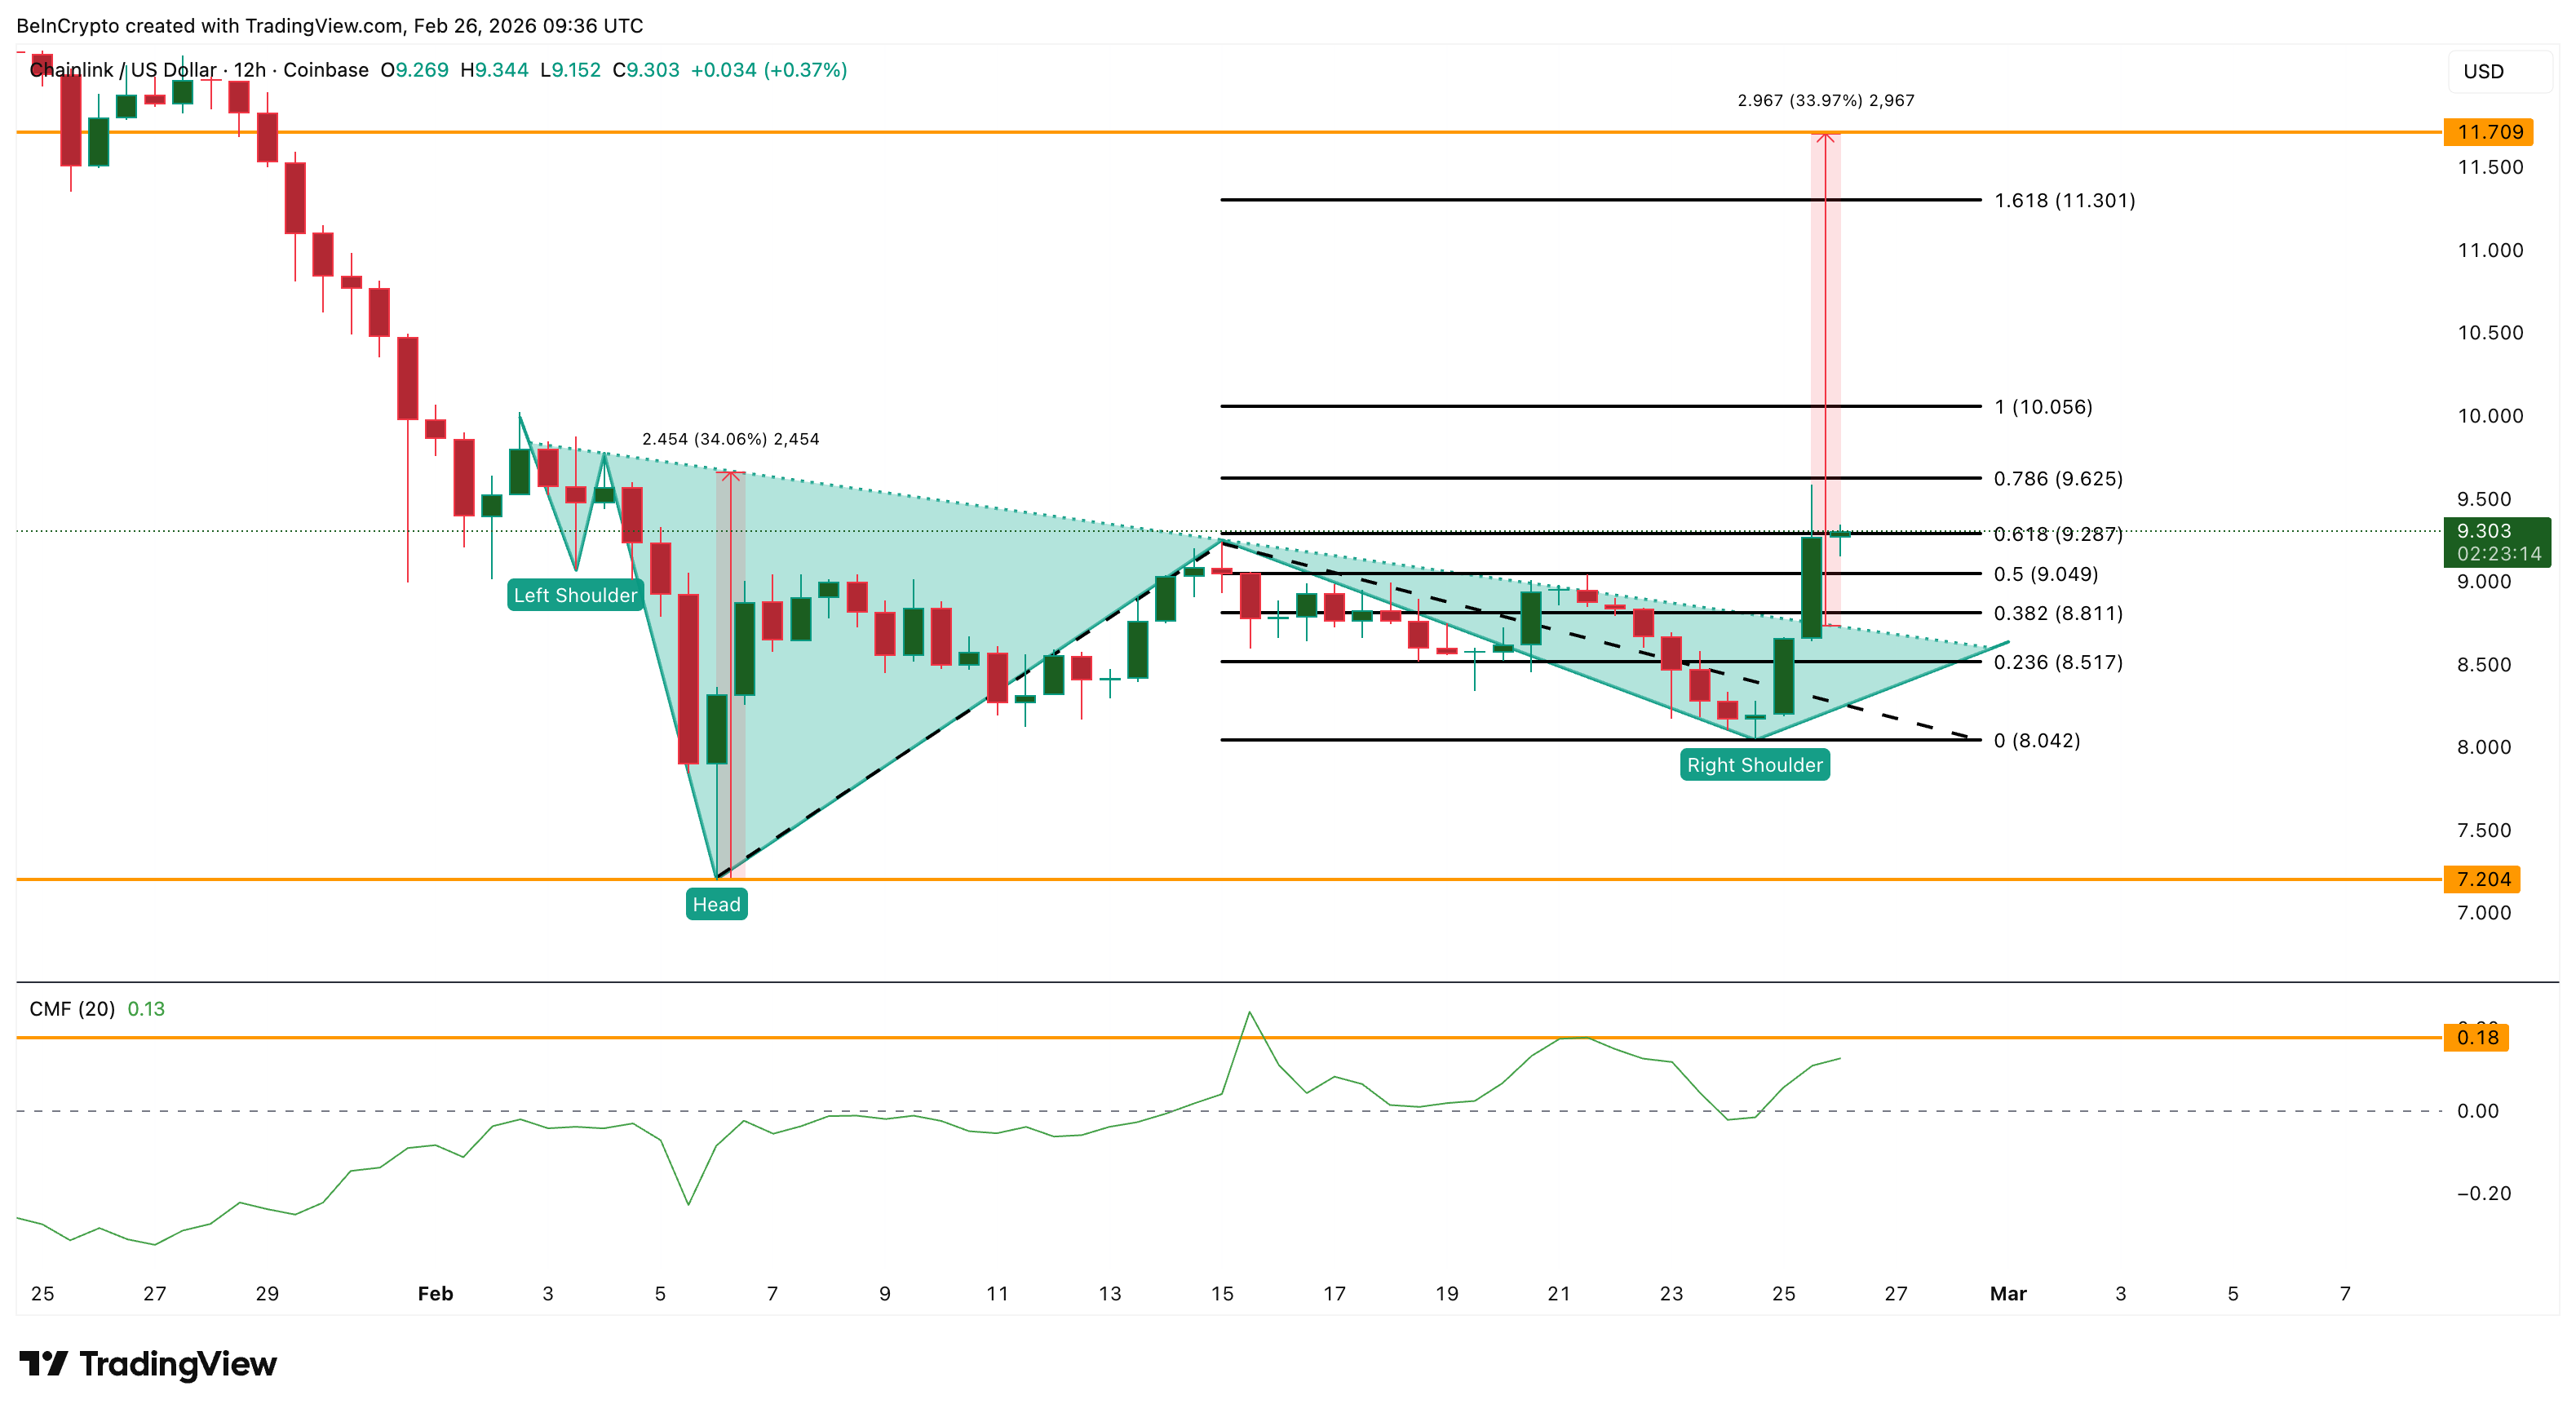
A push toward 0.18 would confirm deepening institutional participation and give LINK the momentum needed for the next leg.
If buying resumes and sentiment holds, a move above $9.62 followed by $10.05 opens the path toward the realized projection target of $11.70.
Invalidation is straightforward. A correction toward $8.51 is the first warning. A close below $8.04 weakens the structure considerably and puts the entire bullish thesis at risk.


Circle sent 63% of Q4 USDC reserve income to distributors, compressing margins.
Summary
- Circle generated $733.4m in Q4 reserve income and paid $460.6m in distribution and transaction costs, leaving $272.8m net reserve income before operating expenses.
- USDC circulation hit $75.3b, up 72% YoY, with average USDC outstanding doubling to $76.2b and a 3.8% reserve return, down 68 bps YoY.
- “USDC on Platform” reached $12.5b, up 459% YoY, with a 17.8% daily weighted share of total supply, concentrating economics around a few key distributors.
Circle Internet Financial reported fourth quarter earnings showing the stablecoin issuer paid $460.6 million in distribution and transaction costs against $733.4 million in reserve income, representing approximately 63% of gross yield generated from customer deposits.
The company’s USDC stablecoin circulation reached $75.3 billion at year-end, up 72% year-over-year, according to the earnings report. Reserve income increased 69% while adjusted EBITDA grew fivefold compared to the prior year period.
Total revenue and reserve income reached $770.2 million for the quarter, with distribution costs accounting for nearly 60% of earnings, according to the financial statements. Circle retained $272.8 million in net reserve income after distribution payments.
The company publishes “Revenue Less Distribution Costs” as a core performance metric each quarter. Circle’s net reserve margin settled at 37% in the fourth quarter, meaning the issuer retained approximately $0.37 for every dollar of gross reserve yield.
Stablecoin issuers generate income by holding user deposits in reserve portfolios consisting primarily of short-term Treasury securities and similar instruments. Circle reported a 3.8% reserve return rate in the fourth quarter, down 68 basis points year-over-year. Average USDC in circulation doubled from $38.1 billion to $76.2 billion during the period.
Distribution costs rose 52% year-over-year, according to the earnings report. Circle attributed the increase to “increased distribution payments” to exchanges, wallets, and fintech platforms that provide user access. The prior-year period included a $60 million one-time fee to a distribution partner, previously disclosed.
Circle’s five-quarter trend data shows distributors consistently claimed approximately 63% of reserve income each quarter. Distribution payments are tied to placement agreements and transaction flows rather than fixed technology costs.
The company’s risk disclosures state it may be “unable to maintain existing relationships with financial institutions and similar firms or enter into new relationships.” Circle flags potential pressure to accept “less favorable financial terms” with distribution partners and highlights “dependence on a few key distributors” as a structural constraint.
Circle tracks a metric called “USDC on Platform,” measuring the share of total USDC held across partner platforms. That figure reached $12.5 billion at year-end, up 459% year-over-year, with a daily weighted average of 17.8% of total circulation, according to company data.
Treasury bill yields remained in the mid-3% range as of late February 2026. Market expectations contemplate potential Federal Reserve rate cuts in coming quarters, according to financial market data. A declining rate environment would compress reserve income while distribution costs may prove less flexible, potentially pressuring issuer margins.
Circle’s guidance reflects margin compression relative to the fourth quarter’s 40% RLDC margin, according to the company’s forward-looking statements. The guidance indicates distribution costs may not decline proportionally to reserve income in a lower-rate environment.
In most stablecoin implementations, users do not directly receive yield on their holdings. Issuers earn reserve income and negotiate distribution agreements with platforms that control user access. Distributors do not bear balance sheet risk associated with reserves.
The GENIUS Act, referenced in Circle’s regulatory disclosures, establishes a U.S. framework for payment stablecoins. The legislation formalizes regulatory requirements for stablecoin issuers.
Circle’s operational risk disclosures focus on distributor relationships rather than traditional liquidity concerns. The company states that major partners could change incentive structures, promote competing stablecoins, or develop proprietary infrastructure. Such shifts could reallocate transaction flows and distribution economics.
Circle’s reserves are liquid, audited, and managed conservatively, according to company disclosures. The balance sheet is structured to withstand redemption surges.
The company’s “USDC on Platform” metric monitors concentration of balances across distribution partners. Higher concentration on specific platforms affects negotiating leverage in distribution agreements.
Market dynamics in the stablecoin sector increasingly focus on securing and maintaining distribution relationships with platforms that control user access. Issuers compete for placement on exchanges, wallets, and payment rails that determine transaction flows.
Circle’s fourth quarter results showed the company generated $733.4 million in reserve income and allocated $460.6 million to distribution and transaction costs, leaving $272.8 million in net reserve income before operating expenses.
Key takeaways:
-
Bitcoin derivatives show persistent fear despite the current rally toward $70,000, as seen by futures premiums being pinned well below neutral levels.
-
The markets’ cautious stance stems from broad risk-aversion and lingering concerns over institutional BTC liquidations and Bitcoin network security.
Bitcoin (BTC) retested the $70,000 level on Wednesday, recovering from Tuesday’s low of $62,500. While inflows into Bitcoin exchange-traded funds (ETFs) helped stabilize market sentiment, the momentum failed to restore confidence within the BTC derivatives markets. Traders remain concerned that underlying factors are preventing a sustained rally toward $75,000.

US-listed Bitcoin ETFs recorded $764 million in net inflows over two days, partially offsetting the $1.2 billion in outflows seen during the previous eight trading days. These large movements are typically attributed to institutional activity, suggesting strong demand when prices dip below $65,000.
Despite this demand, the appetite for leveraged bullish positions in BTC futures has dropped sharply.

The annualized premium for Bitcoin futures relative to spot markets sat at 2% on Thursday, remaining well below the 5% neutral threshold. Bullish momentum has been largely absent since Jan. 31, the date Bitcoin surrendered the $85,000 support level after holding it for over nine months. Data from the options market further indicates that professional traders are prioritizing the avoidance of downside exposure.

Bitcoin put (sell) options traded at a 14% premium compared to equivalent call (buy) instruments on Thursday. In a neutral market environment, this indicator typically fluctuates between -6% and +6%, signaling that fear remains a dominant force. Although this skew metric has improved from the 28% “panic” levels recorded on Tuesday, the recovery to $70,000 has done little to shift the cautious outlook of derivatives traders.
Is a single entity behind Bitcoin’s price weakness?
Recently, a number of unproven theories have been proposed to explain Bitcoin’s 32% decline over seven weeks. This downward trend began following the Oct. 10, 2025, market crash, which eliminated $19 billion in leveraged positions across the cryptocurrency sector. This volatility coincided with US President Donald Trump announcing a 100% increase in import tariffs on Chinese goods.
Following that event, Binance reportedly provided $283 million in compensation to users affected by liquidations attributed to internal oracle pricing errors, system latency, and asset transfer degradation. Binance co-founder and former CEO Changpeng “CZ” Zhao has since refuted allegations that the exchange intentionally triggered the October 2025 crash.
Other market participants have linked the recent bearishness to concerns over quantum computing. These fears intensified after Jefferies strategist Christopher Wood removed Bitcoin from his “Greed & Fear” model portfolio in January, citing potential risks to long-term security. In response, developers drafted a proposal, BIP-360, which focuses on advancing post-quantum cryptography onchain.
Related: Coin Bureau CEO on Bitcoin in 2026–Cycles, Liquidity and a Divided Market

The most recent explanation for Bitcoin’s lackluster performance involves the quantitative trading firm Jane Street. These claims gained momentum after Terraform Labs’ court-appointed administrator sued the company, alleging insider trading related to transactions that accelerated the collapse of the Terra Luna ecosystem in May 2022.
Jane Street’s recent 13-F filing disclosed significant holdings in BlackRock’s iShares Bitcoin Trust ETF and various Bitcoin mining companies. However, Julio Moreno, head of research at CryptoQuant, noted that such activity is typical for delta-neutral strategies.
Ultimately, the 5% decline in Nvidia (NVDA US) shares on Thursday following strong earnings suggests a growing risk-averse sentiment among investors, which may partially explain why Bitcoin struggles to reclaim the $75,000 level.
This article does not contain investment advice or recommendations. Every investment and trading move involves risk, and readers should conduct their own research when making a decision. While we strive to provide accurate and timely information, Cointelegraph does not guarantee the accuracy, completeness, or reliability of any information in this article. This article may contain forward-looking statements that are subject to risks and uncertainties. Cointelegraph will not be liable for any loss or damage arising from your reliance on this information.
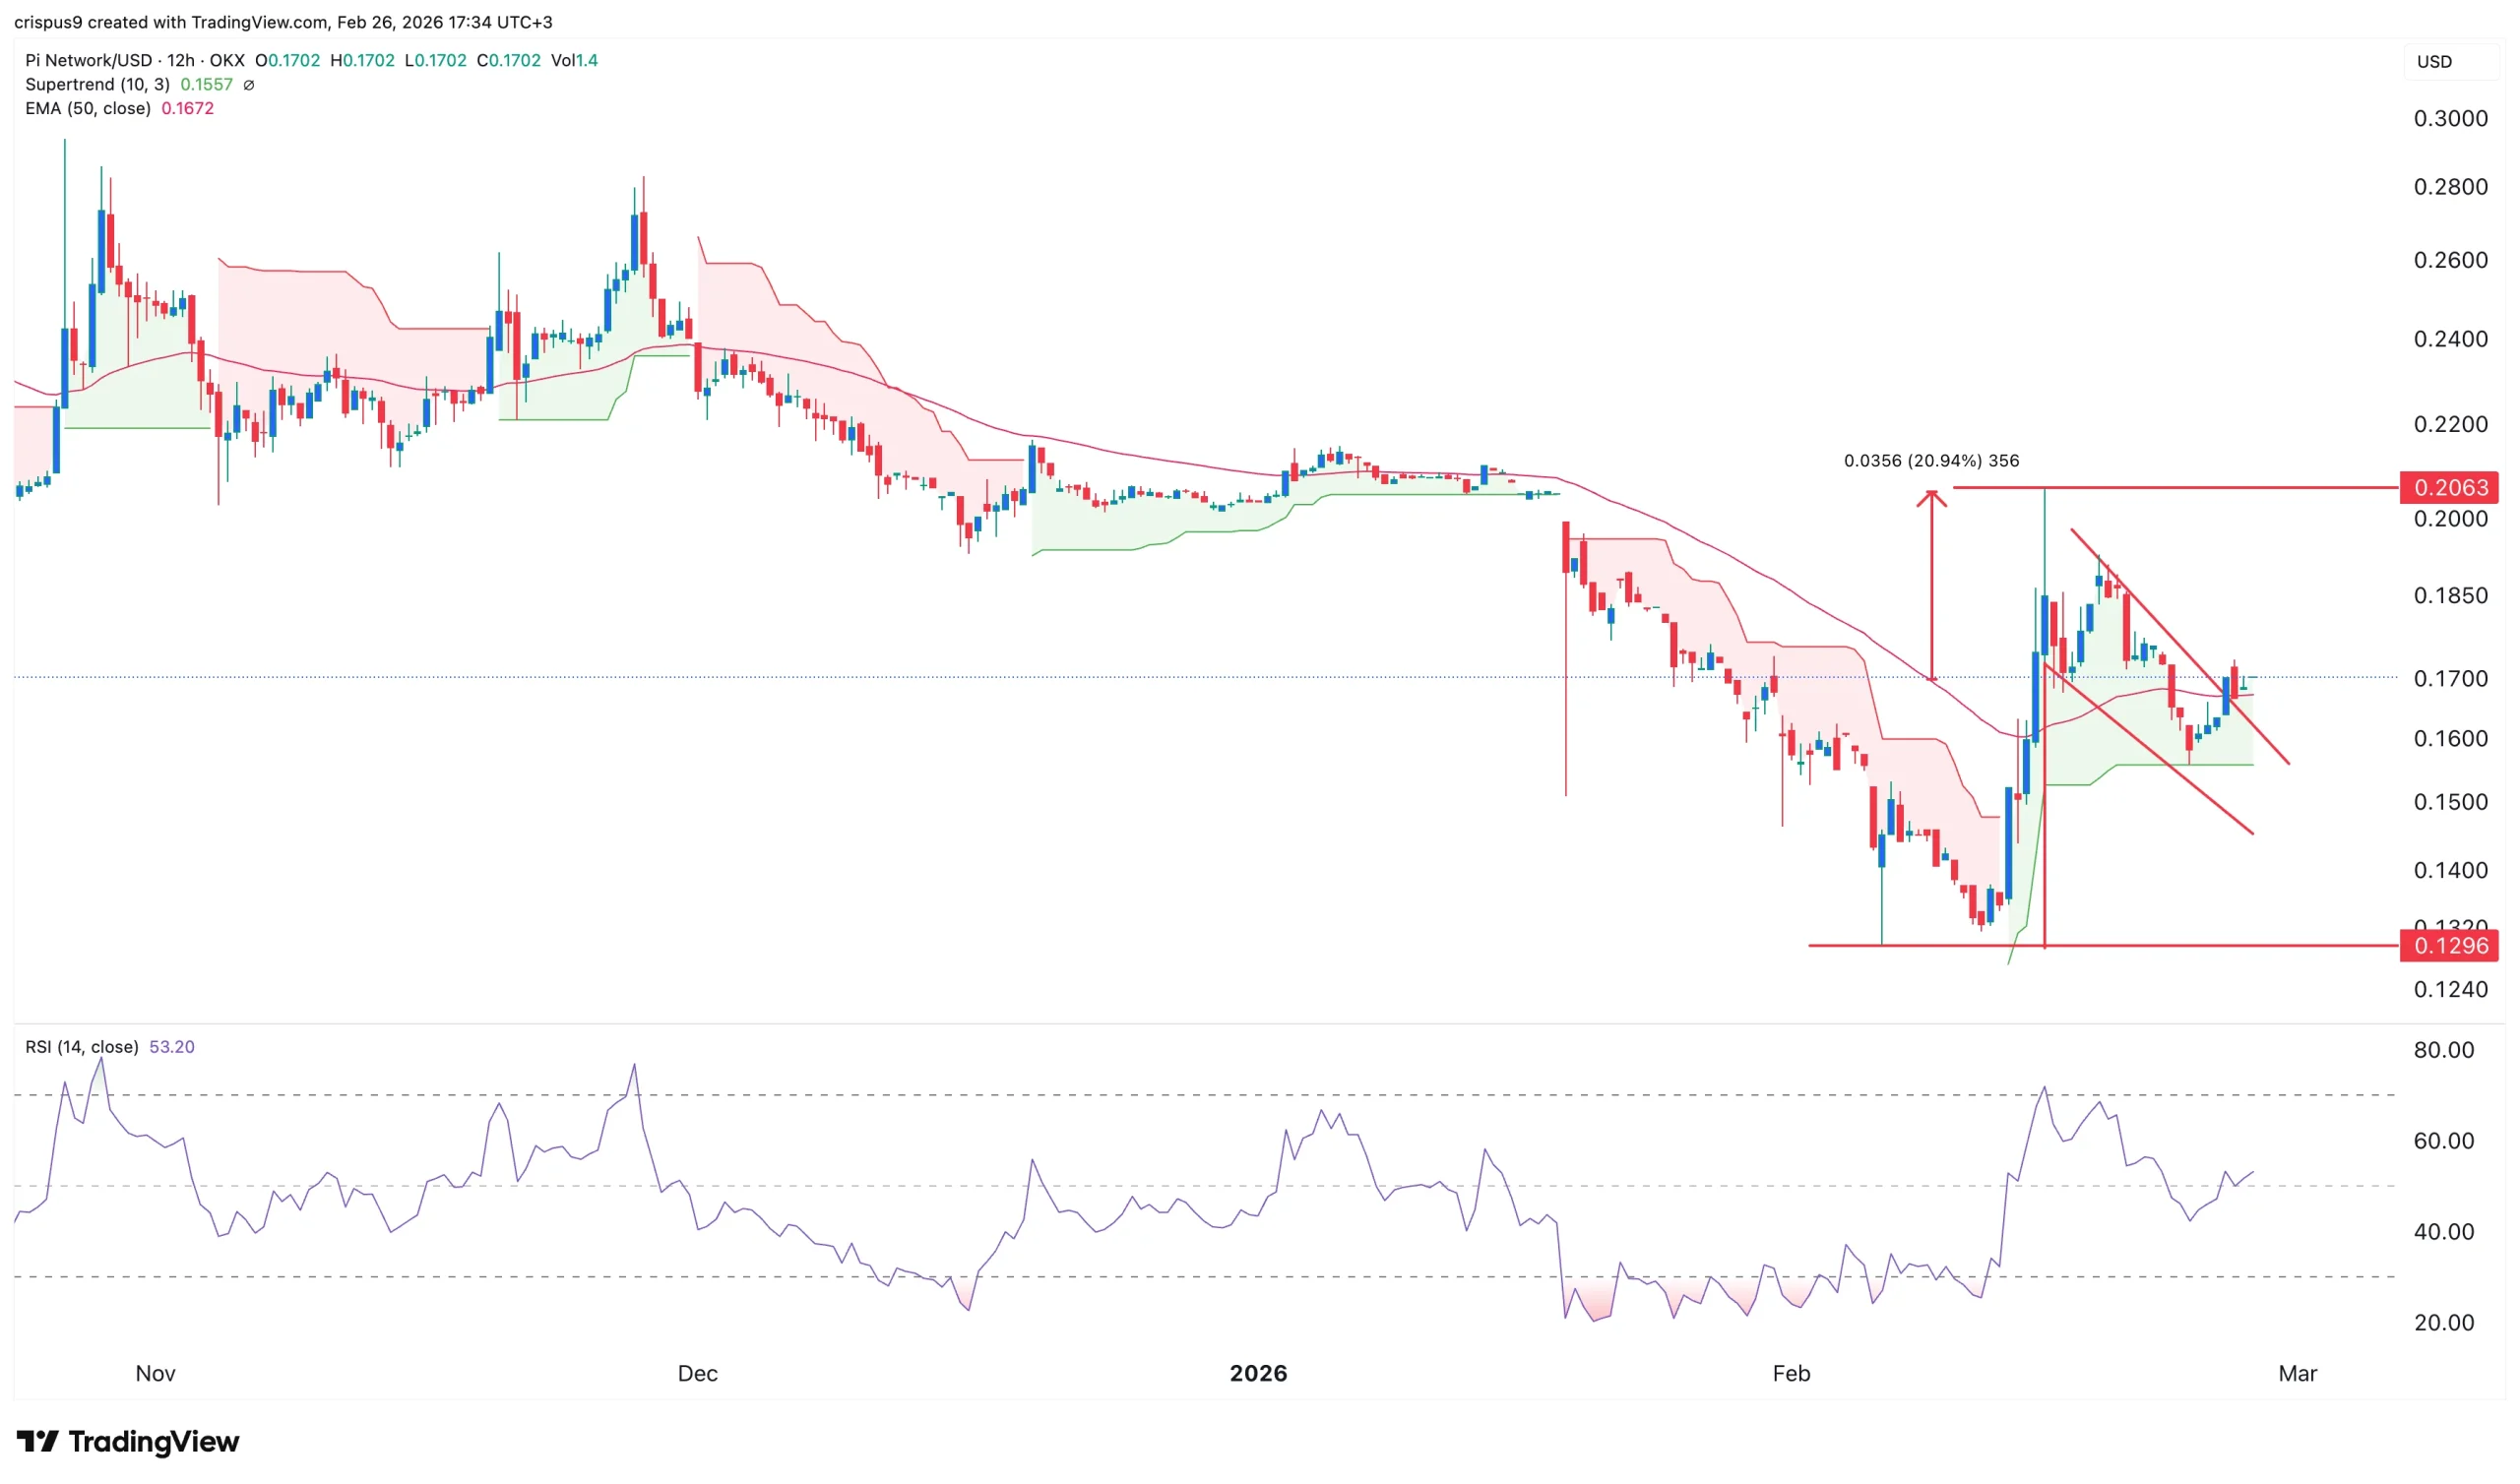
Pi Network price has done well this month, moving from a low of $0.1295 on February 6 to the current $0.1700. It has formed a highly bullish pattern, pointing to more gains as key upgrades and whale buying continues.
Summary
- Pi Network price has formed a bullish flag pattern on the 12-hour chart.
- The network is undergoing a series of upgrades.
- Data shows that whales are continuing to accumulate the token.
Pi Coin (PI) price could be on the verge of a strong bullish breakout in the coming days. First, the network is carrying out a major upgrade as it seeks to move to the latest version of the Stellar Consensus Protocol. This upgrade, when fully implemented, will make Pi a faster network with more functionality.
In a statement on Thursday, the developers noted that the next main upgrade deadline will be on March 1. After moving to 19.9, there will be four main stages, with the final one expected to happen in April this year. It is common for cryptocurrencies to rebound ahead of a major upgrade.
Pi Network price will also benefit from the ongoing whale buying. Data shows that the number of whales jumped rose to 20, with the biggest one holding over 383 million coins. The whale has bought over 17 million Pi coins this month, a sign that he expects it to rebound over time.
Meanwhile, the team noted that they are working on more features. A major one is the plan to launch a KYC-as-a-Service feature, a move that will see it compete with popular platforms like Humanity Protocol and Worldcoin. This product will be based on the success of the ongoing KYC process that has verified over 16 million users.
The biggest catalyst for the Pi Network Coin price will be the potential Kraken listing. Kraken, a top American exchange, has signaled that it will list it this year. Such a listing will make it available in the United States, and likely put more pressure to other exchanges to list it.
Pi Network price has formed a bullish flag pattern
The 12-hour chart shows that the Pi Coin price has flashed key bullish patterns that may lead to more gains. It has formed a bullish flag pattern, which is made up of a vertical line and a descending channel. It has now exited the upper side of this channel, which may lead to more gains.
Pi Coin price has also remained above the Supertrend indicator, a sign that bulls are still in control. It also moved slightly above the 50-period moving average, while the Relative Strength Index is pointing upwards.
Therefore, the most likely Pi Network forecast is bullish, with the next key target being at $0.2065. This target is about 20% above the current level.
Crypto World
STRK price outlook as Starknet prepares to launch strkBTC, a shielded Bitcoin for private transactions


- strkBTC will enable private Bitcoin transactions on Starknet’s DeFi network.
- STRK is down nearly 70% in 90 days, closely tracking Bitcoin’s movements.
- The key STRK price levels to watch are the support at $0.04 and the resistance at $0.045.
Starknet is gearing up for a major move in the decentralised finance (DeFi) space with the upcoming launch of strkBTC, a Bitcoin-based asset designed to bring privacy and confidentiality to transactions on its Layer-2 network.
According to a press release by Starknet, the new asset will allow users to transact Bitcoin within DeFi without exposing balances or counterparties.
It is built with shielded transfers in mind, giving users the flexibility to maintain privacy while interacting with the DeFi ecosystem.
strkBTC will be issued deterministically from verifiable Bitcoin deposits, meaning that the minting process does not rely on discretionary control.
This ensures that the token’s supply mirrors actual Bitcoin deposits on the network, creating a transparent and verifiable foundation for its use.
Users can choose between public and shielded modes, enabling confidential transactions while still preserving regulatory compliance.
This is achieved through selective disclosure mechanisms, which allow necessary audits without exposing the broader network activity.
The launch of strkBTC is part of Starknet’s strategy to increase Bitcoin adoption in DeFi while addressing concerns that have historically held back institutional participation.
By combining privacy, composability, and auditability, Starknet aims to attract both retail and institutional users to its ecosystem.
Starknet (STRK) market reaction
Starknet’s native token, STRK, has been under significant pressure in recent months.
The token has dropped roughly 70% over the past 90 days, reflecting a broader trend in cryptocurrency markets.
Its current price sits near $0.042, with a 24-hour decline of over 8%.
However, market activity remains moderate, with a 24-hour trading volume of around $52 million and a total value locked (TVL) on the network of roughly $446 million.
The upcoming strkBTC launch may provide a catalyst for renewed interest.
The introduction of a privacy-focused Bitcoin asset could enhance the utility of the Starknet network and increase demand for STRK as a governance and utility token.
In addition, STRK’s performance is closely tied to Bitcoin’s price movements, and the stabilisation of BTC above $66,000 could help STRK consolidate in the range of $0.04 to $0.045.
On the other hand, a sustained move below $0.04 may see the STRK token test the $0.035 support zone.
Investors should also keep an eye on broader market sentiment indicators, such as the Fear & Greed Index.
Historically, movements out of extreme fear have preceded market rebounds, suggesting that even in a downtrend, relief rallies are possible.
STRK price forecast
Starknet (STRK) remains in a cautious position, with short-term consolidation possible, although long-term direction is dependent on broader crypto market recovery and the success of strkBTC’s adoption within Starknet’s DeFi ecosystem.
The launch of strkBTC adds an important layer of fundamental support for STRK, as the token’s utility within the network is set to increase.
For short-term traders, the key levels to watch include the immediate support at $0.04 and the resistance at $0.045.
A break above $0.045 could signal the start of a more sustained recovery, especially if Bitcoin shows strength simultaneously.
Conversely, a drop below $0.04 would likely signal further downside toward $0.035, continuing the current bearish trend.

Retail activity in crypto fell off a cliff, and it seems they are moving elsewhere.
Spot volumes are down 25% to 30%, and Estimated Leverage Ratios have dropped 28%. This looks like capitulation, coming four months after Bitcoin topped at $126,000 and slid 46%.
Capital is rotating hard into equities. The old “buy the dip” reflex that defined the 2024–2025 run is fading. Liquidity on major exchanges is thinning, and instead of moving with tech stocks, crypto is starting to lose capital to them as traders choose stability over volatility.
Key Takeaways
- The Signal: Leverage Flushed: Estimated Leverage Ratios (ELR) plummeted from 0.1980 to 0.1414, wiping out speculative froth.
- The Data: Equities Rotation: Retail traders hit all-time high net inflows of $650 million into stocks and options in January 2026.
- The Outlook: Sideways Summer: Analysts predict range-bound action through mid-2026 as retail capital remains sidelined.
The Data Behind the Retail Crypto Liquidity Drain
The data is clear. The speculative engine has stalled. Estimated Leverage Ratios dropped 28%, sliding from 0.1980 to 0.1414.
Binance activity fell by about $4.71 billion, down 16.4%, with daily volume now near $24 billion. Without heavy retail participation, rebounds are weak and short-lived. Price is leaning on passive institutional flows rather than aggressive speculation.
The “digital gold” hype has cooled among short-term traders. After the fall from $126,000, fewer participants are willing to catch dips. The leverage reset suggests the high-risk crowd that drove the 2025 rally has either been liquidated or stepped aside.
People Are Moving From Crypto To Stocks
Retail is not moving to cash. It is moving to stocks.
In January 2026 alone, retail traders funneled $350 million into cash equities and more than $300 million into options. That is record flow. The shift is clear.
The BTC-to-Nasdaq volatility ratio has dropped below 2x. Stocks now offer comparable volatility with far smaller drawdowns. After a 46% Bitcoin correction, that trade-off looks rational to burned traders.
Institutions are still active in crypto through ETFs, but they provide floors, not frenzy. They accumulate quietly. They do not create viral rallies.
Meanwhile, the speculative energy has rotated to AI-driven equity names. Traders are using language models to dissect earnings and hunt for an edge in stocks. Compared to that, crypto currently looks opaque and momentum-starved.
Until retail risk appetite swings back, crypto is missing the explosive buy-side pressure that once fueled vertical moves.
Discover: Here are the crypto likely to explode!
The post Why Retail Is Moving From Crypto To Stock: Will They Comeback? appeared first on Cryptonews.


A new investigation claims that employees at crypto trading platform Axiom abused internal tools to access private user data and profit from insider trading.
Summary
- ZachXBT released a report accusing Axiom Exchange employees of misusing internal tools to track private wallets.
- The investigation linked leaked dashboards, recorded calls, and on-chain data to alleged insider trading and coordinated memecoin activity.
- Unusual betting on Polymarket before the reveal raised further questions about information leaks and market manipulation.
On Feb. 26, blockchain investigator ZachXBT published a detailed report on X accusing staff at Axiom Exchange of misusing internal dashboards to track private wallets and trade ahead of users.
According to the report, one of the main figures involved was Broox Bauer, known online as @WheresBroox, a senior business development employee based in New York. ZachXBT said Bauer had access to internal systems that allowed him to search users by referral code, wallet address, or user ID.
Internal tools allegedly used to track private wallets
Recordings and leaked screenshots reviewed by the investigator show Bauer discussing how he researched 10 to 20 wallets at first and expanded gradually to avoid detection. In one clip, he claimed he could “find out anything” about an Axiom user.
In another, he outlined rules for requesting lookups and offered to share full wallet lists.
Screenshots from April and August 2025 allegedly showed internal dashboards displaying private wallet connections for traders identified as “Jerry” and “Monix.” Bauer also discussed tracking users who traded the memecoin AURA.
ZachXBT said the group compiled this information into Google Sheets, mapping wallet addresses linked to prominent traders and influencers. Several of those named reportedly confirmed that the data matched their private wallets.
One targeted trader, Marcell, was known for accumulating large token supplies before promoting projects to followers. Investigators said such traders were attractive targets because their private wallets were rarely public, making internal data especially valuable.
On-chain analysis linked Bauer’s main wallet and related addresses to heavy memecoin trading. Funds were traced to multiple centralized exchange deposit wallets, although ZachXBT noted that confirming exact insider trades would require Axiom’s internal logs.
The report also mentioned other employees and associates, including Ryan (Ryucio), Gowno (Seb), and a moderator known as Mystery, as being involved in or aware of lookup activity.
Axiom was founded in 2024 and later joined Y Combinator’s Winter 2025 batch. ZachXBT said the company had generated more than $390 million in revenue to date.
Polymarket bettors realize huge profits
The investigation also triggered unusual activity on Polymarket, where users had previously bet on which company would be exposed. In the days before the report, the market saw more than $23 million in volume.
Two wallets reportedly placed nearly $60,000 in bets on Axiom just hours before the reveal and earned about $109,000, according to data shared by Lookonchain. “Insiders making money on a bet about insider trading — interesting,” Lookonchain remarked.
Another trader, “predictorxyz,” wagered $65,800 when odds were below 14% and later made more than $411,000. Some analysts suggested these trades may have relied on non-public information.
Following the report, Axiom released a statement saying it was “shocked and disappointed” by the alleged misuse of internal tools. The company said it had removed access to the systems involved and launched an internal investigation.
ZachXBT criticized Axiom for weak access controls, noting that business development staff could view full wallet histories, nicknames, and linked accounts. He added that the case may fall under the jurisdiction of the Southern District of New York because Bauer is based in New York.
Whether criminal charges follow remains unclear. However, the report has renewed concerns about employee oversight, data security, and insider risk within fast-growing crypto platforms.


The crypto market has faced sustained pressure in February, with prices struggling to build momentum amid declining stablecoin exchange reserves.
Summary
- CryptoQuant reports USDT reserves fell from $60B to $51.1B in two months, reducing market liquidity.
- Daily trading volumes are modest and active on-chain wallets have been declining.
- Analysts are split: VanEck calls it orderly deleveraging, while others warn of deeper losses if support breaks.
Bitcoin (BTC) has dropped by nearly 50% from its peak in October 2025 and by roughly 30% since the year began. Alongside the decline, there has been slower stablecoin growth, cautious interest rate signals from the Federal Reserve, and weaker U.S. manufacturing data.
Total market capitalization has fallen to around $2.3 trillion. At the same time, the Fear and Greed Index has slipped to cycle lows. Continued exchange-traded fund outflows have added to investor caution and reduced fresh capital entering the market.
Liquidity drain raises downside risks
On Feb. 26, CryptoQuant analyst TopNotchYJ warned that shrinking stablecoin reserves are becoming a major risk factor. Data shows that Tether (USDT) exchange balances fell from $60 billion to $51.1 billion in two months, a $9 billion decline that has tightened trading liquidity since January.
TopNotchYJ described the drop in USDT reserves as clear evidence of capital moving out of crypto markets. Stablecoins are the main source of trading activity, and falling balances usually signify a drop in investor confidence. Moving below $50 might put more selling pressure on major assets like XRP, ETH, and BTC.
The number of active wallet addresses has also rapidly decreased, from about 376,000 to 263,000. This shows that retail investors and institutional investors are taking a backseat. Price rebounds typically lose strength when there are fewer market participants, as demand naturally softens.
A similar pattern is visible in trading behavior. The daily volume has dropped by more than 6% to roughly $339 million. This indicates little speculative activity in the market, but it does not suggest widespread panic selling.
Short-term outlook and analyst views
Analysts remain divided, although most expect high volatility in the near term. Some warn that Bitcoin could slide another 20% to 30% if economic pressure continues, especially if support near $60,000 breaks. The $70,000 level continues to act as a major barrier to recovery.
Matthew Sigel of VanEck has described the recent decline as “orderly deleveraging.” He argues that leverage has cooled and that the market is adjusting rather than entering a full collapse.
Researchers at K33 Research see parallels with the late-2022 bottom. They point to fragile economic conditions and stagnant stablecoin supply as limits on short-term upside.
More positive views come from Bitwise Asset Management, which manages more than $15 billion. Their analysts continue to highlight Bitcoin’s long-term potential and see recent pullbacks as possible accumulation opportunities.
Several technical levels remain are now in focus. Support lies between $64,000 and $66,000, followed by $60,000 and the $50,000–$55,000 zone. Resistance is clustered near $70,000 and $80,000.
Until stablecoin reserves recover and user activity improves, analysts expect the market to stay vulnerable, with downside risks likely to persist in the coming weeks.
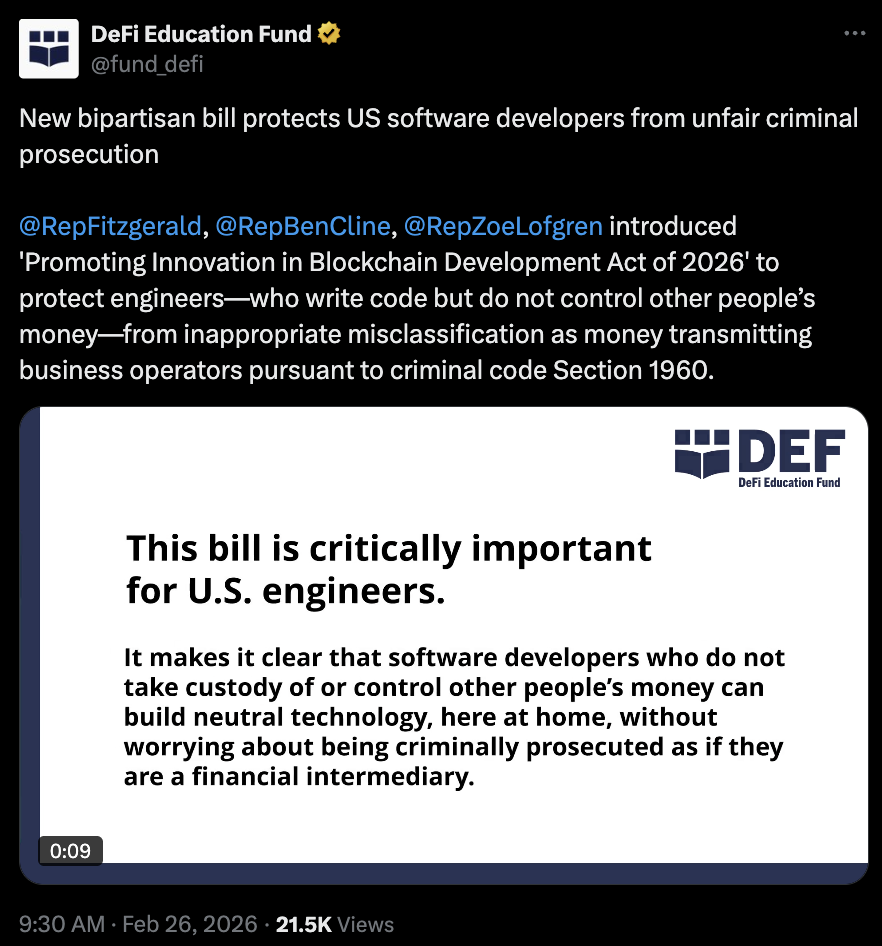
A bipartisan group of lawmakers in the US House of Representatives has introduced legislation aimed at halting prosecution of software developers who do not have custody or control of others’ crypto assets.
In a Thursday notice, Representatives Scott Fitzgerald, Ben Cline and Zoe Lofgren said that they would be sponsoring the Promoting Innovation in Blockchain Development Act in an effort to change how to handle criminal cases potentially involving blockchain developers.
The bill would clarify that Section 1960 under US federal law, on the “prohibition of illegal money transmitting businesses,” would apply only to actors with control of others’ digital assets.
At least two crypto advocacy organizations publicly supported the bill. The Blockchain Association called it a “critical step” to encourage US-based developers. The DeFi Education Fund (DEF) said the legislation would likely put a stop to prosecutions similar to those of Tornado Cash developer Roman Storm or the creators of the Samourai Wallet.
“[The bill] makes it clear software developers who do not take custody of or control other people’s money can build neutral technology, here at home, without worrying about being criminally prosecuted as if they are a financial intermediary,” said DEF.

It’s unclear whether the bill, if signed into law, would put a stop to previously filed cases against developers. Storm was found guilty of running an unlicensed money transmitter business in August 2025, while Samourai Wallet founders Keonne Rodriguez and Will Lonergan Hill pleaded guilty to similar charges in July and were later sentenced to five and four years in prison, respectively.
Related: US ‘crypto capital’ claim tested by developer prosecutions
As of Thursday, Storm had yet to be sentenced or face a possible retrial for two other charges.
US Senate to potentially address blockchain bill
Lawmakers in the US Senate have already pitched their own bill for developer protection. In January, Senators Cynthia Lummis and Ron Wyden introduced the Blockchain Regulatory Certainty Act, to clarify that developers writing code or maintaining networks don’t meet the requirements for being criminally liable as an unlicensed money transmitter.
In the meantime, the Senate has been considering how to move forward with a comprehensive digital asset market structure bill sent from the House in July 2025.
The CLARITY Act passed the Senate Agriculture Committee in January, but has yet to be addressed with a markup in the Senate Banking Committee. It’s unclear whether the final bill potentially passed by the full chamber could address developer protections, which face pushback from some lawmakers.
Magazine: Clarity Act risks repeat of Europe’s mistakes, crypto lawyer warns


A serial hacker is targeting DeFi lending protocols, with approximately $3.5 million stolen so far. In the latest incident, they exploited an oracle misconfiguration in lending platform Ploutos Money, leading to a loss of almost $400,000.
Crypto security firm CertiK noted that the project appears to have deleted its website and social media presence.
Read more: YieldBlox lending pool hit by $10M hack on Stellar
According to analysis by blockchain auditor BlockSec, Ploutos Money used Chainlink’s bitcoin (BTC)/USD feed as an oracle for USDC price. “The attacker was able to borrow 187 ether (ETH) by posting only eight USDC as collateral,” the post explains.
BlockSec also points to the timing of the exploit, just one block after the misconfiguration was confirmed. While the firm suggests “the attacker closely monitored and acted on the configuration change,” many of the replies to CertiK and BlockSec’s posts suspect insider involvement.
Pseudonymous blockchain investigator Tanuki42 linked the exploiter to at least four other hacks, including two million-dollar losses for Moonwell.
Last week, Moonwell was left with $1.8 million of bad debt when a misconfigured oracle returned a cbETH price of $1.12 instead of approximately $2,200. The code change which caused the loss had been co-authored by Claude Opus 4.6, alongside a Moonwell contributor.
Read more: DeFi, meet Claude: Moonwell’s ‘vibe-coded’ oracle in $1.8M blowup
The (bad) luck of the draw
Also today, in an apparently unconnected attack, Ethereum-based “private ZK lottery,” FOOM CASH, lost $1.6 million when its “broken ZK verifier” was compromised.
According to blockchain security firm QuillAudits, the project lost $1.3 million on Ethereum and $316,000 on Base. The firm’s analysis explains that the project’s use of its ZK verifier was flawed.
In setting two constants to the same value, “anyone can compute it [the verification equation], no secret needed.”
A similar attack affected Veil.Cash, a privacy protocol on Base, last week. However, losses were small at only 4.5 ETH, of which 2 ETH were recovered by white hats Decurity.
Got a tip? Send us an email securely via Protos Leaks. For more informed news and investigations, follow us on X, Bluesky, and Google News, or subscribe to our YouTube channel.


Bitrue reported a 212% surge in spot buying for XRP on February 26, with buy orders more than doubling sell pressure.
Bitrue said on February 26 that it recorded a 212% jump in XRP spot buying as institutional investors continued allocating capital through newly launched XRP exchange-traded funds (ETFs).
The exchange linked the spike to roughly $1.1 billion in cumulative ETF inflows, arguing that steady demand from funds and retail traders could tighten available supply in the months ahead.
Spot Buying Jumps as ETF Inflows Build
In a post on X, Bitrue said XRP buy orders on its platform outpaced sell orders by more than two to one.
“We recorded a 212% increase in XRP spot purchase volumes, outpacing the sell side by over 2x,” the exchange posted on X.
It attributed the imbalance to sustained institutional accumulation since the debut of XRP ETFs, which it claims have drawn $1.1 billion in net assets, even though data from SoSoValue showed there have been muted ETF flows in recent days.
However, the derivatives market tells a different story. According to CryptoQuant, XRP futures open interest has fallen across major platforms over the past 90 days, with Binance recording a decrease of 7.7 million XRP and Bybit showing a larger reduction of around 12 million tokens. Furthermore, the three-month moving average for XRP futures volume has dropped to its lowest level since November 2024, settling at approximately $87 billion.
Looking at XRP’s broader market structure, it was trading around $1.44 at the time of writing, up nearly 5% in the last 24 hours and about 2% during the week. Even so, the token is still down more than 23% over the past month and almost 38% across the past year, far below its July 2025 all-time high of $3.65.
Cooling Leverage Meets Steady Spot Demand
The divergence between spot accumulation and falling derivatives activity suggests a shift in market composition rather than uniform bullish momentum. Open interest now stands near $2.37 billion per CoinGlass figures, and the contraction in leveraged positions may reflect traders reducing risk after months of volatility.
You may also like:
From a price standpoint, XRP remains range-bound between $1.38 and $1.48 over the past 24 hours. One market watcher, CasiTrades, flagged resistance around $1.40 and $1.65, with support near $1.11 and $0.87. According to them, a sustained move above those resistance levels would likely require stronger follow-through from ETF inflows and broader market participation.
As such, considering the broader data, Bitrue’s reported spike in spot buying highlights firm exchange-level demand, but the wider data show a market that is rebalancing rather than accelerating.
Nonetheless, the crypto exchange is predicting that growing retail and corporate support could lead to a supply deficit that may push up the Ripple token’s performance enough to beat major rivals this year.
“With support increasing from retail and institutional levels, Bitrue is forecasting a potential supply squeeze, which will likely result in XRP outperforming key competitors over Q2 2026,” wrote Bitrue.
Binance Free $600 (CryptoPotato Exclusive): Use this link to register a new account and receive $600 exclusive welcome offer on Binance (full details).
LIMITED OFFER for CryptoPotato readers at Bybit: Use this link to register and open a $500 FREE position on any coin!
Man charged to court after alleged kidnapping in Derry

Burger King rolls out AI headsets that track employee 'friendliness'

Circle paid $461 million in distribution costs from $733 million reserve income in Q4


-

 Video7 days ago
XRP News: XRP Just Entered a New Phase (Almost Nobody Noticed)
-

 Politics5 days ago
Baftas 2026: Awards Nominations, Presenters And Performers
-

 Fashion6 days ago
Weekend Open Thread: Boden – Corporette.com
-

 Sports3 days ago
Women’s college basketball rankings: Iowa reenters top 10, Auriemma makes history
-

 Politics3 days ago
Nick Reiner Enters Plea In Deaths Of Parents Rob And Michele
-

 Business2 days ago
True Citrus debuts functional drink mix collection
-

 Crypto World3 days ago
XRP price enters “dead zone” as Binance leverage hits lows
-

 Business4 days ago
Mattel’s American Girl brand turns 40, dolls enter a new era
-

 Business4 days ago
Law enforcement kills armed man seeking to enter Trump’s Mar-a-Lago resort, officials say
-

 Tech2 days ago
Unsurprisingly, Apple's board gets what it wants in 2026 shareholder meeting
-

 NewsBeat22 hours ago
Cuba says its forces have killed four on US-registered speedboat | World News
-
 NewsBeat24 hours ago
Manchester Central Mosque issues statement as it imposes new measures ‘with immediate effect’ after armed men enter
-
 NewsBeat4 days ago
‘Hourly’ method from gastroenterologist ‘helps reduce air travel bloating’
-

 Tech4 days ago
Anthropic-Backed Group Enters NY-12 AI PAC Fight
-

 NewsBeat4 days ago
Armed man killed after entering secure perimeter of Mar-a-Lago, Secret Service says
-

 Politics4 days ago
Maine has a long track record of electing moderates. Enter Graham Platner.
-
 NewsBeat2 days ago
Police latest as search for missing woman enters day nine
-

 Business18 hours ago
Discord Pushes Implementation of Global Age Checks to Second Half of 2026
-

 Crypto World2 days ago
Entering new markets without increasing payment costs
-
 Sports3 days ago
2026 NFL mock draft: WRs fly off the board in first round entering combine week