
Crypto World
Decentralized AI is in a trough but real opportunities are emerging, crypto VCs say


The intersection of crypto and artificial intelligence (AI) has entered a quieter, more selective phase, according to two prominent venture capitalists.
Anand Iyer of Canonical Crypto and Kelvin Koh of Spartan Group described the current climate as a post-hype moment for decentralized AI protocols, with capital and talent shifting toward more focused, utility-driven applications during Consensus Hong Kong 2026.
“I think we’re in the trough right now,” said Iyer, whose San Francisco-based firm backs early-stage infrastructure and applications built on decentralized networks. “We went through a frothy period. Now it’s about figuring out where the real strength lies.”
Both Iyer and Koh criticized what they see as overinvestment in GPU marketplaces and attempts to build decentralized alternatives to large AI models like those from OpenAI or Anthropic. The capital required, Koh noted, is “night and day” compared to what’s available in crypto.
Instead, they see potential in purpose-built, full-stack solutions, tools that start with a specific problem and build down to the model, compute, and data layers.
Iyer pointed to startups skipping expensive SaaS tools and using AI to build custom internal systems in days. “Speculation won’t drive product anymore,” he said. “We have to think about users first.”
Both investors emphasized the importance of proprietary data, regulatory advantages, or go-to-market edges as new forms of competitive moats.
For founders looking to raise capital, Koh offered blunt advice: “Twelve months ago, it was enough to have a wrapper on ChatGPT. That’s no longer true.”


Ripple CEO Brad Garlinghouse framed stablecoins as the crypto sector’s potential “ChatGPT moment” for enterprise payments, arguing that faster, more efficient settlements could accelerate real-world adoption among large corporations. In an interview with FOX Business on Friday, he said boards of directors and chief financial officers at Fortune 500 and Fortune 2000 companies are already asking treasurers how stablecoins could fit into their operations, signaling a shift from experimentation to formal strategy.
Garlinghouse described the move as an “unlock” for corporate finance, arguing that giving treasurers a credible on-chain settlement option could accelerate the broader adoption of blockchain-enabled services. He suggested stablecoins could serve as an entry point to a wider ecosystem of digital-asset tools used by enterprises, beyond just payments.
Bloomberg Intelligence has projected that stablecoin payment flows could grow at roughly an 80% compound annual rate to about $56.6 trillion by 2030, underscoring the potential scale if regulation and infrastructure align with demand.
Garlinghouse also highlighted the sheer volumes already moving through stablecoins. He noted that last year stablecoins processed more than $33 trillion in trading volume, with nearly 90% of that activity coming from Tether’s USDt (USDT) and Circle’s USDC, illustrating the current concentration of liquidity in a small handful of assets.
Ripple’s foray into the stablecoin space includes RLUSD, a competitor stablecoin launched in December 2024. CoinGecko data shows RLUSD stands as the 10th-largest stablecoin by market cap, with about $1.4 billion in circulation.
Beyond stablecoins themselves, Garlinghouse highlighted Ripple’s broader push to bolster payments infrastructure through strategic acquisitions. The company bought Hidden Road, an institutional-focused prime brokerage, for $1.25 billion and GTreasury, a corporate treasury platform, for $1 billion. He said the acquisitions have helped Ripple enter a “record quarter” and that the firm has been “on a tear” since closing these deals.
Key takeaways
- Enterprises are increasingly viewing stablecoins as a payments enabler, with senior executives pressing treasurers to outline deployment plans.
- Global stablecoin trading volume last year exceeded $33 trillion, with about 90% concentrated in USDT and USDC, underscoring existing liquidity leadership.
- Ripple operates RLUSD, launched in December 2024, now ranking 10th among stablecoins by market cap at roughly $1.4 billion (per CoinGecko).
- Ripple’s acquisitions of Hidden Road ($1.25 billion) and GTreasury ($1 billion) are positioned to bolster enterprise payments and treasury management capabilities.
- Regulatory context matters: the CLARITY Act could accelerate crypto adoption if enacted, but policymakers must avoid weaponizing policy for political ends, according to Garlinghouse.
- Bloomberg Intelligence foresees stablecoin flows reaching $56.6 trillion by 2030, highlighting the potential scale of enterprise demand.
Stablecoins as a corporate catalyst
The conversation around stablecoins increasingly centers on real-world corporate utility. Garlinghouse framed the narrative around a critical shift: boards and CFOs are evaluating how stablecoins could streamline treasury operations, enable faster cross-border settlements, and unlock a broader set of blockchain-based services for their organizations. In this view, stablecoins are less about speculative trading and more about providing a practical, on-chain settlement layer that can integrate with existing financial workflows.
The enterprise lens also emphasizes risk management and liquidity considerations. Real-time settlements and improved cash visibility could reduce foreign exchange exposure and nested settlement delays that plague traditional cross-border payments. While these advantages exist in theory, they hinge on reliable rails, robust custody, compliance, and interoperability with conventional banking rails—a set of criteria Ripple has sought to address through its product suite and partnerships.
Ripple’s push to enterprise infrastructure
RLUSD represents Ripple’s commitment to building a native stablecoin option within its payments ecosystem. Launched in late 2024, RLUSD has quickly become a test case for how corporate users might leverage stablecoins to settle obligations on Ripple’s rails. According to CoinGecko, RLUSD ranks among stablecoins with a $1.4 billion market cap, placing it in the top tier of on-chain stablecoins by liquidity and size.
Concurrently, Ripple’s strategic acquisitions broaden the toolkit available to enterprises. Hidden Road provides institutional-grade prime brokerage capabilities, potentially easing access to liquidity and trading infrastructure for large clients. GTreasury, a corporate treasury management platform, adds cross-functional treasury tools, enabling better visibility and control over digital-asset holdings within corporate finance operations. Garlinghouse said these acquisitions have strengthened Ripple’s trajectory, contributing to what he described as a “record quarter.”
Taken together, the RLUSD initiative and the strengthened payments backbone position Ripple to offer a more complete enterprise solution: on-chain settlement via stablecoins, coupled with governance, liquidity, and treasury management tools designed for large organizations. For investors and users watching adoption curves, the question is how quickly these capabilities translate into tangible enterprise uptake and steady revenue streams for Ripple and its partners.
Regulatory context and market outlook
The regulatory backdrop remains a pivotal variable in the trajectory of stablecoins and enterprise crypto adoption. Garlinghouse emphasized the potential impact of market-structure legislation such as the CLARITY Act, arguing that Congress could push the sector forward if crafted with clarity and sound policy. He warned against policymakers weaponizing regulation for political ends and urged a measured approach that protects the United States’ competitive standing while fostering innovation.
The broader market context underscores why this regulatory moment matters. The ongoing debate around stablecoin disclosures, reserve standards, and liquidity requirements will influence whether corporate treasuries view stablecoins as a reliable part of their long-term liquidity strategy. As policymakers weigh risk controls and consumer protections, the ability for enterprises to adopt stablecoins at scale will hinge on clear, consistent rules and interoperable infrastructure that can withstand institutional scrutiny.
Looking ahead, the market will be watching how the CLARITY Act progresses through Congress and how Ripple, RLUSD, and related infrastructure adapt to any regulatory requirements. The combination of a strong enterprise narrative, improving payments infrastructure, and a favorable regulatory framework could accelerate corporate engagement with stablecoins, while lingering ambiguities or policy missteps could slow momentum.
Ultimately, the next phase of enterprise crypto adoption will hinge on demonstrated use cases, governance reliability, and the ability to deliver on real-world efficiency gains. For investors and builders, the key watch points are enterprise interest in RLUSD and Ripple’s broader treasury-management story, regulatory developments around stablecoins, and the degree to which large corporations actually embed stablecoins into their treasury operations and payment workflows.
As policymakers deliberate and corporates experiment, the landscape will reveal whether this era’s “ChatGPT moment” translates into durable, enterprise-grade crypto infrastructure and a measurable shift in how businesses move value across borders.
Watch for updates on CLARITY Act progress, RLUSD adoption by enterprises, and any new milestones from Ripple’s expanding payments ecosystem in the coming quarters.
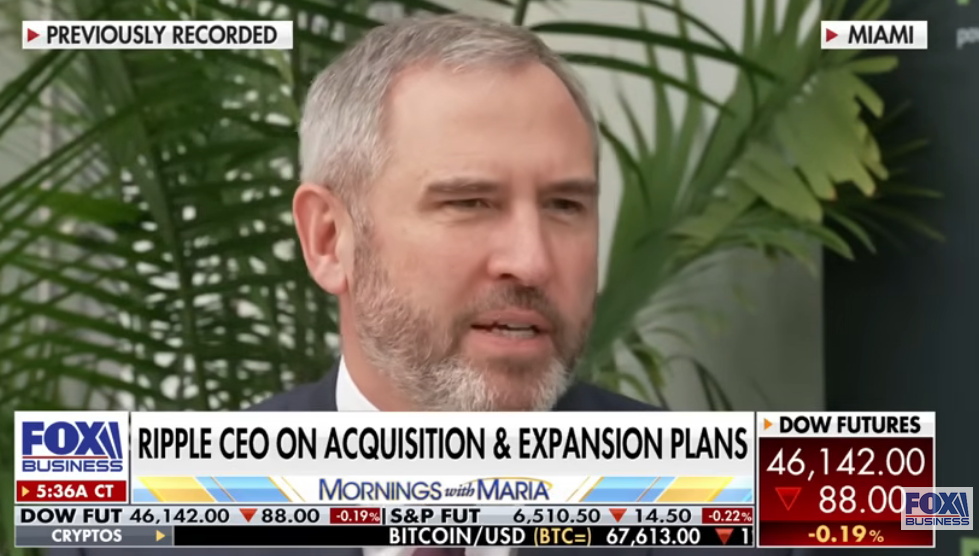
Ripple CEO Brad Garlinghouse said stablecoins will be the crypto sector’s “ChatGPT moment” for businesses in search of faster, more efficient payments, and that many companies are already discussing and strategizing how to implement stablecoins into their operations.
“You have boards of directors and CEOs of companies, whether it’s Fortune 500 or Fortune 2000, they’re asking their treasurers, they’re asking their CFOs, hey, what are we doing with stablecoins,” Garlinghouse told FOX Business on Friday.
“Giving the treasurer and the CFO that option is the unlock,” he said.
Garlinghouse said this unlock would be “the ChatGPT moment of crypto” because it would be the entry point for businesses to access a broader range of blockchain-based services.

Bloomberg Intelligence predicted in early January that stablecoin flows could increase at a compounded annual growth rate of 80% to $56.6 trillion by 2030, a rise that would make stablecoins one of the most important payment tools in global finance.
Garlinghouse noted that stablecoins processed more than $33 trillion in trading volume last year, though nearly 90% of that came from Tether’s USDt (USDT) and Circle’s USDC (USDC).
Ripple launched a competitor stablecoin — Ripple USD (RLUSD) — in December 2024, which is currently the 10th largest stablecoin by market cap at $1.4 billion, CoinGecko data shows.
Ripple also strengthened its blockchain payments infrastructure last year with the acquisition of institutional-based prime brokerage Hidden Road for $1.25 billion and corporate treasury platform GTreasury for $1 billion.
Related: White House crypto adviser says banks shouldn’t fear stablecoin yield
Meanwhile, Garlinghouse said Ripple is set to have a “record quarter,” adding that the company has been “on a tear” since the Hidden Road and GTreasury acquisitions.
Market structure legislation will push crypto industry forward
Garlinghouse said stablecoin payments and broader blockchain adoption would be accelerated by the CLARITY Act, should it pass Congress and be signed into law.
“A lot of eyes are on what is US regulation going to look like and is it going to get done,” he said. “We want to make sure we can’t have another Gary Gensler moment where they try to weaponize policy in a way that is about politics, not about what’s good for the United States.”
Magazine: XRP yet to ‘price in’ 3 bullish catalysts, Bitcoin to $80K? Trade Secrets
The bitcoin mining industry is undergoing the most fundamental transformation in its history, and the clearest sign isn’t the hashrate or the difficulty adjustments. It’s the balance sheets.
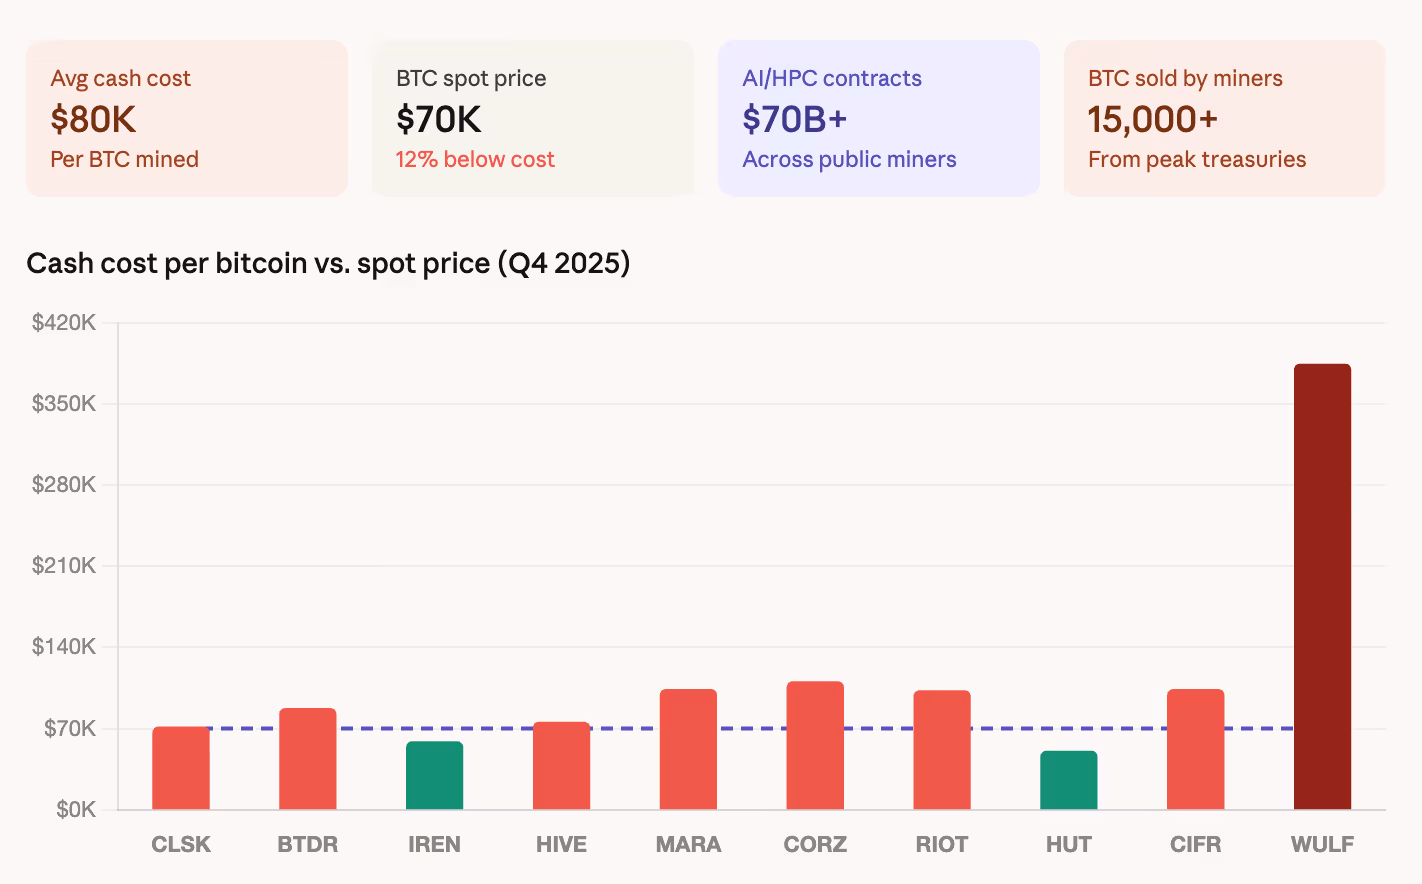
CoinShares’ Q1 2026 mining report, published this week, reveals that the weighted average cash cost to produce one bitcoin among publicly listed miners rose to approximately $79,995 in Q4 2025.
Bitcoin has traded in the $68,000 to $70,000 band, with a CoinDesk report last week estimating losses of $19,000 per BTC mined.
These numbers aren’t sustainable, and the industry knows it. The response has been a wholesale pivot toward artificial intelligence infrastructure that is reshaping what these companies actually are.

Over $70 billion in cumulative AI and high-performance computing contracts have now been announced across the public mining sector, according to the CoinShares report. CoreWeave’s expanded deal with Core Scientific alone is worth $10.2 billion over 12 years. TeraWulf has $12.8 billion in contracted HPC revenue. Hut 8 signed a $7 billion, 15-year lease for AI infrastructure at its River Bend campus. Cipher Digital has a multi-billion-dollar agreement with Google-backed Fluidstack.
Listed miners could derive as much as 70% of their revenue from AI by the end of 2026, up from roughly 30% today. Core Scientific’s AI colocation revenue already accounts for 39% of its total. TeraWulf is at 27%. IREN is at 9% and scaling rapidly with up to 200 megawatts of liquid-cooled GPU capacity under construction.
That means these mining companies are increasingly becoming data center operators that happen to still mine bitcoin on the side.
The economics explain why. According to CoinShares, the cost differential between bitcoin mining infrastructure at roughly $700,000 to $1 million per megawatt and AI infrastructure at $8 million to $15 million per megawatt is wide, but AI offers structurally higher and more stable returns.
Hash price, the metric that determines miner revenue per unit of computing power, hit an all-time post-halving low of roughly $28 to $30 per petahash per day in early March.
At those levels, miners running mid-generation hardware need access to electricity below $0.05 per kilowatt-hour to remain cash-profitable. Meanwhile, AI infrastructure contracts promise margins above 85% with multi-year revenue visibility.
How the financials work
The transition is being financed in two ways, and both are visible in the data, the report explained.
First, debt. The sector’s aggregate leverage has fundamentally changed. IREN now carries $3.7 billion in convertible notes across five series. TeraWulf has $5.7 billion in total debt, split between convertible notes and senior secured notes at its compute subsidiary.
Cipher Digital issued $1.7 billion in senior secured notes in November, causing its quarterly interest expense to surge from $3.2 million for the first nine months to $33.4 million in Q4 alone. These are not mining-scale debt loads. These are infrastructure-scale bets that the AI revenue will materialize fast enough to service the obligations.
Second, bitcoin sales. Publicly listed miners have collectively reduced their BTC treasuries by over 15,000 BTC from peak levels. Core Scientific sold roughly 1,900 BTC worth $175 million in January and is planning to liquidate substantially all remaining holdings in Q1 2026. Bitdeer reduced its treasury to zero in February. Riot Platforms sold 1,818 BTC worth $162 million in December.
Even Marathon, the largest public holder at 53,822 BTC, quietly expanded its policy in its March 10-K filing to authorize sales from its entire balance sheet reserve, partly driven by pressure on its $350 million bitcoin-backed credit facility where the loan-to-value ratio climbed to 87% as prices fell toward $68,000.

The miners that are selling bitcoin to fund AI buildouts are the same companies whose mining operations secure the bitcoin network. That creates a tension at the heart of the transition. When mining is unprofitable and AI is lucrative, the rational economic decision is to reallocate capital away from mining. But if enough miners do that, the network’s security budget shrinks.
The hashrate data already reflects this. The network peaked at approximately 1,160 exahashes per second in early October 2025 and has since declined to roughly 920 EH/s, with three consecutive negative difficulty adjustments, the first such streak since July 2022.
The valuation market has already priced the bifurcation. Miners with secured HPC contracts now trade at 12.3 times next-twelve-month sales. Pure-play miners trade at 5.9 times. The market is paying more than double for the AI exposure, which reinforces the incentive to pivot further.
The geographic picture is shifting alongside the economics, meanwhile. The United States, China, and Russia now control roughly 68% of global hashrate. The U.S. gained about 2 percentage points of market share in Q4 alone.
But emerging markets are entering the picture. Paraguay and Ethiopia have joined the global top 10 mining countries, driven by HIVE’s 300-megawatt operation in Paraguay and Bitdeer’s 40-megawatt facility in Ethiopia.
Hashrate forecasts and estimates
CoinShares forecasts the network hashrate will reach 1.8 zetahashes by the end of 2026 and 2 zetahashes by end of March 2027, one month later than previously predicted.
But that forecast depends on bitcoin recovering to $100,000 by year-end. If prices stay below $80,000, CoinShares expects hash price to continue falling and the hashrate to decline further as more miners exit.
A sustained move below $70,000 could trigger larger capitulation that, paradoxically, benefits survivors through lower difficulty.
Next-generation hardware offers a potential lifeline. Bitmain’s S23 series and Bitdeer’s proprietary SEALMINER A3, both operating below 10 joules per terahash, are expected at scale through the first half of 2026. These machines would roughly halve the energy cost per bitcoin compared to current mid-generation fleets. But deploying them requires capital that many miners are directing toward AI instead.
The bitcoin mining industry entered this cycle as a group of companies that secured the network and accumulated bitcoin. It is exiting as a group of companies that build AI data centers and sell bitcoin to fund them.
Whether that’s a temporary response to unfavorable economics or a permanent structural shift depends on one variable: the price of bitcoin. If it returns to $100,000, mining margins recover and the AI pivot slows. If it stays at $70,000 or below, the transition accelerates and the mining sector as it existed for the past decade continues to disappear into something else entirely.

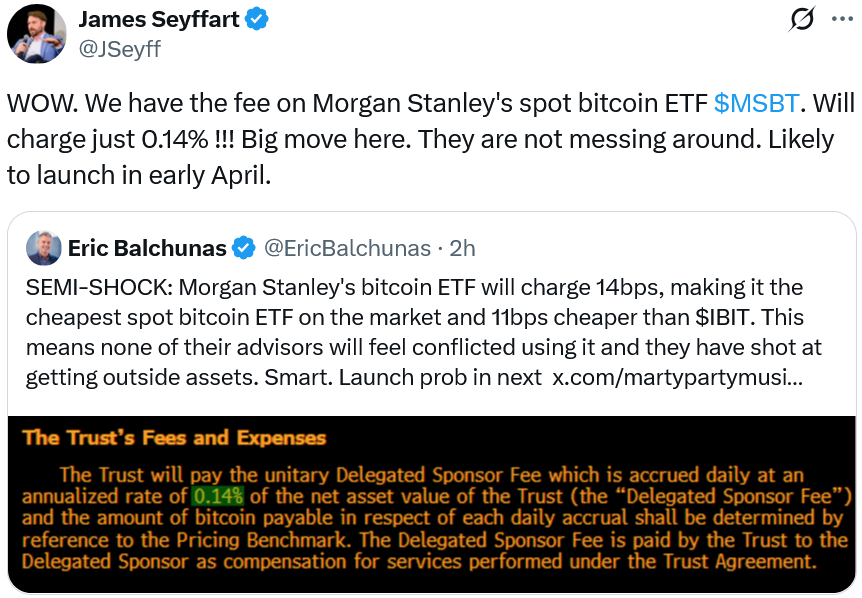
Morgan Stanley is accelerating its crypto ambitions with a plan to launch a spot Bitcoin ETF priced at 0.14% in annual fees. If approved, the vehicle would be the cheapest spot BTC offering in the U.S. market and could push rival fund sponsors to trim fees to stay competitive. The filing appears in the bank’s latest S-1 registration materials and signals a serious intent to broaden access to Bitcoin exposure for Morgan Stanley’s client base.
Industry observers say the move, paired with the bank’s broader crypto strategy, could reshape the U.S. ETF landscape. Bloomberg ETF analyst James Seyffart flagged the filing as a “big move” and forecast an early-April launch for the Morgan Stanley Bitcoin Trust (MSBT). Fellow Bloomberg analyst Eric Balchunas noted the ultra-low fee would be attractive to Morgan Stanley’s advisory network, which manages trillions of dollars in client assets, potentially easing internal conflicts over recommendations. The price tag—0.14%—would sit just a hair below the Grayscale Bitcoin Mini Trust ETF and meaningfully under BlackRock’s iShares Bitcoin Trust ETF, underscoring the fee-pressure dynamic across the space.
Beyond the fee structure, the development underscores Morgan Stanley’s evolving stance on crypto as part of a broader suite of products and services. The bank’s early 2020s shift toward crypto included appointing Amy Oldenburg to lead its digital asset team and pursuing a national banking charter to custody digital assets and execute purchases, sales, and swaps for clients, including staking services. Morgan Stanley previously identified Coinbase and Bank of New York Mellon as the prospective custodians for its Bitcoin ETF, a detail that helps frame how the bank intends to operationalize a spot-BTC product for a traditionally risk-averse client base.
Key takeaways
- The proposed 0.14% fee for Morgan Stanley’s spot Bitcoin ETF would be the lowest in the U.S. market at launch, positioning the bank as a potential price leader and prompting peers to consider fee reductions to retain assets.
- If the SEC approves MSBT, Morgan Stanley would become the first traditional bank to issue a U.S. spot BTC ETF, expanding access to crypto exposure for high-net-worth clients and broader Morgan Stanley advisory channels.
- The move sits within a broader crypto push: Morgan Stanley has filed for a staking Ether ETF and has sought a national trust charter to custody digital assets and trade crypto for clients, signaling a multi-pronged strategy beyond a single ETF product.
- Analysts foresee an early-April launch window for the MSBT, suggesting the bank is moving with pace to bring a regulated, traditional-finance gateway to Bitcoin into its product lineup.
Strategic significance for Morgan Stanley and the market
The 0.14% fee is not just a stat; it signals a strategic pivot with potential ripple effects. For Morgan Stanley, a successful, low-cost spot BTC ETF would enable seamless integration into its existing advisory framework. As Balchunas noted, the soft price point reduces potential conflicts for roughly 16,000 financial advisors who oversee about $6.2 trillion in client assets, potentially making it easier to recommend cryptocurrency exposure within conventional portfolios. For the broader market, the introduction of a bank-backed spot BTC ETF could heighten competition among ETF providers to offer low-cost, accessible crypto exposure, potentially accelerating adoption among institutions and high-net-worth individuals.
The path remains contingent on regulatory approval. A green light from the U.S. Securities and Exchange Commission would mark a milestone not just for Morgan Stanley but for the broader integration of traditional finance with regulated crypto products. The bank’s broader crypto orchestration—ranging from a Solana ETF filed in January to staking-related offerings and a declared charter to custody and trade digital assets—paints a picture of a lane-change moment for Wall Street institutions that have historically approached crypto with caution.
What comes next and what to watch
Investors and crypto observers should monitor several moving parts. First, the SEC’s decision on MSBT will determine whether a bank-backed spot BTC ETF can enter the market with a capital-light, cross-sell approach through Morgan Stanley’s vast advisory network. The timing remains uncertain beyond signals from analysts about an early-April launch, but any formal approval would intensify a fee-competition dynamic already visible across existing U.S. spot BTC ETFs.
Second, Morgan Stanley’s broader crypto agenda—its staking ETH ETF, custody capabilities, and the possibility of additional crypto products—will shape how the bank positions itself as a regulated gateway to digital assets. The custodial framework with potential partners like Coinbase and BNY Mellon will influence both product design and client trust as the firm seeks to democratize access without compromising risk controls.
Third, the market will closely watch how competitors respond. If Morgan Stanley’s 0.14% fee sets a new baseline, rival asset managers may need to recalibrate fee structures, custody arrangements, and distribution strategies to maintain market share among sophisticated investors seeking regulated exposure to Bitcoin.
Lastly, the regulatory trajectory for spot crypto ETFs remains a central theme. While a bank-run product could gain traction, final approvals will hinge on how regulators assess custody standards, liquidity, and investor protection in a landscape evolving toward deeper institutional participation in digital assets.
In sum, Morgan Stanley’s proposed MSBT at a sub-0.15% fee underscores a broader move by legacy financial institutions to normalize and scale regulated crypto exposure. If approved, the impact would extend beyond a single ETF—potentially reshaping fee benchmarks, distribution dynamics, and the pace at which traditional finance fully embraces digital assets in its core client offerings.
Readers should keep an eye on regulatory updates, Morgan Stanley’s official disclosures regarding the MSBT timeline, and any shifts in the competitive landscape as major banks and fund sponsors recalibrate their crypto product menus in response to this development.
Investment bank Morgan Stanley is seeking to launch its spot Bitcoin exchange-traded fund at a 0.14% fee, which would make it the cheapest in the US market and potentially force rivals to cut fees to stay competitive.
The 0.14% fee, proposed in Morgan Stanley’s latest S-1 registration statement on Friday, would be one basis point below the Grayscale Bitcoin Mini Trust ETF (BTC), currently the cheapest in the US market, and 11 basis points below the BlackRock-issued iShares Bitcoin Trust ETF (IBIT).
“Big move here. They are not messing around,” Bloomberg ETF analyst James Seyffart said, predicting that the Morgan Stanley Bitcoin Trust (MSBT) is “likely to launch in early April.”

Fellow Bloomberg ETF analyst Eric Balchunas said the low fee means that none of Morgan Stanley’s roughly 16,000 financial advisors — which manage $6.2 trillion in client assets — would feel conflicted in recommending the product to its clients.
Given that spot Bitcoin ETFs track the price movements of Bitcoin (BTC), Morgan Stanley’s ultra-low fee could spark a fresh fee war in the $83 billion market, putting immediate pressure on rivals to cut costs or risk losing assets.
Regulatory approval would make Morgan Stanley the first bank to issue a spot Bitcoin ETF, expanding access to Bitcoin exposure for millions of its high-net-worth clients.
“They are the ultimate gatekeepers of rich boomer money,” Balchunas added.
Morgan Stanley previously selected Coinbase and Bank of New York Mellon as the proposed custodians for its Bitcoin ETF.
Morgan Stanley seeking suite of crypto ETFs, banking charter
Morgan Stanley, previously one of the more crypto-hesitant Wall Street firms, filed for the spot Bitcoin ETF in the first week of January, along with a Solana (SOL) ETF.
Related: Bitcoin traders see 53% odds of sub-$66K BTC by April 24
It then filed papers for a staked Ether (ETH) ETF later that week, and by the end of the month, the bank appointed one of Morgan Stanley’s longest-standing executives, Amy Oldenburg, to lead its digital asset team.

Morgan Stanley also applied for a national trust banking charter on Feb. 18, seeking to custody certain digital assets and execute purchases, sales and swaps for clients in addition to staking services.
In October, before the investment bank adopted its institutional crypto strategy, it recommended a 2% to 4% allocation to crypto portfolios for investors. It also allowed its financial advisors to recommend crypto funds to clients with individual retirement accounts (IRAs) and 401(k)s.
Magazine: Bitcoin may face hard fork over any attempt to freeze Satoshi’s coins
Crypto World
XRP Price Prediction in 2026: MARA Sells $1.1B in BTC While Pepeto Targets 100x Over Coins Like XRP and DOT

Mortgage rates at 7% are trapping American families in $2,300 monthly payments for 30 years, and the XRP forecast pointing toward 16% annual growth is not going to change that math for anyone. MARA just sold 15,133 Bitcoin for $1.1 billion to cut its debt by 30%, and that tells the reader everything about what even the largest miners think about holding BTC at these levels.
The XRP forecast is one conversation, but Pepeto is a different one entirely, with more than $8 million raised, a verified exchange already running, and analysts projecting 100x as the Binance listing approaches, the kind of entry that pays off the house.
MARA Holdings sold 15,133 Bitcoin for approximately $1.1 billion between March 4 and March 25, using the proceeds to repurchase $1 billion in convertible notes at a 9% discount according to Bitcoin Magazine.
The move cuts MARA’s debt by 30%. According to Phemex, the market showed little reaction suggesting the sale was anticipated. The XRP forecast sits at 16% while presale entries target 100x, and the gap between those numbers is the gap between 30 more years of payments and owning the house.
The Real Opportunity and Why the XRP Forecast Points Somewhere Else
Pepeto: The Exchange Where One Entry Pays Off the Mortgage While the XRP Price Prediction Delivers 16%
MARA needed to sell $1.1 billion in BTC just to manage debt, while the wallets entering Pepeto at presale are building positions that target 100x from one listing event. Pepeto is the exchange that gives every wallet the protection institutional desks keep for themselves, and the XRP forecast is not the path to the kind of returns that clear a $2,300 monthly mortgage payment permanently.
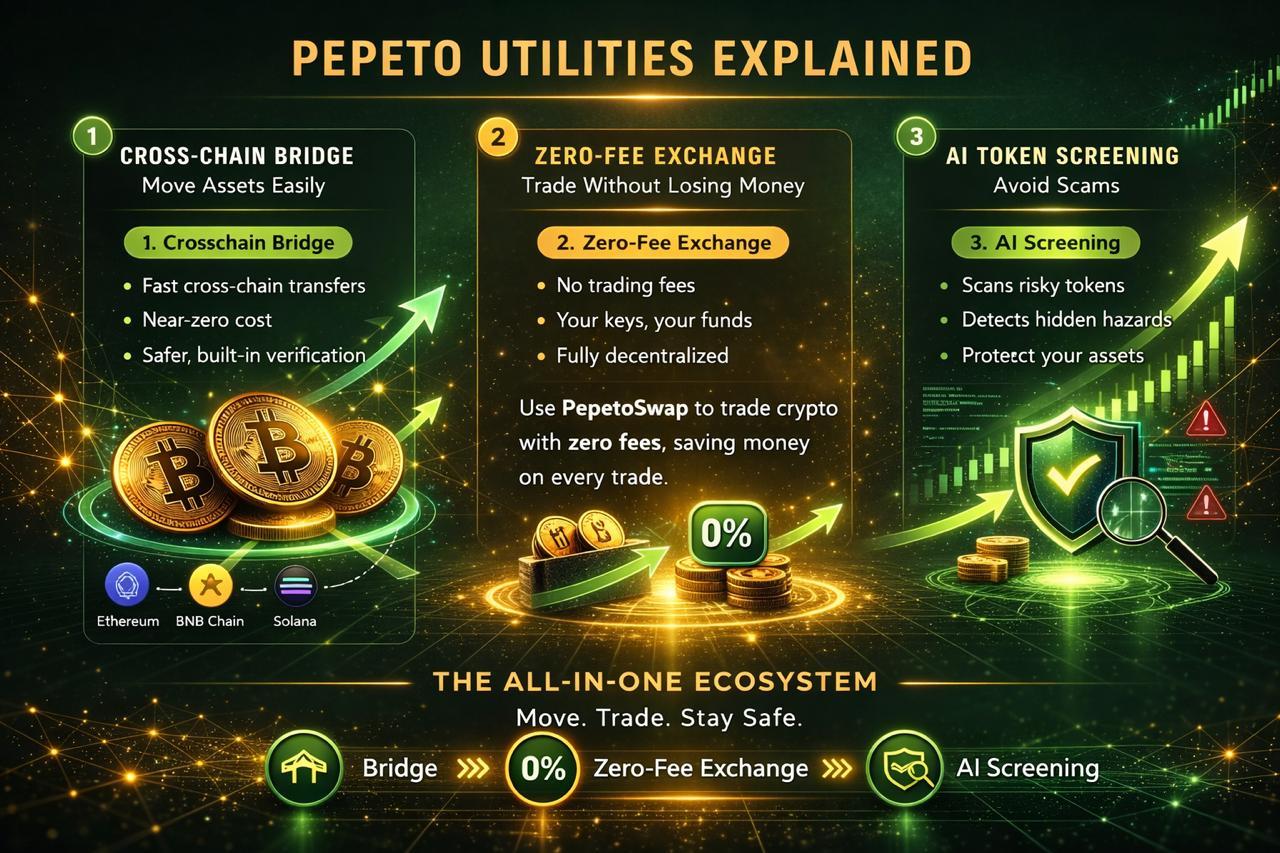
PepetoSwap processes every trade at zero commission so capital stays fully deployed, the network bridge transfers tokens across chains at no deduction, and the pre entry scanner confirms every contract is clean before capital commits, confirmed by a SolidProof audit.
The builder who launched the first Pepe token to an $11 billion valuation with zero utility assembled this platform with an experienced operator from Binance’s listing division, and more than $8 million raised during a Fear and Greed reading of 10 proves whale capital is positioned inside.
The people who bought Pepe coin during its presale turned small entries into fortunes that most investors spend entire careers chasing, and every one of them says they wish they had entered bigger. Analysts project 100x from the current entry at $0.000000186, and 192% APY staking rewards grow the holdings of every wallet inside as the listing draws closer. The same window is open right now, and the Binance listing is approaching fast.
XRP
XRP trades at $1.34 per CoinMarketCap, sitting well below its 200 day moving average with a neutral RSI of 52 and medium volatility.
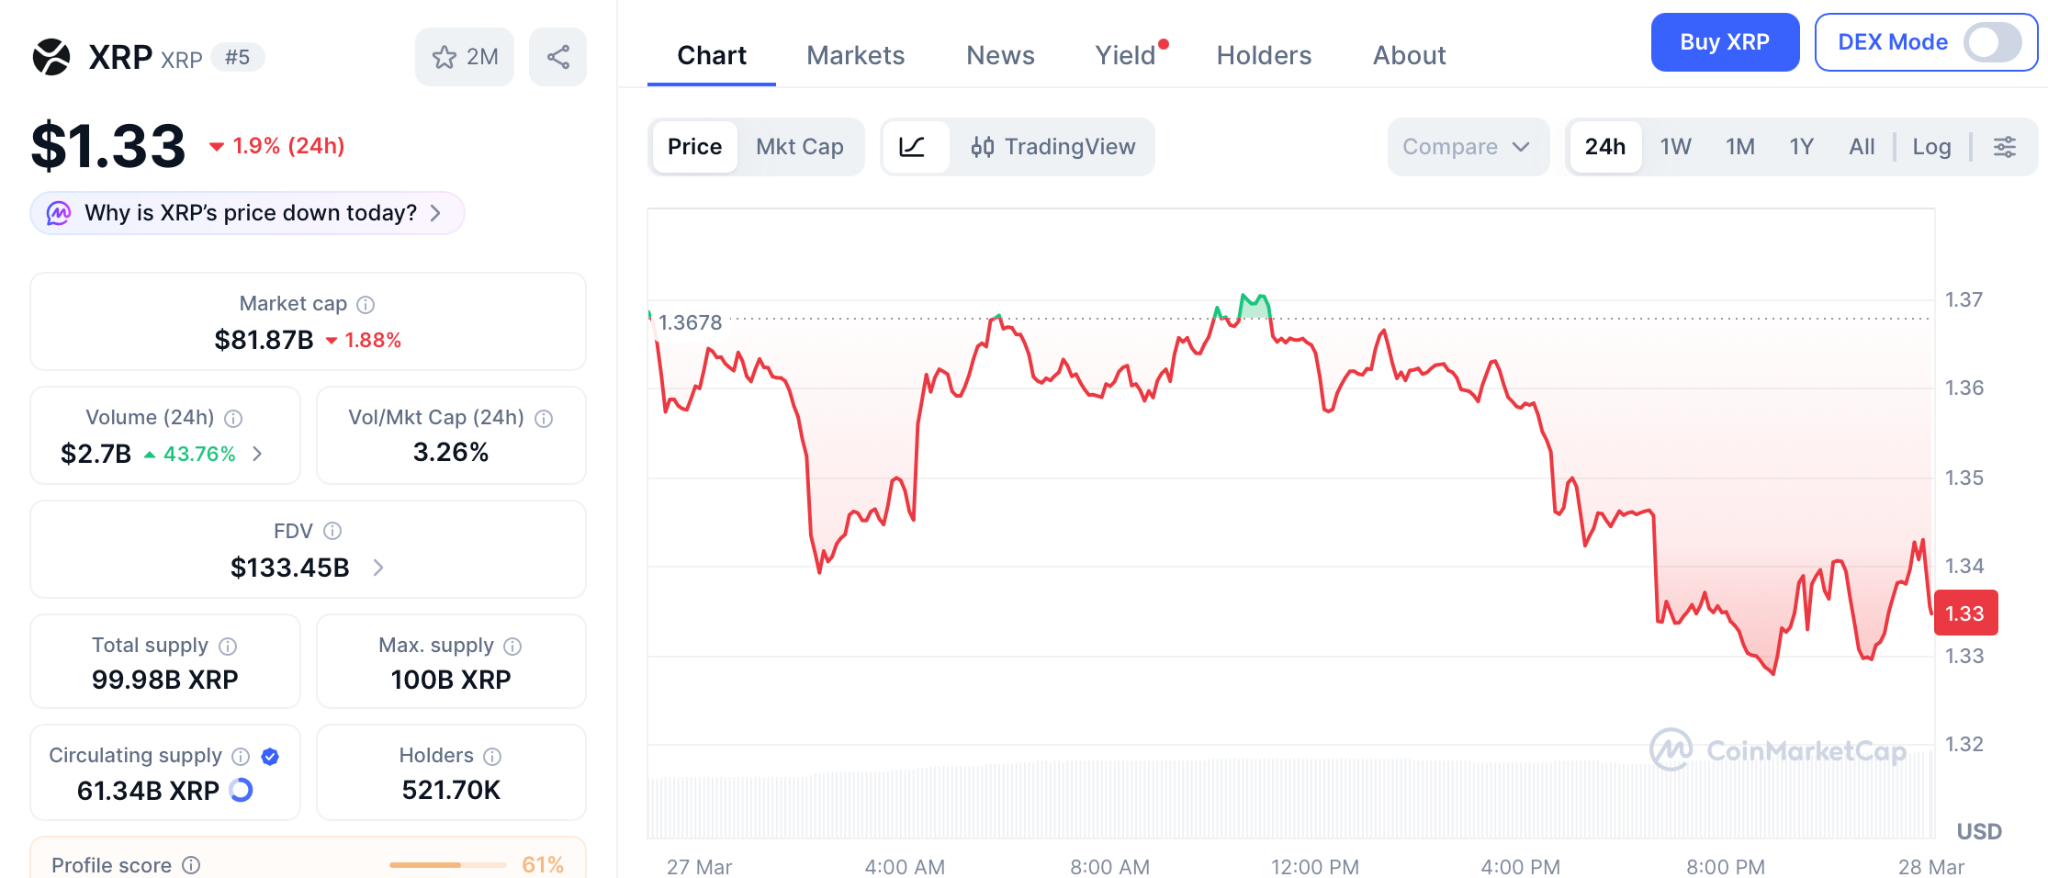
The xrp price prediction for 2026 targets $1.69 at maximum, a 25% return over months, meaningful for patient holders but far from the math that pays off a mortgage, while the forecast conversation is shifting toward presale entries where $2,300 monthly mortgage payments become a memory from one listing event.
Polkadot (DOT)
DOT trades at $1.28 per CoinGecko, deep in extreme fear territory with the index at 11, trading well below its 200 day moving average of $2.50.
Models project DOT falling to $0.66 by 2030, a 48% decline over four years, and established tokens like XRP and DOT share the same structural problem: neither can deliver the multiples that presale entries produce.
The XRP Price Prediction Delivers 16% but the Wallets That Entered Pepe’s Presale Built Fortunes
MARA just sold $1.1 billion in BTC to manage debt, and the xrp price prediction points toward 16% while American families carry $2,300 mortgage payments for 30 years. The people who entered Pepe’s presale turned small positions into the kind of wealth most investors chase for entire careers, and no large cap recovering from this crash delivers the returns that pay off a house.
The same window is open right now through the Pepeto official website, and the Binance listing is approaching, which means once Pepeto lists the presale entry disappears permanently and the wallets inside hold the positions that turn $2,300 monthly payments into a chapter that is already closed.
Click To Visit Pepeto Website To Enter The Presale

FAQs
Should investors follow the xrp price prediction or enter the Pepeto presale?
The xrp price prediction targets 16% annually while Pepeto targets 100x from one listing event, and the presale entry is the path that clears mortgage debt from one position.
Why look past the xrp price prediction right now?
An XRP forecast pointing toward 25% growth suits passive holders, but the Pepeto official website is where the 100x entry that changes the reader’s financial life is still open.
Does the xrp price prediction for 2026 matter?
The xrp price prediction sets realistic expectations of 16%, but Pepeto’s presale with a verified exchange and Binance listing targets the 100x that only presale entries with a Binance listing produce.
Disclaimer: This is a Press Release provided by a third party who is responsible for the content. Please conduct your own research before taking any action based on the content.


with little attention.
0G says it crossed an important threshold months ago. Now it is retraining the same model in public, with the goal of showing what decentralized AI can actually deliver and why its earlier result deserved more attention.
In July 2025, 0G trained a 107 billion parameter model called DiLoCoX-107B with China Mobile. The research later appeared on arXiv after peer review. According to the paper, the system reached 357 times better communication efficiency than traditional AllReduce methods. Even so, the result barely landed in the market.
The team says the timing worked against it. Mid-2025 crypto attention was fixed on mainnet launches and token stories, while technical results drew far less interest. The work was serious, but it did not get much traction outside a small circle following the field closely.
Now, with decentralized AI back in focus, 0G wants to bring the result back into view.
A public retraining effort
This time, the company is putting the retraining process out in the open.
0G plans to document each stage, including checkpoints, convergence metrics, and data sourcing. It also says the run will be verified through Trusted Execution Environments using zerogAuth. Once the work is complete, the model weights will be open sourced.
Ultimately, 0G wants to show that decentralized AI can be audited, reproduced, and verified in a way most closed systems cannot match.
More than a parameter race
A lot of AI coverage still revolves around parameter counts. Bigger numbers attract attention, but 0G argues that a model’s value comes from the full system around it.
For the team, the real test starts with training and continues through verification, storage, serving, and integration into working products.
One of the main technical points is communication efficiency. DiLoCoX uses pipeline parallelism, a dual optimizer policy for local and global updates, a one-step delay overlap mechanism, and adaptive gradient compression. In plain terms, the design cuts the amount of communication needed during distributed training, which is often where these systems slow down.
0G also puts the model inside a full stack that includes onchain verification, decentralized storage, data availability, inference, and settlement. The result is a working environment rather than a one-off research demo.
Verification is another part of the pitch. With Trusted Execution Environments, users can check more than the existence of a model. They can inspect how it was trained and what data went into the process. For decentralized AI, that changes the trust model in a meaningful way.
The real story is bandwidth
According to 0G, the most important part of the DiLoCoX-107B result was the way the model was trained.
The team says the 107B model ran on standard one gigabit per second internet connections rather than specialized data center setups. That point goes straight at one of the biggest assumptions in AI, namely that frontier training requires rare and expensive networking conditions.
If that holds up over time, the impact could be substantial. Lower technical requirements open the door to far more participants, from research groups to companies and public institutions. In that setup, coordination becomes the main challenge, and decentralized systems are built for exactly that kind of problem.
A different cost model
0G also says its system cuts costs by about 95% compared with centralized alternatives.
The company attributes that reduction to the removal of expensive centralized overhead rather than cheaper hardware. If those numbers hold in real-world use, advanced model training becomes accessible to far more organizations, including universities, enterprises, and governments that do not have the budget for hyperscale AI spending.
That could change who gets to build serious models in the first place.
Can decentralized AI compete?
Skeptics have long argued that decentralized AI cannot keep up on performance. 0G believes the old tradeoff is starting to weaken.
As results improve and costs fall, the discussion becomes less about ideology and more about output. Can the system train strong models, verify them, and do it at a price point more teams can afford?
Open participation still comes with real risk. Distributed training can expose systems to data poisoning, gradient manipulation, and uneven contributor quality. 0G says it addresses those issues with architectural safeguards, anomaly detection, and cryptographic verification.
The point is not perfect safety. The point is making failures visible and traceable.
What verifiable AI actually means
For 0G, verifiable AI is about replacing trust by reputation with trust by inspection.
Instead of taking a provider at its word, users get a way to independently check how a model was trained and how it operates. That idea has obvious value in areas where accountability carries real weight, including finance, healthcare, and government.
This is where decentralized AI starts to stand apart, with systems people can inspect rather than simply trust.
From research demo to working system
The decentralized AI field has come a long way in a short time. Early proof-of-concept work is giving way to systems designed for training, verification, storage, inference, and economic settlement inside one environment.
0G wants DiLoCoX-107B to stand as proof of that progression. The public retraining effort is as much about process as performance. The company is trying to show that decentralized AI can produce serious models while staying open to inspection.
The road ahead
Larger models are still on the horizon. 0G believes models in the hundreds of billions, and eventually trillions, are within reach.
The next stage depends less on a single scientific leap and more on better coordination and stronger network participation. In decentralized AI, organization may prove just as important as compute.
The retraining of DiLoCoX-107B is an attempt to reopen a conversation 0G believes the market missed the first time. It is also a test of whether open, verifiable AI can win attention on the strength of results rather than hype.
For now, the company is betting that public retraining, transparent documentation, and open access will give decentralized AI a stronger footing in the next round of competition.
The post 0G Retrains 107B Model in Public as Decentralized AI Enters a New Phase appeared first on BeInCrypto.
Ethereum (ETH) is trading at $2,068, pressing directly against the 0.236 Fibonacci level at $2,055. The token has been pulled in two directions simultaneously — long-term holders booking profits from elevated cost bases while whale-tier addresses absorb that supply to prevent a structural breakdown.
The $2,000 level is the line separating these two forces. Which cohort wins determines the next significant move.
Old ETH Holders Are Selling
The Glassnode HODL Waves chart tracking the 3-to-5 year holding cohort spans December 26, 2025, through March 26, 2026. That band held relatively stable between 14.2% and 14.4% of total ETH supply from late December through January 20 before beginning a gradual decline.
The decline accelerated sharply at the right edge of the chart. Between March 21 and March 26, the 3-to-5 year cohort dropped from approximately 13.6% to 12.8% of supply — a fall of nearly 0.8 % in under a week. This represents the second-largest distribution event from this cohort visible in the 2026 data, behind only the drop recorded in late January.
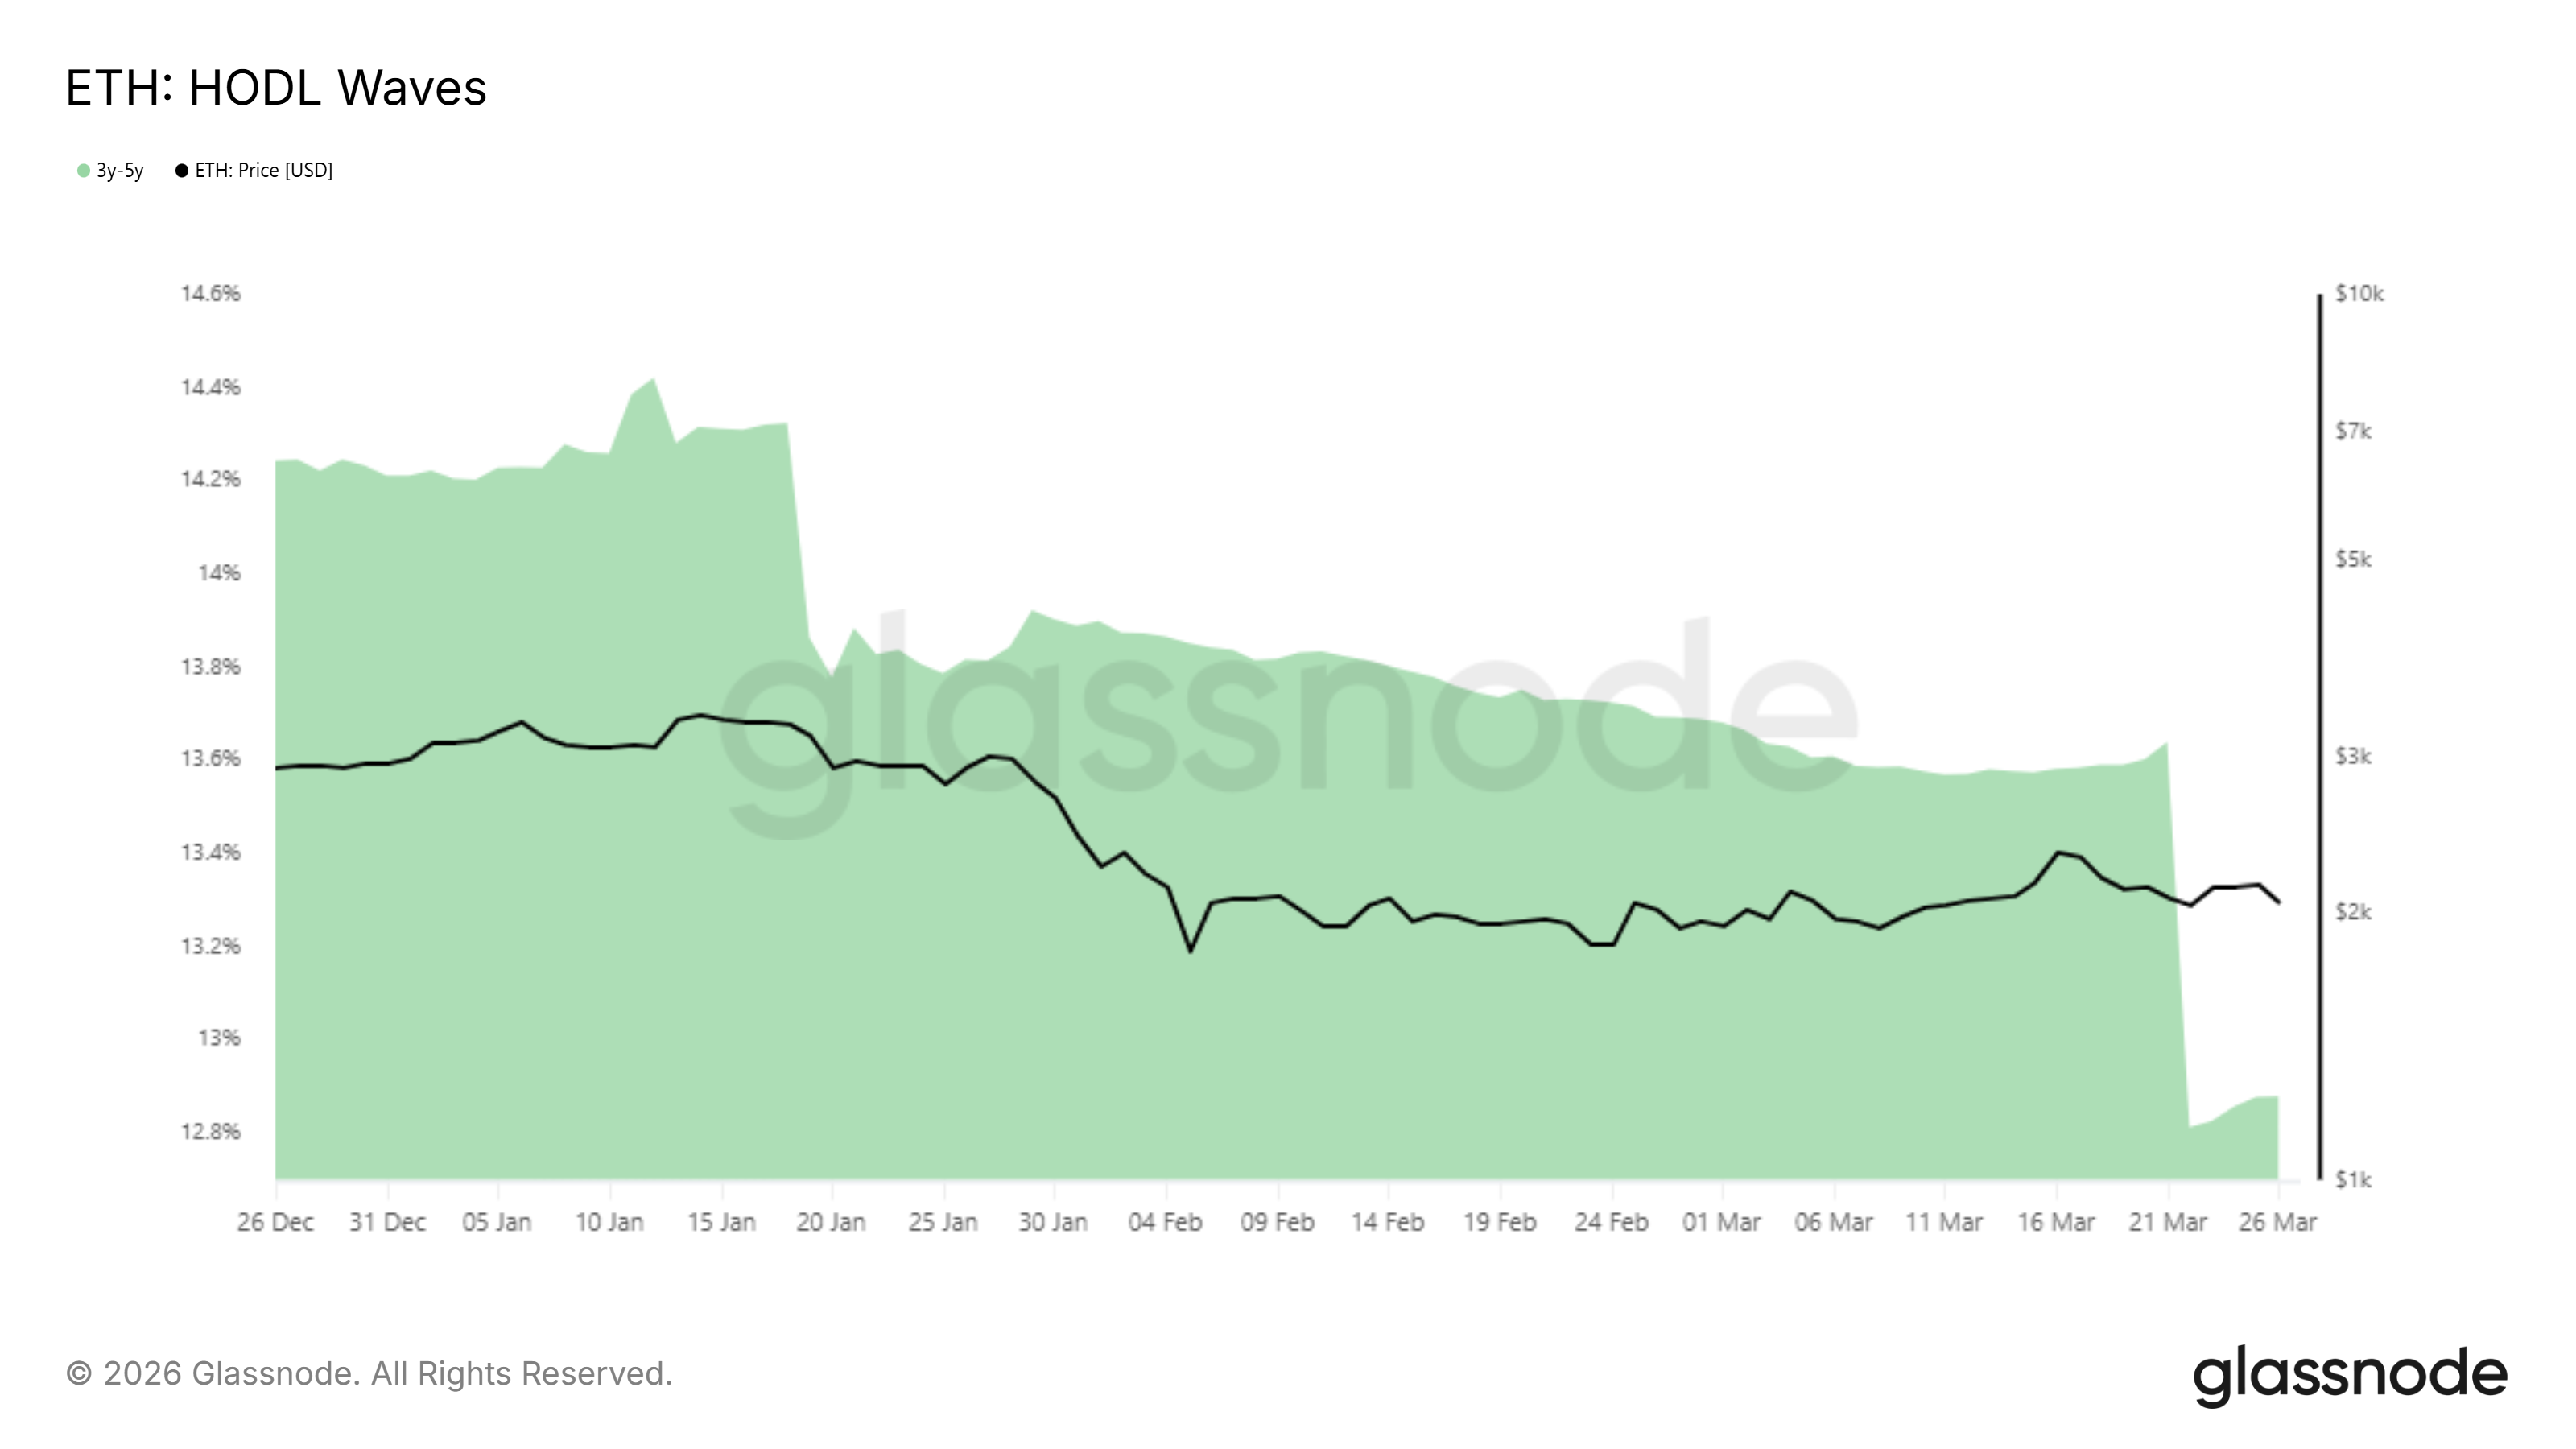
Holders in this cohort acquired ETH between 2021 and 2023, a period that includes both the 2021 bull market peak near $5,000 and the 2022 bear market lows. Many of those who bought near the top are still underwater.
Those who accumulated during the bear market are now sitting on meaningful profits at current prices and are choosing to realize them. Their exit is not panic — it is deliberate profit-taking at a price level they may not see again soon.
Whales Are Absorbing Smaller Holders Are Selling
The Santiment address supply distribution chart tracking three cohorts — addresses holding 10,000 to 100,000 ETH (blue), 100,000 to 1,000,000 ETH (red), and 1,000,000 to 10,000,000 ETH (yellow) — shows a clear shift in supply ownership since March 25.
The blue cohort sold approximately 370,000 ETH between March 25 and the time of writing. That selling did not push the price lower in any meaningful way.
Want more token insights like this? Sign up for Editor Harsh Notariya’s Daily Crypto Newsletter here.
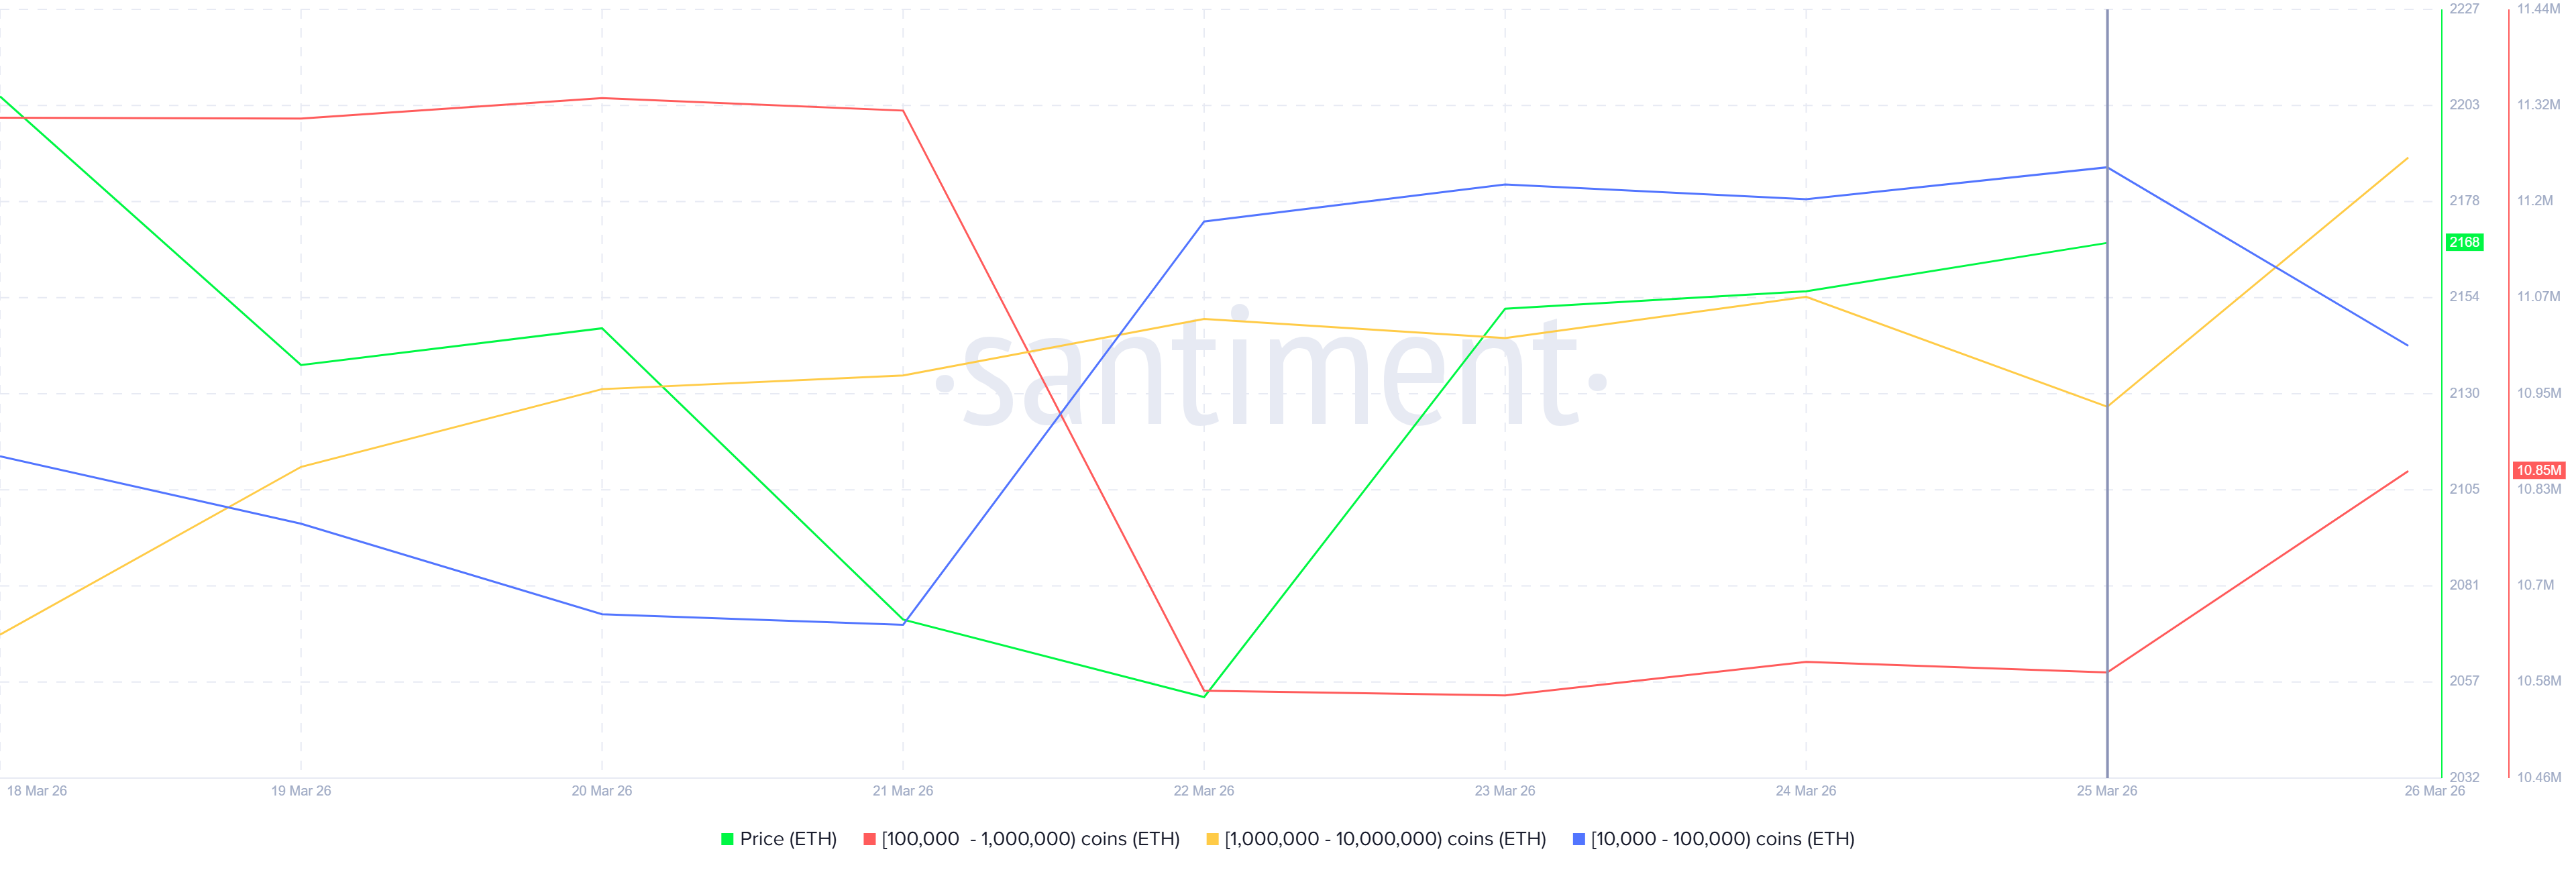
Instead, the red and yellow cohorts absorbed that supply collectively, with the two larger whale tiers increasing their balances in direct proportion to the blue cohort’s exit. At the current Ethereum price, that transfer of 370,000 ETH represents approximately $765 million changing hands from mid-tier holders into the largest whale addresses on the network.
This dynamic — larger addresses absorbing supply that smaller addresses are offloading — is what will likely keep ETH above $2,000. As long as that buying continues to absorb available sell-side supply, it acts as a structural floor against further price decline.
ETH Price Trajectory Going Forward
The daily chart shows Ethereum price at $2,068, sitting at the 0.236 Fibonacci level at $2,055, with the red 50-day EMA sloping downward at $2,186 acting as immediate resistance. The Fibonacci retracement grid runs from the zero level at $1,750 to the 1.0 level at $3,045.
The 0.236 level at $2,055 has been the battleground since early March. Every session that has tested it has either closed above or produced a recovery. Ethereum price is currently pressing it again, and the outcome of this test determines the next destination. Below $2,055, the $1,928 horizontal support is the next level on the chart and represents the last defense before the $1,838 floor comes into play.
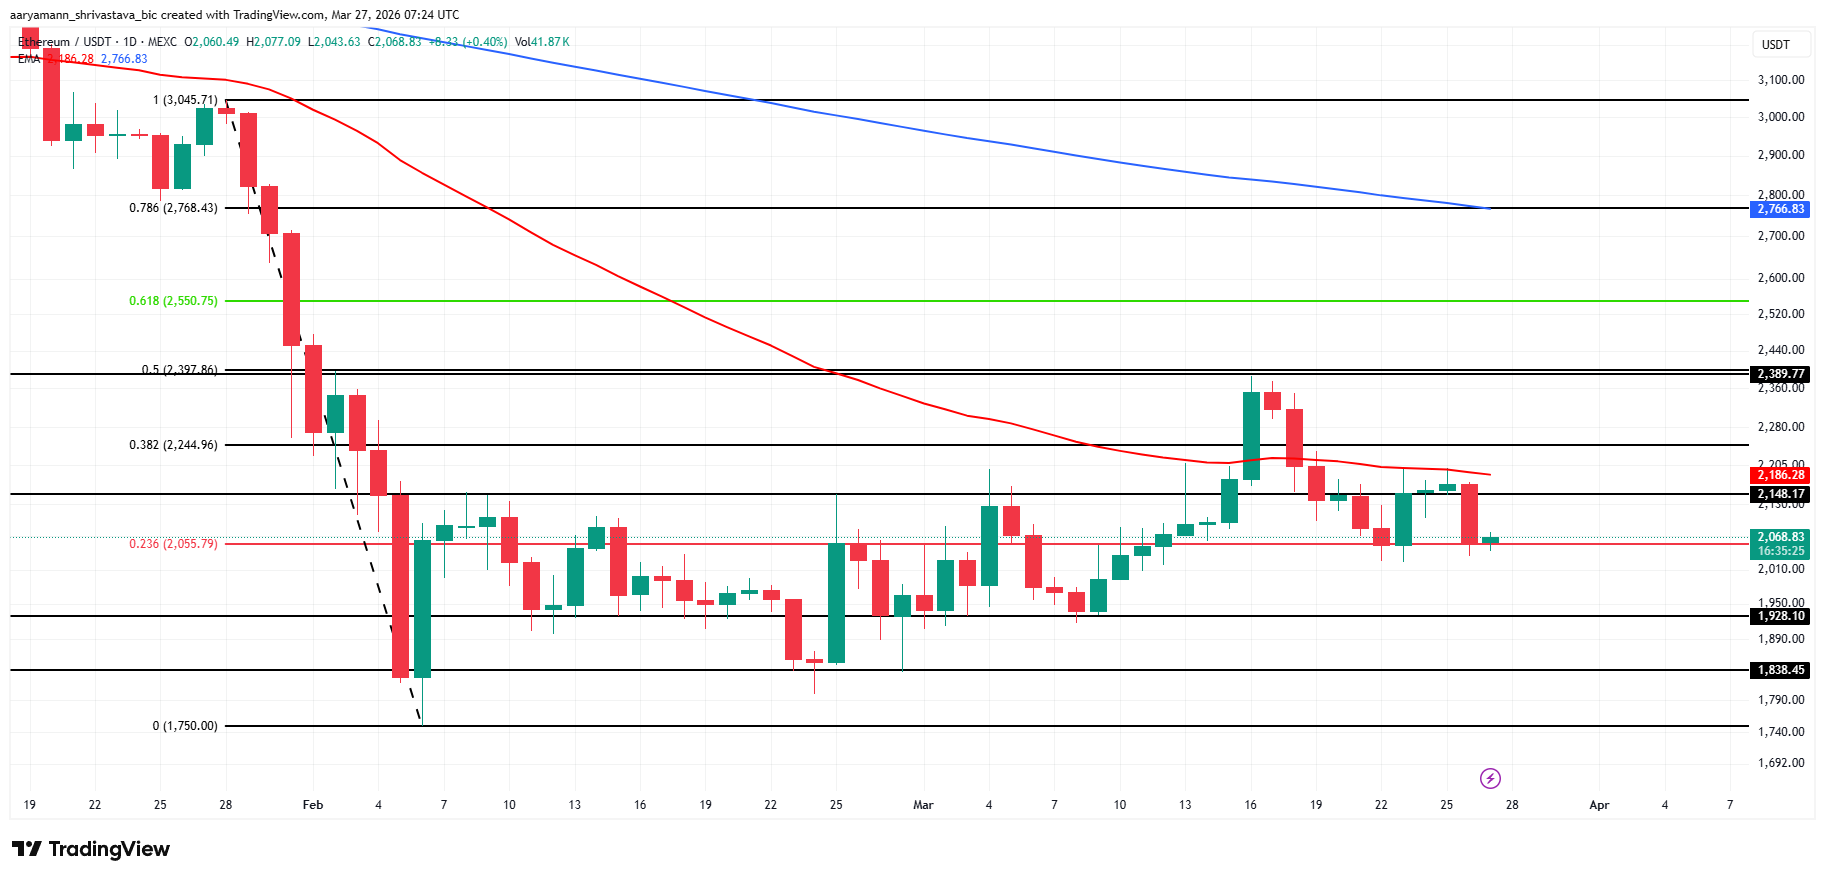
The bullish invalidation requires reclaiming the 0.382 level at $2,244. Above that, the 0.5 level at $2,397 becomes the next target, followed by the 0.618 level at $2,550.
A sustained move toward $2,550 would require whale accumulation to accelerate as the 3-to-5-year holder selling pressure subsides. This is a scenario that becomes more likely only if the broader market stabilizes above $2,000.
The post $765 Million ETH Changes Hands As Whales Anchor Ethereum Price Above $2,000 appeared first on BeInCrypto.

California Governor Gavin Newsom signed an executive order Friday expanding restrictions on insider trading linked to prediction markets. The move targets gubernatorial appointees and those closely connected to them, prohibiting the use of confidential or non-public information gained through official duties to profit from markets tied to political or economic events they can influence or which they are privy to. The measure also extends to spouses, family members, and former business partners of the appointed officials.
Newsom’s office framed the order as a guardrail against conflicts of interest and cronyism, with the governor stating that public service should not become a vehicle for personal enrichment. “Public service should not be a get-rich-quick scheme,” Newsom said, underscoring a broader push for stronger ethics standards in state governance. The administration contends that officials must adhere to a clear boundary between their duties and financial bets tied to real-world events they might shape.
“If you serve the public as a political appointee, you serve the public — period. We’re not going to tolerate this kind of corruption in California,” Newsom asserted, characterizing the new rules as a bright line against insider profiteering.
According to the governor’s office, the executive order lists several episodes that allegedly involved political insiders using non-public information to profit from prediction markets. Among the cited cases are six individuals suspected of exploiting information related to U.S. military actions in Iran. The document also points to a January incident in which a Polymarket trader earned about $410,000 betting on the arrest of Nicolás Maduro, the former Venezuelan president.
Prediction markets have long drawn scrutiny from U.S. lawmakers who fear that insiders may unfairly capitalize on privileged information and that wagers on sensitive developments—such as war or major political changes—could raise national-security concerns. The California order aligns with a broader national conversation about the governance of prediction markets and the potential for conflicts of interest to distort outcomes or undermine public trust.
Key takeaways
- The executive order expands insider-trading prohibitions to gubernatorial appointees and their close associates, extending protections to spouses, family members, and former business partners.
- The scope centers on non-public information gained through official duties used to profit from prediction markets tied to events officials can influence.
- California cites internal cases where insiders allegedly profited from sensitive events, such as U.S. strikes in Iran and the Maduro arrest bet on Polymarket, as rationale for the tightened rules.
- The move sits within a broader U.S. policy debate, as lawmakers push federal legislation to curb insider trading on prediction markets.
- Two parallel bills propose to bar high-ranking government officials from betting on prediction markets, with different emphases on war and sensitive operations—signaling potential cross-cutting regulation at state and federal levels.
Regulatory momentum beyond California
In response to ongoing concerns about insider access, Texas Congressman Greg Casar and Connecticut Senator Chris Murphy introduced the Bets Off Act in March 2026. The proposal would prohibit government insiders from placing bets on markets tied to war or other sensitive operations. At roughly the same time, Representatives Adrian Smith and Nikki Budzinski introduced the PREDICT Act, which would bar the President, lawmakers, and other high-ranking officials from participating in prediction markets. The bills collectively reflect a growing consensus that current frameworks do not sufficiently guard against conflicts of interest or the exploitation of privileged information.
Industry observers note that the new California directive does not replace federal action but rather adds a state-level layer of oversight that could influence how prediction-market platforms operate within the state. While enforcement mechanisms and timelines were not detailed in the order itself, the development underscores a widening regulatory lens on predictive markets and the potential for broader, more harmonized standards if federal measures advance.
Implications for the market and governance
For traders, policymakers, and platform operators, the California move highlights several practical considerations. First, it raises the cost and complexity of participation for officials and their networks, potentially shrinking the pool of publicly connected insiders who might have leveraged non-public information in prediction markets. Second, it reinforces a governance signal that conflicts of interest—once deemed a gray area—will be treated as a compliance risk with real consequences. Platforms hosting prediction markets may respond by tightening verification checks, enhancing disclosures, and imposing stricter controls around politically sensitive topics to avoid regulatory scrutiny and reputational risk.
In the broader regulatory landscape, the California action dovetails with federal proposals that seek to curb real-time exploitation and insider trading in state or federal decision environments. While the specifics of enforcement and cross-border applicability remain to be seen, the convergence of state and federal efforts points to a more proactive stance on governance in prediction markets. Analysts say this trend could slow the growth of speculative activity around politically sensitive events and push participants toward higher standards of transparency and accountability, even as some observers worry about chilling effects on legitimate market price discovery and risk assessment.
What comes next
What remains uncertain is how California will implement and police the new rules, and whether other states will adopt similar measures that could create a patchwork regulatory environment for prediction markets. Federal bills, if enacted, could provide uniform standards that affect both users and platforms nationwide. Observers will be watching for any enforcement actions tied to the executive order, as well as how platforms respond to the evolving mix of state and federal expectations around insider information and public-interest safeguards.
The evolving policy landscape also raises broader questions about how prediction markets should be governed as tools for forecasting versus potential channels for improper gain. As lawmakers and regulators weigh the balance between innovation, market liquidity, and integrity, readers should monitor whether new rules push prediction-market ecosystems toward stronger compliance or toward strategic shifts in participation and product design.
Readers should watch for updates on enforcement actions in California, any follow-on guidance from the governor’s office, and the fate of federal proposals like the BETS OFF and PREDICT Acts, which could redefine how insiders interact with markets tied to sensitive political and security developments.
In the near term, the California order marks a notable step toward closing perceived loopholes in prediction-market governance and signals that public service will increasingly be measured not just by duties performed but by the integrity of decisions surrounding information access and financial risk.
Lawyers representing the US city of Detroit plan to file an amicus brief in Coinbase’s lawsuit against Michigan, which argues that federal regulators should have authority in overseeing prediction markets and not states.
In a Thursday filing in the US District Court for the Eastern District of Michigan related to state officials’ motion for a preliminary injunction, District Judge Shalina Kumar approved an order which will allow Detroit to file a brief supporting state authorities in their lawsuit against Coinbase. Kumar gave Detroit’s lawyers until April 3 to make the filing as the lawsuit continues.

In December, Coinbase filed its lawsuit against Michigan, as well as gaming authorities in Connecticut and Illinois, more than a month before the crypto exchange announced the launch of its prediction market services on the platform.
The company’s argument is centered on claims that prediction markets fall under the purview of the US Commodity Futures Trading Commission (CFTC) rather than state gambling regulators, challenging Michigan’s enforcement.
Companies offering event contract bets on prediction markets like Coinbase, Kalshi and Polymarket already face state-level lawsuits in multiple jurisdictions. Although the platforms have been supported by efforts from CFTC Chair Michael Selig, who proposed new rules for the commission, it was still unclear as of Friday how the legal battle between state authorities and federal regulators would unfold.
Related: Federal regulation looms as 11 states go after prediction markets
Where will the chips fall for platforms dealing with state and federal authorities?
“The more the CFTC can do in this space [prediction markets] to put a comprehensive regulatory regime around it, the more likely it is for courts who are looking at the issue to say ‘actually, yes, this is a CFTC jurisdiction issue — this really is not just an end run around sports gambling bans in particular states,’” Stephen Piepgrass, a partner at international law firm Troutman Pepper Locke, told Cointelegraph.
According to Piepgrass, the cases could ultimately end up going back to the US Supreme Court, given its 2018 decision in Murphy v. National Collegiate Athletic Association. That case gave US states the authority to regulate sports gambling, striking down a federal law that attempted to impose a ban on such activities.
US states have largely pushed back against lawsuits over prediction markets, but courts have sided with the platforms in some cases.
This month, a judge ordered Kalshi to temporarily stop operating in Nevada, and the platform faces criminal charges in Arizona over alleged illegal gambling on sports and elections. However, a Tennessee judge blocked state authorities from enforcing gambling laws against the platform in February.
The Michigan Gaming Control Board reported that casinos based in Detroit casinos generated more than $200 million in revenue for January and February, providing more than $24 million in taxes for the US state.
Magazine: XRP yet to ‘price in’ 3 bullish catalysts, Bitcoin to $80K? Trade Secrets
Beatrice and Eugenie face rumours about marriages amid family controversy
Investors in Private Credit Funds Are Fretting About One Type of Loan Payment

Are UK students at risk of more deadly meningitis outbreaks?


-
 NewsBeat3 days ago
Manchester United reach agreement with Casemiro over contract clause amid transfer speculation
-

 News Videos2 days ago
Parliament publishes latest register of MPs’ financial interests
-

 Crypto World6 days ago
Best Crypto to Buy Now: Strategy Just Spent $1.57 Billion on Bitcoin During Fear While Early Investors Quietly Enter Pepeto for 150x Potential
-

 Crypto World6 days ago
Bitcoin Price News: Bhutan Sells $72 Million in BTC Under Fiscal Pressure, but the Smart Money Entering Pepeto Sees What the Market Does Not
-

 Sports5 days ago
Remo Stars and Kano Pillars Strengthen Survival Hopes in NPFL
-

 Sports5 days ago
Gary Kirsten Accuses Pakistan Cricket Board Of ‘Interference’, Mohsin Naqvi Responds
-

 Business6 days ago
No Winner in March 21 Drawing as Prize Rolls to $133 Million for Next
-

 Tech5 days ago
Give Your Phone a Huge (and Free) Upgrade by Switching to Another Keyboard
-

 Tech5 days ago
AI enters the chat: New Seattle dating app relies on tech to facilitate meaningful human connections
-

 News Videos5 days ago
Ch 9 Financial Management Part 1 | Detailed One Shot | Class 12 Business Studies Boards 2026
-

 Tech6 days ago
Today’s NYT Connections Hints, Answers for March 22 #1015
-

 Business1 day ago
Instagram, YouTube Found Responsible for Teen’s Mental Health Struggle in Historic Ruling
-

 Business6 days ago
Will Duke Basketball Win It All? Duke Basketball Enters Second Round as Third Favorite to Claim NCAA Title
-

 Sports5 days ago
2026 Kentucky Derby horses, odds, futures, preview, date: Expert who hit 12 Derby-Oaks Doubles enters picks
-
 NewsBeat6 days ago
Update on Wisbech river crash as search for teenage boy enters fifth day
-
 Entertainment5 days ago
Cynthia Bailey Dishes on ‘RHOA’ Season 17, Discusses Kandi
-

 Tech4 days ago
Samsung will soon let you control smart home devices from your car’s dashboard
-

 Fashion3 days ago
Does It Matter What You Wear When You’re Laid Off and Looking?
-
 NewsBeat3 days ago
Tesco is selling new Cadbury Dairy Milk bar and people can’t wait to try it
-

 NewsBeat7 hours ago
The Story hosts event on Durham’s historic registers
You must be logged in to post a comment Login