

Crypto World
DeFi Saver announces reward program as part of their Hyperliquid integration
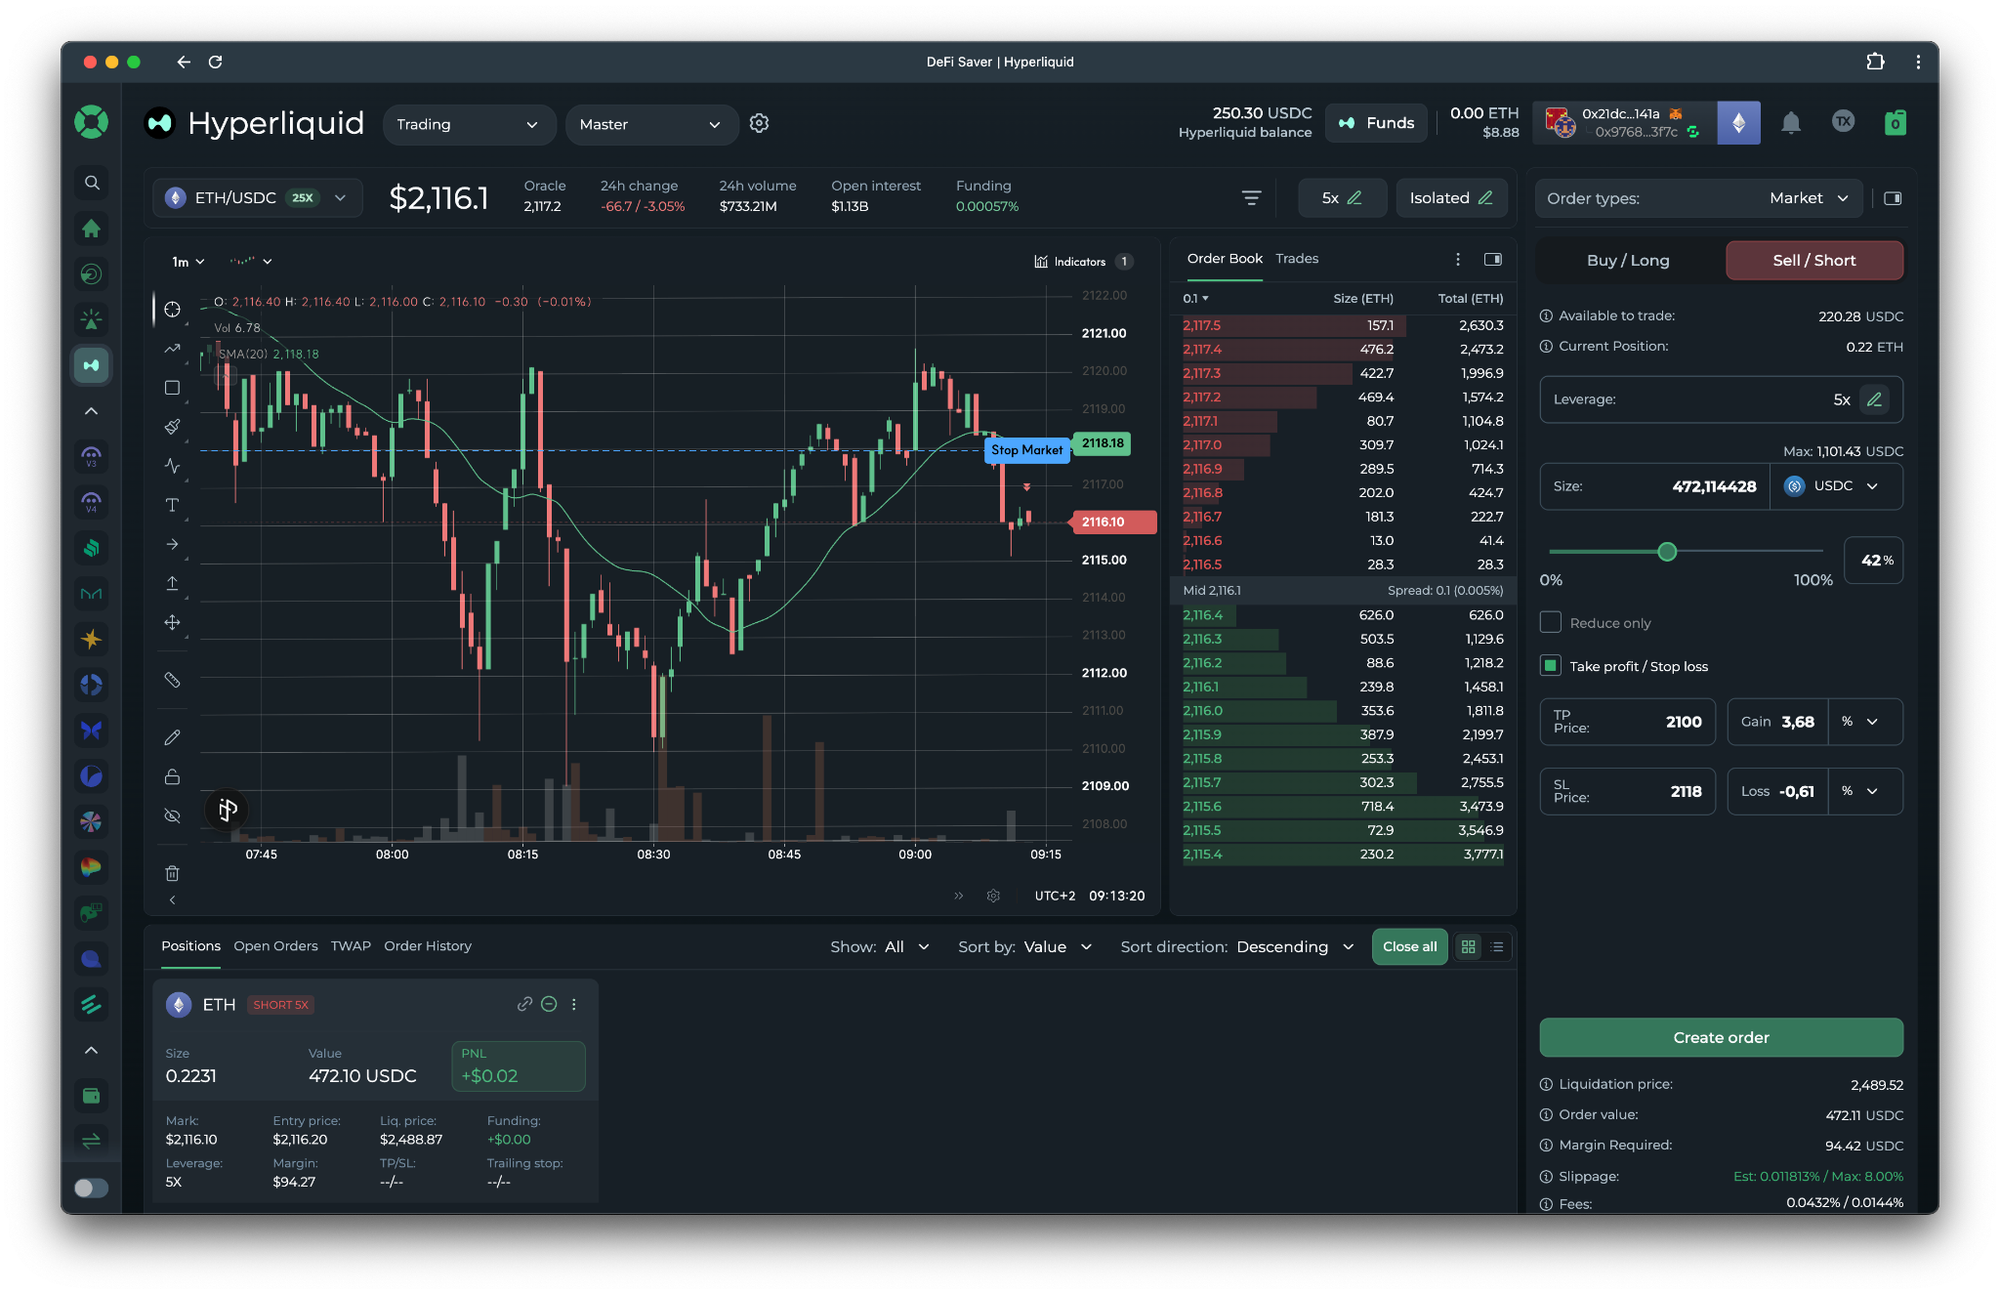
DeFi Saver has officially integrated Hyperliquid, the leading perpetual futures DEX and a premier high-volume trading venue. This launch brings futures trading and DeFi lending into one unified interface, allowing users to manage their entire DeFi strategy in one place.
DeFi Saver has just integrated Hyperliquid by uniting DeFi lending and Hyperliquid perpetuals within a single, unified interface, bolstered by the signature DFS toolkit for advanced liquidation protection.
About Hyperliquid x DeFi Saver
Hyperliquid is now accessible directly via the DeFi Saver app sidebar, providing immediate access to its comprehensive trading dashboard.
The onboarding process is entirely frictionless: simply connect your wallet to begin opening positions through the integrated perpetuals dashboard, with no account creation required.

The integration includes the full suite of DeFi Saver’s signature management tools from day one:
- Advanced automation capabilities, including trailing open and trailing close strategies. These features enable automated entries and exits based on precise price movements.
The Notify feature will soon be enabled, offering automated Telegram alerts to keep users informed of critical updates regarding their position health.
Furthermore, DeFi Saver allows users to fund their perpetual accounts from any supported network using any token, eliminating the need for manual bridging or USDC-exclusive deposits.
Extra Incentives for Hyperliquid Perps on DeFi Saver
From June 8th, DeFi Saver users will be able to participate in the incentives campaign for perpetuals and leveraged borrowing. The competition will span two seasons, each season lasting for two weeks.
The initial prize pool is set at 50,000 USDC for the first two seasons, and the scoring will be based on a combination of volume and PnL.
For additional information, check this post
About DeFi Saver
DeFi Saver is a trustless, non-custodial protocol aggregator that allows for efficient DeFi position management. It integrates all the major protocols, such as Aave V3 and V4, Morpho, Euler, Compound, Spark, Sky, and others, into an all-in-one intuitive UI, while offering advanced tools catering to more experienced users. Originally launched as CDP Saver in 2019, the platform has grown significantly, staying committed to user autonomy, protocol reliability, and continuous innovation.
Twitter I DFS website I Discord I Blog
The post DeFi Saver announces reward program as part of their Hyperliquid integration appeared first on BeInCrypto.

Withdrawals from crypto exchange BitMart appeared to slow after it announced plans to wind down its operations.
On Monday, blockchain analytics account Lookonchain reported that only 58 wallets withdrew about $805,000 in over 24 hours. It added that the exchange had not processed any withdrawals during the latest eight-hour period it tracked.
X users also continued to report withdrawal difficulties. One user said they received an email stating that a USDT withdrawal had been completed even though the transaction had not been processed and their account displayed an “on-chain withdrawal freeze.” Another user said a $30 test withdrawal remained pending for over 30 minutes. These are individual claims and could not be verified.
BitMart’s ability to return customer funds smoothly will be a key test of its promised “orderly” wind-down and could determine whether declining confidence develops into a broader rush for the exits.
BitMart previously said withdrawals remain available but warned that requests may face additional compliance and security checks, including reviews of customer identities, login devices, withdrawal addresses, trading histories and sources of funds. The exchange may also request proof of identity, address, source of funds or ownership of the receiving wallet.
Cointelegraph reached out to BitMart for comments but did not receive a response before publication.
BitMart token extends decline as exchange prepares to close
On Sunday, BitMart announced that it would stop accepting new registrations and deposits while restricting new spot orders and futures positions. Trading services are scheduled to end on Aug. 26, with the platform expected to cease operations entirely on Jan. 31, 2027.
Arkham-identified wallets attributed to BitMart held about $69 million in crypto assets on Monday, down from roughly $102 million on July 6.
Related: Storj files for bankruptcy, explores equity path for tokenholders
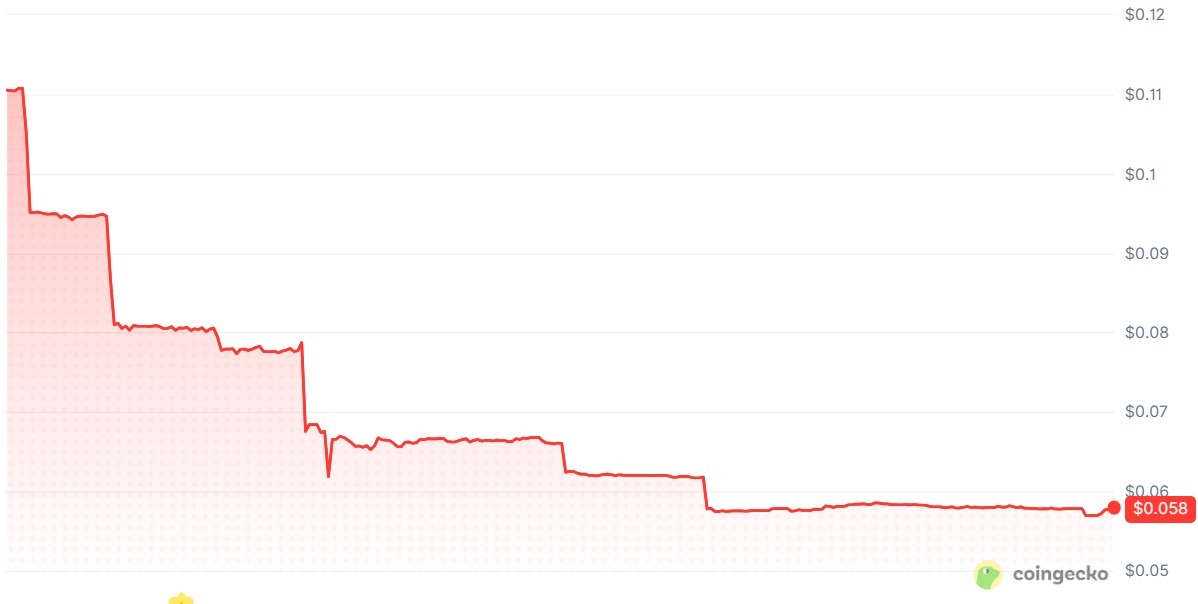
BitMart’s BMX token traded near $0.057 on Monday and had fallen about 81.5% over seven days, according to CoinGecko. The token was trading around $0.31 late Friday before the exchange’s shutdown became public.

BMX token’s 24-hour chart. Source: CoinGecko
The closure also prompted discussion about whether larger exchanges could acquire smaller competitors.
Binance co-founder Changpeng Zhao said acquiring a centralized exchange was more complicated than buying other businesses because buyers could inherit security vulnerabilities, including backdoors left by previous teams. He added that acquisitions remain possible but require greater scrutiny.
Magazine: Why Australia’s $17B crypto opportunity depends on regulation
Crypto World
South Korean Traders Push MORPHO Whale Transactions to Highest Level Since October 2025
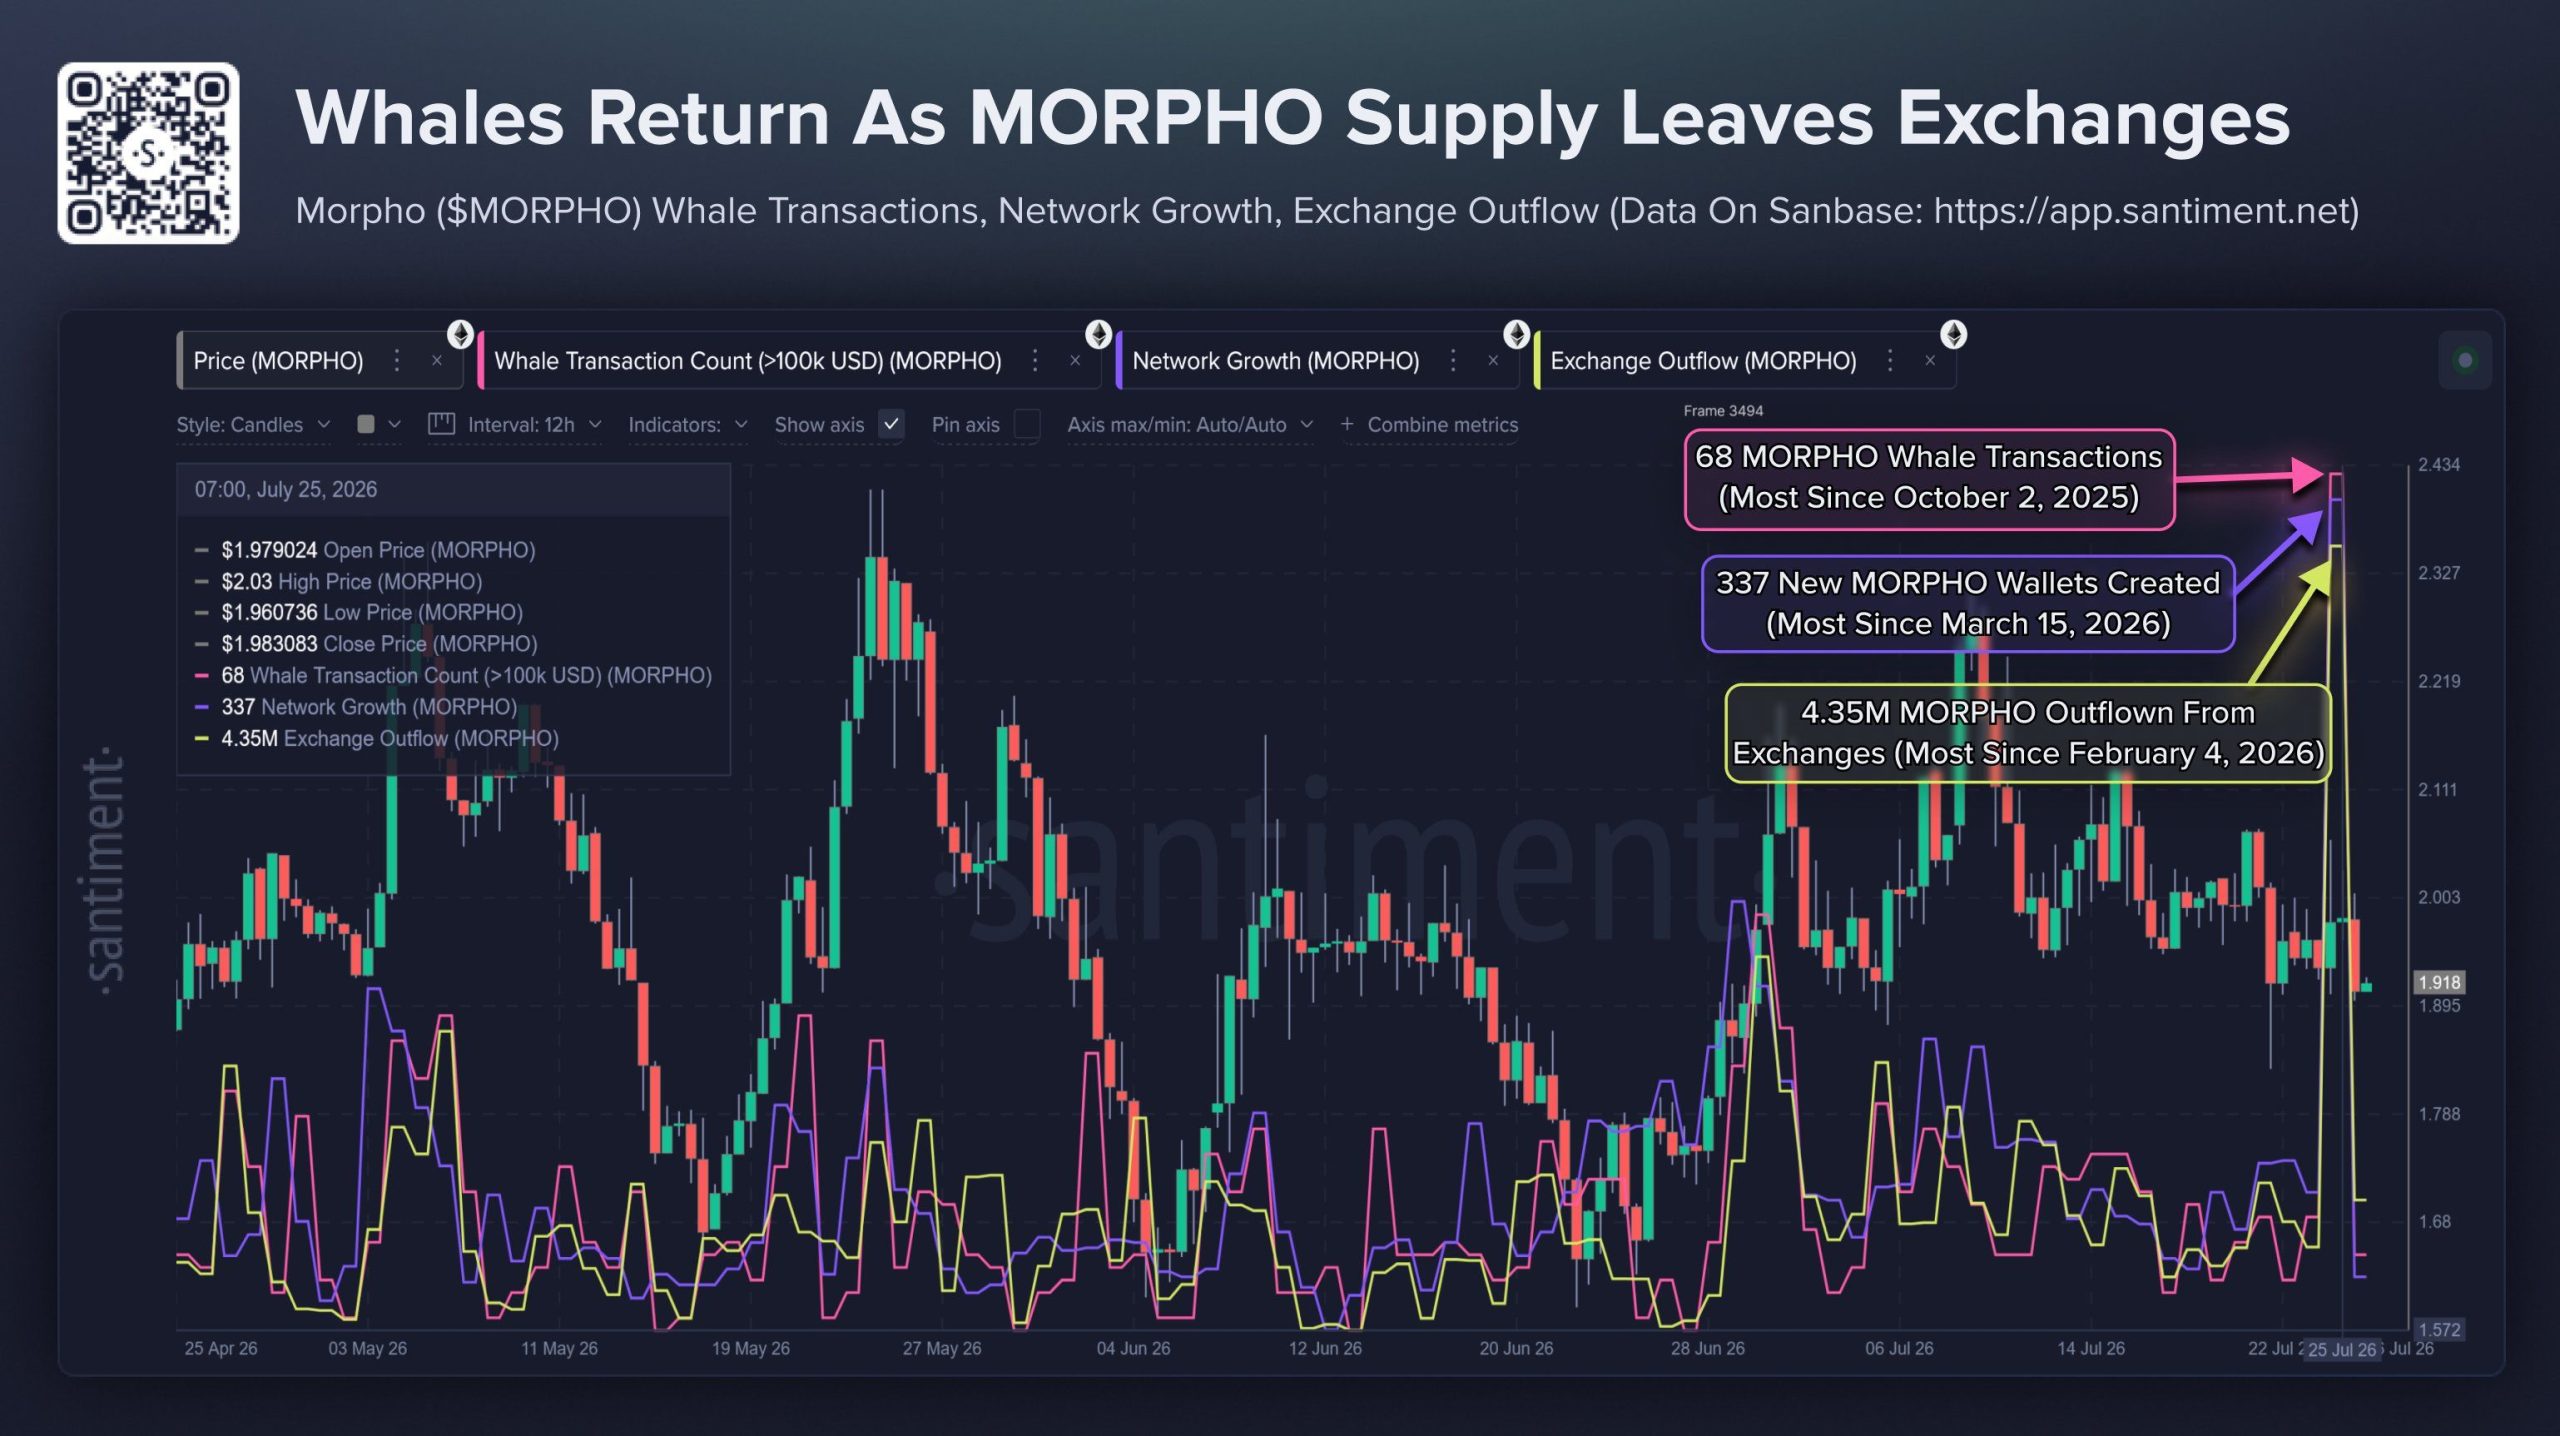
South Korean demand pushed Morpho (MORPHO) whale transactions, wallet creation, and exchange outflows to multi-month highs on Saturday. The spike landed the same day Upbit opened a won trading pair.
Activity has since cooled across all three metrics. Still, Upbit handles more MORPHO volume than any other venue.
What Happened on Saturday
Santiment recorded 68 whale transactions above $100,000 in a single day. That is the highest daily count since October 2, 2025.
Wallet creation moved with it. 337 new MORPHO addresses appeared, the strongest reading since March 15, 2026.
Exchange balances thinned at the same time. Traders shifted 4.35 million MORPHO off platforms, the largest single-day outflow since February 4, 2026.
Follow us on X to get the latest news as it happens

The simultaneous bullish signal arrived as Upbit opened trading for MORPHO in the KRW market at 6 p.m. KST that evening. The announcement also triggered a price surge.
MORPHO climbed from about $1.93 to an intraday high of $2.17 within hours, and daily volume rose close to 5 times to near $71 million, according to CoinGecko.
Upbit Still Handles More MORPHO Volume Than Binance
Nonetheless, the rush proved short. MORPHO slipped to nearly $1.9 on Sunday and now trades near at $1.99, roughly where it sat a week earlier. Daily volume has fallen back to about $22 million.

Still, the Korean flow did not leave entirely. The Upbit KRW pair accounts for 12.26% of daily MORPHO volume, the largest share of any market, ahead of Binance.
Won pairs across all venues make up about 13% of turnover. That concentration gives Korean retail traders significant influence over short-term MORPHO price movements.
The next few weeks should show whether Korean access turns into steady demand or stays a one-day event.
Subscribe to our YouTube channel to watch leaders and journalists provide expert insights
The post South Korean Traders Push MORPHO Whale Transactions to Highest Level Since October 2025 appeared first on BeInCrypto.

Risk-on peace trades are back in vogue after the U.S. and Iran held fire on Sunday, sending oil prices lower.
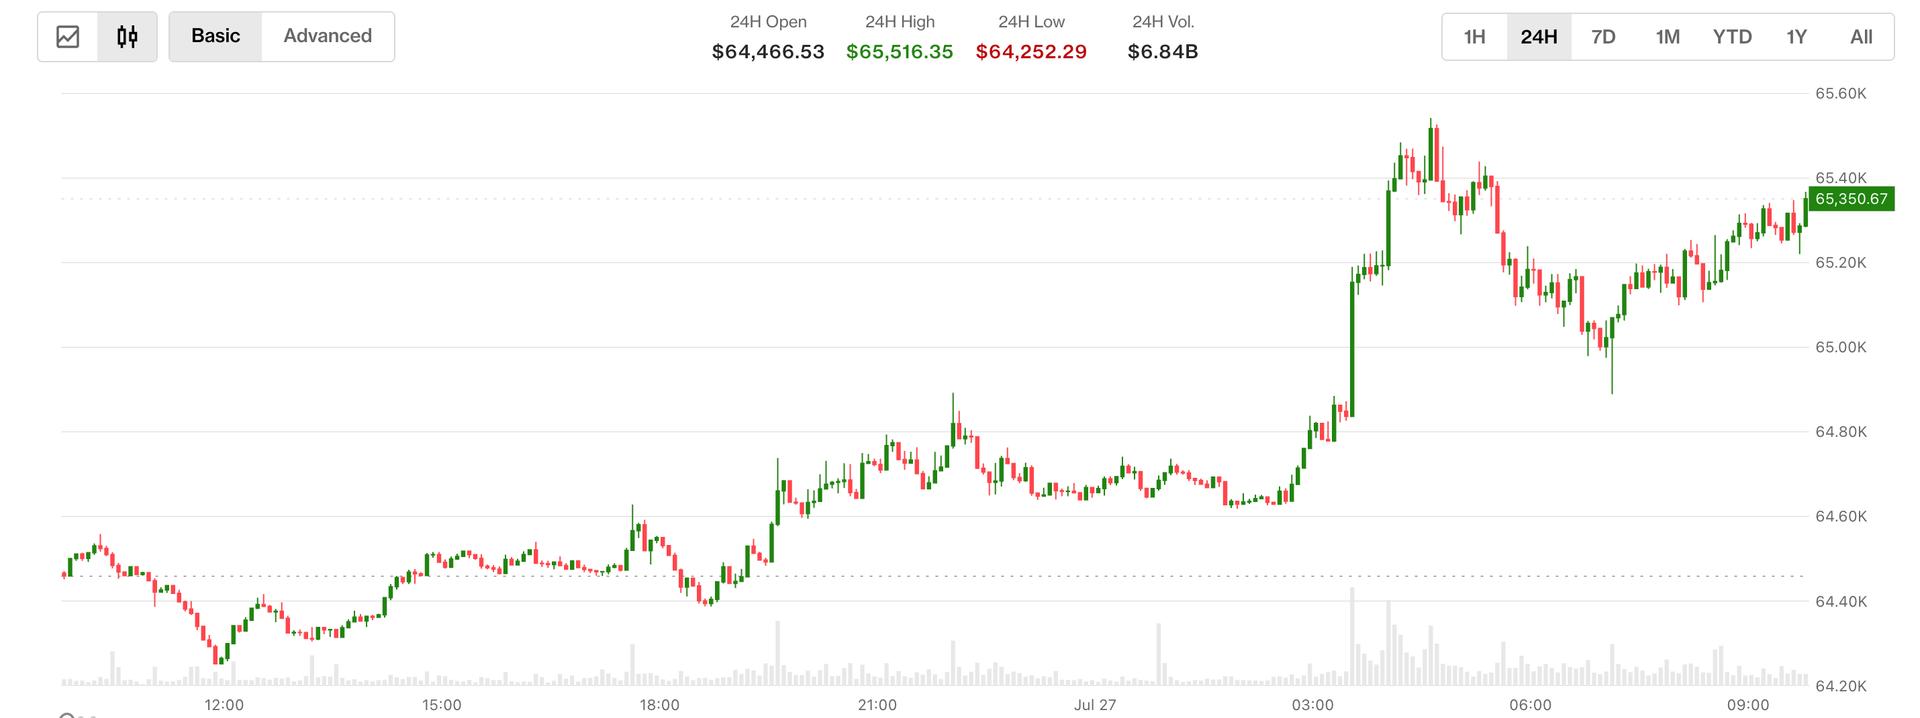
Bitcoin , the leading cryptocurrency by market value, is back above $65,000, with prices up about 1.2% over 24 hours. Ether (ETH) has risen by over 3% to nearly $1,950 alongside 1% to 2% gains in other top 10 token, including solana (SOL) and XRP (XRP).
Futures tied to WTI gapped lower on Monday, trading around 5% lower at $85 as of this writing, while those linked to Nasdaq and S&P 500 traded half a percent higher. Currency markets also showed risk-on trends, with the Aussie dollar and euro gaining against the U.S. dollar.
The United States and Iran paused military strikes against each other for a second consecutive day, creating room for a diplomatic breakthrough. The war, which began in late February, entered a fragile ceasefire in the second quarter, but it quickly unraveled.
Iran reportedly said that it would continue to halt airstrikes as long as the U.S. did the same, marking a tenous start of what appears to be yet another peace process.
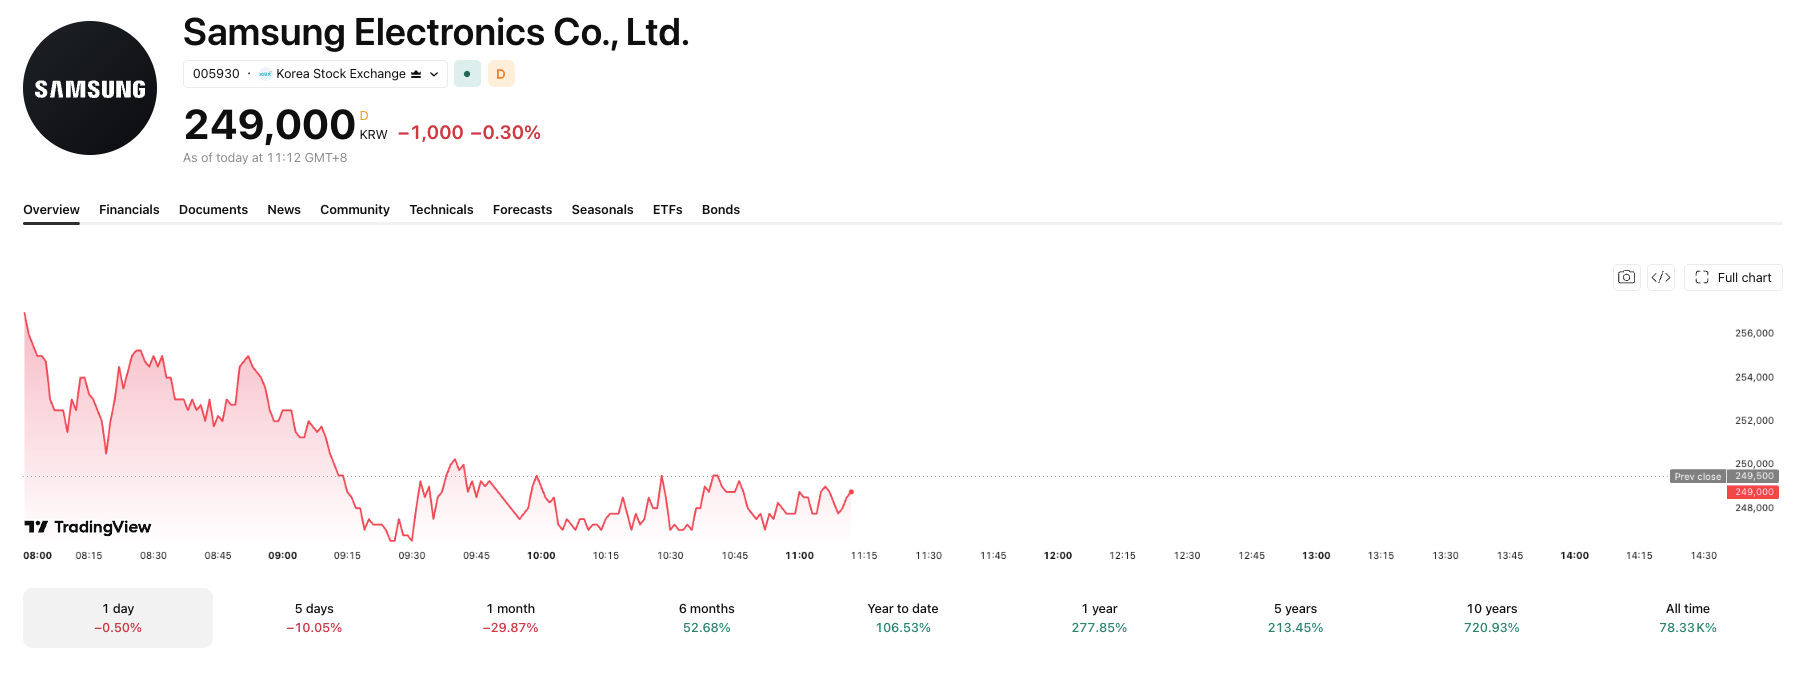
Samsung Electronics and SK Hynix signed a combined $950 billion in artificial intelligence (AI) chip supply deals with Nvidia and Broadcom over the weekend.
Both stocks still fell in Monday trading, a disconnect that shows how much of the AI rally already sits in the price.
A Massive AI Infrastructure Deal
SK Hynix will supply $750 billion in memory chips to Nvidia and other US companies over several years. Nvidia put its own portion of that deal at $500 billion. The agreement covers new data centers targeted for 2027, and SK Hynix affiliate SK Telecom will build a cloud business on Nvidia’s Vera Rubin systems.
Nvidia enterprise vice president Raj Mirpuri said the deal secures a stable supply of high-bandwidth memory (HBM), the specialized chips that power AI processors and graphics cards.
Samsung separately signed a memorandum of understanding worth an estimated $200 billion with Broadcom. The agreement expands their memory and foundry collaboration, the companies said in statements Friday.
Is the AI Boom Already Priced In?
Despite the scale of the announcements, SK Hynix shares traded at 1,752,000 won Monday morning, down a little from Friday’s close, but also down 11.38% over five sessions. Samsung fell 0.50% to 248,500 won, extending its own 10.05% five-day slide. Nvidia closed down 0.92% at $206.84 in Friday’s session before edging higher in overnight trading.


The muted reaction fits a recent pattern. SK Hynix shares have slid even on positive news this month. US investors already pay a premium for its shares compared with Seoul, a gap that opened after its blockbuster Nasdaq listing earlier in July.
Both stocks are up sharply this year on AI demand, so traders appear to be booking profits rather than chasing another AI headline, regardless of the deal size.
The bigger test comes later this week. Samsung and SK Hynix report quarterly earnings that will show whether soaring chip orders are converting into profit. That result will tell investors whether this month’s record deal flow deserves a second look, or whether it is already old news.
The post SK Hynix, Samsung Ink $950 Billion AI Chip Deals, But Stocks Still Slide appeared first on BeInCrypto.
Federal Reserve Chairman Kevin Warsh keeps predicting a Fed “family fight.” Wednesday’s policy meeting could finally deliver a real one, with economists expecting at least two hawkish dissents over interest rates.
Warsh has used the phrase 13 times since his April nomination hearing, according to a CNBC tally. His first meeting as chair ended in a unanimous hold last month.
A Feud That’s Been Building for Months
Wall Street expects a different outcome this week. JPMorgan’s Michael Feroli predicts a contested vote. He names Cleveland Fed President Beth Hammack and Dallas Fed President Lorie Logan as likely dissenters.
“The July FOMC will be a family feud… just as Kevin Warsh intended.”
Oscar Munoz, TD Securities
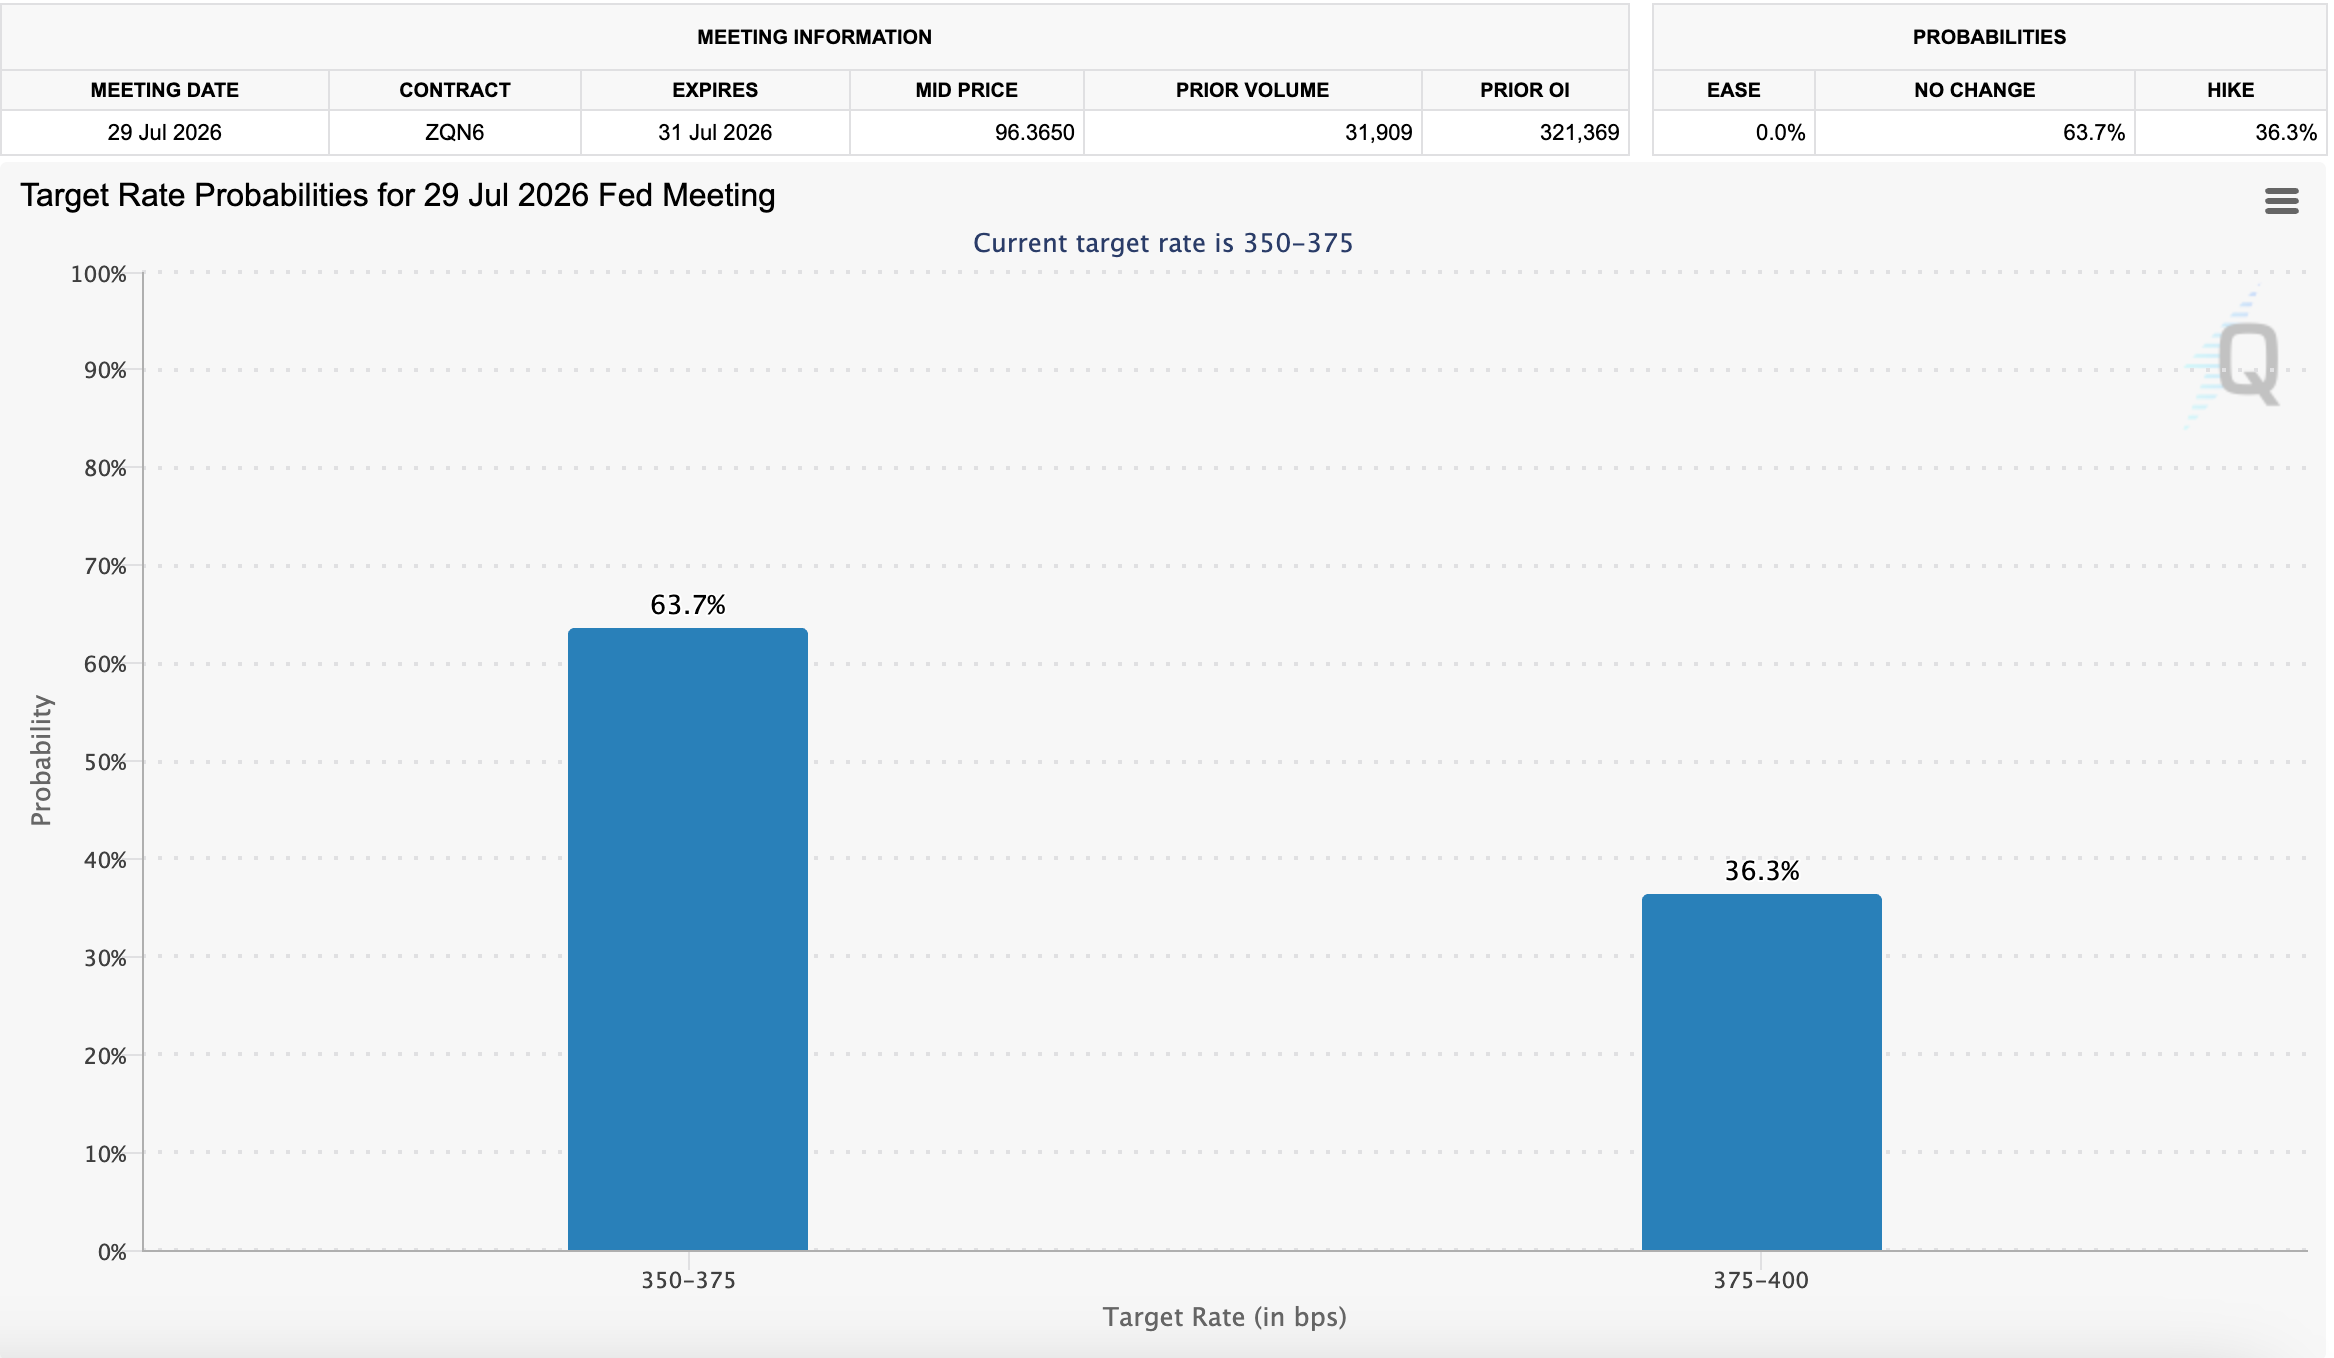
TD Securities’ Oscar Munoz agrees. Traders are already repricing the odds. CME Group’s FedWatch tool now shows 34.2% odds of a quarter-point hike, up from 12.8% just a week ago.

Oil and Chips Are Feeding the Feud
A collapsed U.S.-Iran ceasefire has pushed oil prices higher again. Brent crude climbed back above $100 a barrel, undoing the recent oil price relief. But a recent pause in hostilities has brought that price back down for the moment.
Chip shortages tied to the AI boom have raised consumer electronics prices too. Hyperscalers keep spending heavily on AI infrastructure, and that shows no sign of slowing. Fed Governor Chris Waller argues the central bank cannot just watch inflation and hope it fades, echoing Warsh’s own recent complaint about the Fed’s inflation framework mistake.
Cleveland Fed President Beth Hammack has been especially blunt about the stakes. She says businesses and consumers are both losing patience with prices.
“For the first time in my tenure, I’m hearing from businesses who say they think we need to take action to curb inflation, and from consumers who can’t make ends meet about a growing sense of despair.”
Beth Hammack, Cleveland Fed President
A softer June inflation report still favors a hold on Wednesday. The Fed’s next test also lands just as U.S. midterm elections near, adding political weight to the vote. But two hawkish dissents would turn Warsh’s family fight into the real feud he predicted all along.
The post Kevin Warsh Wanted a ‘Family Feud’ at the Fed; At Wednesday’s Meeting He Might Get One appeared first on BeInCrypto.
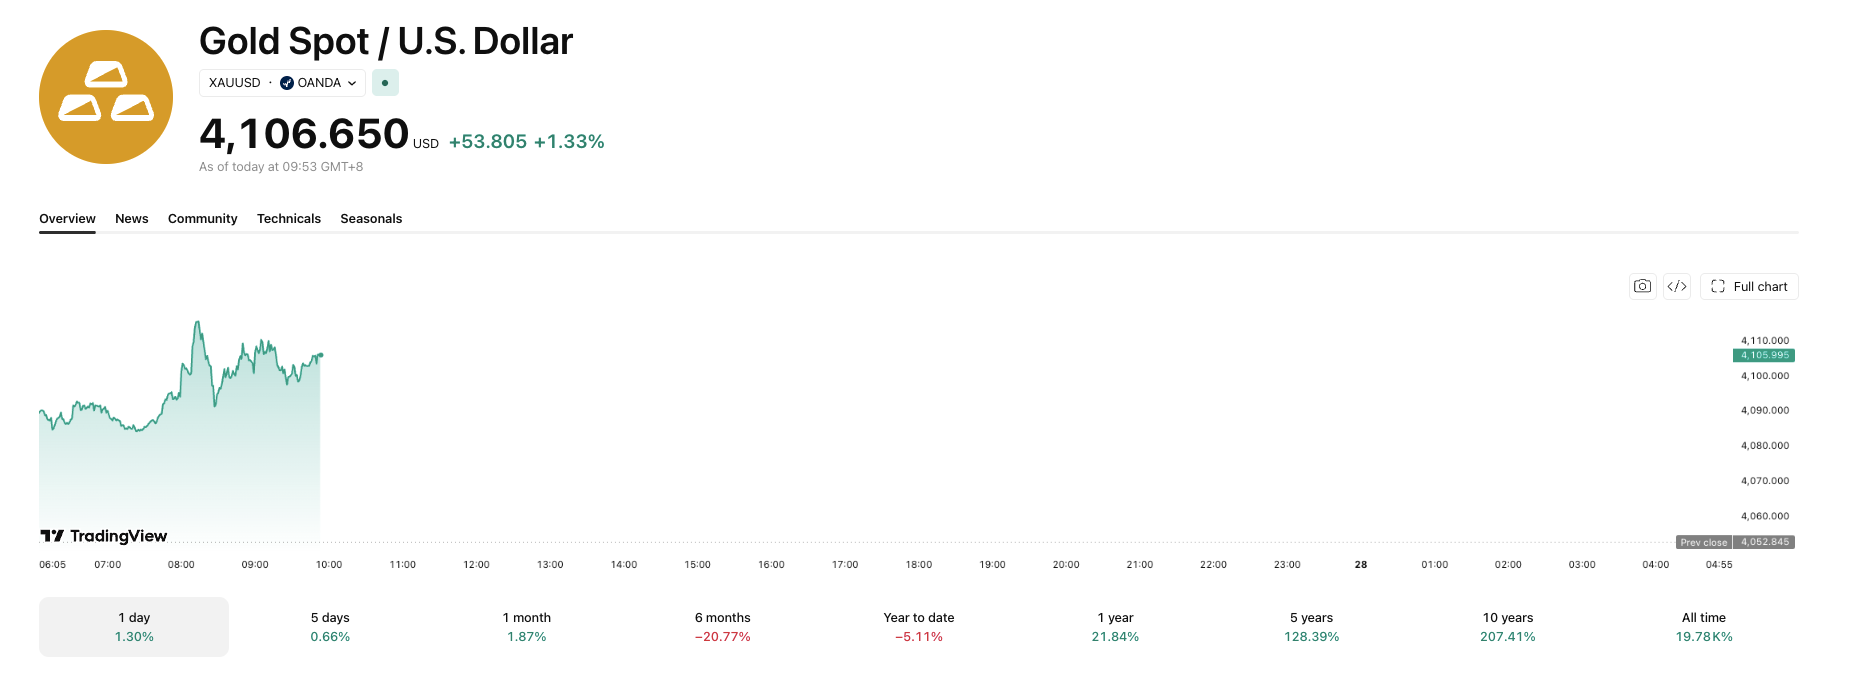
Gold climbed more than one percent in Asian trading Monday. A weekend pause in US-Iran hostilities pushed oil prices lower and eased fears of prolonged high interest rates.
Spot gold traded at $4,106.65 per ounce Monday, up 1.33% on the day, according to TradingView data.
Oil Retreat Lifts Precious Metals
The pause came as advisers reportedly warned Trump that the military was nearing the limit of viable targets in Iran. They also flagged concerns about draining U.S. munitions stockpiles, prompting the pause in strikes. Iran will halt its own attacks as long as Washington does the same, a senior Iranian official told Reuters.

Oil prices tumbled as much as 7% on hopes for a diplomatic resolution. That reverses recent forecasts that Brent crude could revisit its war-era peak near $120 after going above $100 at the weekend. Lower energy costs typically ease inflation, reducing the odds the Fed holds rates high for longer. Gold’s appeal fades when rates stay high since the metal pays no yield.
Traders are still pricing an 80% chance of a rate hike in September, according to the CME Group’s FedWatch Tool, which tracks futures-implied rate expectations.
Gold also Boosts Silver
Other precious metals rallied in tandem. Spot silver climbed 2.7% to $59.74 an ounce, building on a recent breakout above key resistance. Platinum gained 2% to $1,619.75, and palladium rose 2.3% to $1,271.93.
COMEX gold speculators added 4,438 contracts to their net long position in the week to July 21. That brought the total to 123,586 contracts, according to CFTC data.
The Fed’s rate decision this week will test whether the truce holds long enough to sustain the rally. A split among 104 economists over the central bank’s next move shows how uncertain the path remains. That uncertainty deepens if fighting resumes and oil prices reverse.
The post Gold Gains as US-Iran Pause Also Sends Oil Prices Lower appeared first on BeInCrypto.
Decentralized cloud storage provider Storj Labs has filed for voluntary Chapter 11 bankruptcy protection in the United States, opening a restructuring process that could test how—if at all—utility-token holders might participate in the equity of a company that emerges from bankruptcy. The filing was made in the US Bankruptcy Court for the Northern District of West Virginia, according to a statement published by Storj.
Storj says the restructuring is aimed at addressing legacy liabilities that it argues can’t be resolved through growth alone, while keeping its network running and preserving the token’s core utility. At the time of writing, STORJ appeared to have reacted mutedly to the news, trading around $0.072 based on CoinGecko data.
Key takeaways
- Storj Labs entered voluntary Chapter 11 in the Northern District of West Virginia while stating that ordinary operations and customer services will continue under court oversight.
- The company says its liabilities largely predate its current strategy and are too large to clear solely through business expansion.
- Storj management plans to propose a pathway for STORJ token holders to participate in the equity of a reorganized company, subject to bankruptcy priorities and court approval.
- Storj has not yet detailed how tokenholder eligibility would work, including whether a token snapshot, lockup, or other criteria would be used.
- STORJ’s market reaction to the filing was limited in the immediate term, with CoinGecko showing trading near $0.072 at publication time.
Chapter 11 filing framed as a legacy-liability fix
On Sunday, Storj announced that it filed for voluntary Chapter 11 “to resolve legacy liabilities and position the business for growth,” according to a post on its own website. The company indicated that day-to-day operations would not stop, and that customer services would continue during the process, but under supervision by the bankruptcy court.
Storj also said its parent company, Inveniam, would continue to support the business throughout the restructuring. That support, along with Storj’s insistence that the underlying network remains functional, is central to the company’s message to token holders: the technology and the token’s intended role should not be treated as collateral to be sidelined while legal obligations are worked through.
A proposal for tokenholder equity—without the mechanics yet
Storj’s open letter to its community argues that the restructuring need is driven by obligations from earlier stages of the company, rather than issues stemming from the present network model. The letter also states that the network is operating normally and that the token’s utility is unchanged.
Crucially, Storj said management intends to submit a plan that would create a mechanism for token holders to participate in the reorganized company’s equity. However, the company has not disclosed essential details, including how eligibility would be determined (for example, whether participation would depend on token ownership at a particular time), whether any tokens would be locked up, or what portion of equity might be offered.
Storj acknowledged that any proposal must align with bankruptcy requirements—meaning the reorganization plan has to follow established priority rules and receive court approval. That constraint matters because Chapter 11 restructurings typically involve complex treatment of different classes of creditors, equity holders, and other stakeholders. In this case, token holders are not automatically treated as equity holders, so Storj’s approach will likely hinge on how the court-approved plan defines who receives value and under what conditions.
Cointelegraph contacted Storj for additional comment but did not receive a response before publication.
Why the Storj case is a test for utility-token ownership
Storj’s bankruptcy filing is likely to draw attention beyond its community because it sits at the intersection of two unresolved questions in crypto: how regulators and courts may interpret token-related claims in insolvency, and whether “utility” token holders can convert their economic exposure into equity-like rights during a restructuring.
The company described the restructuring as a potential “ownership pathway” for STORJ token holders, which—if it moves from proposal to approved plan—could become a reference point for other projects with token distributions and decentralized networks. At the same time, uncertainties remain. Storj has not provided a framework for how a tokenholder-to-equity mechanism would be structured, and bankruptcy priorities could limit what any token holder pathway ultimately looks like.
For market participants and builders, this is also a reminder that decentralized infrastructure tokens can still carry company-level legal and financial risk. Even when networks continue operating, restructuring plans can reshape governance expectations, economic arrangements, and the distribution of future upside.
Part of a broader Chapter 11 wave in crypto
Storj’s filing comes amid a month in which multiple crypto-related businesses sought Chapter 11 protection. Earlier coverage highlighted Movement Labs filing under Subchapter V on July 15 after turmoil connected to its MOVE token, and a separate filing by Bitcoin mining pool Poolin on July 22 as it pursued a court-supervised sale of two Texas mining sites.
Meanwhile, other exchanges faced operational endpoints without filing for bankruptcy. BitMEX announced in July that it would shut down after 11 years, following announcements connected to legal action, while BitMart said it would end trading on Aug. 26 before fully ceasing operations on Jan. 31, 2027. Storj’s case differs in that it is explicitly pursuing a court-supervised reorganization with potential equity-related outcomes for token holders.
Storj itself traces its origins to 2014, when it began as an open-source peer-to-peer cloud storage concept designed to let users rent storage from network participants rather than rely on centralized providers, according to earlier reporting. That longer history may help explain why the company emphasizes continuity: the network has market credibility and operational history, and Storj is positioning Chapter 11 as a legal course-correction rather than a shutdown.
As the bankruptcy process develops, investors and token holders will be watching for what Storj’s eventual reorganization plan actually proposes—particularly the eligibility criteria for tokenholder participation and how (or whether) any proposed equity allocation can comply with Chapter 11 priorities and court approval. The next phase will also reveal whether the network’s stated “normal operation” stance can be maintained through the litigation and settlement decisions that typically follow a major restructuring filing.

Strategy has skipped four straight weekly Bitcoin (BTC) purchases, its longest buying pause in two years. The company reports second-quarter earnings Thursday, July 30, after the US market closes.
SEC filings confirm Strategy’s last purchase covered the week ending June 21. Since then, the company has sold Bitcoin instead of adding to its stack.
A Pause Built on Falling mNAV
Strategy’s stock traded at a premium to its Bitcoin holdings for years, a ratio called mNAV. That premium let the company sell shares above BTC value and grow Bitcoin per share for holders.
The model breaks once mNAV drops toward 1. New share sales then destroy value instead of creating it. mNAV touched roughly 0.99 in late June, its first sub-parity reading ever, before recovering to about 1.03. Strategy’s holdings now trade underwater against their purchase price, and management puts the real breakeven closer to 1.22.
Strategy sold 3,588 BTC in two tranches between June 29 and July 5 for about $216 million. The sales funded preferred stock dividends and topped up its cash reserve. Strategy adopted this capital framework in late June, and the reserve reached $3.225 billion by July 20.
What Thursday Could Show
Strategy posted a $14.5 billion operating loss in the first quarter on Bitcoin’s mark-to-market decline. LSEG’s consensus estimate points to a swing back to $3.86 billion in Q2 operating income, but two of the seven analysts behind that number submitted forecasts before June’s bitcoin slide.
Thursday’s results will show whether Strategy sticks with this trade-off, raising fresh capital while leaving its Bitcoin holdings untouched.
The post Strategy Earnings Loom as Bitcoin Buying Freeze Hits a Month appeared first on BeInCrypto.
Four Big Tech giants report second-quarter earnings this week, testing whether massive AI spending is translating into real returns. SK Hynix also delivers its first results since a record Nasdaq debut, and Tim Cook holds his final call as Apple’s chief executive.
The reports arrive a day before the Federal Reserve’s Wednesday rate decision, with markets already pricing a possible hike. Oil going above $100 a barrel, and subsequently dropping on a pause in hostilities, adds another layer of pressure to the week.
Microsoft and Meta report Wednesday
Microsoft and Meta open the busiest stretch on Wednesday. Analysts expect Microsoft to raise its 2026 capex forecast toward $238 billion. That would test whether spending discipline can offset rising memory chip costs.
Meta faces separate scrutiny. Investors have grown skeptical of Meta’s AI spending, rotating capital toward Google instead. Alphabet’s cloud unit grew 82% last quarter, the number Wall Street now wants Meta to match.
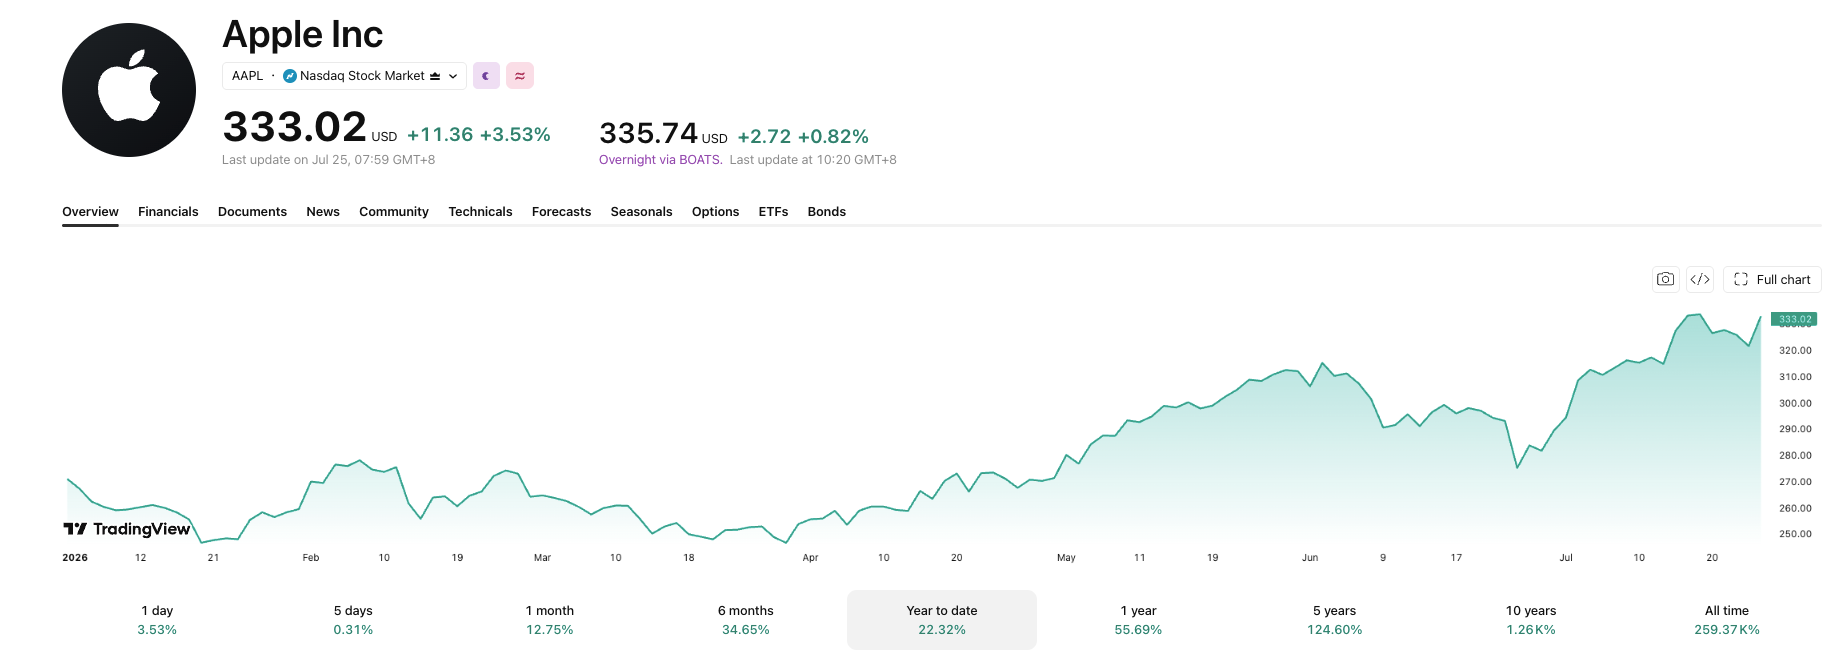
Apple closes an era Thursday
Apple reports Thursday alongside Amazon, in Tim Cook’s final earnings call as chief executive. Analysts expect revenue near $108.9 billion, per MarketBeat estimates. The company has leaned on a capital-light AI approach, avoiding the outsized spending pressuring rivals.
Apple stock hit a record high earlier this month as rising memory prices squeezed cheaper phone rivals.

SK Hynix reports first, on Tuesday
SK Hynix reports Tuesday, its first earnings since a record Nasdaq debut. Consensus points to 84.1 trillion won in sales, per Yonhap Infomax, which would set a new operating profit record. The report follows a volatile month, including a post-listing selloff and a KOSPI rebound past 7,000.
Brent’s climb past $100 adds another variable to the week. Investors are already juggling four earnings reports and a Fed decision in three days. Not to mention the price of oil has slid over 7% as hostilities eased in the Middle East
The post 5 Earnings Reports to Watch as Big Tech’s AI Spending Faces a Test appeared first on BeInCrypto.


Blockaid said an attacker drained about $450,000 in USDT from Garden Finance’s HTLC contracts across Ethereum, Base, Arbitrum and BNB Smart Chain.

Walk that starts and ends with Assheton Arms in Downham

Raman departs as VEEM CEO

BitMart Faces Withdrawal Complaints Following Wind-Down Announcement


-

 Fashion2 days ago
Weekend Open Thread: Brooks Brothers
-

 Crypto World6 days ago
Grayscale Files For Worldcoin ETF, WLD Registers Sharp Rise
-

 NewsBeat5 days ago
How a former Blue Peter presenter stunned America’s Got Talent judges
-
 Tech6 days ago
Sail Virtually Aboard The “Itanic” With IA-64 Emulator
-
 Tech6 days ago
Turtle Beach Command Series KB7 review: a nifty screen-equipped gaming keyboard
-

 NewsBeat7 days ago
Unregistered fitter used Gas Safe logo on business flyers
-

 Tech4 hours ago
Intel is reversing course and bringing hyper-threading back to its server chips
-
 Business5 days ago
New Jersey voter registration controversy explained: How 6,600 noncitizens got on the rolls, and what happens next
-
 Entertainment5 days ago
Johnny Depp’s R-Rated Gothic Cult Classic Gets New Release Ahead of Sydney Sweeney Remake
-

 Crypto World4 days ago
Ethics, other provisions in crypto Clarity Act to be further discussed
-

 Tech7 days ago
Watch Flock Safety CEO Garrett Langley discuss the future of surveillance at TechCrunch Disrupt 2026
-
 NewsBeat6 days ago
Shanghai science forum photos show China’s AI and robotics advances in rivalry with US
-
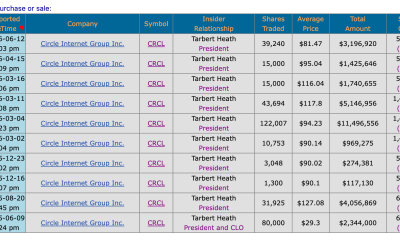
 Crypto World7 days ago
Circle’s President Sold Over 360,000 Shares, The Filings Explain Why
-

 Tech7 days ago
Subway Sandwich Computers Get a Second Life as Gaming Machines
-
 Sports8 hours ago
Commonwealth Games boxing: Jadumani Singh seals dominant 5-0 win over Pakistan’s Sumama Rehman to enter quarter-finals | Commonwealth Games News
-

 News Videos3 days ago
The Peugeot Family: How 200 Years of an “Old Money” Dynasty Died in A Boardroom
-

 Politics16 hours ago
Spain sweeps the board at 2026 World Cup with individual awards
-

 Sports3 days ago
2026 3M Open leaderboard: Scottie Scheffler finds putter in Round 1, sits three back
-

 Fashion3 days ago
16 Dresses for the High Summer Event
-

 Crypto World6 days ago
Andrew Cuomo joins OKX board as crypto exchange expands in U.S.
You must be logged in to post a comment Login