

Crypto World
Dell (DELL) Stock Explodes 32% Higher as AI Server Sales Skyrocket 757%


Key Highlights
- Dell Technologies stock jumped approximately 32% on Friday, tracking toward its strongest single-day performance on record
- First-quarter revenue climbed nearly 88% compared to last year, with AI server sales reaching $16.1 billion — an explosive 757% surge
- Adjusted earnings per share of $4.86 significantly exceeded the Street’s $2.94 forecast
- Susquehanna elevated Dell to Positive with a new price target of $700, up from $138
- J.P. Morgan increased its target to $500 from $280, while Morgan Stanley acknowledged missing the mark on Dell’s potential
Dell Technologies delivered a jaw-dropping earnings report Thursday evening, propelling its shares approximately 32% higher on Friday in what’s shaping up to be the company’s strongest trading session since its return to public markets in 2018.
The results were nothing short of spectacular. First-quarter revenue soared nearly 88% year over year, fueled by unprecedented demand for AI infrastructure. Revenue from AI-optimized servers alone reached $16.1 billion — representing a staggering 757% jump compared to the year-ago period.
Adjusted earnings per share landed at $4.86, crushing Wall Street’s consensus forecast of $2.94.
Ben Reitzes, who leads technology research at Melius, didn’t mince words: “They beat every line in the model — so this wasn’t just AI, it was great execution.”
Wall Street Rushes to Adjust Forecasts
The blowout results triggered a flurry of target price increases Friday morning.
Susquehanna delivered the most dramatic revision, elevating Dell to Positive from Neutral while boosting its price target to $700 from $138. The investment firm highlighted AI server growth occurring without margin compression, expanding opportunities in inferencing workloads, and stronger-than-anticipated performance across client solutions.
J.P. Morgan maintained its Overweight stance while increasing its target to $500 from $280. Analyst Samik Chatterjee observed that Dell’s revised fiscal 2027 guidance was lifted “materially once again,” with customer demand running significantly ahead of projections and order pipeline clarity extending deeper into the calendar.
Dell’s revised full-year AI revenue forecast of $60 billion suggests 144% annual growth, per J.P. Morgan’s analysis.
Citi maintained its Buy recommendation and boosted its target to $475 from $290, characterizing the quarter as an “exceptional beat and raise” with customer demand persistently outpacing available supply.
Morgan Stanley Acknowledges Misjudgment
Morgan Stanley, currently rated Underweight with a $170 target, offered a rare mea culpa in Friday’s research note.
“We got this one wrong, and our model/PT are under review,” wrote analysts headed by Erik Woodring. They described it as “one of the most impressive quarters we’ve seen in our time covering Hardware.”
Conventional server revenue nearly doubled year over year. Storage solutions recorded their fastest expansion in three years. PC division operating margins reached near-peak levels. Full-year guidance received an approximately 40% upward adjustment.
Dell also secured a Pentagon contract valued at $9.7 billion earlier this week to deliver software solutions to U.S. military operations.
Heading into Thursday’s earnings announcement, Dell’s stock had already climbed nearly threefold over the preceding twelve months.
J.P. Morgan acknowledges that Dell’s second-half outlook incorporates a $10 billion sequential revenue deceleration — though analysts emphasize this reflects supply constraints rather than weakening demand, and anticipate continued guidance increases as production capacity expands.
Dell increased its full-year revenue projection to reflect approximately 50% annual growth.



TLDR:
- Major U.S. banks are building tokenized deposit networks for interbank settlement and clearing.
- DTCC plans tokenized equity and Treasury trades before a broader platform launch in October.
- Tokenized stocks surpassed $1.5 billion in value after growing more than 3,300% since 2024.
- SEC discussions around tokenized stock rules signal growing regulatory engagement with the sector.
Tokenization is moving deeper into mainstream finance as major banks, asset managers, and regulators advance new blockchain-based initiatives.
Recent developments span tokenized deposits, securities settlement, stablecoin reserve funds, and tokenized equities.
The activity comes as tokenized stocks continue to record rapid growth across digital asset markets. Together, the moves highlight how traditional financial institutions are increasing their involvement in tokenized finance.
Tokenization Expands Across Banks and Financial Infrastructure
Several of the largest U.S. banks are pushing forward with tokenized payment infrastructure.
According to information shared by Ondo Finance, The Clearing House is developing a shared tokenized deposit network for interbank clearing and settlement.
The initiative involves major institutions including JPMorgan, Citi, Bank of America, and Wells Fargo. The proposed network aims to streamline transfers between participating banks through tokenized deposits.
Momentum is also building in securities infrastructure. The Depository Trust & Clearing Corporation, commonly known as DTCC, plans to begin limited production trades involving tokenized Russell 1000 equities, major ETFs, and U.S. Treasuries in July.
DTCC expects a broader platform launch in October. The organization stated that more than 50 firms have participated in development efforts, including BlackRock, JPMorgan, and Ondo Finance.
Asset managers are also expanding their presence in tokenized markets. According to data highlighted by Ondo Finance, State Street launched a dedicated money market fund designed for stablecoin issuers.
The fund launched with approximately $121 million in assets under management. State Street joins BlackRock, Goldman Sachs, and BNY in offering products aimed at supporting stablecoin reserve requirements.
Tokenized Stocks Growth Draws SEC Attention
Tokenized stocks continue to emerge as one of the fastest-growing sectors in digital assets. Data from RWA.xyz shows the market exceeded $1.5 billion in value by mid-June.
The sector has expanded more than 3,300% since January 2024. That growth has pushed tokenized equities and ETFs into a more prominent position within crypto markets.
Regulators are increasingly examining the trend. According to Reuters, the U.S. Securities and Exchange Commission is evaluating an innovation exemption that could create a modified framework for tokenized stock platforms.
The proposal faced delays after exchanges raised concerns during discussions earlier this year. Reuters reported that revisions to the framework are expected in the coming months.
At the same time, Ondo Finance continues expanding access to tokenized securities. Ondo Global Markets recently added 173 tokenized stocks and ETFs.
The expansion increased the platform’s offering to more than 430 tokenized stocks and ETFs. The assets are available across Ethereum, Solana, and BNB Chain, further broadening access to blockchain-based financial products.


BitGo CEO Mike Belshe has rejected a viral claim that Anthropic’s Mythos model breached nearly all of the National Security Agency’s classified systems, calling the story false as it spread across X this weekend.
His pushback targets posts that recast the government shutdown of a three-day-old model as a real-world hack. The fuller record is less dramatic.
Where the Mythos NSA Breach Claim Came From
The claim originated with Senator Mark Warner, vice chair of the Senate Intelligence Committee. The Economist reported his account of what the NSA director told him.
Warner said General Joshua Rudd, who leads the NSA and US Cyber Command, described the tool in stark terms.
“This tool broke into almost all of our classified systems, not in weeks, but in hours,” the Economist wrote, citing Warner.
Warner raised the example while praising Anthropic, not condemning it. He used it to argue for faster pre-release testing of frontier models.
The detail that went missing online is simple. This was an authorized red-team test on the agency’s own networks, not an outside intrusion.
Shashank Joshi, the Economist editor who published the quote, later cautioned it should not be read literally. He said it depended on Mythos working alongside other tools in particular conditions.
The US government was already a Mythos partner. Anthropic had deployed the model to government cyber defenders through Project Glasswing since April.
Belshe and Others Question the Framing
Belshe, the co-founder and chief executive of digital-asset custodian BitGo, answered one of the threads bluntly.
“I’m calling BS on this,” he challenged.
Follow us on X to get the latest news as it happens
He was not alone. Zack Korman mocked how the claim moved from senator to journalist to social media unchecked.
Analyst Kyle Chase noted the break-in was a test. He said a separate jailbreak flagged by Amazon was the real trigger.
Anthropic’s own statement supports them. It said the flagged jailbreak simply asked the model to read a codebase and fix flaws.
The technique surfaced a few minor, already-known bugs that rival models like OpenAI’s GPT-5.5 can also find.
The company disabled both models on June 12 to meet a US export-control directive, not because of any battlefield breach. It objected to recalling a model used by hundreds of millions of people over one narrow flaw.
Whether the test justified pulling the models is still contested. AI researcher Pedro Domingos argued the export controls were responsible, given the model’s powerful hacking capabilities.
Anthropic itself calls Mythos the strongest cyber model in the world. Yet it says recalling a tool over one flaw would freeze new releases across the industry.
The company is now working to restore access, and is drafting a shared risk framework with the White House.
The post Crypto Executive Disputes Claims Anthropic’s Mythos Breached NSA Systems appeared first on BeInCrypto.


CME is arguing that perps are harmful to its long-dated futures products. The lawsuit alleges that the CFTC did not consider the ramifications of approving perps, and that these products are actually “swaps” as defined by the Dodd-Frank Act, and not “futures.”
Each term carries implications for how the products themselves are to be regulated and what the requirements are for the companies issuing them are. CME CEO Terrence Duffy, who recently announced he’s stepping down next year, told CNBC last week that the distinction mandates different rules for participants.
“The CFTC did not engage in its own analysis of whether its approval of Kalshi’s Bitcoin perpetual as a future is consistent with law,” CME’s lawsuit said. “The CFTC did not even mention the relevant Dodd-Frank provision defining ‘swap.’ Indeed, the word ‘swap’ appears nowhere in the Order.”
The CFTC instead just “rubberstamped Kalshi’s application,” the lawsuit claimed.
What’s interesting is that the actual landscape of companies securing designated contract market (DCM) approvals and moving into perps is growing quite rapidly. On the same day the CFTC granted Kalshi’s application, it sent a no-action letter to Coinbase, seemingly opening the door for that exchange to list perps as well — albeit through an offshore intermediary.
TLDR:
- Sui’s reported 1M operations per second milestone sparked fresh discussion around blockchain scalability.
- Community posts highlighted Sui’s focus on supporting large-scale AI agent activity on-chain.
- CoinMarketCap data showed SUI gaining 0.79% over the past 24 hours amid rising attention.
- Network throughput claims intensified competition among high-performance blockchain platforms.
Sui is drawing fresh attention after claims that its network reached one million operations per second, adding momentum to discussions around blockchain scalability and AI-driven activity.
The milestone surfaced through posts from prominent members of the Sui ecosystem and quickly spread across crypto markets.
Network performance has become a key focus as developers prepare for growing machine-to-machine interactions on-chain. Meanwhile, SUI posted a modest price increase over the past 24 hours despite broader market uncertainty.
Sui Network Scalability Claims Put AI Agent Demand in Spotlight
Discussion around Sui accelerated after posts from the Sui Community account highlighted the network’s reported ability to process 300,000 transactions per second.
The post stated that the network has no hard scalability ceiling and was designed for a future where AI agents could outnumber human users on-chain.
The claim referenced comments from Sui co-founder Adeniyi Abiodun and research discussions involving Grayscale’s research team. According to the shared information, Sui’s architecture was built with large-scale autonomous activity in mind.
Attention intensified after Crypto Banter shared separate comments attributed to Abiodun.
The post stated that the network had reached one million operations per second and that activity from stablecoin systems and automated agents appeared among the earliest indicators of the increased throughput.
The distinction between operations and transactions remains important. However, the figures quickly became a talking point across crypto social media as traders evaluated the implications for future blockchain demand.
Sui has increasingly positioned itself as a network focused on high-speed execution and scalable infrastructure. Those features have become more relevant as AI-powered applications begin interacting directly with blockchain networks.
SUI Price Edges Higher Following Throughput Milestone
The scalability discussion arrived alongside a positive move in the SUI token price. According to CoinMarketCap data, SUI traded at approximately $0.7087 at the time of reporting.
The token recorded a 0.79% gain over the previous 24 hours. The move was relatively modest, yet it coincided with heightened attention around the network’s performance claims.
Trading activity remained active as market participants reacted to the reports circulating across social platforms. The throughput figures generated significant engagement among developers, investors, and infrastructure-focused projects.
Interest in AI-related blockchain infrastructure has expanded throughout the digital asset sector. As a result, claims involving large-scale processing capacity often attract immediate attention from traders.
Posts from the Sui Community account and Crypto Banter helped amplify the discussion, placing network performance at the center of the conversation. The reported milestones also arrived as competition among high-throughput blockchain networks continues to intensify across the crypto market.

Abu Dhabi Global Market (ADGM) has approved the first admission of tokenized digital securities to its Official List, alongside permission for the instruments to trade on a recognized exchange venue. The development signals that tokenized assets can be structured and regulated within an established securities framework, rather than operating only as over-the-counter products or experimental pilots.
The legal filing and regulatory steps were guided by law firm Gibson Dunn, which advised Btech Holdings Limited. According to the firm, the Financial Services Regulatory Authority (FSRA) of ADGM approved the relevant prospectuses on 11 June 2026 under the market and financial services rules that apply to securities listings.
What ADGM approved, and why it matters
ADGM’s announcement centers on the admission of tokenized securities referred to as bStocks. The instruments were characterized under ADGM regulation as securities for the purposes of the Financial Services and Markets Regulations 2015 (FSMR). They were structured as Certificates over Shares, a design choice intended to fit the tokenized product into conventional securities categories.
After FSRA approval of the prospectuses, the securities were admitted to ADGM’s Official List of Securities with effect from the same date, and they were also set to be traded on the Recognized Investment Exchange (RIE) operated by Nest Exchange Limited.
In institutional capital markets, listing and trading rules are critical for liquidity, investor protections, and market integrity. By tying tokenized securities to an official listing process and prospectus approval, ADGM is effectively aligning part of the tokenization market with the same regulatory benchmarks used for traditional listings.
Regulatory pathway: prospectus approval and admission to the Official List
Per Gibson Dunn’s account, FSRA approval was granted for prospectuses drafted by the firm. The approval was described as being provided pursuant to section 61 of FSMR and Rule 4.6 of the Market Rules (MKT), including a reference to meeting requirements under MKT 4.5.
This matters because prospectus regimes are typically designed to ensure disclosures are comprehensive and consistent, covering issuer details, the nature of the instrument, risk factors, and other information required for public market participation. For tokenization to move into mainstream financing channels, regulators and exchanges generally need to ensure tokenized structures still satisfy disclosure and governance expectations.
How the product is structured: certificates over shares
The tokenized instruments were described as securities that fall under FSMR, structured as certificates over shares. The certificate-over-share structure is relevant in regulatory terms because it can help define the rights embedded in the tokenized instrument, including the economic linkage to the underlying shares.
While tokenization often involves distributed ledger infrastructure, the key regulatory question is how the product maps to existing legal definitions. ADGM’s approach, as reflected in this admission, indicates a willingness to treat tokenized securities as regulated securities when the instrument’s legal characteristics are clear and the issuer complies with disclosure and admission requirements.
Implications for tokenization in the UAE and beyond
Institutional tokenization is still searching for scalable market infrastructure and consistent regulatory standards. Regions that can demonstrate repeatable pathways for approvals, listing, and regulated trading have an advantage when issuers and financial intermediaries decide where to deploy tokenized capital markets activity.
ADGM’s step also points to a broader industry trend: regulators are increasingly focused on whether tokenized assets can meet established securities principles, including transparency, market conduct expectations, and investor protections.
In this case, the admission to ADGM’s Official List and the ability to trade on the RIE operated by Nest Exchange potentially reduce operational uncertainty for market participants evaluating tokenized instruments. It may also encourage other issuers considering tokenization to pursue structured, regulated listings rather than limiting activity to private placements.
Role of legal counsel
Gibson Dunn stated it advised on multiple phases of the mandate, including structuring the issuance, preparing prospectuses approved by FSRA, and handling the applications for admission to the Official List and to trading on the RIE.
The firm said the team was led by partners Sameera Kimatrai and Jade Chu, supported by associates Aliya Padhani and Holly Alderton. The matter was also described as involving other partners including Hagen Rooke, Mellissa Duru, and Lauren Cook Jackson.
What to watch next
This admission provides a regulatory reference point for tokenized securities that aim to be integrated into exchange-based trading. Going forward, market observers will likely focus on whether additional tokenized issuances follow the same pathway, how liquidity develops on the trading venue, and whether the market structure attracts issuers and intermediaries at scale.
For investors, the practical value of tokenized securities will depend on execution quality, transparency, custody and settlement mechanics, and ongoing compliance. For issuers, the central question will be whether regulated listing and trading can reduce barriers to issuance while still supporting innovation in how assets are tokenized and distributed.
Crypto World
Could Keir Starmer’s Exit Open the Door to Britain’s Most Crypto-Friendly Labour Leader?
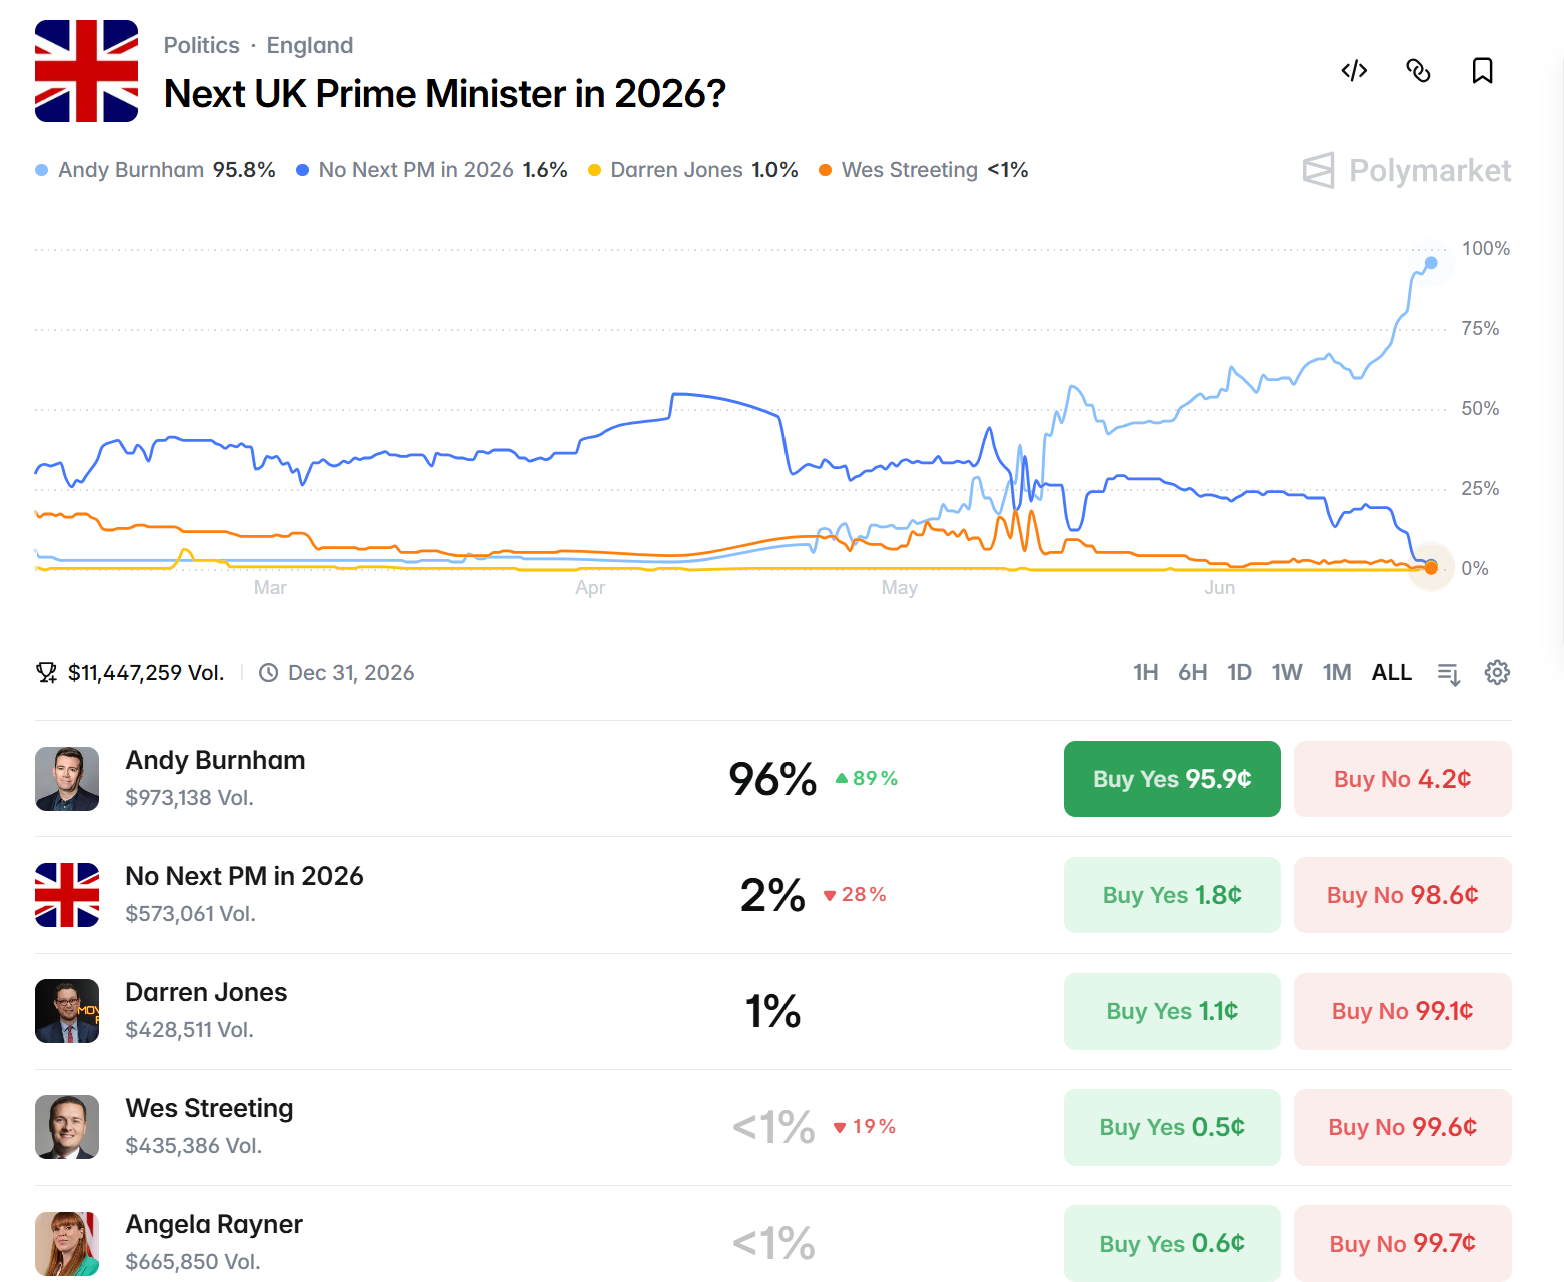
Andy Burnham’s landslide by-election win has handed Labour’s most crypto-friendly figure a clear route to challenge Keir Starmer for the party leadership.
The Greater Manchester mayor will be sworn in as an MP this week, removing the last barrier to a leadership bid. His enthusiasm for Web3 sits awkwardly beside Starmer’s recent crackdown on crypto.
Burnham’s Win Reopens the Leadership Question
Burnham took the Makerfield seat on June 18 with 54.8% of the vote. He beat Reform UK by a majority of more than 9,200, on a turnout that climbed to almost 59%.
By-election turnouts usually fall, so the result reads as a genuine mandate.
He is due to be sworn in within days. On Polymarket, the crypto-settled prediction market, traders have wagered more than $11 million on the succession and make Burnham the clear favorite to take over.

Starmer insists he will fight any challenge.
Weekend reports suggested the prime minister was weighing his future, though his office dismissed talk of an imminent exit.
Cabinet ministers, union leaders and party donors have all joined talks about the timing of a handover.
A Pro-Web3 Voice Against a Crypto Crackdown
Burnham ranks among the few senior Labour figures to openly back digital assets. He told about 100 Web3 founders at a Stand With Crypto event that he was “bought in.”
“Manchester was the home of the Industrial Revolution. Let’s make it the home of the web3 revolution,” Andy Burnham, Mayor of Greater Manchester, in remarks to crypto founders.
That tone clashes with the national party. In March, Starmer’s government imposed a moratorium on crypto donations to political parties.
The independent Rycroft Review had warned that crypto’s anonymity could mask foreign money entering UK politics.
Even so, Burnham’s support looks regional and pragmatic, tied to Manchester jobs rather than markets.
Reform UK is Britain’s most crypto-forward party, and one of only three that had agreed to accept crypto at all.
Its leader, Nigel Farage, has bought Bitcoin (BTC) himself and pitched a national reserve.
Markets Watch the Handover
The political risk has already reached bond markets. The 10-year gilt yield rose to about 4.8% on Friday.

Investors are weighing a Burnham government they expect to borrow and spend more freely, and sterling weakened alongside it.
For crypto, the signal is fainter. Bitcoin traded near $63,900, up less than 1% on the day but down about 17% over the month and 38% on the year.
It sits well below its October record near $126,000, so the turmoil has produced no clear safe-haven bid.

Any read-through also depends on a retail base that is shrinking. Crypto ownership among UK adults has slipped to about 8%, down from 12% a year earlier, the FCA found.
A Burnham premiership could still soften the tone toward Web3 after a year of tighter UK crypto rules, though bond investors look more worried about his spending than his digital-asset views.
His swearing-in and any leadership timetable this week will set the near-term direction. A warmer crypto stance surviving Britain’s fiscal squeeze is the real question for a shrinking crypto electorate.
The post Could Keir Starmer’s Exit Open the Door to Britain’s Most Crypto-Friendly Labour Leader? appeared first on BeInCrypto.
In times when investors are pulling funds out of the spot exchange-traded funds tracking ETH and especially BTC, their behavior toward XRP, HYPE, and SOL has been entirely contrasting.
The ETFs following the three altcoins’ performances continue to see more net inflows even as the market stagnates and uncertainty builds.
XRP, SOL, HYPE ETFs Keep Gaining Capital
CryptoPotato has repeatedly reported on the Ripple ETFs’ impressive performance over the past several weeks, in which most assets, including XRP, recorded fresh losses and dipped to multi-year lows. However, investors using the Wall Street-trading financial vehicles have remained active, with net inflows dominating for months. In fact, there have been only two weeks in the red since mid-March.
The last one, which had only four trading days, also ended in the green. The ETFs attracted $2.82 million on Monday, $5.30 million on Tuesday, and $2.55 million on Thursday. Since Wednesday was a $0.00 day, according to SoSoValue data, that means that the week ended with net inflows of $10.66 million. The cumulative net inflows have tapped a new all-time high of $1.45 billion.
The Solana ETFs also attracted over $7 million in net inflows in the past week, following a red one with $2.58 million in net outflows. HYPE and its ETFs continue to be the current market superstar. The funds saw their third-best week to date, with almost $28 million entering. Moreover, the HYPE ETFs have been on a six-week streak of net inflows since their inception in mid-May.
Their performance has been particularly promising since they have attracted nearly $185 million in net inflows in six weeks. The same six weeks have been highly emotional and full of FUD for the entire crypto market, especially June’s start when most assets tumbled to multi-year lows.

BTC, ETH ETFs Deep in Red
And while the aforementioned altcoins continue to enjoy fresh ETF capital, the same cannot be said for the funds tracking the two largest cryptocurrencies by market cap. As reported earlier, the spot BTC ETFs bled more than $226 million in the past week, and are down by roughly $5 billion in the same six weeks in which the HYPE and XRP ETFs have been only in the green.
The spot Ethereum ETFs are in no better shape. In fact, they are on the same six-week negative streak, pushing the total inflows down by nearly $1 billion. So the question now is whether investors are simply seasonally rotating from larger-cap digital assets into smaller altcoins, or have they completely abandoned BTC and ETH for the new kids on the block.
The post Why Capital Is Flowing Into XRP, SOL, and HYPE Instead of BTC and ETH appeared first on CryptoPotato.
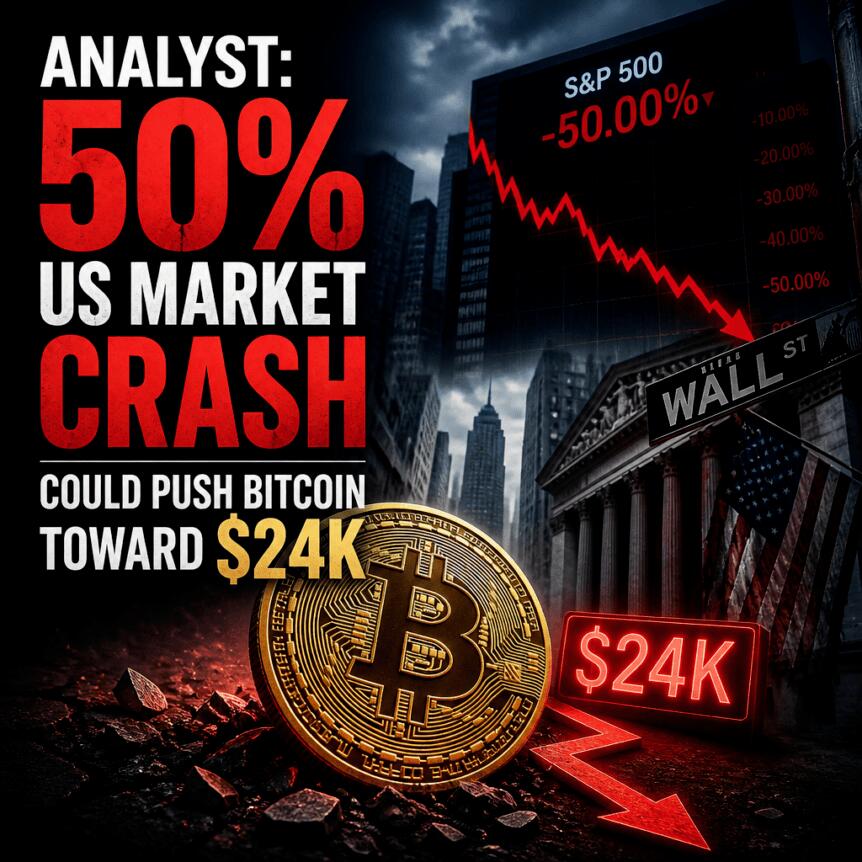
Bitcoin’s downside risks are again back in focus as analyst Jesse Olson laid out a worst-case technical scenario that could send BTC sharply lower if a broader macro shock hits US markets. In a Sunday post, Olson pointed to a multi-week chart setup that, in his view, leaves Bitcoin vulnerable to a move toward $23,980—a level he frames as a key target in the event of a severe stock-market sell-off.
The bearish case is not only technical. Olson’s outlook aligns with what multiple market indicators have been signaling so far in 2026: institutional participation appears muted, with a persistently weak Coinbase premium reading and ongoing spot Bitcoin ETF outflows described by market data providers. Together, these factors suggest that when risk appetite falls, Bitcoin could face stronger selling pressure than what retail alone might typically drive.
Key takeaways
- Olson’s chart work suggests BTC could fall toward $23,980 if US equities undergo a macro downturn of roughly 50%+.
- A negative Coinbase premium is consistent with weaker professional demand rather than aggressive institutional accumulation.
- Since May, SoSoValue data shows US spot Bitcoin ETFs have logged $4.68 billion in net outflows.
- On-chain analyst Darkfost argues institutions tend to wait for confirmation and performance, making them less likely to “buy the bottom” prematurely.
Olson’s worst-case BTC level and the macro trigger
Olson shared a two-week Bitcoin chart outlining a potential pathway for downside under stress conditions. His level is derived from a proprietary Market Sniper Pro VWAP indicator, using a long-term support line based on an anchored, volume-weighted average price (aVWAP) concept.
In the chart framing Olson used, the line appears anchored from the 2022 bear-market bottom. As the chart progresses, that methodology effectively creates a sloping reference zone that traders can watch for whether price is respecting a longer-term “average” support framework—or breaking away from it.
Olson presented $23,980 as a base-case target in a “severe macro sell-off” scenario that includes a US stock market drop of more than 50%. The implication is straightforward: Bitcoin has often traded like a high-risk asset during periods when leveraged positions are unwound and liquidity becomes expensive.
The macro timing risk Olson warns about is not confined to crypto technicals. The article context also references calls from established market observers who have warned about speculative excess or heightened recession risk. For example, GMO co-founder Jeremy Grantham has argued the current AI-led market surge resembles a major speculative bubble, while economist Gary Shilling has warned a US recession is “almost inevitable” by year-end, with stocks potentially declining by 20%–30%. (Those perspectives are cited via links embedded in the original reporting.)
Against that backdrop, the logic for Bitcoin is that a broad equity shock could accelerate crypto de-risking. In practical trading terms, that can mean earlier longs are forced to reduce exposure, and new dip-buying interest—particularly institutional—may take longer to reappear.
Coinbase Premium stays negative, signaling weak “professional” appetite
Beyond chart levels, the report highlights the Coinbase Premium Index—a metric that compares Bitcoin’s price on Coinbase versus Binance. The underlying idea is that when the premium is positive, it often reflects stronger US institutional demand (or at least more aggressive buying pressure on regulated venues). When the reading stays negative, it can point to weaker professional accumulation or heavier selling on Coinbase relative to Binance.
According to the report’s description, the Coinbase premium has been largely negative so far in 2026. That matters because it suggests that, at least in this period, institutional-style demand has not stepped in with the same urgency seen during stronger risk-on phases.
The key tension for traders is that BTC’s price can still rise without sustained premium strength—especially if retail-driven flows dominate. But if the market later shifts into “risk-off,” a lack of steady institutional bid can make drawdowns more abrupt, because there is less natural demand to cushion sell pressure.
Spot Bitcoin ETFs record $4.68B in outflows since May
The institutional-demand picture is reinforced by spot Bitcoin ETF flow data cited from SoSoValue. The report states that since May, US-based spot Bitcoin funds have accumulated $4.68 billion in net outflows.
ETF flow trends are closely watched by many participants because they aggregate buying and selling behavior across traditional brokerage accounts and investment platforms. Net outflows, in that sense, can be read as ongoing caution from professional allocators and advisers rather than a one-off profit-taking event.
While the report doesn’t attempt to forecast ETF flows forward, the combination of negative Coinbase premium and ETF outflows fits the same broader narrative: there isn’t clear evidence, at least in the period referenced, that major institutional channels are actively leaning against weakness.
Why institutions may wait for “confirmation,” not a potential bottom
One reason analysts often provide for institutional behavior under stress is that these players may not buy based on technical “support” signals alone. Instead, they may wait for confirmation—whether that’s stabilization in broader markets, improved volatility conditions, or sustained improvements in inflows.
In a Sunday post cited in the report, Darkfost, a CryptoQuant-associated on-chain analyst, said: institutions “don’t act like retail” and typically operate under “permanent risk management logic.” Darkfost’s point, as quoted, was that institutions are “not looking to buy a potential bottom” but rather for confirmation and performance—adding that the conditions for that are “not the case yet.”
This helps explain why Olson’s downside framing could matter even if the $23,980 area is technically meaningful. If institutional demand is missing—or if ETF outflows continue—then market moves toward lower support zones may be driven less by “buying opportunity” narratives and more by positioning adjustments and liquidity constraints.
Earlier coverage referenced in the report also aligns with the idea that a stock-market crash could push Bitcoin below $30,000. While those earlier remarks are not elaborated in detail here, they strengthen the broader theme: macro shocks can overwhelm crypto’s internal narratives and magnify downside through forced de-risking.
For readers, the key watch items are straightforward: whether BTC’s technical structure actually breaks toward the $23,980 target, and whether institutional indicators change character—specifically the Coinbase premium trend and whether spot Bitcoin ETFs shift from net outflows to inflows. If those signals remain weak, the market may continue to treat rallies as temporary while waiting for broader risk conditions to improve.
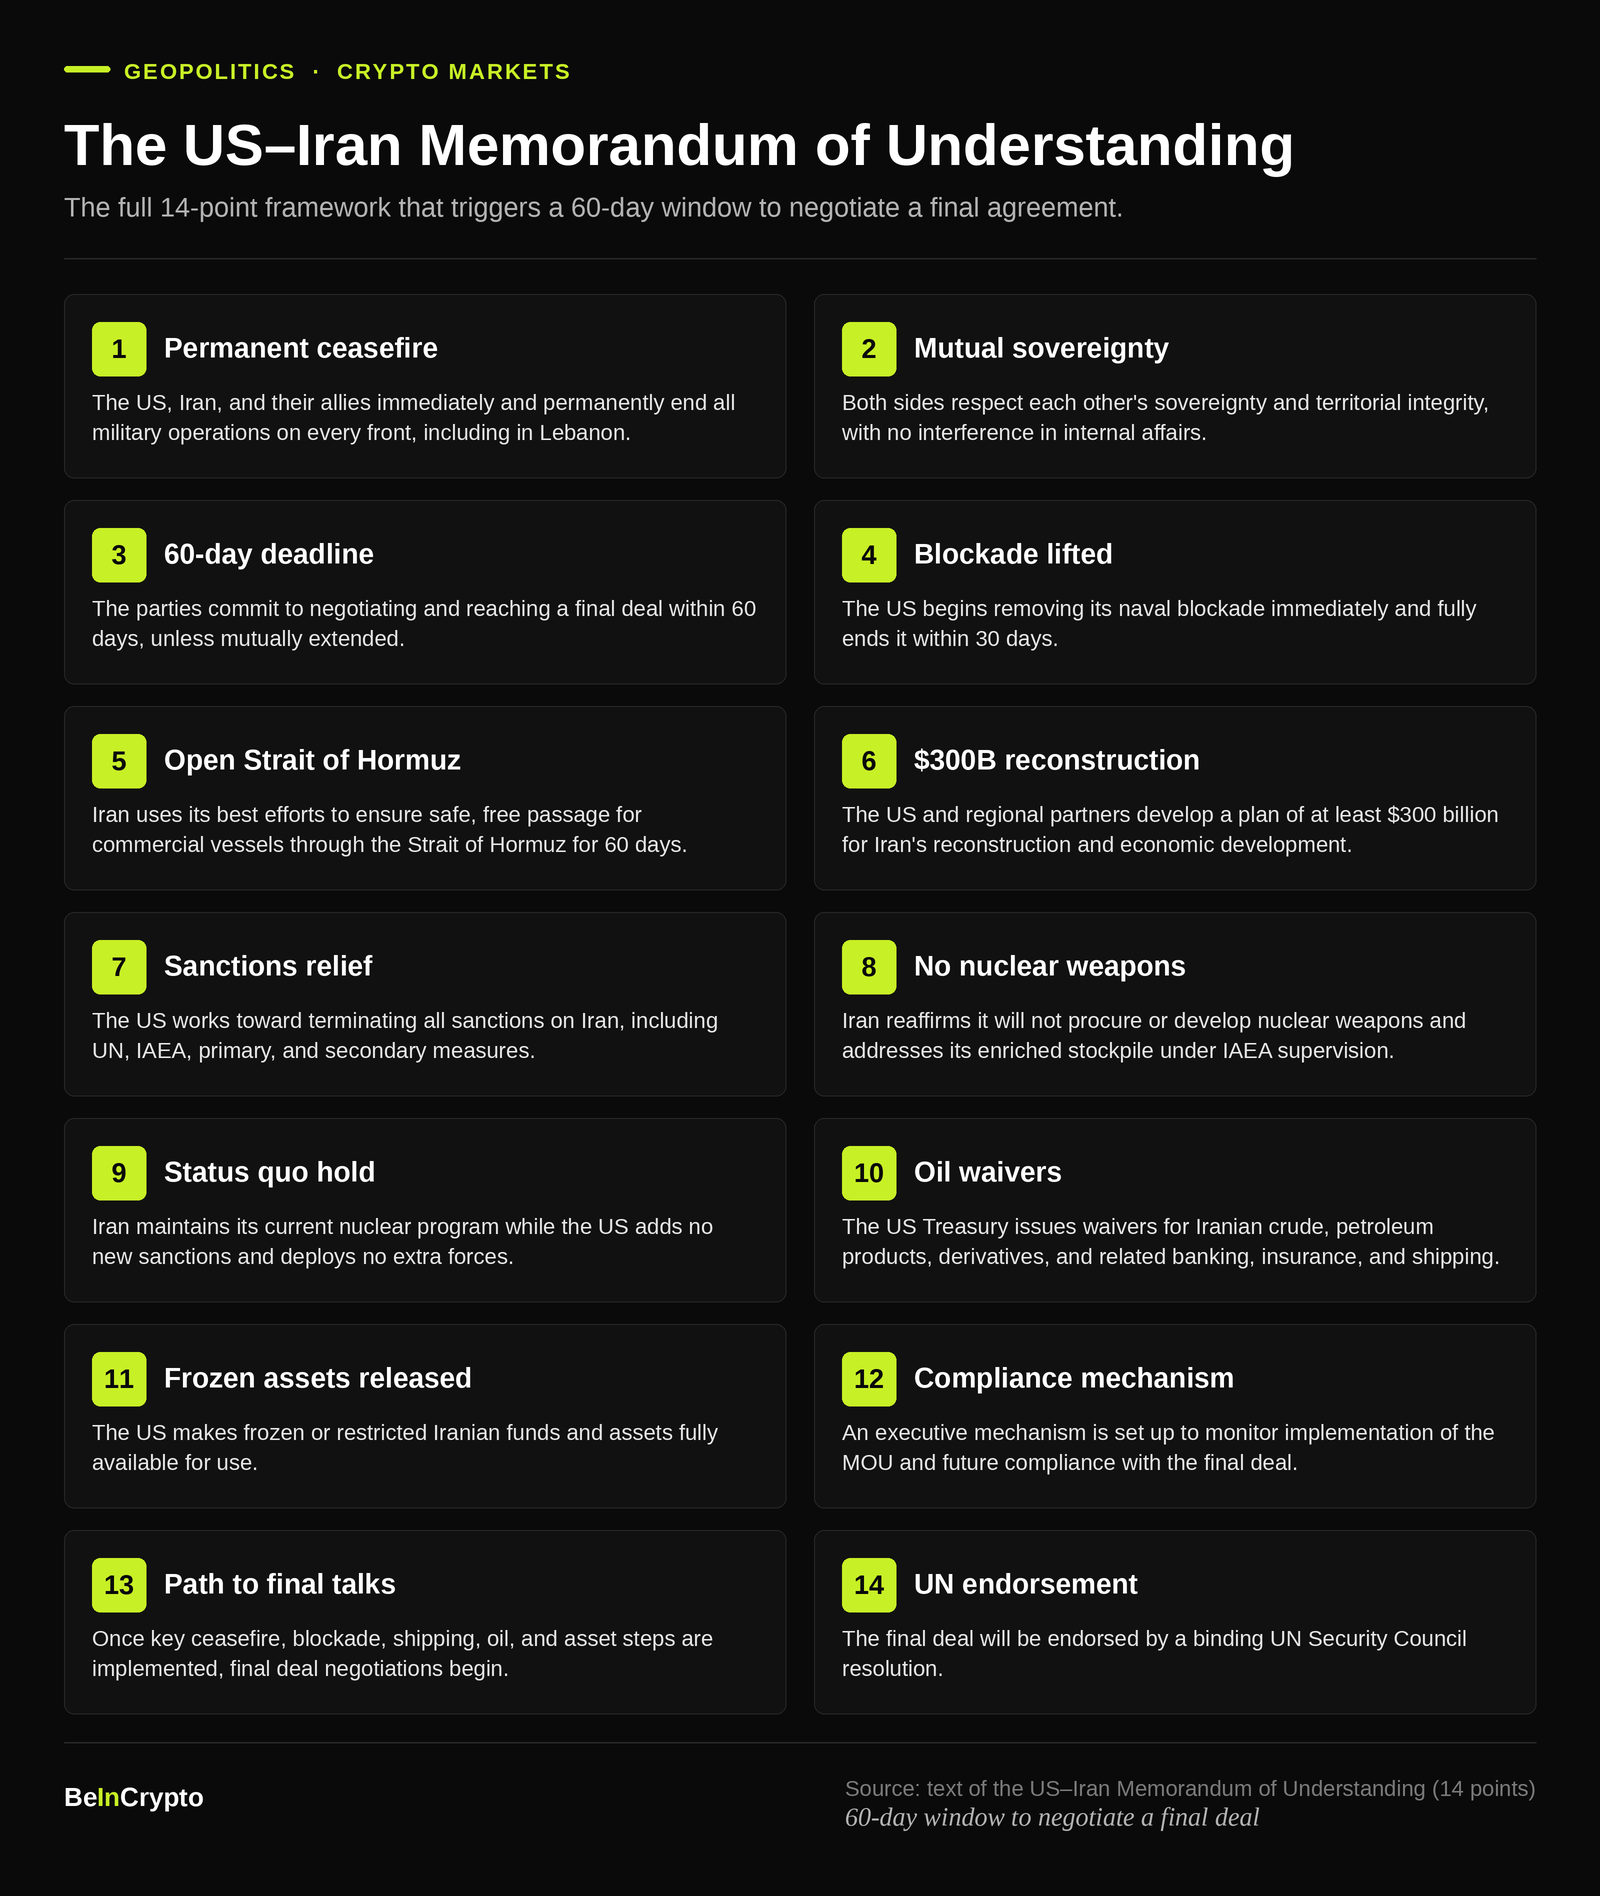
US Vice President JD Vance opened direct US-Iran talks at Switzerland’s Bürgenstock resort on Sunday, even as President Donald Trump threatened fresh military strikes if Tehran fails to rein in Hezbollah.
The talks implement a 14-point memorandum that Trump and Iranian President Masoud Pezeshkian signed on June 17. It set a 60-day ceasefire to end a war that began on February 28 and to reopen the Strait of Hormuz.

US-Iran Talks Open Under Pressure
Vance leads the US side, with Iranian chief negotiator Mohammad Bagher Ghalibaf heading Tehran’s team. Pakistan and Qatar are mediating in a four-way format.
The talks nearly fell apart first. Iran suspended them on Friday over Israel’s strikes in Lebanon, then agreed to meet on Sunday. Vance expects only a couple of days of negotiations.
Washington wants fast movement on Iran’s nuclear program. Tehran wants the fighting in Lebanon to stop first. It is also seeking sanctions relief, the unfreezing of assets, and an end to the US naval blockade.
The truce is fraying. Israeli strikes killed dozens in Lebanon over the weekend, and five Israeli soldiers have died since the deal. The turmoil has even split crypto traders over whether the ceasefire holds.
Bitcoin (BTC) could swing again if the war reignites, a risk analysts have already war-gamed for crypto. Trump, meanwhile, escalated on Truth Social, warning Tehran over its Lebanese proxies.
“Iran must immediately stop their highly paid PROXIES in Lebanon from causing trouble. If they don’t, we’ll hit Iran very hard again, just like we did last week, only harder!!!” Donald Trump, US president, via post.
Follow us on X to get the latest news as it happens
Why Crypto Markets are Watching Hormuz
The Strait of Hormuz is the reason markets care. About 20 million barrels of oil cross it daily. That is close to a fifth of global supply and more than a quarter of seaborne trade.
Iran’s Revolutionary Guard declared the waterway shut on Saturday, citing Israel’s attacks. Yet US Central Command said 55 tankers still passed through that day, carrying more than 17 million barrels.
After the signing, oil fell sharply, and equities set records. Brent crude slipped to about $78 a barrel, and US gas hit $3.99 a gallon, its lowest since March. GasBuddy analyst Patrick De Haan expects sub-$3 gas by early 2027 if the truce holds.
For crypto, the signal runs through oil. Cheaper energy cools inflation and revives rate-cut bets, the script Bitcoin has followed all year.
Yet Bitcoin barely reacted to the deal, holding near $64,000. Last June, a similar Iran ceasefire sent it above $105,000.
The next few days of talks will test whether the ceasefire survives in Lebanon. For crypto, the bigger tell may be oil, not the nuclear file.
The post Trump Issues Fresh Iran Threat as US-Iran Talks Enter Critical Phase appeared first on BeInCrypto.

HIVE Digital Technologies, a Nasdaq-listed infrastructure provider, says it has received approval from the municipal council of Boden to acquire the 32 megawatt Big Boden data centre in northern Sweden. The purchase, focused on long-term control of a key Nordic site, is designed to support HIVE’s plans to expand high-performance computing and AI workloads from within its existing Swedish footprint.
The Big Boden facility has supported HIVE’s operations since 2018. With the approval in place, the company moves from tenant arrangements to ownership, a shift that typically gives data centre operators greater flexibility over long-term capital planning, infrastructure upgrades, and operational resilience targets.
From tenant to owner at Big Boden
Municipal approval is a common procedural step in real estate and infrastructure transactions, particularly where utilities, permitting, and local planning requirements are involved. For HIVE, the significance is practical as well as strategic: a controlled asset can be upgraded on a longer horizon than leased capacity.
In its announcement, HIVE framed the acquisition as a milestone in its commitment to Sweden as a location for “sovereign” AI and sustainable digital infrastructure. The company has previously positioned its compute infrastructure around sustainability and green power sourcing, an increasingly important topic for enterprise AI buyers who face pressure to disclose and manage energy use.
Upgrade path toward Tier III-style capabilities
HIVE said it plans to bring the Boden site toward Tier III infrastructure standards. In data centre terms, that typically relates to higher expectations for redundancy and uptime, including design approaches meant to reduce the risk of unplanned outages. While the company did not provide a detailed timeline in the email update, it indicated the work is intended to strengthen security, redundancy, and uptime capabilities for enterprise-scale AI and high-performance computing workloads.
The company also referenced support for next-generation NVIDIA GPU architectures, pointing to a market demand shift across the industry. Data centre operators are increasingly competing not only on raw power capacity, but also on operational readiness for GPU-intensive deployments, including performance, reliability, and power delivery capabilities suitable for large-scale AI training or inference.
Why data centre ownership matters for compute strategy
In the broader market, many compute infrastructure firms rely on a mix of owned and contracted capacity. Ownership can reduce uncertainty when demand rises, but it also shifts execution risk to the operator, including capex planning, construction timelines, and regulatory compliance.
For companies pursuing AI-related workloads, the reliability dimension is critical. GPU clusters generally require steady power availability, robust cooling, and predictable uptime to maintain service quality for customers and internal deployments. Moving toward a higher tier standard can therefore be an operational necessity rather than a branding exercise.
HIVE’s move to own the Big Boden asset also aligns with a trend in which governments, enterprises, and regulated sectors seek local compute options. Whether referred to as “sovereign” compute, data residency, or strategic infrastructure, the underlying idea is the same, greater control over where workloads run and how infrastructure is governed.
Sustainability and local impact in the background
The email update included figures and context intended to show continuity of investment in the Boden region since HIVE’s earlier entry. It stated that HIVE has invested more than SEK 960 million in the region through local contractors and renewable energy procurement, and that it has contributed more than SEK 575 million in taxes to the Swedish Tax Authority. HIVE also pointed to local community involvement through initiatives such as support for youth and women’s hockey, sponsorship activity, and work linked to heat recovery projects.
While these points are not directly tied to the municipal approval itself, they help explain how data centre operators often build long-term social and regulatory relationships, particularly in markets where energy consumption, land use, and grid impact are recurring political topics.
Implications for HIVE and the Nordic AI infrastructure market
If HIVE executes its upgrade plan as described, the Big Boden facility could strengthen the company’s ability to serve enterprise and institutional customers looking for AI compute capacity in northern Europe. In practice, the key question for investors and customers will be how quickly capacity can be upgraded to the desired operational standard and how performance targets translate into usable capacity for GPU-based deployments.
HIVE also indicated the project fits into a broader strategy aimed at developing renewable-powered AI infrastructure across multiple jurisdictions. For the Nordic region specifically, the acquisition underscores ongoing competition among compute operators to secure energy-backed capacity and to position their facilities for AI workloads with higher reliability expectations.
For now, the municipal approval clears the way for the transaction and subsequent development plans. The next milestones will likely involve the deal completion process and disclosure around the scope and timing of upgrades at the 32 MW site.
Note: This update is based on information provided in the announcement circulated to the media.

Women’s T20 World Cup: India vs South Africa highlights

BMPS 2026 Grand Finals Rankings After Day 3: GodLike Qualify For EWC in Paris
Wall Street’s Tokenization Race Heats Up as SEC Reviews New Rules


-

 Fashion2 days ago
Weekend Open Thread: Miami – Corporette.com
-
Crypto World7 days ago
Zimbabwe Requires Crypto Businesses to Register Annually Under New FIU Regulations
-
 Business2 days ago
Wall Street Week Ahead: Investors see Micron earnings as pulse check of AI rally momentum
-
 Entertainment7 days ago
Matt Damon’s Viral Sci-Fi Thriller Has Taken Over HBO Max
-

 Crypto World2 days ago
HIVE shares jump as $220M AI deal speeds Bitcoin mining pivot
-

 Business7 days ago
Anthropic staff to meet White House officials next week, Axios reports
-
 Crypto World7 days ago
Bitcoin could crash to $48,000, if this historical pattern is triggered
-
 NewsBeat7 days ago
what doctors are seeing in ebike crashes
-
 NewsBeat7 days ago
Warning of disruption as Cardiff Crossrail works to start
-
 NewsBeat7 days ago
Tributes to former deputy head teacher at Cambridge school among death and funeral notices
-
 Entertainment7 days ago
Kate Middleton Glare Goes Viral After Kids Booed At Royal Event
-

 Politics7 days ago
“Israel’s” ban on ICRC visits ruled illegal, but Knesset moves to stop them permanently
-
 Crypto World7 days ago
XRP ETFs Outperform As Bitcoin And Ethereum Funds Extend Outflow Trend
-

 Tech7 days ago
Over 400 Arch Linux packages compromised to push rootkit, infostealer
-

 News Videos7 days ago
Financial Accounting | Last Day Revision Strategy and Booster | CMA Inter – June 2026
-

 Sports7 days ago
Dick Advocaat’s Curacao scores first-ever World Cup goal against Germany
-

 Business7 days ago
Invesco Quality Income Fund Q1 2026 Commentary
-

 NewsBeat7 days ago
Singer Oliver Tree dies aged 32 in helicopter crash in Brazil
-
 Tech5 days ago
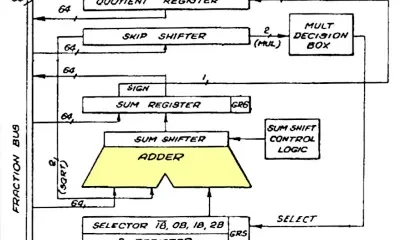
The Adder At The Heart Of Intel’s 8087 FPU
-
 Tech7 days ago
Microsoft Updates Six Windows’ Apps. ‘Photos’ Gets Watermarks for Copilot Images (Off by Default)
You must be logged in to post a comment Login