
Crypto World
Digital Asset Treasury Giants Step Up Purchases


Strategy and Bitmine both announced fresh crypto buys today, while Metaplanet revealed its latest capital raise.
Strategy and Bitmine — the two largest digital asset treasury companies by crypto holdings — disclosed fresh crypto acquisitions on Monday, continuing the aggressive accumulation that defined their activity last week.
Strategy acquired 22,337 BTC for approximately $1.57 billion at an average price of ~$70,194 per Bitcoin. The Michael Saylor-led firm now holds 761,068 BTC, acquired for a total of ~$57.61 billion at an average cost of about $75,696 per coin — meaning the entire treasury sits just 1.8% underwater at current prices, with BTC currently trading around $74,300.
The buy is Strategy’s largest this year so far, and 4,343 BTC larger than the previous purchase, disclosed last week, which had an average per coin price of $70,946, as The Defiant reported.
MSTR shares were trading around $146, up about 5% on the day so far, according to Yahoo Finance.
Also today, March 16, the CEO of Metaplanet, Simon Gerovich, added to that momentum, announcing a new capital raise for the Japanese Bitcoin treasury firm. Metaplanet raised $255 million from investors, and said an additional monetization of its equity could bring in another $276 million. The move gives the firm up to $531 million to invest in Bitcoin, toward Metaplanet’s goal of holding 210,000 BTC.
Per data from Bitcointreasuries, Metaplanet is currently the fourth-largest Bitcoin DAT, holding 35,102 BTC.
ETH Moves
Bitmine Immersion Technologies, the dominant Ethereum treasury company, also reported a fresh purchase this week. Bitmine announced today that its ETH holdings have reached 4,595,562 tokens, at an average price of $2,185 per token. The firm bought 60,999 ETH in the past week, per a press release. The latest purchase is only slightly larger than the previous week’s of 60,976 ETH, but both are notably above Bitmine’s average weekly buy of 45,000-50,000 ETH.
Bitmine now owns 3.81% of the total ETH supply, advancing toward its stated “alchemy of 5%” target. Chairman Tom Lee also noted that Bitmine acquired 5,000 ETH directly from the Ethereum Foundation to enable the EF to fund its operations without selling into the open market.
BMNR shares rallied 11% today, trading at $22.80, per Yahoo Finance. The spot price of ETH is up over 9% today to trade near $2,300.
The moves are part of a broader wave of institutional DAT activity. As The Defiant reported in August, DAT companies collectively held over $100 billion in digital assets at the time, led by publicly listed companies such as Strategy, Metaplanet, and SharpLink Gaming. The crypto treasury strategy for public firms moved from an experiment, led by Strategy, to a trend last year, as The Defiant reported.
This article was written with the assistance of AI workflows. All our stories are curated, edited and fact-checked by a human.

Key points:
-
Sellers will attempt to halt the recovery at $74,508, but if buyers bulldoze their way through, the rally may reach $84,000.
-
Select major altcoins have risen above their overhead resistance levels, signaling solid demand at lower levels.
Bitcoin (BTC) rallied to $74,508 on Monday, a level that is a key near-term resistance. Crypto sentiment platform Santiment said in a recent report that wallets holding between 10 and 10,000 BTC have started accumulating, which in the past was a bullish sign.
US spot BTC exchange-traded funds (ETFs) have also attracted investors, recording five straight days of inflows last week. Bernstein said in a Monday research note shared with Cointelegraph that sustained inflows into BTC ETFs and steady corporate buying by companies such as Strategy have strengthened BTC’s long-term holder base, contributing to a more stable market structure during periods of stress.

BTC is showing signs of a trend reversal, but the bears are unlikely to give up easily. Higher levels are likely to attract sellers who will attempt to trap the aggressive bulls. Material Indicators cofounder Keith Alan said in a video analysis that BTC is still in a bear market, and the price may retest the support near $60,000.
Could buyers sustain BTC and major altcoins above their resistance levels? Let’s analyze the charts of the top 10 cryptocurrencies to find out.
S&P 500 Index price prediction
The S&P 500 Index (SPX) turned down from the 20-day exponential moving average (6,799) on Tuesday, indicating a negative sentiment.

The index may reach the 6,550 level, which is a crucial level to watch out for. If the price rebounds off the 6,550 level with force, the index may reach the 20-day EMA, where the bears are expected to step in. If the price turns down sharply from the 20-day EMA, the likelihood of a break below the 6,550 level increases. The correction may then deepen to the 6,350 level.
On the contrary, a close above the moving averages suggests that the index may remain inside the 6,550 to 7,002 range for a while longer.
US Dollar Index price prediction
The US Dollar Index (DXY) reached the 100.54 resistance on Friday, which is a critical level to watch out for.

The upsloping 20-day EMA (98.76) and the RSI near the overbought zone suggest that the path of least resistance is to the upside. If buyers thrust the price above the 100.54 level, the index might start a new uptrend to the 102 level and later to the 103.54 level.
Contrary to this assumption, if the price turns down sharply from the current level and breaks below the moving averages, it suggests that the index may remain inside the 95.50 to 100.54 range for some more time.
Bitcoin price prediction
BTC continued its upward march and reached the $74,508 resistance, where the bears are expected to mount a strong defense.

The 20-day EMA ($70,028) has started to turn up, and the RSI is in the positive territory, indicating that the buyers are attempting to take charge. A close above the $74,508 level will complete a bullish ascending triangle pattern, opening the gates for a rally to $84,000. Such a move suggests that the downtrend may be over.
Sellers will have to pull the BTC price below the moving averages to weaken the bulls. The BTC/USDT pair may then slump to the support line. A close below the support line tilts the advantage back in favor of the bears.
Ether price prediction
Ether’s (ETH) consolidation between $1,750 and $2,111 resolved to the upside with a breakout on Sunday.

The moving averages are on the verge of a bullish crossover, and the RSI is in the positive zone, indicating that buyers are back in the game. The ETH price may rally to $2,600 and then to $3,450. Such a move suggests that the ETH/USDT pair may have bottomed out at $1,747.
The 20-day EMA ($2,072) is the vital support to watch out for on the downside. A close below the 20-day EMA signals that the bears are active at higher levels. The pair may then tumble to $1,916.
BNB price prediction
BNB (BNB) closed above the $670 resistance on Sunday, but the bulls are struggling to sustain the higher levels.

The 20-day EMA ($646) is the critical support to watch out for on the downside. If the price bounces off the 20-day EMA with strength, the BNB/USDT pair may rally to $730 and subsequently to $790.
This positive view will be invalidated in the near term if the BNB price continues lower and breaks below the 20-day EMA. That may keep the pair range-bound between $570 and $670 for a while longer.
XRP price prediction
XRP (XRP) has risen above the 50-day simple moving average ($1.46), indicating sustained buying by the bulls.

If the XRP price closes above the 50-day SMA, the next stop is likely to be the breakdown level of $1.61. If the price turns down from $1.61 but finds support at the 20-day EMA ($1.41), it suggests a bullish sentiment. The XRP/USDT pair may then climb to the downtrend line.
On the contrary, if the price turns down from the overhead resistance and breaks below the 20-day EMA, it signals that the bears are selling on minor rallies. That may retain the price inside the descending channel pattern.
Solana price prediction
Solana (SOL) has reached the breakdown level of $95, which is a critical overhead resistance to keep an eye on.

If buyers overcome the barrier, the SOL/USDT pair may surge to $117. Sellers are expected to pose a substantial challenge at $117, but on the way down, if the bulls maintain the SOL price above $95, it suggests a positive sentiment. That increases the possibility of a rally to $147.
Instead, if the price turns down sharply from the current level and breaks below the 20-day EMA ($87), it suggests that the pair may extend its stay inside the $76 to $95 range for some more time.
Related: Bitcoin hits $74.4K six-week high as analysts see ‘more upside’ for BTC
Dogecoin price prediction
Dogecoin (DOGE) has risen above the 50-day SMA ($0.10), indicating that the bears are losing their grip.

The DOGE/USDT pair may rally to the breakdown level of $0.12, where the bears are expected to sell aggressively. If the DOGE price turns down sharply from $0.12, it points to a possible range formation. The pair may swing between $0.09 and $0.12 for a few days.
On the other hand, a break and close above the $0.12 resistance signals that the bulls are back in the driver’s seat. That clears the path for a rally to the $0.16 level, which is expected to behave as a stiff resistance.
Cardano price prediction
Cardano (ADA) has surged above the 50-day SMA ($0.28), indicating that the bulls are attempting a comeback.

The bears are expected to vigorously defend the downtrend line, but if the bulls prevail, the ADA/USDT pair may signal a short-term trend change. The ADA price may rally to $0.37 and then to $0.44.
Contrarily, if the price turns down sharply from the downtrend line and breaks below the moving averages, it suggests that the pair may continue to oscillate inside the channel for a few more days.
Hyperliquid price prediction
Sellers attempted to pull Hyperliquid (HYPE) back below the breakout level of $36.77 on Sunday, but the bulls held their ground.

That suggests the bulls are striving to flip the $36.77 level into support. If they manage to do that, the HYPE/USDT pair may ascend to $43 and then to $50.
The first support on the downside is at $36.77 and then at the 20-day EMA ($33.95). Sellers will have to tug the HYPE price below the 50-day SMA ($31.56) to suggest that the market has rejected the breakout above $36.77. The pair may then plummet to $29.
This article does not contain investment advice or recommendations. Every investment and trading move involves risk, and readers should conduct their own research when making a decision. While we strive to provide accurate and timely information, Cointelegraph does not guarantee the accuracy, completeness, or reliability of any information in this article. This article may contain forward-looking statements that are subject to risks and uncertainties. Cointelegraph will not be liable for any loss or damage arising from your reliance on this information.

The protocol’s tokenized RWA value is down this month, driven by a steep drop in the value of its corporate credit fund, JAAA.
Centrifuge’s native token CFG has rallied roughly 60% in the past 24 hours after Binance, the largest centralized exchange buy trading volume, announced it would list the token for spot trading today, March 16. CFG is the real-world asset (RWA) tokenization protocol’s native governance and utility token.
The price of CFG reacted to the news nearly immediately, soaring from around $0.12 to as high as $0.23 at its intraday peak — a 90% rally — before retracing to approximately $0.19 at time of writing, per CoinGecko data. 24-hour trading volume reached over $178.8 million, per CoinGecko, with most of today’s volume, over $118.7 million, occurring on Korean CEX Upbit for the CFG/KRW trading pair.
Meanwhile, the CFG/USDC pair on Binance is trading around $0.19, up almost 100% on the 24-hour timeframe. 24-hour trading volume for CFG on Binance has reached over $13.6 million at publishing time.
Per the listing announcement, Binance applied a so-called Seed Tag to the listing — a designation the exchange uses for higher-risk or less-established tokens that requires users to pass a quiz before trading.
CFG had already seen a listing-driven surge on Feb. 26, when Upbit’s announcement sent the token up over 200% intraday to over $0.24.

Tokenized RWA Value Slips
On the fundamentals side, RWAxyz data shows Centrifuge’s distributed asset value across its tokenized RWAs at $1.23 billion, down over 8% this month. The majority of value across the platform’s four tokenized funds sits on Ethereum, which holds nearly $922 million at publishing time — though that value is down 10.55% in the past 30 days.
Centrifuge’s largest tokenized RWA product, Janus Henderson Anemoy Treasury Fund (JTRSY), holds U.S. Treasuries and has a market cap of $761.3 million.

Meanwhile, RWAxyz shows that the value of Centrifuge’s corporate credit fund, Janus Henderson Anemoy AAA CLO Fund (JAAA) slipped over 42% in the last month, which accounted for the broader net losses across its tokenized products. JAAA currently holds $416,6 million in value on-chain, mostly on Avalanche C-Chain and Ethereum.
The platform’s overall on-chain RWA value crossed the $1 billion milestone for the first time last August on the back of institutional demand for its JAAA fund. The firm launched a $100 million tokenized credit strategy with Resolv on Aave’s RWA platform Horizon in late February.
This article was written with the assistance of AI workflows. All our stories are curated, edited and fact-checked by a human.


Jane Street-related wallets have received over $15 million BTC from two centralized exchanges.
Infamous quant trading giant Jane Street, which has been alleged by many to be involved in Bitcoin’s “10 AM dump,” has resumed notable BTC-related activity. The firm remains under scrutiny from regulators, as well as from market participants.
According to a post by Lookonchain, in the past 2 hours, wallets associated with Jane Street have received a total of 25.36 BTC worth $15.08 miollion from two centralized exchanges – BitMEX and LMAX Digital.
Jane Street, recently accused of insider trading during the LUNA/Terra crash and dumping $BTC at 10 AM, is actively trading again.
In the past 2 hours, wallets linked to #JaneStreet received 205.36 $BTC($15.08M) from BitMEX and LMAX Digital.https://t.co/6Jt6RTJRed pic.twitter.com/JJ4PKyCVA4
— Lookonchain (@lookonchain) March 16, 2026
The move suggests that the firm may have restarted trading flows after a period of relative quiet. The renewed attention comes at a rather sensitive time for the firm. As CryptoPotato reported earlier this year, Terraform Labs’ court-appointed administrator filed a lawsuit, accusing Jane Street of insider trading tied to the dramatic collapse of the entire Terra/Luna ecosystem back in May 2022.
Jane Street has strongly denied all the allegations, calling them baseless, and also argued that the lawsuit is simply an attempt to shift the blame for Terraform Labs’ own failure.
Meanwhile, multiple X analysts and market observers have alleged that the trading firm is responsible for regularly dumping Bitcoin’s price at 10 AM, calling it the “Jane Street 10 AM dump.”
Despite that controversy, other industry experts reject the notion. Matt Hougan, chief investment officer at Bitwise, recently dismissed claims that the firm orchestrated these declines, describing the pattern as a “classic crypto winter” rather than the result of a coordinated trading activity.
You may also like:
Binance Free $600 (CryptoPotato Exclusive): Use this link to register a new account and receive $600 exclusive welcome offer on Binance (full details).
LIMITED OFFER for CryptoPotato readers at Bybit: Use this link to register and open a $500 FREE position on any coin!
T. Rowe Price, the $1.8 trillion asset manager best known for managing mutual funds and retirement accounts, has amended the registration statement for its proposed Active Crypto exchange-traded fund (ETF), updating a prospectus first submitted in October that outlines plans for an actively managed fund investing directly in digital assets.
The amendment with the US Securities and Exchange Commission (SEC) was submitted on Monday and lists 15 eligible digital assets that may be considered for the portfolio, including Bitcoin (BTC), Ether (ETH), Solana (SOL), XRP (XRP), Avalanche (AVAX) and Shiba Inu (SHIB).
The updated filing adds new operational details but it leaves the core structure of the proposed fund intact. The amendment names Anchorage Digital Bank as the ETF’s crypto custodian, expands disclosures around share creation and redemption, and adds Sui (SUI) to the list of eligible digital assets.

The asset list is largely consistent with the October filing, according to Cointelegraph’s earlier reporting. At the time, the proposal surprised some industry observers, given T. Rowe Price’s historically conservative focus on traditional investment products such as mutual funds over its nearly nine-decade history.
It also provides updated information on the FTSE Crypto US Listed Index, including constituent weights as of January 2026, and expands risk disclosures related to portfolio turnover and the fund’s active trading strategy.
Related: SEC’s ‘Crypto Mom’ calls for simpler disclosure rules, flags tokenization debate
TradFi asset managers embrace crypto ETFs
In October, NovaDius Wealth Management president Nate Geraci said T. Rowe Price’s crypto ETF filing came out of “left field,” given the company’s long-standing focus on traditional mutual funds and its relatively recent entry into the ETF market.
With the proposal, T. Rowe Price joined a growing list of traditional financial institutions that have launched crypto investment products, including BlackRock, Fidelity, Franklin Templeton, VanEck and Invesco.
The original filing came near the peak of the crypto market, shortly after Bitcoin surged above $120,000. It also coincided with the Oct. 10 liquidation event, when a sharp market reversal triggered billions of dollars in forced liquidations across leveraged crypto derivatives positions.

Since then, digital asset prices have retreated, and crypto ETFs have recorded notable outflows, reflecting cooling investor sentiment after the rally in 2024 and 2025.
Related: Bernstein says Bitcoin rebound reflects more resilient long-term holder base

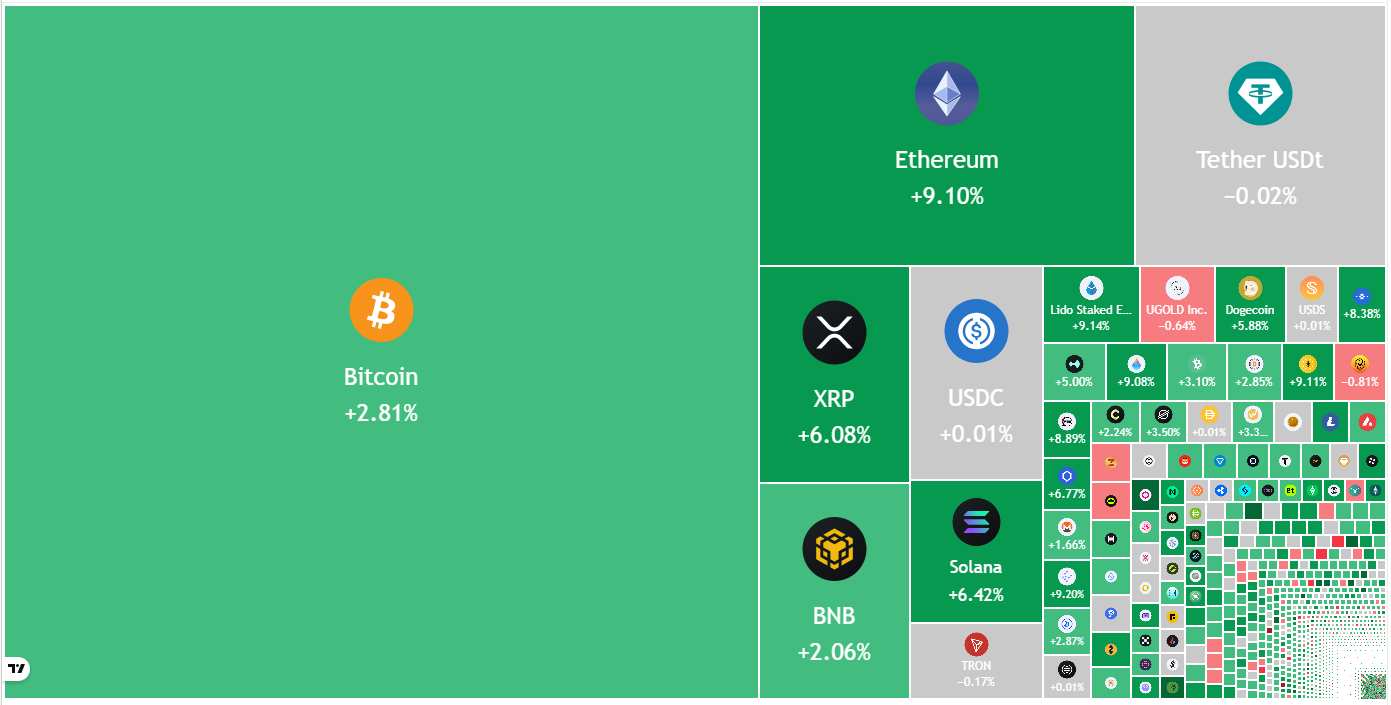
Pepe price rose as the best performer in the crypto market amid a market-wide recovery triggered by Bitcoin’s surge past $74,000 support.
Summary
- Pepe price jumped about 21% to a two-week high as the broader crypto market rebounded following Bitcoin’s surge above the $74,000 level.
- Trading activity surged sharply, with PEPE’s daily volume rising more than 380% as nearly $1 billion worth of the token changed hands.
- Technical indicators show bullish momentum building, with PEPE moving above key moving averages while traders watch resistance near the 100-day SMA.
According to data from crypto.news, Pepe (PEPE) price shot up 21% to a two-week high of $0.000040 as of last check on Monday, March 16. Despite this, it still remains nearly 19% below its February high of $0.0000049.
Pepe’s gains came primarily due to a broader market recovery that followed Bitcoin’s surge past the $74,000 resistance level, which boosted investor demand for risk assets. Ethereum (ETH) was also up 8% at the time of writing, while other major coins such as XRP, SOL, DOGE, and ADA also marched higher.
As a high-beta memecoin, PEPE amplified the gains of the broader market, outperforming the global average with its staunch rebound today.
PEPE’s rebound was further fueled by a notable surge in trading activity. Over the past 24 hours, its daily trading volume shot up over 380% as nearly $1 billion worth of Pepe coin exchanged hands between traders.
Technical indicators seem to suggest that the Pepe price could still have steam left to sustain its rally at least over the following sessions.
Notably, the Pepe price has surged past the 20-day and 50-day moving averages as it formed a god candle today. This explosive vertical movement indicates strong buying pressure and a shift in market sentiment.
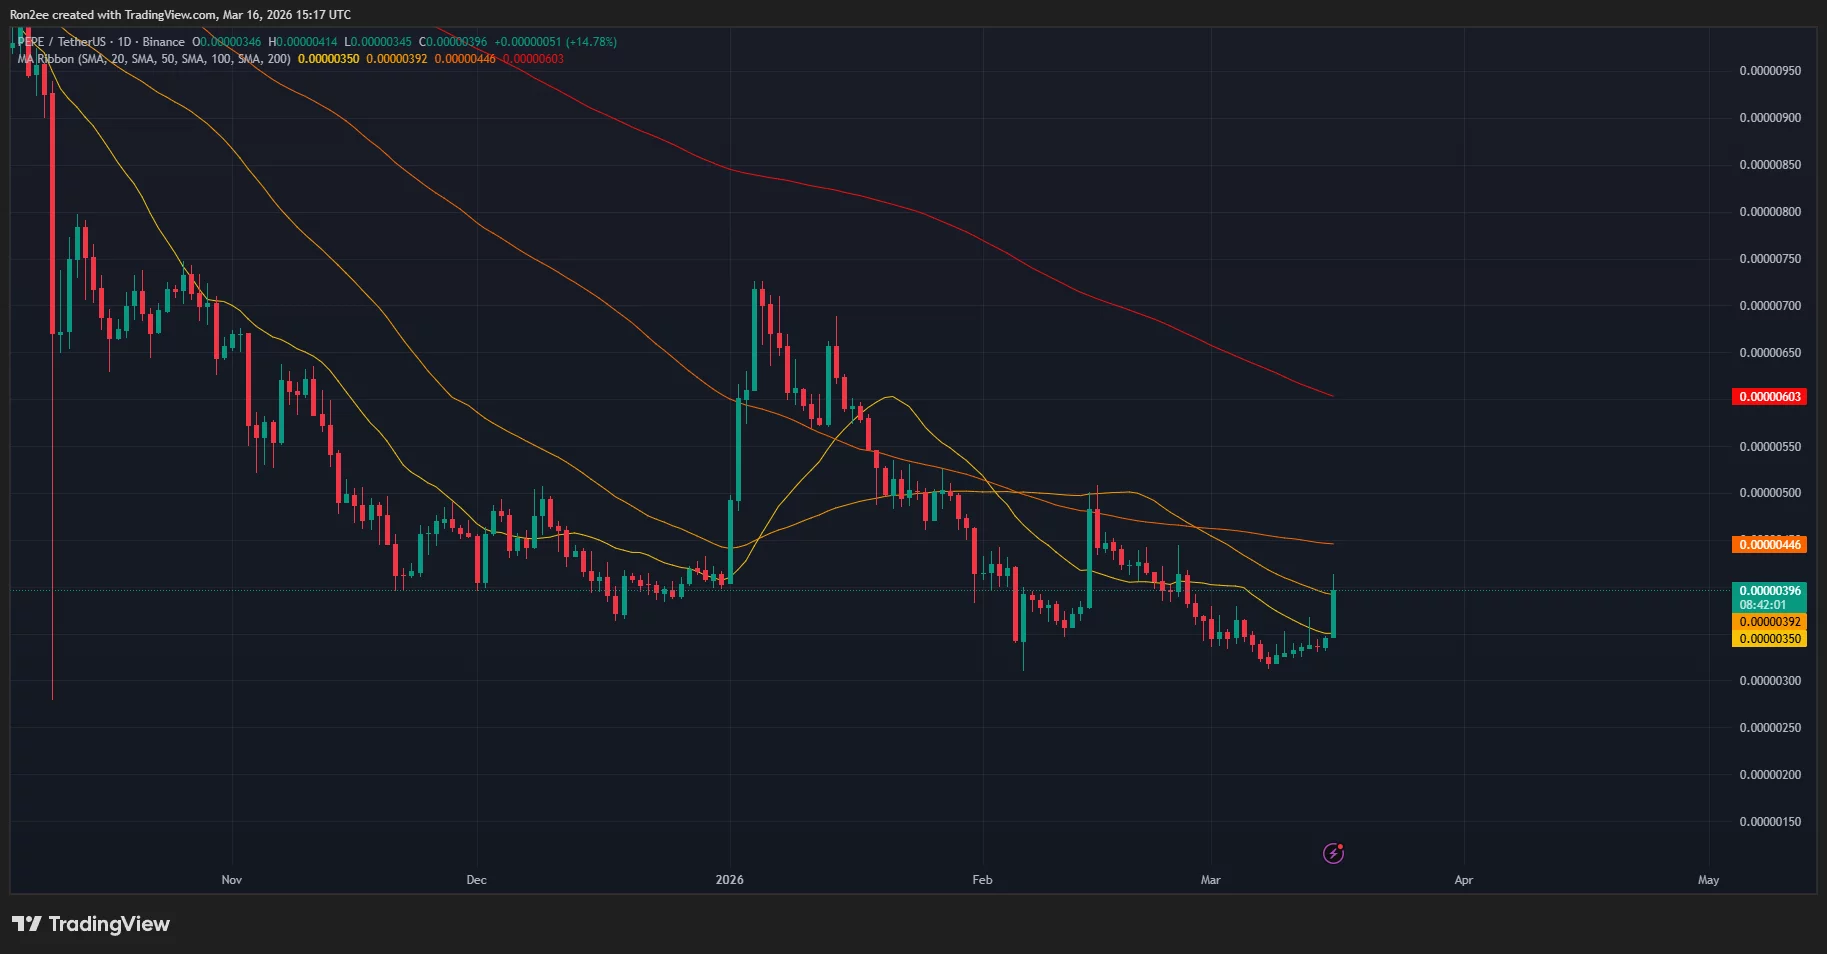
The next target for PEPE stands at the 100-day SMA at $0.0000044, which represents a key resistance level that bulls must flip to confirm a long-term trend reversal.
Momentum indicators like the MACD and RSI show that bulls were still holding the upper hand in the current market structure. The MACD lines were pointing upwards after a bullish crossover, confirming that upward momentum is accelerating.
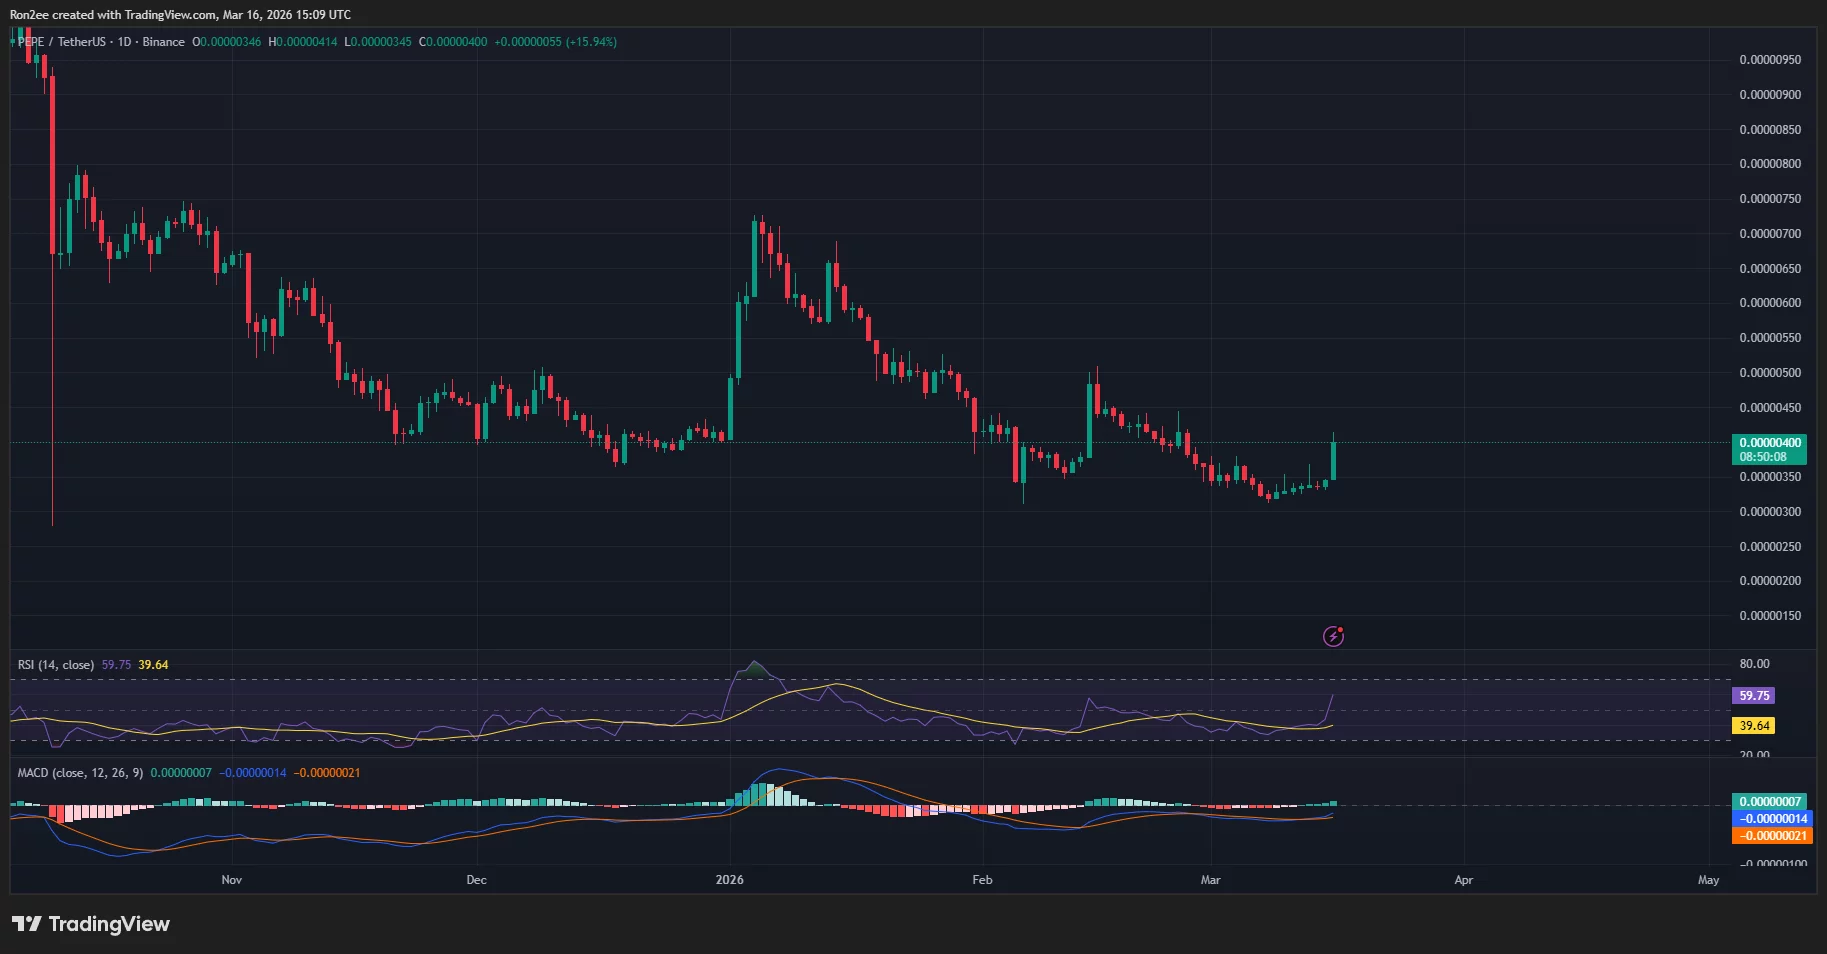
Meanwhile, the RSI has recently surged past the neutral threshold with still room before hitting overbought levels where a reversal usually takes place. This suggests that the current rally has not yet reached a point of exhaustion.
However, there remains a risk to Pepe’s ongoing rally, as is common with highly speculative meme coins with no fundamental utility.
The risk is that Pepe’s rally could likely be a dead cat bounce, a temporary recovery in a declining market where an asset falls back after staunch rallies, as seen for Pepe coin today.
Without sustained organic demand or a broader market breakout, these gains can quickly evaporate as early investors move to take profits.
In case of a retracement, $0.0000039, which aligns with the 50-day SMA, would act as an immediate support level. If this floor fails to hold, the price could slide further to retest lower liquidity zones, potentially wiping out today’s gains.
Disclosure: This article does not represent investment advice. The content and materials featured on this page are for educational purposes only.

TLDR
- Vitalik Buterin supported a Nimbus proposal to merge Ethereum’s two clients into a single program.
- He said running two daemons makes node operation harder for independent validators.
- The Unified Node aims to simplify installation and reduce configuration errors.
- Ethereum introduced separate Beacon and execution clients during the 2022 Merge.
- Buterin linked better user experience with stronger validator decentralization.
Ethereum co-founder Vitalik Buterin called for a simpler node setup for validators. He backed a Nimbus “Unified Node” proposal that merges two Ethereum clients into one program. He said the current design creates avoidable complexity for self-sovereign users.
Vitalik Buterin Backs Unified Node Proposal
Vitalik Buterin supported a Nimbus pull request from the Status-im team that merges Ethereum’s two clients. He said running two daemons creates friction and discourages independent validators. He wrote on X, “Running two daemons and getting them to talk to each other is far more difficult than running one daemon.”
He added that Ethereum should improve usability for self-sovereign participants. He said, “Our goal is to make the self-sovereign way of using Ethereum have good UX.” He also stated that in many cases users need to run their own node.
He said the current method adds needless complexity for operators. He noted that the architecture could change over time. He wrote, “Longer-term, we should be open to revisiting the whole architecture.”
Ethereum introduced separate Beacon and execution clients during the 2022 Merge. The network moved from proof-of-work to proof-of-stake at that time. Validators then needed to manage two background programs simultaneously.
The two programs must communicate correctly for a node to function. Validators must configure both daemons and keep them synchronized. The Nimbus proposal combines these roles into a single executable.
Status-im developers built the Unified Node to reduce setup barriers. The software aims to simplify installation and maintenance. Buterin publicly praised this approach on X.
He has argued for better validator experience for several years. He has linked usability with stronger decentralization. He said simpler tools can encourage broader participation.
Ethereum Node Architecture and Validator Diversity
On Ethereum, validators verify transactions and propose blocks. They use hardware and client software to maintain the blockchain ledger. The ledger records ETH balances and confirms whether coins have been spent.
Proof-of-stake requires validators to lock up ETH to secure the network. Validators earn rewards for correct participation. They face penalties when they fail to perform duties.
In 2024, Elon Musk asked Buterin on X why he posted less frequently. Musk had acquired Twitter for $44 billion and renamed it X. Buterin responded by sharing a blog post on validator decentralization.
He warned about large staking pools operating nodes on identical hardware. He said shared infrastructure can lead to correlated downtime. He argued that such operators should face steeper financial penalties.
He tied these concerns to validator diversity across the network. He maintained that better user experience supports broader node distribution. He continued to raise this issue in public discussions.
Buterin’s recent comments returned to the technical setup. He focused on reducing the need to manage separate daemons. He framed the Unified Node as a step toward simpler operation.


Strategy has bought a whopping $1.57 billion of Bitcoin and now holds 761,058 BTC.
Michael Saylor took to social media to announce that Strategy has bought a massive amount of BTC today.
The firm acquired a total of 22,337 BTC for a total of $1.57 billion, spending roughly $70,194 per bitcoin.
Strategy has acquired 22,337 BTC for ~$1.57 billion at ~$70,194 per bitcoin. As of 3/15/2026, we hodl 761,068 $BTC acquired for ~$57.61 billion at ~$75,696 per bitcoin. $MSTR $STRC https://t.co/6hv6PjzOKQ
— Michael Saylor (@saylor) March 16, 2026
This puts their total holdings at 761,068 BTC bought at approximately $75,696 per bitcoin.
It also means that the most recent price increase was likely due to this particular buy wall. As CryptoPotato reported, BTC pushed above $74,000 today, driving the entire crypto market with it.
It’s worth noting that institutional inflows have also been steady over the past week, with BlackRock’s IBIT spot BTC ETF reporting positive flows for five consecutive days and buying more than $600 million.
Binance Free $600 (CryptoPotato Exclusive): Use this link to register a new account and receive $600 exclusive welcome offer on Binance (full details).
LIMITED OFFER for CryptoPotato readers at Bybit: Use this link to register and open a $500 FREE position on any coin!
TLDR:
- Pi Network has launched the second migration with a gradual rollout for Pioneers, bringing more Pi to Mainnet.
- Two-factor authentication via Mainnet Checklist Step 3 is now required before any Pi migration can begin.
- Blockchain transfers on Pi Network are irreversible, making 2FA enforcement critical for all wallet security.
- Referral mining bonuses will only migrate if referral team members have fully completed the KYC process.
Pi Network has officially announced that the second migrations have begun for Pioneers on Mainnet. The gradual rollout allows users to bring additional Pi to the network.
First migrations for eligible Pioneers continue as normal during this period. To qualify, Pioneers must set up 2FA through the Mainnet Checklist Step 3. This requirement protects wallet security for all participating users.
Two-Factor Authentication Required Before Migration Can Begin
Pi Network has made two-factor authentication (2FA) a strict requirement for all Pioneers seeking migration eligibility. Step 3 of the Mainnet Checklist must be completed before any migration can proceed.
For some users, this step also requires adding a trusted email address to their Pi account. The 2FA setup ensures that only verified account owners can initiate the process.
The enforcement of 2FA comes directly from the permanent nature of blockchain transactions. Any transfer completed on the blockchain cannot be reversed or corrected after it is made.
Pi Network introduced this requirement to protect Pioneers from unauthorized access and accidental errors. Wallet security is treated as a top priority across the migration process.
The Pi Core Team shared the update via social media, confirming that the second migrations have started and will follow a gradual rollout. The announcement noted that this opens the door for pioneers to bring more Pi to Mainnet.
Pioneers can also further participate in the broader ecosystem through this migration opportunity. First migrations for eligible Pioneers remain active and will not be disrupted by this development.
Referral Mining Bonuses Now Part of Second Migration Rollout
Pi Network’s second migrations will also carry referral mining bonuses for qualifying Pioneers. These bonuses are linked specifically to referral team members who have fully completed the KYC process.
Pioneers are being reminded to urge their teams to complete KYC before the relevant deadlines.
Without full KYC completion from Referral Team members, the associated referral bonuses cannot be migrated. This means the total amount of Pi a pioneer migrates may depend on their referral network’s actions. It is a shared responsibility that extends across the entire team structure within Pi Network.
The Pi Core Team confirmed that referral bonuses from KYC-verified referral team members will be included in the second migration.
Pioneers who stay in regular contact with their teams are more likely to benefit from these bonuses. Completing KYC early gives both Pioneers and their teams a better chance of maximizing their Mainnet migration.
TLDR
- Bitmine increased its Ethereum purchases and lifted its treasury to 4.596 million ETH.
- The company bought 5,000 ETH directly from the Ethereum Foundation through an over-the-counter deal.
- Tom Lee said Bitmine added 60,999 ETH in the past week, exceeding its recent weekly average.
- Bitmine now controls about 3.81% of Ethereum’s total supply.
- The company reported total crypto holdings, cash, and investments of about $11.5 billion.
Bitmine Immersion Technologies increased its Ethereum purchases and expanded its treasury to 4.596 million ETH. The company disclosed a direct 5,000 ETH purchase from the Ethereum Foundation. Chairman Tom Lee confirmed the firm accelerated weekly accumulation in recent weeks.
Bitmine Expands Ethereum Holdings and Staking Operations
Bitmine added 60,999 ETH over the past week, Lee said on Monday. He stated that recent weekly purchases averaged between 45,000 and 50,000 ETH. The latest buying pace exceeded that recent range.
The company structured the 5,000 ETH transaction over the counter with the Ethereum Foundation. Lee said the structure allowed the foundation to fund operations without selling on exchanges. As a result, Bitmine avoided open market impact during the purchase.
Bitmine now controls about 3.81% of Ethereum’s total supply. The company reported total crypto holdings, cash, and investments of about $11.5 billion. It said 3,040,515 ETH remain staked, representing about 66% of its treasury.
Bitmine valued its staked Ether at roughly $6.6 billion at a price of $2,185. The company estimates staking generates about $180 million in annualized revenue. It plans to expand operations through its Made in America Validator Network.
Lee said the Made in America Validator Network will launch in the coming months. He stated the network will increase staking capacity and validator participation. The company confirmed it will continue expanding its Ethereum position.
Corporate Treasuries Increase Exposure to Ether and Bitcoin
Corporate entities now hold about 6.6 million ETH across seven countries. CoinGecko data shows those holdings equal about 5.47% of the total Ether supply. Public companies slowed their accumulation during the past month.
Among the 20 largest corporate Ether treasuries, only four increased holdings in 30 days. Bitmine added 269,824 ETH during that period. SharpLink added 3,859 ETH, while Eightco added 11,068 ETH.
Eightco raised $125 million to expand blockchain and artificial intelligence investments. Bitmine invested $75 million in that funding round. ARK Invest and Payward, Kraken’s parent company, each committed $25 million.
As part of the agreement, Lee joined Eightco’s board. The companies confirmed the capital will support growth initiatives. They disclosed the funding details last week.
Earlier today Strategy disclosed a separate Bitcoin purchase. The company acquired 22,337 BTC for $1.57 billion. Strategy now holds more than 760,000 Bitcoin.
Shares of Bitmine, trading under BMNR, closed up nearly 14% at $23.39. Yahoo Finance reported the closing price data. At press time, Ether traded near $2,342, up nearly 11% in 24 hours.
Ether’s year-to-date decline stands near 21%. The cryptocurrency’s market capitalization measures about $282 billion. Circulating supply totals approximately 120.7 million ETH.


Bitcoin derivatives data signals a bullish shift after nearly eight days of bearish positioning in the futures market.
Bitcoin derivatives data show that the market structure has changed, with the Integrated Market Index reaching 96 on March 16, its highest level in the last 30 days.
The reading comes after a reversal in taker flow that ended almost 8 days of bearish positioning in the futures BTC market, with the flagship crypto now trading several thousand dollars above its estimated fair value.
Derivatives Indicator Points to Renewed Bullish Structure
According to analyst Axel Adler Jr., Bitcoin’s Integrated Market Index hit 96 while the model’s Price Index rose above 95. The index combines signals from derivatives such as future flows and price deviation to show how much pressure the market is under on a scale of 0 to 100.
A bullish regime, Adler noted, is when the value is above 55, and a bearish regime is when the value is below 45. The model has been in a bearish phase for about 178 hours, starting on February 15 when it fell as BTC dropped toward $63,000 amid sustained negative taker volume and diminishing open interest.
However, per Adler’s analysis, the change happened on March 10, when both the taker flow and the open interest went up at the same time, pushing both the flow and price components back above their bullish thresholds.
With Bitcoin momentarily jumping above $74,000 on March 16, its fair value over 30 days as measured by Adler’s model now sits around $70,000. The gap means the market is worth about $3,400 more, with the market watcher suggesting that these kinds of premiums can occur during times of high demand as long as the derivatives flow index stays high.
Data also shows that the larger crypto market also got stronger in the last 24 hours, with BTC’s move above $74,000 not the only green arrow. Ethereum (ETH) also went over $2,200 as several coins, including Solana (SOL), Dogecoin (DOGE), Cardano (ADA), and Hyperliquid (HYPE), recorded more than 10% gains over the past 7 days.
You may also like:
The rally has brought the crypto market’s value up 2.6% to just under $2.6 trillion, per CoinGecko. However, it wiped out about $380 million in leveraged positions, with around $303 million coming from traders who had bet on falling prices.
BTC Price Movement
At the time of writing, Bitcoin had dropped by a couple of hundred bucks below $74,000. Nevertheless, it was still about 9% higher than it was a week ago and nearly 6% across 30 days.
This is not the first time that BTC has tested $74,000. Last Friday, the number one cryptocurrency encountered a barrier at the same level, causing it to retreat by over $3,000, before the recent recovery.
For now, derivatives data shows sustained buying pressure, with the Integrated Market Index remaining deep in bullish territory. Analysts tracking the model say the first warning sign would be the index falling back below 55 or a decline in futures flow that pushes prices closer to its fair-value benchmark.
Binance Free $600 (CryptoPotato Exclusive): Use this link to register a new account and receive $600 exclusive welcome offer on Binance (full details).
LIMITED OFFER for CryptoPotato readers at Bybit: Use this link to register and open a $500 FREE position on any coin!

NY school district finds electric buses cost 9 times more than diesel

Bitcoin Trend Reversal Possible If $74K Holds, Will Altcoins Follow?

India needs gas, but will they ally with Iran over the US?


-
 Tech6 days ago
A 1,300-Pound NASA Spacecraft To Re-Enter Earth’s Atmosphere
-
Crypto World3 days ago
HYPE Token Enters Net Deflation as HyperCore Buybacks Outpace Staking Rewards
-

 Business6 days ago
ExxonMobil seeks to move corporate registration from New Jersey to Texas
-

 Fashion3 days ago
Weekend Open Thread: Addict Lip Glow
-

 Tech6 days ago
ChatGPT will now generate interactive visuals to help you with math and science concepts
-
Sports2 days ago
Why Duke and Michigan Are Dead Even Entering Selection Sunday
-

 NewsBeat5 days ago
Residents reaction as Shildon murder probe enters second day
-
 NewsBeat7 days ago
Pagazzi Lighting enters administration as 70 jobs lost and 11 stores close across Scotland
-

 Business6 days ago
Search Enters Sixth Week With New Leads in Tucson Abduction Case
-

 Business1 day ago
Search for Savannah Guthrie’s Mother Enters Seventh Week with No Arrests
-

 Business2 days ago
US Airports Launch Donation Drives for Unpaid TSA Workers as Partial Government Shutdown Enters Fifth Week
-
Crypto World2 days ago
Coinbase and Bybit in Investment Talks: Could Bybit Finally Enter the US Crypto Market?
-

 NewsBeat5 days ago
I Entered The Manosphere. Nothing Could Prepare Me For What I Found.
-

 Business2 days ago
Country star Brantley Gilbert enters growing non-alcoholic beer market
-

 Business12 hours ago
Australian shares drop as Iran war enters third week
-

 Sports5 days ago
PWHL, Senators discussing plan to keep Charge in Ottawa
-

 Crypto World6 days ago
Will Chainlink price reclaim $10 amid volatility squeeze?
-

 Sports3 days ago
College Basketball Best Bets: Conference Tournament Semifinal Picks
-

 Crypto World12 hours ago
Crypto Lender BlockFills Enters Chapter 11 with Up to $500M in Liabilities
-

 Politics6 days ago
Trump Says Middle East Is ‘Very Lucky’ That He’s President


You must be logged in to post a comment Login