
Crypto World
Driving Enterprise AI Transformation & ROI in 2026
Artificial Intelligence is no longer an experimental capability; it is redefining how businesses generate revenue, manage risk, optimize operations, and compete at scale. In 2026, the impact of AI on businesses is visible in faster decision cycles, predictive supply chains, autonomous customer engagement systems, and data-driven product innovation. Intelligence is no longer layered onto systems; it is becoming the system itself.
Enterprises that embed AI into their operational core are compressing costs, accelerating time-to-market, and increasing customer lifetime value. Those who hesitate remain trapped in fragmented data environments and reactive decision models. The competitive divide is widening not because of access to AI tools, but because of how strategically AI is integrated into enterprise architecture, often with the support of an experienced AI Development Company capable of aligning technology with measurable business outcomes.
This guide breaks down the real impact of AI on business performance, from data maturity and workflow orchestration to ROI measurement and autonomous operations. It provides a structured roadmap for leaders who want to move beyond pilots, scale intelligently through comprehensive AI Development Services, and convert AI investment into a measurable enterprise advantage.
1. AI in 2026: From Pilots to Production – The Adoption Reality Check
Despite massive hype and rapid investment growth, the journey from pilot projects to enterprise-wide AI adoption remains uneven.
- Gartner forecasts global AI spending will exceed $2.5 trillion in 2026, with AI services, infrastructure, and software driving massive enterprise budgets.
- Research shows that only a small percentage of companies have AI fully embedded in core workflows, with as few as 5% deriving significant value from their deployments, despite broad adoption efforts.
- IBM’s Global AI Adoption Index reports 42% of enterprises actively deploying AI, while another 40% remain in the exploration stage.
This gap between adoption and actual impact highlights a defining theme of 2026: AI is no longer optional, but far from fully realized.
2. Why Many AI Projects Fall Short: The “Execution Divide”
Data shows that enterprises frequently struggle to scale AI beyond proof-of-concept (POC) due to:
1. Lack of AI-Ready Data
AI systems are only as effective as the data that fuels them. Fragmented, noisy, or siloed data pipelines undermine model accuracy and enterprise insight generation.
2. Misalignment of Strategy with Business Outcomes
Executives often invest in technology first and strategy second, leading to solutions that don’t solve real business problems.
3. Organizational Resistance
AI transformations require process redesign, workforce shift, and governance maturity, not just technology. Without aligning people and workflows, most initiatives stall.
4. Overemphasis on Tools vs. Outcomes
Although 78% of organizations report using AI, only a fraction derive a measurable business impact because their workflows remain unchanged.
This execution gap is why many teams invest heavily but see little strategic value.
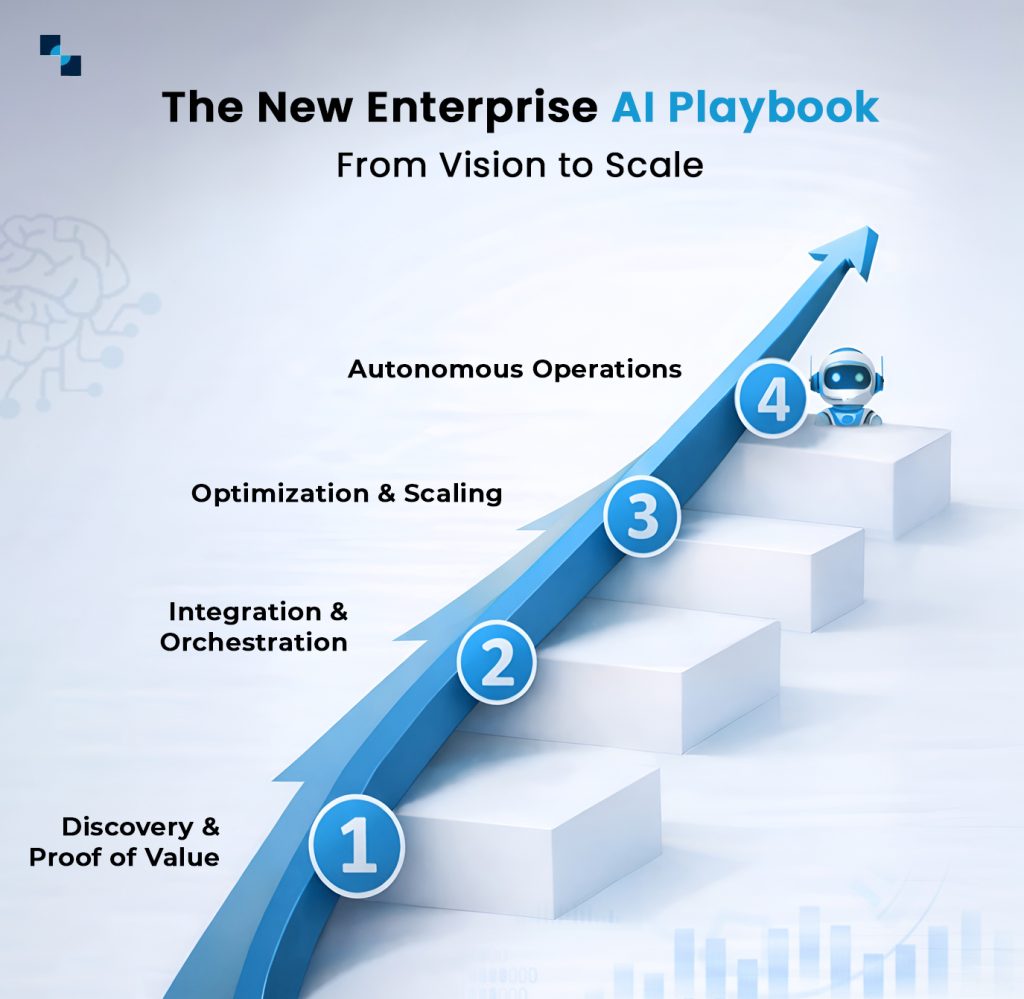
3. The New Enterprise AI Playbook: From Vision to Scale
To succeed in 2026, enterprises must follow a structured transformation path:
Stage 1: Discovery & Proof of Value
- Define specific business outcomes (e.g., cost reduction, revenue uplift, customer personalization).
- Identify high-impact use cases (e.g., automated claims processing, dynamic pricing models).
Stage 2: Integration & Orchestration
- Enterprises partnering with an AI Development Company for Business are embedding generative models directly into core operational workflows.
- Establish robust data governance frameworks.
Stage 3: Optimization & Scaling
- Transition from discrete models to a connected AI ecosystem that powers cross-functional intelligence.
- Track ROI consistently and build feedback loops for continuous improvement.
Stage 4: Autonomous Operations
- Mature organizations will reach a point where AI proactively manages resource allocation, pricing, and risk response.
According to Gartner’s 2026 Enterprise AI Outlook, the maturity of enterprise AI outcomes is increasingly determined by data readiness, seamless process integration, and clearly measurable ROI rather than by technology expenditure or model scale alone.

4. Demonstrable ROI: How AI Delivers Real Business Value
The most successful companies measure AI through three ROI dimensions:
Direct ROI
- Operational cost reduction
- Efficiency gains via automation and workflow augmentation
Indirect ROI
- Increased customer lifetime value through personalization
- Better customer satisfaction via AI-driven experiences
Strategic ROI
- Shorter product cycles
- Faster innovation via predictive insights and AI-augmented R&D
Organizations leveraging structured AI Development Services ensure that AI initiatives are aligned with measurable business objectives, linking model performance directly to revenue growth, operational efficiency, and strategic impact.
Recent enterprise research from Deloitte finds that AI delivers measurable outcomes such as enhanced customer relationships, operational efficiency, and increased revenue potential, though many companies are still in early phases of realization.
5. Generative AI: The New Enterprise Advantage
Generative AI has evolved from experimental technology into a critical enterprise capability. Unlike traditional AI that analyzes data, generative AI can create content, simulate scenarios, generate code, draft reports, design workflows, and support strategic planning. Enterprises partnering with an AI Development Company for Business embed these models directly into daily operational workflows across customer service, finance, marketing, procurement, and knowledge management.
Enterprises are deploying task-specific AI agents that handle repetitive, cognitive workloads, automate multi-step processes, support decision-making, and continuously optimize through real-time feedback. By engaging AI software developers, companies move beyond pilots toward integrated, enterprise-scale systems. These enterprise deployments are strengthened through structured AI software development services that ensure scalability, governance alignment, and long-term system resilience.
The result is a structural shift from standalone AI tools to digital workforce augmentation. Generative AI, implemented through AI-Powered Development Company expertise, becomes a strategic foundation that enhances productivity, accelerates execution, and transforms organizational performance into a scalable competitive advantage.
6. The Strategic Benefits of Partnering with an AI Development Company

Implementing AI at scale is not simply a technical exercise; it is an architectural transformation that touches data, workflows, governance, and long-term business strategy. Organizations that attempt to build advanced AI capabilities in isolation often encounter scalability bottlenecks, integration gaps, and unclear ROI.
Enterprises evaluating the best AI development companies prioritize scalability, governance maturity, architectural depth, and measurable ROI over experimental capability alone. Partnering with an experienced AI Development Company provides structured expertise that strengthens execution quality, accelerates deployment maturity, and ensures measurable business outcomes.
Deep Technical Architecture Capabilities
Enterprise-grade AI requires more than model deployment. It demands expertise in machine learning pipelines, large language models, agent-based orchestration, distributed systems, and secure infrastructure. Specialized AI teams understand how to design systems that are scalable, modular, and production-ready, not just experimental prototypes.
Data & Workflow Alignment
AI performance is fundamentally dependent on data quality and system integration. Strategic partners establish governed data pipelines, eliminate silos, and ensure models are embedded directly into operational workflows. This alignment transforms AI from a disconnected layer into a core operational engine.
Outcome-Driven Execution
Successful AI initiatives begin with business objectives, not algorithms. Experienced AI partners define clear performance metrics, build measurement frameworks, and align deployments with revenue growth, cost efficiency, and customer experience improvements. This approach ensures that AI investments translate into tangible enterprise value.
Governance, Risk, and Responsible AI
Enterprise deployment requires structured oversight. From model bias mitigation to compliance frameworks, data privacy safeguards, and auditability, governance must be engineered from the start. Strong AI partnerships integrate risk management and ethical design principles into system architecture, thus reducing exposure and ensuring long-term sustainability.
7. Workforce Transformation: The New Enterprise Skill Imperative
Artificial Intelligence is not merely optimizing workflows; it is redefining how work itself is structured, executed, and measured. As automation expands across cognitive and operational domains, roles are not simply being replaced; they are being redesigned. Organizations leveraging AI Development Services ensure that AI adoption is aligned with workforce transformation and skill development.
Across industries, millions of positions are evolving as AI systems absorb repetitive analysis, data processing, and routine decision-making tasks. Forward-looking enterprises engage ai software developers to equip employees with AI fluency, embedding it into performance metrics, leadership expectations, and career development pathways.
The emerging model is human enhanced by machine intelligence. Competitive advantage will depend not only on AI-Powered Development Company expertise but also on building intelligent teams capable of leveraging AI systems at scale.
Start Your Enterprise AI Transformation with Confidence
8. Building the AI-First Enterprise: The Future of AI Development Services
Over the next decade, AI will move beyond workflow support and become the structural backbone of enterprise design. Intelligence will be embedded across finance, operations, marketing, supply chains, product development, and risk management, not as a feature, but as core infrastructure built with AI Development Services.
In AI-first organizations:
Decision cycles compress dramatically
Real-time data modeling enables dynamic forecasting, adaptive pricing, automated risk scoring, and continuous operational recalibration.
Customer engagement becomes predictive rather than reactive
Behavioral modeling anticipates needs, optimizes touchpoints, and adjusts experiences across channels in milliseconds.
Innovation becomes systematic
AI-assisted research, simulation environments, and rapid prototyping reduce development timelines and increase experimentation velocity.
Competitive strength compounds over time
Self-improving systems continuously refine algorithms using proprietary data, creating intelligence loops that are difficult for competitors to replicate.

The Standard for Modern Enterprise Excellence
Artificial Intelligence has moved from optional experimentation to operational expectation. Its impact on business performance is seen in margin expansion, faster decision-making, improved capital allocation, and measurable revenue growth. Enterprises must leverage AI Development Services to strengthen data foundations, align AI initiatives with financial metrics, embed governance, and build workforce capability for AI collaboration.
Organizations that treat AI as core infrastructure and partner with a trusted AI Development Company will outperform peers in efficiency, innovation speed, and customer value creation. Supported by custom AI development, businesses can institutionalize AI today to shape tomorrow’s market dynamics. Antier empowers enterprises with scalable, secure AI and blockchain solutions, driving measurable ROI through expert AI-Powered Development Company services with the dedicated support of experienced professionals guiding every stage of innovation and implementation.
Frequently Asked Questions
01. What is the current impact of AI on businesses as of 2026?
By 2026, AI is redefining business operations through faster decision cycles, predictive supply chains, autonomous customer engagement, and data-driven product innovation, becoming integral to enterprise systems.
02. Why do many AI projects fail to deliver significant value?
Many AI projects fall short due to a lack of AI-ready data, as fragmented and siloed data pipelines hinder model accuracy and limit enterprise insights.
03. How can enterprises effectively integrate AI into their operations?
Enterprises can effectively integrate AI by embedding it into their operational core, leveraging comprehensive AI development services, and aligning technology with measurable business outcomes to enhance performance and competitiveness.

Crypto World
Microsoft to pour $10B into Japan for AI expansion, cyber defense, and talent development


Microsoft said on Friday it plans to invest $10 billion in Japan over the next four years, focusing on artificial intelligence data centres and supporting infrastructure.
Summary
- Microsoft to invest $10 billion in Japan over four years to expand AI data centres, cybersecurity partnerships, and train one million engineers.
- Initiative builds on a prior $2.9 billion commitment and includes collaborations with SoftBank, Sakura Internet, NTT, and NEC.
- Microsoft also launched new multimodal AI models, positioning them as lower-cost alternatives while continuing its partnership with OpenAI.
The announcement followed a meeting between Microsoft President Brad Smith and Japanese Prime Minister Sanae Takaichi in Tokyo. Smith described the move as a “response to Japan’s growing need for cloud and AI services.”
Companies across Japan, the world’s fourth-largest economy, are accelerating efforts to strengthen their position in the evolving AI sector. However, expansion of data centres in the country has been slowed by land constraints and relatively high electricity costs.
Microsoft said it will work with SoftBank Group and Sakura Internet to scale domestic digital infrastructure. The new commitment follows a $2.9 billion investment announced in 2024 aimed at boosting Japan’s AI capabilities and reinforcing cyber defences.
Alongside infrastructure, the latest plan allocates funding to deepen cybersecurity cooperation with government agencies and to train one million engineers. The initiative will be carried out with major telecom and technology firms, including NTT and NEC.
The surge in data centre construction across the Asia-Pacific region, particularly in India and Southeast Asia, has also raised environmental concerns. These facilities place growing pressure on electricity grids — many still dependent on fossil fuels — and require significant water resources to cool high-performance servers.
In a parallel development, Microsoft’s AI division unveiled three new foundational models capable of generating text, voice, and images, signalling a continued push to expand its in-house capabilities.
The models are now available through Microsoft Foundry, with some also accessible via the MAI Playground testing environment. Pricing has been positioned as a competitive advantage, with Microsoft stating the tools are cheaper than comparable offerings from Google and OpenAI.
The rollout underscores Microsoft’s dual-track strategy: building its own AI systems while maintaining its long-standing partnership with OpenAI.
The company has invested more than $13 billion into the collaboration and continues to integrate OpenAI’s models across its products, even as it develops alternatives internally.
Disclosure: This article does not represent investment advice. The content and materials featured on this page are for educational purposes only.
The crypto market traded $20.57 trillion in Q1 2026, but declining volumes and concentrated liquidity told a story of cautious recovery, not euphoria.
A new quarterly research report from CoinGlass breaks down how capital, trading activity, and market depth shifted among exchanges during the first three months of the year. The findings paint a picture of a market still digesting the aftershocks of late 2025.
A Market Still Healing From Q4’s Crash
Q1 2026 unfolded against a difficult backdrop. The October 2025 tariff shock triggered $19 billion in liquidations within 24 hours, the largest single-day deleveraging event in crypto history.
Bitcoin (BTC) declined roughly 35% from its all-time high above $126,000, and open interest across exchanges dropped more than 40%.
By January, signs of stabilization had appeared. Total market volume for the quarter reached approximately $20.57 trillion, split between $1.94 trillion in spot and $18.63 trillion in derivatives.
However, each successive month saw lower totals. January posted the highest activity, and March fell to the quarterly low.
The derivatives-to-spot ratio held at roughly 9.6x throughout the quarter, slightly above the 2025 full-year average.
That ratio suggests traders preferred hedging and short-term positioning through futures rather than making directional spot bets.
Binance’s Lead Extends Across Every Metric
The CoinGlass report measured exchanges across four dimensions, including trading volume, open interest (OI), order book depth, and user asset reserves. Binance ranked first in all of them.
In derivatives, Binance posted approximately $4.90 trillion in cumulative volume, a 34.9% share among the top 10 exchanges.
That figure exceeded the combined totals of OKX ($2.19 trillion) and Bybit ($1.49 trillion). In open interest, Binance averaged $23.9 billion daily, roughly 2.2 times second-ranked Bybit.
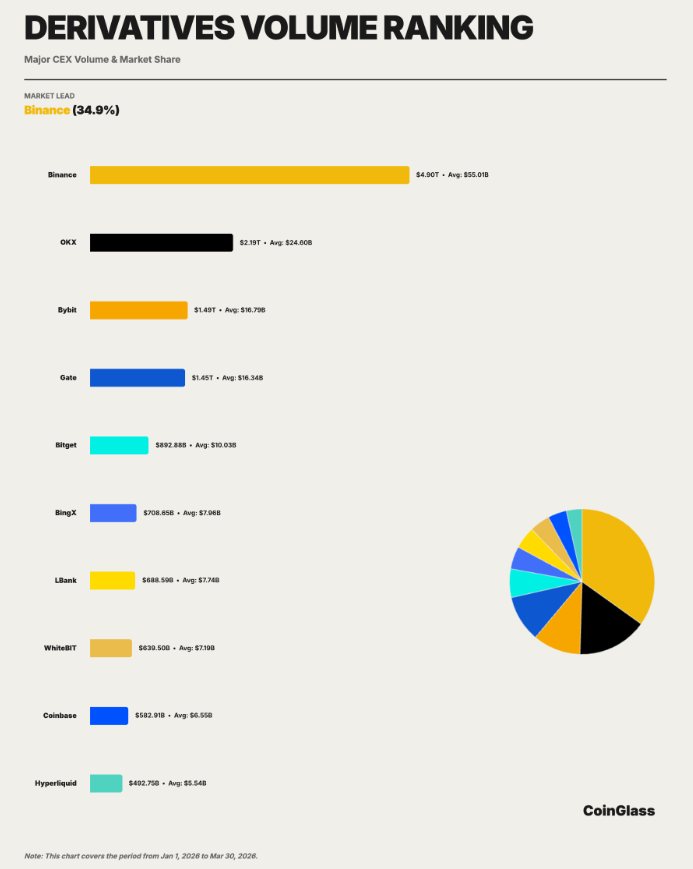
Liquidity depth told a similar story. In BTC futures, Binance’s average two-sided depth within 1% of the mid-price was approximately $284 million.
OKX followed at $160 million and Bybit at $76.55 million. The pattern repeated across BTC spot, ETH futures, and ETH spot markets. No single competitor matched Binance across all four sub-markets simultaneously.
The starkest gap appeared in user asset reserves. Binance held approximately $152.9 billion in custodial assets, accounting for 73.5% among the top 10 exchanges. OKX was a distant second at $15.9 billion. Gate, Bitget, and Bybit all fell within the $5 to $7 billion range.
That concentration far exceeds Binance’s share in trading volume or open interest. The CoinGlass report noted that asset retention reflects brand trust, product ecosystem breadth, and on/off-ramp convenience, making it a stronger indicator of long-term competitive position.
Hyperliquid Enters the Mainstream Conversation
One of the quarter’s most notable developments was the rise of Hyperliquid (HYPE), a decentralized derivatives protocol that posted approximately $492.7 billion in Q1 trading volume.
That placed it inside the top ten.
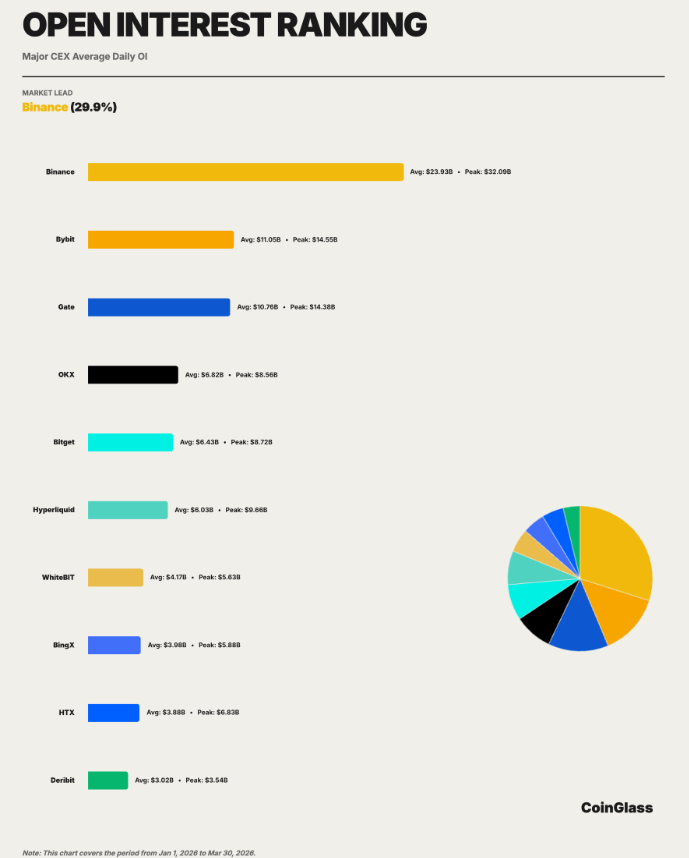
Its average daily open interest of roughly $6.0 billion, with a peak of $9.7 billion, drew close to that of centralized competitors like Bitget.
The growth validated what CoinGlass’s 2025 annual report had predicted, that decentralized derivatives were transitioning from proof-of-concept to actual market share competition.
JPMorgan flagged Hyperliquid in a March report, noting that demand for round-the-clock access to traditional assets was driving decentralized exchange growth and taking share from mid-tier centralized platforms.
Grayscale also filed an S-1 for a HYPE ETF in March, seeking a Nasdaq listing.
For now, Hyperliquid’s scale remains significantly below the leading centralized exchanges.
However, its entry into the competitive arena adds pressure to second-tier platforms competing for derivatives market share.
What Comes Next
The CoinGlass report identified several variables to watch heading into Q2. These include:
- The Federal Reserve’s monetary policy path,
- Changes in BTC spot ETF fund flows, and
- The progress of regulatory framework implementation across major jurisdictions.
Q1 was not about a return to all-time highs. It was about recovery, concentration, and a shifting market structure that is drawing clearer lines between the platforms that attract capital and those that risk falling behind.
The post New Report Finds Where All the Money Went in Crypto’s Brutal Q1 appeared first on BeInCrypto.

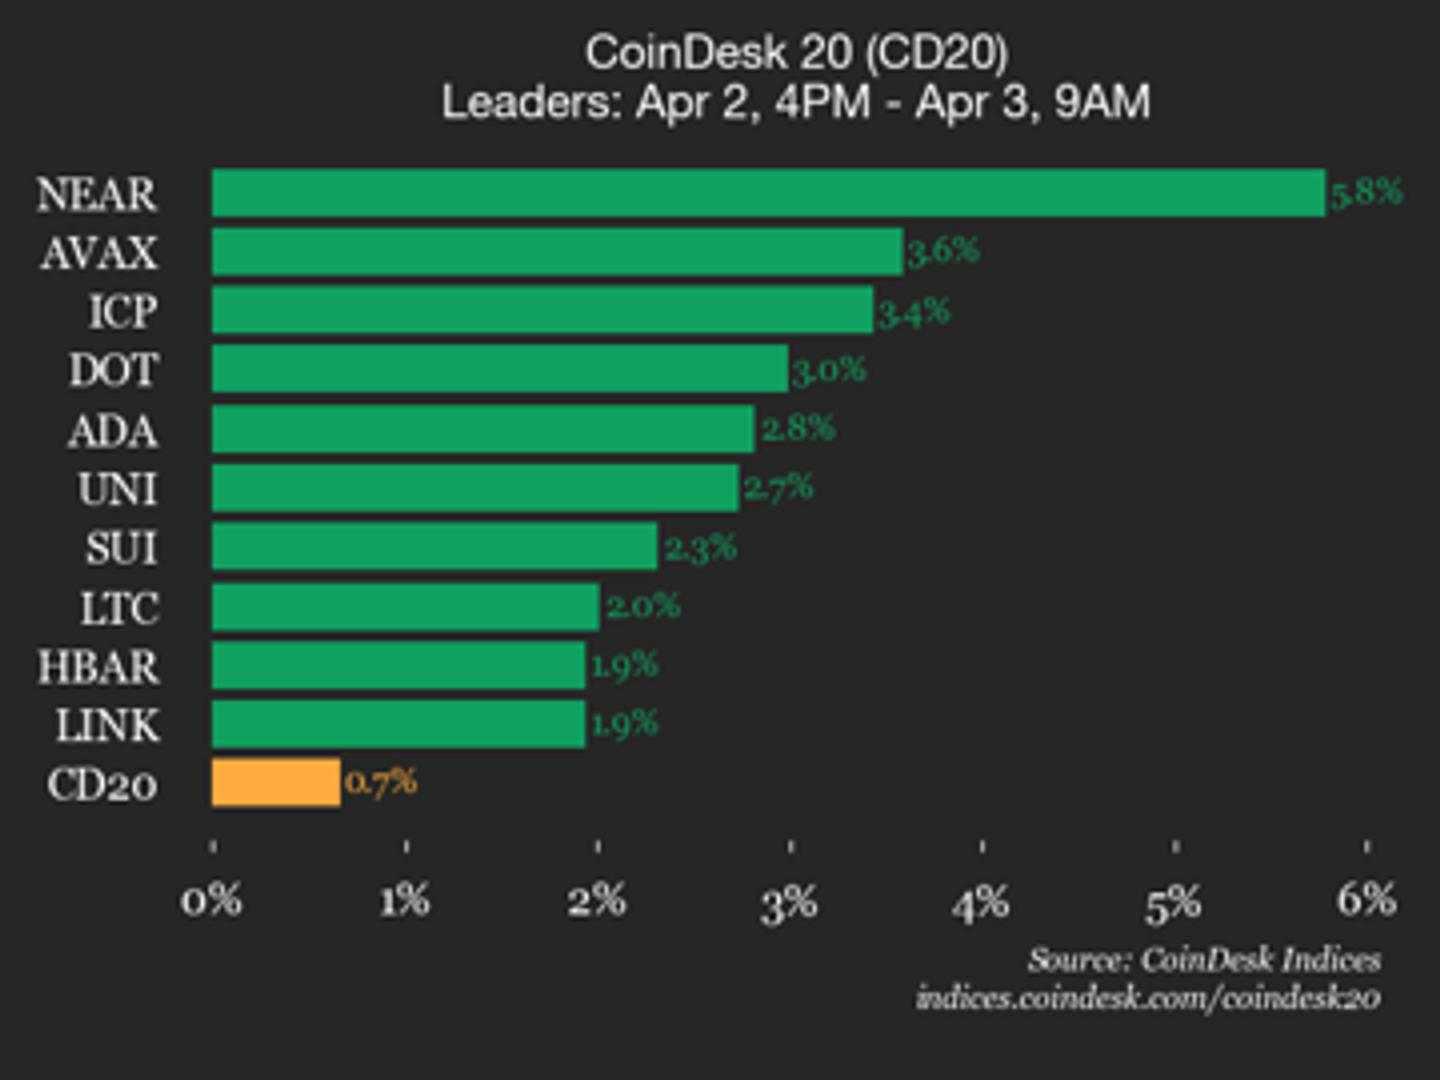
NEAR Protocol (NEAR) gained 5.8% and Avalanche (AVAX) climbed 3.6%.

Key Highlights
- ServiceNow (NOW) shares have declined approximately 32% year-to-date amid widespread SaaS sector pressure from AI disruption concerns
- CEO Bill McDermott reports that half of new business revenue originates from non-seat-based pricing models, including AI token consumption
- Benchmark launched coverage with a Buy recommendation and $125 price target, characterizing the decline as “unwarranted”
- McDermott demonstrated confidence by purchasing $3 million in NOW shares during February, describing it as an optimal entry opportunity
- Management projects 21% GAAP subscriber revenue expansion and identifies a $600 billion total addressable market opportunity
The shares of ServiceNow have experienced significant turbulence throughout 2026. With a decline of roughly 32% since the year began, the enterprise software provider has been swept up in a widespread retreat from SaaS investments that gained momentum in late 2025.
What sparked the exodus? Rapid advancements in AI capabilities from companies such as Anthropic and OpenAI exceeded market expectations, triggering investor anxiety that AI laboratories might erode traditional enterprise software demand.
CEO Bill McDermott challenges this interpretation. He maintains that ServiceNow differs fundamentally from conventional SaaS providers and is proactively pivoting toward AI integration rather than retreating from the technological shift.
“We’re not a feature company and we’re not a function company, we’re a platform company,” McDermott explained. He highlighted the company’s AI Control Tower solution, which orchestrates and oversees AI agents, models, and operational workflows throughout enterprise infrastructures.
Among McDermott’s most significant revelations: half of ServiceNow’s incoming business revenue derives from pricing structures unrelated to user seats. This marks the company’s first public disclosure of this metric.
Transitioning Beyond Per-Seat Licensing
The conventional software revenue model — billing based on individual user licenses — faces mounting challenges as artificial intelligence diminishes dependency on workforce expansion. ServiceNow is adopting a blended approach where clients pay for both user licenses and consumption-based AI tokens.
The strategy is clear: as the platform executes more autonomous functions, organizations purchase additional tokens. This decouples revenue expansion from employee headcount metrics.
Goldman Sachs analyst Gabriela Borges maintains a 12-month price target of $216 for NOW. She anticipates upward revisions to organic growth projections throughout the year as clients exhaust complimentary AI token allocations and transition to paid consumption after validating business value.
“Those packages are going to start getting burnt through, such that customers are now going to come back to ServiceNow and say, ‘Hey, we proved the value of this particular product. We are now ready to pay for it,’” Borges explained.
McDermott reinforced his optimism through action. During February, he acquired $3 million in NOW shares using personal funds.
Strategic Acquisitions and Market Expansion
ServiceNow has maintained an aggressive acquisition strategy recently. Last December, the company revealed plans for a $7.75 billion acquisition of cybersecurity provider Armis. Additional purchases included AI identity security specialist Veza and a $2.85 billion investment in Moveworks, a platform focused on AI assistance and reasoning agents.
During the Q4 earnings discussion, McDermott directly confronted shareholder concerns regarding acquisition velocity, emphasizing that purchases target innovation capabilities rather than revenue supplementation.
These strategic moves position ServiceNow more prominently within cybersecurity and customer relationship management sectors. McDermott asserts these expansions elevate the addressable market opportunity to at least $600 billion, a substantial increase from the $90 billion estimate when he assumed leadership in 2019.
On April 1, Benchmark launched coverage featuring a Buy rating alongside a $125 price target. Analyst Yi Fu Lee characterized the sell-off motivated by AI displacement concerns as “unwarranted” and positioned NOW as a primary beneficiary of the “Agentic AI super cycle.”
Wall Street consensus maintains a Buy recommendation for the company. ServiceNow’s price-to-earnings multiple registered approximately 61 times trailing 12-month earnings as of Thursday’s trading session.

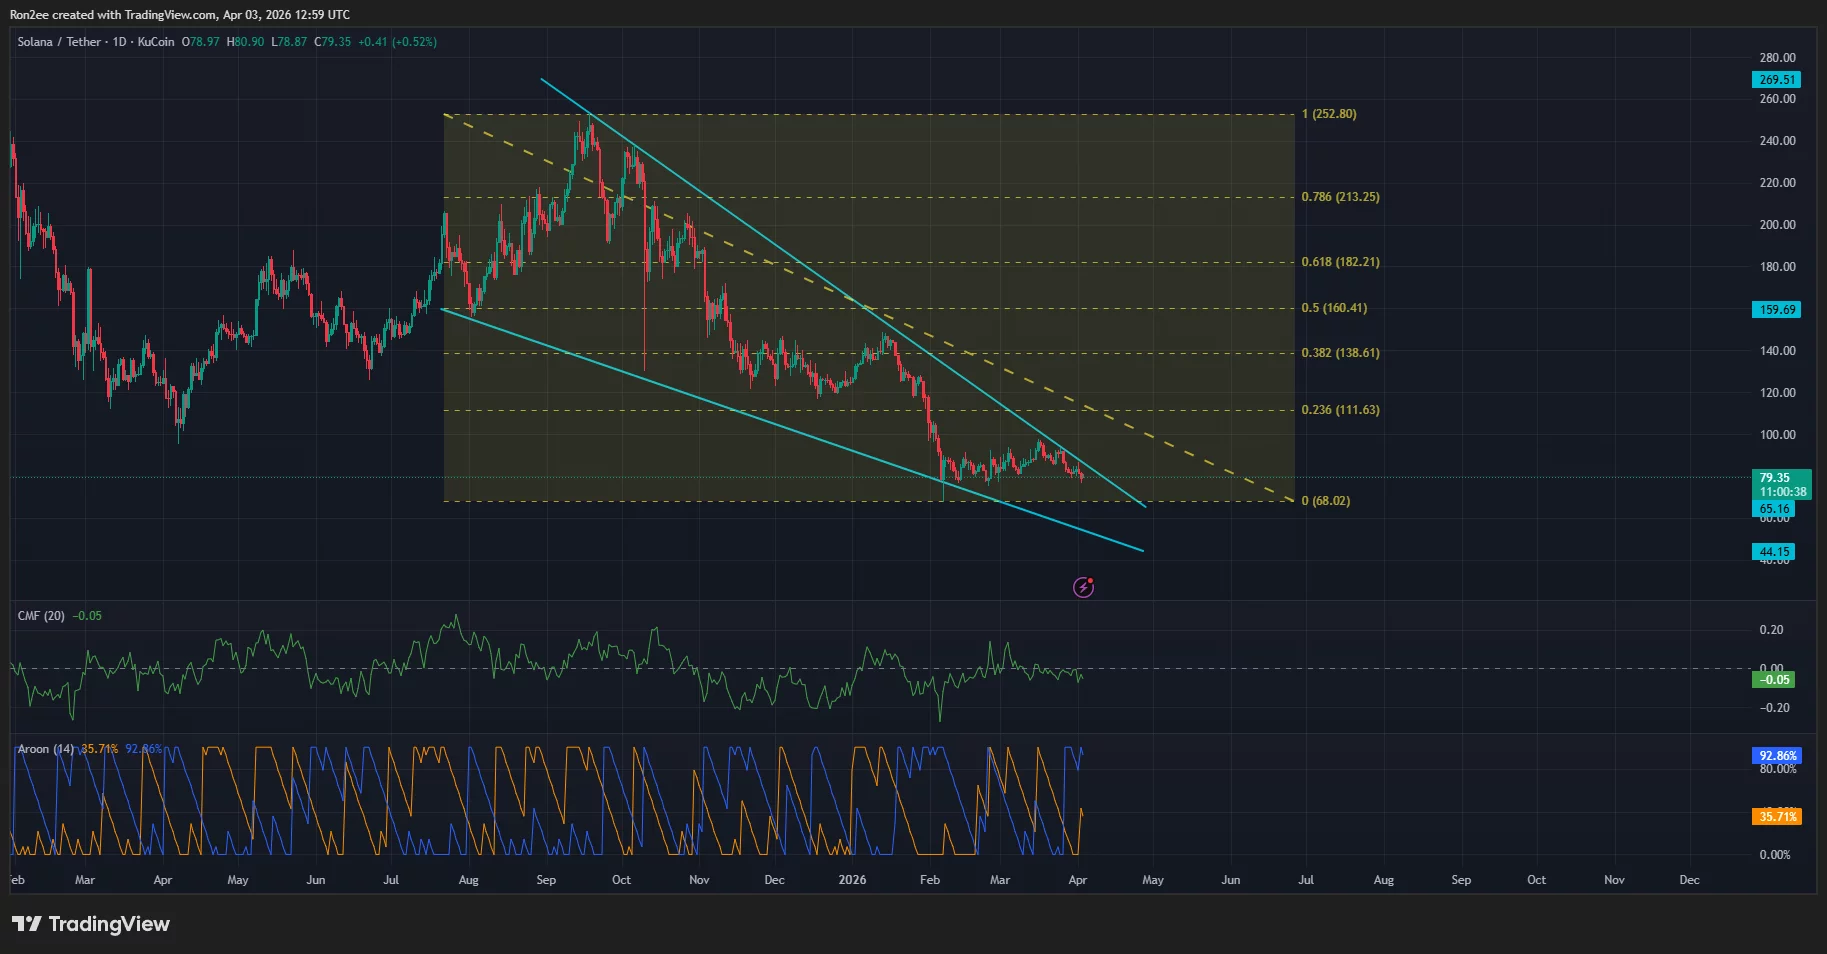
Solana price managed to hold above the $70 support on Thursday as bulls stepped in to defend the psychological level.
Summary
- Solana price dropped nearly 9% after a $270 million exploit on Drift and a sharp decline in network TVL.
- Broader risk-off sentiment driven by escalating Middle East tensions and rising oil prices added pressure on the token.
- Technical indicators show weakening momentum despite a potential falling wedge breakout, with bears still dominating trend strength.
According to data from crypto.news, Solana (SOL) price fell nearly 9% from an intraday high of $85.1 on Wednesday to an intraday low of $77.6 on Tuesday before stabilizing at $80 at press time.
Solana price fell following a $285 million exploit that occurred yesterday on Drift Protocol, a trading venue native to the Solana blockchain. Following the breach, the total value locked on Solana has shrunk by nearly $1 billion since the incident, per DeFiLlama.
The token also fell amid tensions in the Middle East that continued to drive investor sentiment away from risk assets. Notably, Iranian officials noted they would be targeting retaliatory measures against 18 U.S. military assets, including strategic bases in the region. On the other hand, the U.S. struck several key targets, including a critical supply bridge and logistics hubs.
The resulting conflict has fueled expectations that the Strait of Hormuz would continue to remain closed as the U.S. focuses its attention on bringing the regional threat to a standstill over the coming 2 to 3 weeks. Oil prices rose back above $110 amid fears of runaway inflation and supply chain disruptions.
On the daily chart, Solana price is close to breaking out of a multi-month falling wedge pattern formed of two descending and converging trendlines. A breakout from a falling wedge pattern often signals a powerful bullish reversal as selling pressure finally exhausts itself.

For Solana, a confirmed breakout from such a pattern could fling the price all the way to $111, which aligns with the 23.6% Fibonacci retracement level. Reaching this target would represent a significant recovery from recent lows and could reignite broader investor interest in the ecosystem.
However, current technical data suggests some caution on the way. Notably, the Chaikin Money Flow index showed a negative reading of -0.05. A negative reading on the indicator suggests that there is still a lack of strong buying pressure and that some capital is still flowing out of the asset.
At the same time, the Aroon Down stood at 92.86% while the Aroon Up was at 35.71%, which means the bears still hold the upper hand in terms of trend strength. This disparity indicates that while a breakout is possible, the downward momentum has not yet been fully broken by the bulls.
Disclosure: This article does not represent investment advice. The content and materials featured on this page are for educational purposes only.

Coinbase and the Linux Foundation launched the X402 Foundation on April 2, 2026, a non-profit tasked with stewarding an open-source protocol that finally puts the 30-year-dormant HTTP 402 status code to work as the web’s native payment layer.
The founding coalition includes Stripe, Cloudflare, AWS, Google, Microsoft, Visa, and Mastercard, which means this is not a crypto-native experiment – it is a bid to rewire how the entire internet handles money.
Key Takeaways:
- Protocol Scope: X402 standardizes the HTTP 402 “Payment Required” response code to trigger stablecoin or ERC-20 token settlement directly inside web and API interactions.
- AI-First Design: The protocol is built explicitly for autonomous AI agents – machines can encounter a paywall, read the X402 response, and settle the payment via a pre-authorized wallet with no human intervention required.
- Neutral Governance: By housing X402 under the Linux Foundation, Coinbase has structurally prevented any single corporation – including itself – from controlling the web’s new financial rails.
- Layer-2 Integration: X402 is blockchain-agnostic but debuted on Base, Coinbase’s Layer-2 network, with Cloudflare’s Agents SDK already supporting live transactions on Base Sepolia testnet using USDC.
- Micropayments at Sub-Cent Cost: Stablecoin settlement delivers near-instant finality at sub-cent transaction fees – a cost structure that credit card networks and ACH cannot match for machine-to-machine commerce.
- What to Watch: Reference implementation and SDK releases scheduled throughout 2026 are the critical adoption milestones – browser-level integration and sign-off from traditional financial members will determine whether X402 becomes infrastructure or a footnote.
Discover: The best crypto to diversify your portfolio during market turbulence
What X402 Actually Does – and Why HTTP 402 Sat Unused for Three Decades
HTTP 402 was reserved in 1995 as a placeholder for future payment systems that never arrived. The reason it never arrived is structural: the internet had no native settlement layer.
Every payment required routing through a third-party processor, a bank, or a proprietary API – none of which a web server could negotiate with autonomously at the protocol level.
X402 changes the handshake. When a server requires payment, it issues a standardized X402 response containing the price, accepted tokens, and payment terms. The client – whether a browser, an application, or an AI agent – reads those terms, constructs a signed payment payload in the X-PAYMENT HTTP header, and submits it. A payment facilitator (currently the Coinbase X402 Facilitator) verifies the signed payload before the server returns an X-PAYMENT-RESPONSE confirmation. The entire flow is atomic and requires no account creation, no API key provisioning, no manual authentication step.
The protocol supports all ERC-20 tokens – not just stablecoins, and is designed to be blockchain-agnostic, though its early infrastructure runs on Base, Coinbase’s Layer-2 network. Cloudflare has already shipped a withX402Client wrapper for its Agents SDK that lets developers toggle between human-confirmation and fully autonomous execution modes. The technical specification and codebase are publicly available at x402.org under LF Projects, LLC.
Linux Foundation CEO Jim Zemlin described the foundation as the “neutral home” for the protocol – language that signals deliberate insulation from the kind of corporate capture that killed earlier micropayments standards.
That governance decision is what separates X402 from Coinbase’s previous developer initiatives: this is not a product. It is an attempt to establish a standard.
Explore: The best pre-launch token sales with asymmetric upside potential
Who Benefits – and What X402 Needs to Actually Win
The immediate winners are developers building on Base and anyone deploying autonomous AI agents that need to purchase data, call premium APIs, or access metered content at scale.
Traditional payment infrastructure, built around two-factor authentication and fixed per-transaction fees – is structurally incompatible with high-frequency, low-value machine-to-machine payments. X402 is purpose-built for exactly that environment.
Coinbase benefits disproportionately in the near term. Base is the reference network, the Coinbase X402 Facilitator is the default payment verifier, and USDC, Circle’s stablecoin with deep Coinbase ties, is the primary settlement asset.
The x402 foundation launched on 4/02 by the way. https://t.co/WULpuBdVhW
— Coinbase
(@coinbase) April 3, 2026
The open governance structure prevents lock-in on paper, but network effects will concentrate volume on whatever infrastructure ships first. That is currently Base. The broader regulatory groundwork Coinbase has laid through FIT21 advocacy compounds this structural advantage – a company that shapes both the legal framework and the technical standard occupies a uniquely durable position.
The adoption risk is browser integration. X402 can function today at the application and API layer without any browser changes, but mainstream consumer adoption requires Chrome, Safari, and Firefox to natively parse X402 responses.
Google and Microsoft are founding members of the X402 Foundation, which is the strongest signal available that browser-level support is on the roadmap, but roadmaps are not shipping products. The protocol wins if the SDKs land before a competing standard gains traction. It stalls if the major browser vendors treat this as a low-priority governance commitment rather than an active engineering project.
The verdict: X402 is the most credible attempt to build a native payment layer into the web since the original HTTP spec reserved that status code. Execution is the only variable left.
The post Coinbase & Linux Foundation Debut X402: HTTP-Native Crypto Payment Standard appeared first on Cryptonews.

Arkham Intelligence published a comprehensive breakdown of the largest Ethereum (ETH) holders in 2026, revealing that staking contracts, exchanges, and financial institutions now control most of the supply.
The report draws on on-chain data from the Arkham Intel Platform and covers entities ranging from centralized exchanges to individual pre-sale investors.
Staking and Exchanges Control Most ETH
The ETH2 Beacon Deposit Contract sits at the top of the list with over 82 million ETH, valued at approximately $169 billion.
That figure represents roughly 66% of the total ETH supply, locked by validators securing the network.
Among exchanges, Coinbase leads with 4.2 million ETH ($8.6 billion), followed by Binance with 3.6 million ETH ($7.3 billion).
South Korean exchange Upbit ranks third at 1.7 million ETH. These holdings are custodial, held on behalf of users for trading, withdrawals, and staking services.
On the financial institution side, BlackRock holds over 3 million ETH ($6 billion) through its iShares Ethereum Trust ETF.
Treasury company Bitmine has declared 4.7 million ETH in total, though only 914,000 ETH has been verified on-chain by Arkham.
Bitmine aims to accumulate 5% of the total ETH supply.
Individual Holders and Lost Fortunes
Among individuals, Estonian pre-sale investor Rain Lohmus technically owns the most ETH at 250,000 tokens worth $530 million.
However, he lost access to his private keys after purchasing them for $75,000 during the 2014 presale.
Ethereum co-founder Vitalik Buterin is the largest individual holder with accessible funds, holding 224,000 ETH ($480 million).
Ethereum Foundation Shifts From Selling to Staking
Separately, Arkham reported the Ethereum Foundation staked an additional $46.64 million in ETH, its largest single-day deployment.
That brings the Foundation’s total staked amount to approximately $96.59 million.
The move is part of a broader plan announced in February to stake 70,000 ETH from its treasury. Staking rewards will fund research, ecosystem grants, and protocol development.
The Foundation previously relied on periodic ETH sales, which drew community criticism for creating sell pressure.
With institutions, exchanges, and now the Ethereum Foundation itself locking supply into validators, the distribution of ETH increasingly favors long-term holders over liquid markets.
The post Who Really Owns All the Ethereum? On-Chain Study Reveals Surprising Names appeared first on BeInCrypto.
Crypto World
World Liberty Financial Under Ethics Fire: Can WLFI Crypto Survive Corruption Allegations?
World Liberty Financial (WLFI) crypto is structured to funnel 75% of net revenues to DT Marks DEFI LLC, a Delaware entity tied directly to Donald Trump and his family, while insulating them from any legal or financial liability for the project’s operations.
House Democrats published a staff report on November 24 describing WLFI as the centerpiece of what it calls presidential self-dealing on an unprecedented scale, with Representative Jamie Raskin stating that Trump has “turned the Oval Office into the world’s most corrupt crypto startup operation.”
The conflict-of-interest mechanism is direct and unambiguous. Donald Trump simultaneously controls crypto policy from the White House and holds a dominant financial stake in a DeFi project whose commercial value depends on the regulatory environment he shapes. That is not a perception problem – it is a structural one.
Discover: Best Crypto to Diversify Your Portfolio
Key Takeaways:
- Revenue structure: 75% of WLFI net revenues flow to DT Marks DEFI LLC, a Trump family-linked entity, with no personal liability attached.
- Scale of extraction: The Trump family has collected at least $890 million in revenues and holds WLF tokens valued at $3.8 billion, with no evidence of personal capital investment.
- Foreign money: Justin Sun invested $75 million in WLFI tokens before his SEC fraud case was dropped; UAE-based Aqua 1 Foundation wired $100 million in stablecoins with unclear origins.
- Token performance: WLFI tokens are down 50% from all-time highs; Trump and Melania memecoins have collapsed 91% and 99% respectively.
- Banking expansion: On January 9, 2026, WLFI applied to the OCC for a national trust bank charter under World Liberty Trust Company, with Zach Witkoff listed as proposed president.
- Political exposure: House Democrats’ Anti-Crypto Corruption Week scrutiny is escalating, with the November 24 report naming obstruction of justice, foreign influence, and self-dealing as core allegations.
What WLFI’s Revenue Structure Actually Means – and Why Ethics Experts Are Alarmed
The mechanics of World Liberty Financial’s compensation structure are what drive the ethics concerns, not the politics surrounding them.
Under the project’s Gold Paper, DT Marks DEFI LLC – the Trump family’s designated revenue vehicle – receives 75% of net revenues generated by the DeFi platform, while the legal wrapper around that entity specifically protects the Trump family from operational liability. The distinction matters because it creates a one-way financial relationship: profit flows to the Trumps, risk does not.
Citizens for Responsibility and Ethics in Washington (CREW) and other watchdog organizations have flagged this arrangement as without precedent in the relationship between a sitting president and an active commercial enterprise.
The Trump family has extracted at least $890 million in revenues from WLFI while holding tokens currently valued at approximately $3.8 billion – with no documented personal capital investment at inception. That is not a founder’s equity stake built through risk-taking. It is a revenue claim backed by name recognition and political positioning.

The foreign investment dimension compounds the structural problem significantly. Justin Sun, charged by the SEC for fraud and market manipulation, invested $75 million in WLFI tokens. His multibillion-dollar SEC case was subsequently dropped.
The UAE-based Aqua 1 Foundation, linked by analysts to entities with ties to China’s state-owned CNPC, wired $100 million in stablecoins to the project in summer 2025 – with Reuters reporting that the origins and expectations attached to that transfer remain opaque. A 60 Minutes report on November 17, 2025 further connected a $2 billion Binance-MGX deal settled in WLFI’s USD1 stablecoin to Binance founder Changpeng Zhao’s Trump pardon.
Crypto insiders have described WLFI as a mechanism for global influence-buying dressed as a DeFi project. Some institutional players, approached with what sources describe as “mutual investment” pitches, declined after concluding the arrangement crossed ethical lines.
The absence of institutional whales in WLFI’s order books – with retail participants dominating token purchases – suggests sophisticated capital has reached a similar conclusion.
Discover: The Best Crypto to Buy Right Now
Can a President Profit From Crypto Policy? The Conflict WLFI Can’t Shake
Trump’s administration has moved aggressively on crypto-friendly policy reform since January 2025, and each legislative win that benefits the broader industry also directly benefits World Liberty Financial.
The GENIUS Act, which Trump endorsed to establish a stablecoin regulatory framework, creates legitimacy infrastructure for USD1 – WLFI’s own stablecoin – at exactly the moment the project needed it.
The FIT21 regulatory framework, which restructures SEC and CFTC jurisdiction over crypto assets, would materially ease the compliance burden on DeFi platforms like WLFI.
The SEC’s dramatically softened enforcement posture under the Trump administration is not a coincidence critics are willing to overlook, particularly given the Sun case. A president whose family holds $3.8 billion in tokens tied to a DeFi project has quantifiable financial incentives to reduce regulatory friction on DeFi.
The White House maintains that Trump’s assets are held in a trust managed by his children and that no conflicts exist. That framing is deliberate: a trust managed by the president’s children, in a project co-founded by those same children, is not a meaningful separation under any conventional ethics standard.
The evolving legal frameworks for DeFi entities make WLFI’s structural opacity harder to dismiss as a technicality. WLFI’s January 2026 OCC application for a national trust bank charter – listing Zach Witkoff as proposed president – would, if approved, extend the project’s reach into federally regulated banking infrastructure. The political and financial interests at stake are not abstract. They are denominated in billions and written into legislation.
Discover: The Best Crypto Presales Live Right Now
The post World Liberty Financial Under Ethics Fire: Can WLFI Crypto Survive Corruption Allegations? appeared first on Cryptonews.

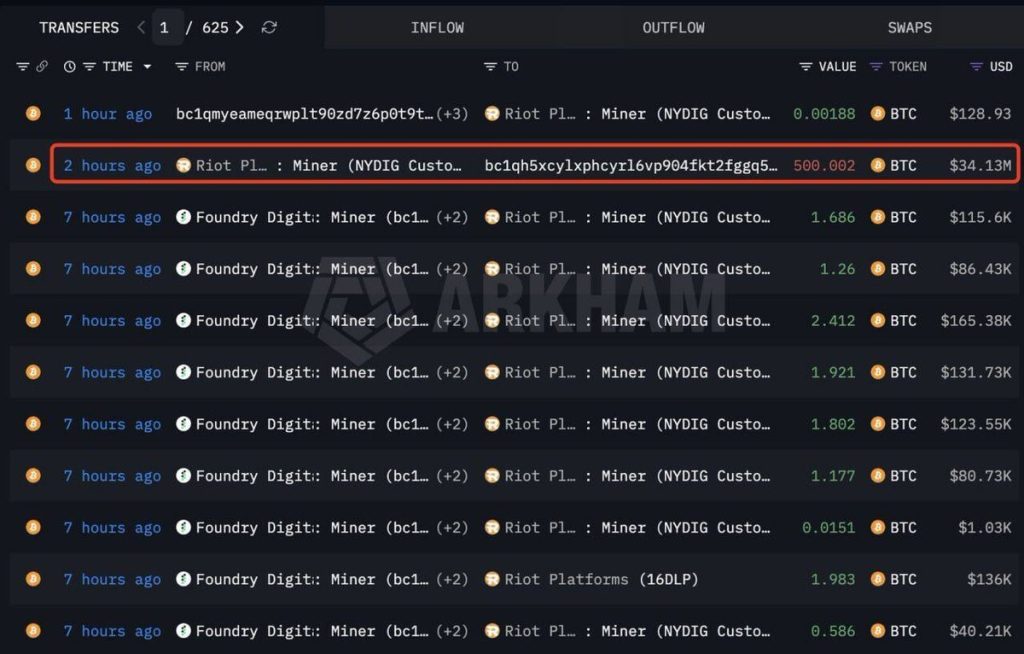
Riot Platforms sold 3,778 Bitcoin in Q1 2026, netting $289.5 million-a volume that dwarfs its 1,473 BTC production for the same period by 2.6x.
The company ended Q1 with 15,680 BTC on its books, down 18% from the 18,005 coins it held at the close of 2025. That gap between what Riot mined and what it sold is the number that demands explanation.
Blockchain intelligence platform Arkham flagged a separate 500 BTC outflow from a wallet attributed to Riot on Thursday, suggesting the selling didn’t stop when Q1 closed.
The company is also pushing deeper into high-performance computing colocation, shifting its business model beyond pure mining toward infrastructure hosting-a pivot that requires capital, which partially explains the aggressive liquidation pace.
Energy costs are the other half of the story. Kadan Stadelmann, blockchain developer and co-founder of AI company Compance, said miners are selling because rising energy costs-worsened by the escalating Middle East conflict since February-are compressing margins across the industry.
“This leads to a fall in hashrate and difficulty in Bitcoin mining. This makes it easier and more profitable to mine Bitcoins for those miners who remain online,” Stadelmann said, predicting further capitulation from less efficient operators.
- Sales volume: Riot sold 3,778 BTC in Q1 2026, generating $289.5 million against quarterly production of just 1,473 BTC.
- Treasury drawdown: BTC holdings fell 18% quarter-over-quarter, from 18,005 to 15,680 BTC.
- Power cost improvement: All-in power cost dropped 21% year-over-year to 3.0¢/kWh, even as selling accelerated.
- Hash rate expansion: Deployed hash rate grew 26% to 42.5 EH/s, signaling infrastructure reinvestment over accumulation.
- Power credits: Riot generated $21.0 million in power credits during Q1-more than double the prior year period.
- Industry-wide selling: MARA Holdings, Genius Group, and Nakamoto Holdings sold a combined 15,501 BTC in the last week alone.
Discover: The Best Crypto to Get Right Now
Selling Above Production Rate – Operational Pivot or Distress Signal?
Selling 2.6x your quarterly production isn’t treasury management in the traditional sense-it’s a structural drawdown.
That matters because it signals Riot isn’t just covering operating costs; it’s funding something larger, whether that’s hash rate expansion, colocation infrastructure buildout, or balance sheet repair ahead of continued Bitcoin price pressure.
The operational data cuts against a pure distress read, though. Riot improved its all-in power cost 21% year-over-year to 3.0¢/kWh and grew deployed hash rate 26% to 42.5 EH/s. It also generated $21.0 million in power credits during Q1-more than double the year-ago period-by leveraging renewable energy agreements and grid services.

That’s not the profile of a miner bleeding out; it’s a miner reallocating capital aggressively into infrastructure while conditions remain volatile.
Riot isn’t alone. MARA Holdings, Genius Group, and Nakamoto Holdings sold a combined 15,501 BTC in the past week.
Genius Group went further-liquidating its entire Bitcoin stash. The industry is clearly in a rotation away from passive accumulation toward active treasury management, a departure from the hodl-first playbook that defined miner strategy through the 2021 bull cycle. If Bitcoin prices don’t recover in Q2, watch for Riot’s treasury to test the 14,000 BTC level within two quarters at the current drawdown rate.
Discover: The Best Crypto Presales Live Right Now
Miner Selling and BTC Supply Pressure: How Much Does It Move the Market?
Bitcoin mining difficulty dropped from approximately 145 trillion to 133 trillion on March 20-a 7.7% decline-while network hash rate fell from 1,160 exahash to roughly 990 exahash as of Friday.
Weaker miners are going offline, exactly as Stadelmann predicted, which structurally benefits survivors like Riot with lower difficulty and higher per-block rewards.
The supply side picture is more complicated when viewed against demand. Bitcoin ETFs snapped a four-month outflow streak with $1.32 billion in March inflows, meaning institutional demand is partially absorbing the miner supply hitting the market.
Riot alone doesn’t move BTC price-but Riot plus MARA plus Genius Group plus Nakamoto in the same week represents a coordinated pressure event that on-chain miner outflow metrics will reflect clearly.
The invalidation condition here is simple: if BTC reclaims and holds above $90,000 in Q2, Riot’s treasury logic flips from defensive liquidation to premature selling at cycle lows. Until that happens, the selling looks rational given the broader market pressure on holders and the rising cost environment compounding miner margin squeeze globally.
Explore: The best pre-launch token sales with asymmetric upside potential
The post Riot Platforms Sells 3,778 Bitcoin in Q1 as Miner Strategy Shifts appeared first on Cryptonews.


The U.S. employment market rebounded in a big way from February’s sizable losses.
According to a Friday morning release from the Bureau of Labor Statistics, the country added 178,000 jobs in March, after losing 133,000 positions the previous month. Economist forecasts had been for 60,000 jobs to have been added.
The unemployment rate fell to 4.3% versus 4.4% in February and expectations for 4.4%.
At least part of the beat was due to a sizable downward revision in the February data from an originally reported decline of 92,000.
Trading quietly near the $67,000 level in the hours ahead of the data, bitcoin remained there in the minutes just following the report.
Expectations about the future course of interest rates, of late, have been far more influenced by events in the Middle East and the price of crude oil than by the outlook for domestic economic growth.
As recently as last week, oil’s surging price had markets forecasting imminent rate hikes by the U.S. Federal Reserve. Speaking earlier this week, though, Fed Chairman Jerome Powell said the central bank recognized that oil price shocks — while initially making headline inflation numbers look worse — can depress economic activity. He indicated the Fed would be in no hurry to raise rates in response to short-term moves in the price of crude.

Man, 24, dies after being hit by vehicle on M61 motorway

NBA roundup: Luka Doncic hurt in Lakers’ blowout loss to Thunder

Fan fiction website AO3 is finally coming out of beta

Smart energy pays enters the US market, targeting scalable financial infrastructure

Why Israel is blocking foreign journalists from entering

Bitcoin: We’re Entering The Most Dangerous Phase

“Bitcoin Is Following A Pattern Nobody Wants To Admit” | Anthony Scaramucci

Banking & Financial Current Affairs MARCH 2026 | Monthly Current Affairs Series By Sheetal Mam

How Is Everything Outpacing Inflation At The Same Time?
-

 NewsBeat7 days ago
The Story hosts event on Durham’s historic registers
-

 NewsBeat19 hours ago
Steven Gerrard disagrees with Gary Neville over ‘shock’ Chelsea and Arsenal claim | Football
-

 Sports7 days ago
Sweet Sixteen Game Thread: Tide vs Michigan
-
Entertainment4 days ago
Fans slam 'heartbreaking' Barbie Dream Fest convention debacle with 'cardboard cutout' experience
-

 Crypto World2 days ago
Gold Price Prediction: Worst Month in 17 Years fo Save Haven Rock
-

 Business14 hours ago
No Jackpot Winner and $194 Million Prize Rolls Over
-
 Entertainment6 days ago
Lana Del Rey Celebrates Her Husband’s 51st Birthday In New Post
-

 Tech4 days ago
The Pixel 10a doesn’t have a camera bump, and it’s great
-
Crypto World3 days ago
Dems press CFTC, ethics board on prediction-market insider trades
-

 Sports3 days ago
Tallest college basketball player ever, standing at 7-foot-9, entering transfer portal
-

 Tech3 days ago
EE TV is using AI to help you find something to watch
-

 Fashion5 days ago
Amazon Sundays: Soft Spring Layers
-

 Tech4 days ago
Avatar Legends: The Fighting Game comes out in July and it looks pretty slick
-

 Business1 day ago
Login and Checkout Issues Spark Merchant Frustration
-

 Fashion6 days ago
When Evening Dressing Gets Colorful for Spring
-

 Tech3 days ago
How to back up your iPhone & iPad to your Mac before something goes wrong
-

 Tech5 days ago
Elon Musk’s last co-founder reportedly leaves xAI
-

 Tech4 days ago
Apple will hide your email address from apps and websites, but not cops
-

 Crypto World4 days ago
U.S. rule change may open trillions in 401(k) funds to crypto
-

 Politics4 days ago
Should Trump Be Scared Strait?
You must be logged in to post a comment Login