
Crypto World
Enjin surges 45% as volume and open interest hit multi-month highs


Key takeaways
- ENJ is one of the best performers in the crypto market, up 45% in the last 24 hours.
- The rally could allow ENJ to surge towards $0.045 in the near term.
Enjin Coin (ENJ) continues to rally
Enjin Coin (ENJ) extends its gains, holding steady above $0.035 on Thursday following a remarkable 45% price increase in the last 24 hours.
This bullish momentum is underpinned by both on-chain and derivatives data, with a positive technical outlook suggesting that ENJ may continue its upward trend in the near future.
Data obtained from Santiment shows that Enjin Coin’s ecosystem trading volume surged to $216.97 million on Thursday, marking the highest trading volume since April 2025.
Meanwhile, CoinGlass data shows that ENJ’s futures Open Interest (OI) reached a new record of $74.68 million on Thursday, up significantly from $19.82 million on Tuesday. A rising OI indicates fresh capital entering the market, which could further propel the coin’s price upward.
Despite the rally, traders remain cautious as some early signs of buyer fatigue begin to surface. According to CryptoQuant, there is a rise in retail activity, suggesting a shift in market sentiment.
Furthermore, sell-side dominance in both the spot and futures markets may point to potential bearish pressure, signaling that the current rally could face resistance in the near term.
ENJ eyes further gains after 45% increase
The ENJ/USD 4-hour chart is bullish and efficient thanks to the 45% rally. The rally has lifted ENJ price back above the short- and medium-term Exponential Moving Averages (EMA), leaving only the 200-day EMA at $0.035 as immediate overhead resistance.
The Relative Strength Index (RSI) on the 4-hour chart reads 70, indicating a bullish bias. The Moving Average Convergence Divergence (MACD) histogram turning strongly positive reinforces growing upside momentum.

If the rally persists, initial resistance is seen at the 200-day EMA at $0.035. If the daily candle closes above this level, it could extend its rally towards the $0.051 resistance level, followed by $0.066 and $0.082 zones.
However, if the bears regain control, ENJ would likely face the initial support at $0.031. The 100-day EMA at $0.024 and the 50-day EMA at $0.022, together with the lower horizontal level at $0.019, form a deeper demand zone that could also prove to be bouncing support levels in the near term.

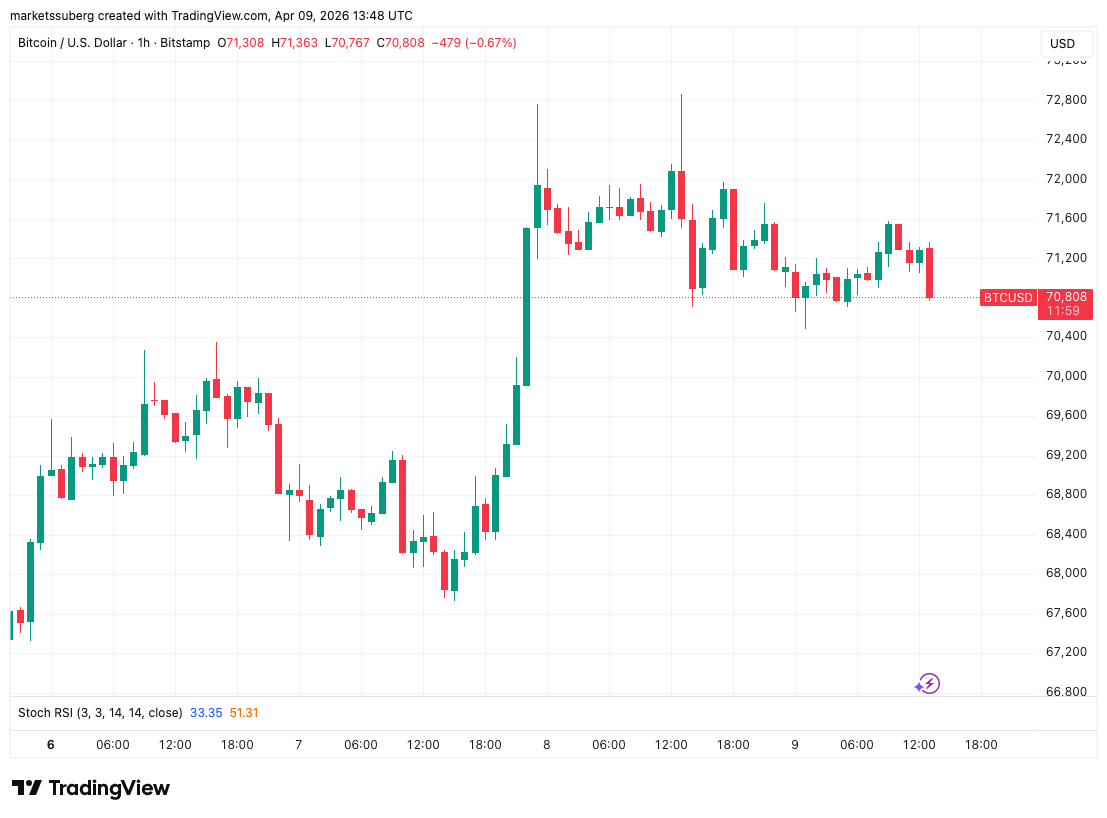
Bitcoin (BTC) circled $71,000 at Thursday’s Wall Street open after US inflation data conformed to expectations.
Key points:
-
Bitcoin waits for new catalysts as US PCE inflation data conforms to market expectations.
-
Friday’s CPI release will be the first to show any impact of the US-Iran war.
-
$80,000 remains in play as a BTC price target, a trader says.
PCE data avoids surprises for risk assets
Data from TradingView showed cooling BTC price volatility after local highs near $73,000 the day prior.

Relief over a US-Iran ceasefire combined with favorable readings from the Federal Reserve’s “preferred” inflation gauge, the Personal Consumption Expenditures (PCE) index.
Core PCE year-on-year came in at 3% for February. On a monthly basis, core PCE was at 0.4%, per data from the US Bureau of Economic Analysis (BEA).

Reacting, trading resource The Kobeissi Letter noted that the impact of the US-Iran war and oil-supply squeeze were not yet reflected in PCE.
“This marks the final pre-Iran War PCE inflation datapoint,” it wrote on X.
Markets remained cautious about future Fed policy, with data from CME Group’s FedWatch Tool continuing to show no expectations of interest-rate cuts in 2026.

While Bitcoin offered no obvious reaction to the latest data, meanwhile, economist Mohamed El-Erian argued that Friday’s March Consumer Price Index (CPI) release was more important.
“While PCE inflation is widely regarded as the Fed’s favorite measure, the bigger inflation focus this week will be on tomorrow’s CPI data, as PCE covers February and not March,” he told X followers.
As Cointelegraph reported, CPI is particularly susceptible to fallout from oil-price swings.
Trader: $80,000 BTC price push “on the horizon”
BTC price action thus left traders guessing as to when and where the next move would be.
Related: Bitcoin RSI ‘nearly perfectly’ copying end of 2022 bear market: Analysis
In their latest market commentary, pseudonymous trader LP leveraged liquidation clusters to give potential targets.
“On the HTF, some upside low-leverage liquidation clusters have been cleared, but sizeable liquidity still remains around 73K and above the highs near 76K. Meanwhile, liquidity is starting to build on the downside, mainly around 69K and 64K,” an X post stated.
“With price still range-bound, both sides remain in play. If the 69–68K level holds, price is likely to push higher and target the remaining upside liquidity around 73K.”

Crypto trader Michaël Van de Poppe was more optimistic, keeping the $80,000 mark in play.
“As long as Bitcoin continues to hold these ranges, there’s a strong new upwards leg on the horizon towards $80K,” he summarized on the day.

This article is produced in accordance with Cointelegraph’s Editorial Policy and is intended for informational purposes only. It does not constitute investment advice or recommendations. All investments and trades carry risk; readers are encouraged to conduct independent research before making any decisions. Cointelegraph makes no guarantees regarding the accuracy or completeness of the information presented, including forward-looking statements, and will not be liable for any loss or damage arising from reliance on this content.
Crypto World
Bitmine Immersion (BMNR) uplists to NYSE and boosts share buyback program to $4 billion


Bitmine Immersion Technologies (BMNR) began trading on the New York Stock Exchange on Thursday, moving from the NYSE American as it scales its crypto-focused treasury strategy.
The company paired the uplisting with an increase in its share repurchase program, raising the authorization to $4 billion from $1 billion. The buyback ranks among the largest announced this year, according to the company. BMNR’s stock has plunged roughly 90% since peaking last summer amid the height of the digital asset treasury mania. Shares are lower by 2.8% in early Thursday trading.
Bitmine now holds about 4.8 million ETH, equal to 3.98% of total supply, and continues to target 5%, or what it calls the “Alchemy of 5%.”
The macro backdrop could play a role. Fundstrat co-founder Tom Lee, who also chairs Bitmine, has argued that U.S. equities may have found a bottom following a ceasefire tied to tensions in Iran. Stocks, oil and volatility shifted sharply in response, a pattern that has also lifted crypto markets.
Bitcoin recently moved above $72,000 alongside gains in equity futures, reflecting a broader “risk-on” trade. Ether may benefit as well, with recent inflows into spot exchange-traded funds and increased staking activity reducing selling pressure, according to Lee.
For Bitmine, the link is direct. Each 1% rise in ether’s price adds roughly $100 million to the value of its holdings. A sustained rebound in crypto could support its balance sheet and stock.
Crypto World
Polymarket Just Hit $4 Billion in Volume on 5-Minute Markets: Is Chainlink the Infrastructure Behind the Next DeFi Explosion?

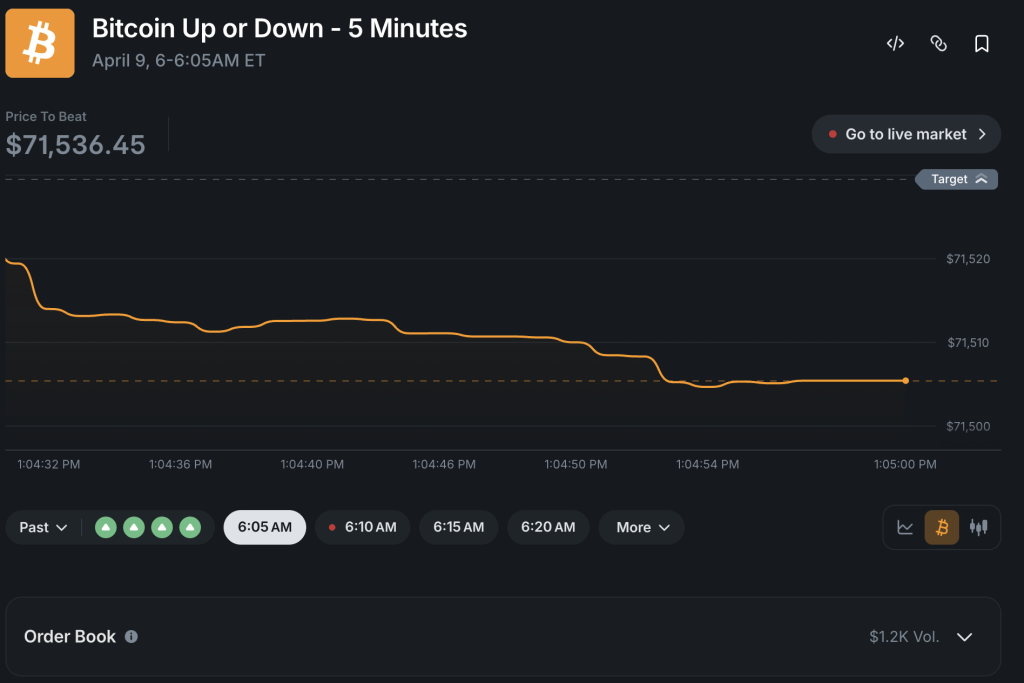
$153 million in daily volume. $4 billion total. $200 million in the first week alone. Polymarket’s 5-minute prediction markets have gone from experimental product to one of the highest-velocity trading venues in DeFi – and Chainlink oracles are the reason any of it works.
The volume surge, confirmed by on-chain data shared across crypto analytics channels, represents a roughly 400% increase from earlier baseline figures, with the 3x weekly growth rate still accelerating as of the latest reporting window.
Discover: The best pre-launch token sales
Why 5-Minute Prediction Markets Break Standard Oracle Architecture
Standard oracle infrastructure built for hourly or daily market resolution can tolerate latency. A price feed delayed by 30 seconds is noise when a contract settles in 48 hours.
In 5-minute prediction markets, that same 30-second delay is the difference between a valid settlement and a manipulated one, exactly why Polymarket’s architecture required a fundamentally different oracle setup.
Chainlink’s Data Streams integration, deployed on Polygon where Polymarket settles, delivers timestamped price reports at sub-second intervals.
Combined with Chainlink Automation handling the on-chain settlement triggers, the system processes the full cycle, price confirmation, contract resolution, USDC payout, without human intervention and without the manipulation vector that centralized price feeds introduce.
The oracles provide the official price feeds that trigger contract settlements, removing the need for a centralized authority entirely.
The scale of what’s now running through this infrastructure is significant. Over 3,000 traders are actively using Chainlink Data Streams across integrated platforms, and the Dashlink dashboard tracking oracle demand shows a direct correlation between the Polymarket volume surge and a decline in LINK exchange reserves – whales are pulling supply off exchanges as network utilization hits new highs for prediction market settlements.
Native USDC collateral adoption within these markets has further accelerated institutional participation by improving capital efficiency.
The appeal is obvious: a platform already under scrutiny for insider trading patterns on longer-duration markets now offers a format where information asymmetry has a 5-minute shelf life.
The risks are real and shouldn’t be buried. Short timeframes amplify volatility, HFT-dominated order flow can crowd out retail, and oracle delays, however rare, carry outsized consequences when resolution windows are measured in minutes.
But the volume data doesn’t lie: the format is capturing demand that didn’t have an instrument before.
Convergence Hackathon Closes – Liquid Chain Takes the Grand Prize on CCIP
Liquid Chain built a Unified Liquidity Layer that aggregates capital across multiple Layer-2 networks using Chainlink’s Cross-Chain Interoperability Protocol (CCIP) as the messaging backbone.
The core problem it solves is real and expensive – assets stranded on individual L2s require manual bridging, creating slippage, delay, and trust assumptions that institutional allocators won’t accept.

Liquid Chain’s architecture lets users move assets seamlessly across chains without manual bridge interactions, with CCIP handling the verification and message-passing layer beneath the surface.
The project has been pitching its Layer-3 DeFi buildout as a credible answer to the fragmentation problem, and the Convergence judges agreed.
Other notable hackathon submissions concentrated on Real-World Asset tokenization and DeFi automation – a consistent signal that Chainlink’s developer community is orienting toward institutional-grade infrastructure rather than consumer speculation. The CCIP adoption rate implied by the hackathon submissions validates Chainlink’s cross-chain positioning at exactly the moment demand for tamper-proof oracle settlement is breaking records on Polymarket.
Explore the LiquidChain presale and current allocation terms here.
The post Polymarket Just Hit $4 Billion in Volume on 5-Minute Markets: Is Chainlink the Infrastructure Behind the Next DeFi Explosion? appeared first on Cryptonews.


- Bitcoin trades above $70,700 as derivatives data shows $80,000 calls dominating on Deribit.
- BTC rebounded to near $72,900 on Wednesday as a US-Iran ceasefire eased oil pressures.
- Analysts see end of stress cycle, targeting $80,000 if $75,000 breaks.
Bitcoin’s resurgence to above $70,000, with intraday highs of $72,900, has crypto enthusiasts in an upbeat mood. The cryptocurrency hovers near $70,800 as of writing, off highs seen on Wednesday, but bulls are upbeat as fresh market signals point to a potential breakout.
Traders bet on next leg up for Bitcoin
Bitcoin is well off its year-to-date highs and has struggled since breaking lower in late January 2026. Bears are therefore still on the hunt.
However, this week has investor sentiment shifting bullish, fueled by the US-Iran ceasefire and key activity in Bitcoin derivatives. Data suggests investors are eyeing a potential rally to $80,000.
Options data from Deribit, the platform that accounts for the lion’s share of the global crypto options market, shows bullish bets on prices surging to $80,000 have increased.
Call options betting on BTC climbing beyond the $80k strike price have hit $1.6 billion. This is a stark reversal from recent months when $60,000 puts, which outline wagers on price drops, dominated the outlook.
On-chain data also supports the bullish case, with Morgan Stanley’s ETF debut netting over $34 million in volume.
Allyson Wallace, global head of ETFs at Morgan Stanley, commented ahead of the launch: “The demand, especially from the high-net-worth investors, has been quite high. Viewed at the firm level, this is an asset class that is not going away.”
Bitcoin price prediction
The crypto market began the week with all eyes on Bitcoin. Notably, BTC bounced to highs near $72,900, hitting levels last seen since March 18. The uptick saw buyers push from lows near $67,700 overnight Tuesday, April 7, amid news of a ceasefire between the US and Iran.

Investors buoyed by the prospect of an easing in oil prices helped BTC higher. With broader inflation concerns dissipating, a further strengthening in the ceasefire could see Bitcoin prices break to $75,000. If this happens, the next target will be $80,000 or higher.
However, geopolitical risks remain amid a likely fragile ceasefire. If fresh attacks begin and an escalation occurs, a surge in oil prices could send risk assets plummeting.

Key Takeaways
- NVDA slipped between 0.2%–0.5% Thursday, settling around $181.75 following Wednesday’s 2.2% rally
- Shares have remained confined within a $165–$195 trading channel for several months
- Market analysts identify $185 as a critical breakout threshold; $200 viewed as confirmation level
- Wednesday’s surge followed news of a two-week U.S.-Iran ceasefire, though durability concerns persist
- Technical analysts warn that breaching $170 support could trigger a decline toward $150
Nvidia’s recent price action reflects a prolonged period of consolidation. Despite its status as the market’s artificial intelligence powerhouse, NVDA shares have languished in a holding pattern since September 2025, oscillating within a $165–$195 corridor as traders await a meaningful catalyst.
Signs of a potential breakout emerged recently. The chipmaker mounted an impressive rally spanning six consecutive sessions—delivering gains exceeding 10% and marking its longest winning streak since October—before momentum stalled on Thursday.
The Wednesday surge of 2.2% followed President Trump’s announcement of a temporary two-week ceasefire agreement with Iran, which included the reopening of the strategically vital Strait of Hormuz. This development eased concerns about potential economic disruption. Nvidia emerged as one of the S&P 500’s top performers during that session.
Thursday’s trading painted a contrasting picture. Shares retreated approximately 0.5% to $181.75 as market participants expressed skepticism about the ceasefire’s sustainability. The broader S&P 500 index also traded relatively flat.
Geopolitical dynamics continue to influence risk sentiment across markets. Iran’s continued capability to disrupt shipping through the Strait of Hormuz maintains a degree of unease among investors.
Beyond geopolitical concerns, a fundamental question persists: will major cloud providers—including Microsoft, Google, and Amazon—realize meaningful returns on their substantial artificial intelligence infrastructure investments? This uncertainty has effectively capped NVDA’s upside potential in recent months.
Ishan Majumdar, founder of Baptista Research, shared his perspective with Barron’s, emphasizing that core AI demand dynamics haven’t changed. “Nothing about the cease-fire alters the structural AI demand story,” he noted. “If anything, removing macro volatility allows the market to refocus on those fundamentals.”
Technical Analysts Flag $185 as Pivotal Threshold
Jonathan Krinsky, chief market technician at BTIG, has identified the $185 price point as particularly significant. “If Nvidia sustains above $185, I would say the money is ready to run back in,” he explained. “The long-term trend remains positive.”
Buff Dormeier at Kingsview Partners believes a higher confirmation is necessary. He suggests NVDA must break through $200 to establish a convincing bullish trajectory. “If we started to get a signal of that, we could easily be back to the races,” he indicated.
Dormeier also highlighted improving valuation metrics. NVDA currently trades at approximately 20 times forward earnings—significantly below its historical 10-year average multiple of around 36—and now trades in line with the broader S&P 500. This represents a meaningful valuation compression for a stock that traditionally commanded a substantial premium.
Support Breakdown Could Trigger Further Weakness
Both technical strategists emphasize meaningful downside risks. The $170 price level represents crucial support. A sustained breach below this threshold could signal additional selling pressure ahead.
“If we were to break under there, I think shares could fall down to $150,” Dormeier cautioned.
Krinsky shared similar concerns about the sustainability of the recent bounce. “It doesn’t strike me as an all-clear that we recovered the $170 level so quickly,” he observed. “If it moves back to that level and closes under it again, that would be a more telling signal that Nvidia is likely to continue lower.”
For the immediate term, Dormeier frames the trading range as $165 representing the floor and $180 marking near-term resistance. NVDA settled Wednesday’s session at $182 before trading around $181.75 on Thursday.


Bitcoin Depot, a leading operator of crypto ATMs in the United States, disclosed a security breach that led to the theft of about 50.9 Bitcoin, valued at roughly $3.7 million at the time of reporting, after an attacker gained access to credentials tied to the company’s corporate Bitcoin wallets.
The incident occurred on March 23, and, according to a filing with the U.S. Securities and Exchange Commission, the attacker took control of credentials connected to Bitcoin Depot’s corporate BTC wallets. The company emphasized that customer accounts, its platforms and personal data were not affected. The breach has not halted daily operations, and the firm has insurance that may cover a portion of the losses. The investigation is ongoing, and the full scope, nature, and impact of the incident remain uncertain.
Bitcoin Depot’s stock responded to the disclosure, closing up 15.6% at $2.74 on the day and moving higher in pre-market trading to around $2.90, according to Yahoo Finance data.
Key takeaways
- The breach resulted in an estimated 50.9 BTC theft, equating to about $3.7 million at the time of the notice, with attackers gaining access to corporate wallet credentials.
- Customer data and platform access were reportedly unaffected, and operations continued with insurers potentially covering part of the losses, though the full scope remains under investigation.
- Bitcoin Depot has faced intensified regulatory scrutiny across several U.S. states, including licensing actions in Connecticut, where regulators cited high fees and incomplete restitution to scam victims.
- Recent legal actions include a Massachusetts lawsuit over alleged overcharging and facilitating scams, and a Maine settlement of $1.9 million to compensate affected users; a June 2024 data breach also exposed tens of thousands of customers.
- Market and policy dynamics around crypto ATMs are tightening, with ongoing discussions in multiple cities about banning or restricting kiosk-based crypto access.
Operational risk, insurance, and ongoing investigations
The March breach underscores how credential compromise can enable unauthorized access to corporate wallets, even when consumer-facing services remain unaffected. Bitcoin Depot states that customer-facing platforms and personal data were not compromised, but the incident raises questions about internal security controls, credential management, and monitoring across enterprise systems. The company has indicated it carries insurance that may help offset losses, but the exact coverage and its applicability to a security incident of this type have not been disclosed publicly.
As regulators and investors await the full forensic findings, the evolving incident illustrates the broader risk landscape for crypto ATM operators, whose business model relies on a distributed, networked infrastructure across dozens or hundreds of locations. For users and institutions, it highlights the tension between enabling accessible crypto on-ramps and maintaining robust, verifiable security controls to deter credential compromise and unauthorized access.
Regulatory pressures and legal exposure mounting
Bitcoin Depot has faced mounting regulatory pressure across several states. In Connecticut, the company’s money transmission license was suspended, and regulators issued a cease-and-desist order over concerns including excessive fees and insufficient refunds to scam victims. Connecticut’s action adds to a growing list of state-level concerns about consumer protections and fee practices in the crypto ATM space.
Beyond licensing actions, the company has grappled with a high-profile Massachusetts lawsuit alleging overcharging and facilitating scams against consumers. Separately, Maine regulators required the company to compensate affected users, with a $1.9 million settlement designed to address prior consumer harms.
These developments come as the sector’s exposure to fraud and scams remains a headline risk for policymakers. In June 2024, Bitcoin Depot disclosed a data breach that exposed the personal information of tens of thousands of customers; authorities allowed the company to finalize notifications only after the investigation concluded in mid-2025. The combination of security incidents and consumer-protection actions underscores a regulatory trend toward tighter oversight of crypto ATMs and related consumer risks.
Markets, perception, and the ATM ecosystem
The regulatory and security headwinds have implications for investor sentiment around crypto ATM operators. Bitcoin Depot’s stock reaction—gapping higher on the news—reflects a nuanced investor calculus: the breach is managed as a cyber risk event with potentially limited direct impact on customers, yet it amplifies scrutiny of the underlying business model and governance controls. As with any security incident, the market response hinges on the clarity of the remediation steps, the breadth of the investigation, and the extent of insurance coverage.
In parallel, the broader U.S. landscape for crypto ATMs remains sizeable but contentious. Industry trackers estimate the United States hosts upwards of 30,000 Bitcoin ATMs, underscoring the scale of on-ramp infrastructure that regulators and consumer groups are weighing. The debate extends to local policy: Stillwater, Minnesota, banned crypto ATMs after residents were affected by scams; Spokane, Washington, moved to a citywide ban in mid-2023, describing kiosks as a preferred tool for scammers. Haverhill, Massachusetts, has entertained a motion to ban crypto ATMs, with a proposed 60-day removal window if enacted.
The regulatory climate, combined with security incidents, suggests continued scrutiny and potential accelerated policy responses at the city and state levels. For operators, this may translate into tighter compliance requirements, clearer consumer-protection standards, and enhanced cybersecurity expectations as part of operational licenses and ongoing audits.
For readers seeking context on the ATM landscape, sector trackers show that the density of crypto kiosks remains a notable feature of the U.S. crypto frontier, even as regulators seek to curb fraud and misuse. See data from CoinATMRadar for the current footprint of Bitcoin ATMs in the United States.
Looking ahead, investors and users should watch how regulators balance access with protection, how operators bolster credential hygiene and incident response, and whether insurance coverage translates into meaningful risk mitigation in the event of future breaches. The evolving mix of cyber risk, consumer protection actions, and local policy decisions will shape the healing path for crypto ATM reliability and trust in the months to come.
Readers should stay tuned for further disclosures from Bitcoin Depot and for updates on regulatory actions as investigators complete their forensic work and authorities finalize consumer-notification requirements. The next few months will likely reveal how much remedial work is needed to restore confidence in a sector that sits at the intersection of convenience, security, and enforcement.


Galaxy Digital (GLXY) founder and CEO Mike Novogratz highlighted the firm’s key milestones in its 2025 annual report, marking its first 10-K filing as a Nasdaq-listed company.
Novogratz described the listing as more than a milestone, calling it “a declaration that the digital economy is real, and that Galaxy is built to lead it.”
Over the years, Galaxy has evolved from a pure-play digital asset firm into a diversified platform that includes asset management, institutional trading and AI-driven high-performance computing data centers.
Novogratz noted that the digital asset economy has evolved from a speculative, niche market into a mainstream industry, with even the United States now holding bitcoin on its balance sheet, something that would have been inconceivable a decade ago.
The company’s biggest growth tailwind is its artificial intelligence and high-performance computing strategy and Helios, its AI data center campus in West Texas. The site has secured more than 1.6 gigawatts of approved power capacity through ERCOT.
The initial 800 megawatts is already leased to AI cloud provider CoreWeave (CRWV), representing over $7.5 billion in capital investment. With an additional 830 megawatts approved for expansion, Helios is now valued at well above $15 billion, according to the report.
Novogratz’s longer-term goal is to build a multi-billion-dollar portfolio of digital infrastructure assets diversified across regions, tenants, and technologies. “Demand for compute is not a cycle, it is a structural condition that will define the next decade.”
On the digital assets side, Galaxy manages roughly $12.3 billion in platform assets as of December 31, 2025. Its offerings include over-the-counter spot and derivatives trading, lending, staking across 11 blockchains, including Ethereum and Solana, ETFs, and institutional-grade custody.
In October 2025, the firm expanded into retail with GalaxyOne, a fintech platform offering FDIC-insured high-yield accounts, commission-free trading in equities and crypto, and the option to automatically reinvest interest into bitcoin.
Despite the industry downturn in the fourth quarter of 2025, the company saw a net loss of $241 million. Novogratz remains optimistic, saying the firm is “more clear-eyed about our opportunity than we have ever been.”
Crypto World
Tokenized Commodities Push Crypto Platforms Into Direct Competition With Traditional Finance

Key Takeaways
-
Digital asset perpetual contracts expand market presence as legacy financial venues experience declining share in commodities
-
Blockchain-based silver contracts reach 40% of conventional futures market benchmark trading volumes
-
Insufficient market depth maintains legacy systems’ competitive advantage despite cryptocurrency sector expansion
-
Round-the-clock access provides digital platforms competitive differentiation versus traditional exchange operating schedules
-
Price discovery challenges hinder widespread acceptance of blockchain-based metals instruments
Digital asset trading venues are experiencing substantial expansion within commodities sectors, gradually capturing volume from conventional financial platforms while transforming worldwide market accessibility. Nevertheless, traditional institutions maintain leadership positions through superior market depth and established pricing mechanisms. Blockchain-based commodity instruments demonstrate continued expansion, yet structural constraints impede faster integration across conventional finance participants.
Blockchain-Based Commodity Products Show Strong Market Traction
Crypto exchanges are experiencing accelerated expansion across tokenized commodity sectors, mounting a credible challenge to traditional finance’s long-standing control of derivatives trading. Particularly noteworthy, perpetual silver contracts have achieved substantial trading activity when measured against conventional futures exchange benchmarks. Consequently, digital platforms persistently attract participants seeking ongoing market participation outside traditional exchange operating windows.
Throughout recent trading periods, blockchain-based silver instrument volumes have risen dramatically compared to conventional futures marketplace activity. This development signals growing appetite for adaptable trading solutions absent from traditional financial infrastructure. Additionally, cryptocurrency platforms capitalize on continuous availability, whereas legacy markets face constraints imposed by predetermined operating schedules.
Perpetual gold derivatives have similarly exceeded trading volumes on multiple regional conventional exchanges during recent measurement periods. This expansion demonstrates how digital platforms are progressively increasing their footprint within commodity markets historically controlled by traditional finance. Nonetheless, legacy institutions preserve commanding positions through well-established operational frameworks and established credibility.
Market Depth and Price Discovery Sustain Traditional Finance Leadership
Blockchain-based commodity instruments encounter ongoing obstacles that restrict their competitive positioning against conventional marketplace infrastructure. Available liquidity remains substantially thinner compared to traditional platforms, which leverage centralized settlement frameworks. As a result, price inconsistency issues persist, affecting operational efficiency relative to established financial standards.
Crypto markets function without interruption, contrasting with traditional exchanges that suspend operations during weekends and recognized holidays. This operational distinction generates volatility exposure and diminished price benchmarking during periods when conventional venues remain closed. Legacy financial structures continue delivering stability through synchronized trading sessions and aggregated liquidity resources.
Traditional financial markets sustain greater credibility through validated reserve attestations and uniform contractual specifications. Cryptocurrency trading venues currently lack uniform verification protocols matching transparency benchmarks established by conventional finance. Institutional capital allocation remains predominantly channeled within traditional environments notwithstanding emerging digital alternatives.
Operational Evolution Underscores Intensifying Market Competition
Cryptocurrency perpetual futures instruments maintain upward momentum as substitutes for traditional derivatives offerings. These products remove expiration constraints, delivering streamlined exposure compared to conventional futures agreements. Consequently, market participants increasingly embrace digital solutions while maintaining connections to established traditional instruments.
Trading analytics demonstrate robust volume growth, indicating escalating competition between crypto platforms and traditional exchange operators. Non-business-day trading patterns particularly emphasize operational advantages over conventional systems that pause during significant international developments. Therefore, digital platforms deliver accelerated response capabilities to market movements occurring beyond traditional operating hours.
Traditional finance maintains comprehensive integration throughout worldwide financial networks with unparalleled market depth and regulatory transparency. Cryptocurrency exchanges persistently enhance operational capabilities to reduce performance disparities with conventional operations. Accordingly, competitive dynamics between digital platforms and traditional finance are becoming increasingly pronounced as both ecosystems advance through rapid innovation cycles.


The DOJ and CFTC filed to enjoin Arizona’s criminal and civil enforcement against prediction market platform Kalshi, arguing federally regulated event contracts fall under CFTC jurisdiction.
The U.S. Department of Justice and the Commodity Futures Trading Commission filed a motion in federal court on Thursday to block Arizona from pursuing criminal and civil enforcement actions against prediction market platform Kalshi. The regulators argue that event contracts regulated at the federal level under CFTC oversight fall outside the state’s jurisdiction.
The filing represents a direct challenge to state-level enforcement against prediction markets, asserting that federal commodity law preempts Arizona’s action. Kalshi operates as a CFTC-regulated derivatives exchange offering binary event contracts.
Sources: U.S. court documents
This article was generated automatically by The Defiant’s AI news system from publicly available sources.

Key Takeaways
- In March 2026, Hims & Hers transitioned away from compounded semaglutide to FDA-approved branded GLP-1 medications
- Bank of America reduced its HIMS price target to $21 from $23 while maintaining a Neutral stance
- Analysts project GLP-1 EBITDA contributions may decline by 50% compared to last year
- Amazon Pharmacy launched Eli Lilly’s oral GLP-1 medication Foundayo, intensifying market competition
- Year-to-date, HIMS shares have plunged approximately 39%, hovering near $20
In a significant strategic shift this March, Hims & Hers abandoned its compounded semaglutide offerings in favor of FDA-sanctioned branded GLP-1 treatments. Management positioned this decision as transforming the company into “the largest global consumer health platform for access to more affordable, approved medications.”
Hims & Hers Health, Inc., HIMS
This strategic reversal came after settling legal proceedings with Novo Nordisk. The resolution required Hims & Hers to distribute Novo Nordisk’s authorized GLP-1 medications instead of less expensive compounded alternatives.
Investors have responded harshly to these developments. HIMS shares have plummeted nearly 39% year-to-date through Wednesday, currently trading in the vicinity of $20.
BofA Securities analyst Allen Lutz reduced his price objective on HIMS this week from $23 down to $21. The analyst maintained his Neutral stance, pointing to valuation compression among comparable companies and anticipated near-term profitability headwinds.
Lutz’s forecast suggests 2026 EBITDA could land approximately 20% beneath current Wall Street expectations. His analysis indicates GLP-1-related EBITDA contributions might decline by up to 50% compared to the previous year.
Neverthstanding the conservative perspective, Lutz indicated his research team holds “slightly more optimistic” views regarding the company’s overseas expansion strategy. He further observed that the $149 monthly branded GLP-1 subscription plan might eventually deliver margins comparable to compounded options, contingent upon subscriber migration rates.
Subscriber Migration Rates Will Determine Success
BofA Securities projects that Hims & Hers might successfully transition between 40% and 50% of current subscribers to branded medication plans, while maintaining 5% to 10% on compounded alternatives. This conversion scenario would produce approximately $60 million to $90 million in GLP-1 revenues each quarter.
The telehealth platform is simultaneously pursuing international market opportunities. Management targets growing this division beyond $1 billion in annual revenue within a three-year timeframe, achieving mid-teens organic compound annual growth rates. Bank of America’s research into the Eucalyptus platform indicates approximately 90% of revenues will derive from branded GLP-1 distribution at roughly 40% gross profit margins.
Canaccord analyst Maria Ripps offered a more bullish assessment. She maintained her Buy recommendation, contending that the Novo Nordisk collaboration represents a “long-term tailwind” for the business. Ripps believes current valuations fail to recognize the value of the company’s telehealth infrastructure, customer base, and broadening treatment offerings.
Amazon Intensifies Competition With Foundayo Launch
Competitive dynamics became more challenging Thursday when Amazon Pharmacy revealed plans to distribute Eli Lilly’s recently authorized oral GLP-1 medication, Foundayo, featuring same-day delivery options. HIMS shares dipped 0.5% following this announcement. Novo Nordisk declined 1.5%.
Foundayo represents a once-daily oral therapy designed for adults managing obesity or overweight conditions with related health complications. Pricing begins at $25 monthly with insurance coverage, or $149 monthly for self-pay patients.
Amazon will provide same-day delivery across nearly 3,000 metropolitan areas, with plans to extend coverage to 4,500 locations before year-end. The e-commerce giant disclosed it has distributed GLP-1 medications since 2021, with customers saving over $200 million through automated coupon programs, where GLP-1 treatments represent the largest savings category.
Wall Street consensus on HIMS currently stands at Moderate Buy, based on four Buy ratings and 10 Hold ratings issued during the past three months. The mean price target of $26.36 suggests potential upside of approximately 36% from present trading levels.

Oil price surges towards $100 as Middle East ceasefire begins to unravel

Bitcoin Price Due ‘New Upwards Leg’ Toward $80,000, Says Trader

Nicole Kidman Gets Advice From Actor About Dating Again


-

 NewsBeat7 days ago
Steven Gerrard disagrees with Gary Neville over ‘shock’ Chelsea and Arsenal claim | Football
-

 Business7 days ago
No Jackpot Winner and $194 Million Prize Rolls Over
-

 Fashion6 days ago
Weekend Open Thread: Spanx – Corporette.com
-

 Business5 days ago
Expert Picks for Every Need
-

 Business4 days ago
Three Gulf funds agree to back Paramount’s $81 billion takeover of Warner, WSJ reports
-

 Sports5 days ago
India men’s 4x400m and mixed 4x100m relay teams register big progress | Other Sports News
-

 Tech2 days ago
How Long Can You Drive With Expired Registration? What Florida Law Says
-
Business4 days ago
No Jackpot Winner, Prize to Climb to $231 Million
-

 Fashion3 days ago
Massimo Dutti Offers Inspiration for Your Summer Mood Board
-

 Fashion2 days ago
Let’s Discuss: DEI in 2026
-
Politics6 days ago
Wings Over Scotland | The quality of mercy
-

 Business5 days ago
Akebia Therapeutics, Inc. (AKBA) Discusses Pipeline Progress and Strategic Focus on Kidney Disease Treatments at R&D Day – Slideshow
-

 Fashion7 days ago
Statement Sunglasses: The Accessory Shaping Modern Fashion
-

 Crypto World1 day ago
Bitcoin recovers as US and Iran Agree a Ceasefire Deal
-

 Politics7 days ago
East Jerusalem Palestinian families eviction orders
-

 Fashion7 days ago
For Love & Lemons’ Spring 2026 Line is for the Romantics
-

 Politics6 days ago
Why so many children are now classified as ‘disabled’
-

 Fashion7 days ago
Coffee Break: Santa Croce Tote
-

 Politics6 days ago
Nuclear rockets, moon bases and NASA’s Mars plan
-

 Tech6 days ago
The Threadless Ball Screw Never Took Off, But Don’t Write It Off
You must be logged in to post a comment Login