
Crypto World
Ethereum $159B Stablecoin Dominance: Why Infrastructure Beats Price
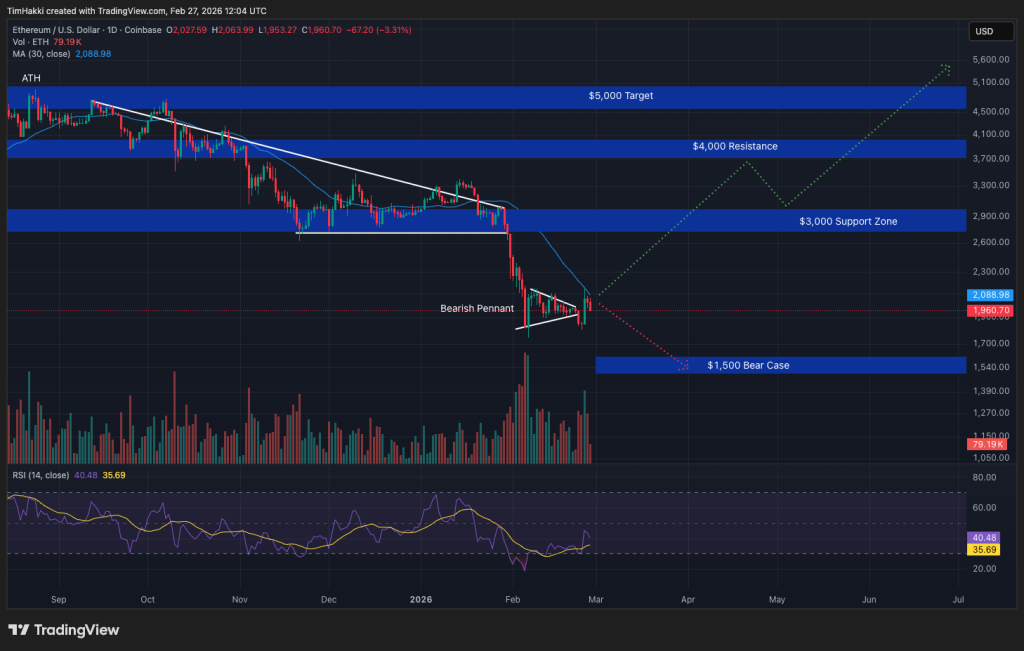
Ethereum (ETH) price action is stalling near $2,000, but the on-chain reality of its stablecoin advantage tells a radically different story.
The network now commands over 53%, or $159 billion, of the $300 billion stablecoin market, cementing its status as the settlement layer for Institutional Crypto.
So, while the ETH price chart usually looks flat nowadays, the infrastructure moat is arguably deeper than ever.
Key Takeaways
- The Stat: Ethereum holds $153.41 billion in Stablecoins, controlling nearly 60% of the global supply.
- The Argument: Jeff Housenbold views ETH as vertical infrastructure for fintech, distinct from day-to-day asset pricing.
- The Tension: Price lags infrastructure utility, creating a disconnect between value settled and token valuation.
The $159B Stablecoin Moat: Why Institutions Stick with Ethereum
Jeff Housenbold is betting on infrastructure. The President and CEO of Beast Industries (the company behind the viral MrBeast brand) recently termed Ethereum the “backbone” of the stablecoin industry in an interview with CNBC.
That assessment aligns with hard data. As of today, Ethereum hosts $159 billion of the market’s total $300 billion stablecoin supply.
This dominance persists because, arguably, institutional crypto use cases value settlement finality over speed.
While Beast Industries expands its fintech footprint following the acquisition of Step, a financial literacy app with 1.45 million users, the focus remains on where the deepest liquidity lives.
Housenbold’s firm, which also oversees a $200 million investment from Bitmine, isn’t chasing pump-and-dump mechanics. They are looking at the rails moving $10.3 trillion in monthly transfer volume.
That volume matters. While price continues trading sideways, Wall Street institutions are eyeing Ethereum. The 2024 GENIUS Act provided regulatory clarity for stablecoin issuers, but it was Ethereum’s existent liquidity that captured the institutional share.
The sheer market share of USDT ($183 billion) and USDC ($75 billion) on the network creates a self-reinforcing loop. Institutions mint where the liquidity is deepest. That lock-in effect is why the supply on Ethereum’s headstart on the stablecoin sector will be a tough challenge for rivals like Ripple to navigate.
Discover: The best crypto to diversify your portfolio with
Solana and Base: The Retail Volume Shift
While Ethereum holds the collateral, retail users are transacting elsewhere. That is the clear signal from recent Stablecoins flow data.
Solana’s stablecoin supply surged 40% in late 2025, outpacing Ethereum’s percentage growth, according to BitWise research analyst Danny Nelson. Traders chasing speed and low fees have migrated, driving Solana to 2.3 million daily active users compared to Ethereum’s 709,000.
Base, Coinbase’s Ethereum Layer 2, processed $5.3 trillion in January 2026 Circle (USDC) transfers despite holding a fraction of the supply found on mainnet.
This points to a high velocity of money on Layer 2, i.e., tokens moving fast in small amounts, versus the stagnant, high-value collateral sitting on Ethereum.
Stablecoin transfer volume across EVM, Solana, and Tron reached $10.3T in Jan ’26.
While Ethereum holds the supply, velocity is moving to L2s and Solana.
— CryptoNews Analyst (@CryptoNews) February 12, 2026
Circle is a primary beneficiary of this multi-chain expansion. The issuer recently saw revenue surges as USDC proliferates across high-speed chains.
However, for Ethereum, the loss of retail transaction dominance hasn’t eroded its reserve status. It has simply specialized: Ethereum is the savings account; Solana and Base are the checking accounts.
Beyond the Stablecoin Advantage, Is $2,000 the Floor for Ethereum?
Ethereum is trading at $1,960. The price has compressed into a tight range, lagging behind the broader market rally. The $2,000 level is now the critical psychological and technical pivot that will help ETH consolidate its current ground and go up to the next leg.

Losing this support level could put Ethereum in freefall, which may not break until $1,500, effectively invalidating all gains since the post-FTX 2021/2022 crash.
Supply dynamics favored a move higher. 31% of the total ETH supply is now staked, removing over 10 million coins from circulation since 2024.
That supply shock is latent energy. Standard Chartered sees this leading to $7,500 by year-end, but the market needs a catalyst to ignite it.
For now, momentum indicators are neutral. The RSI is sitting at 41, indicating indecision. The market is waiting for institutional capital to deploy the stablecoin dry powder sitting on Ethereum’s network. Until that capital rotates from stablecoins into risk assets, ETH remains in a consolidation phase.
Discover: The best new crypto to buy now
The post Ethereum $159B Stablecoin Dominance: Why Infrastructure Beats Price appeared first on Cryptonews.


Strait interference creates issues with supply
The Strait of Hormuz manages a significant portion of the world oil exports and its blockage has strained the economies relying on imports. As a result, India is in danger because of its dependence on the crude and gas flows via this path. Nevertheless, officials assured that there are no delays in the delivery of fuel shipment, such as that of the United States and Russia.
The Iranian President, Masoud Pezeshkian, encouraged India to take the independent position and apply it to contribute to the diplomatic processes and minimise the tensions. He has noted the role of India as a neutral voice that can have an impact in the conversation between the two. In addition, Tehran sees the current stand of India in global groupings as an avenue to promote de-escalation. In turn, Narendra Modi repeated the emphasis on the stability in the region and the safety of the critical infrastructure. Another point he made was the importance of maintaining open international shipping routes in order to sustain uninterrupted trade. In addition, India recognized Iranian cooperation in making sure that Indian nationals in the region are safe.
The Strait situation was put under further strain with the US President Donald Trump threatening to close the Strait unless Iran opened it within a specified period. Iran reacted with powerful words and this could indicate that retaliations will be taken in case its infrastructure was further assaulted. As a result, the trade has heightened the worry over greater regional instability. Prices of world oil have soared due to the tension that has been experienced and the markets have responded to the supply risks associated with the Strait. Therefore the Indian import bill can go up and this would create a strain on the inflationary pressure and duty of fuel in India. Analysts remark that the disruptions partially alleviated would stabilize the prices and the supply conditions would improve.
Contingency measures are examined by the government
The Indian officials were looking through contingency plans to deal with disruptions in supplies and keep a sufficient fuel supply. Besides, the authorities evaluated other sourcing options to minimize reliance on one route. These measures are intended to provide stability at home markets in the external uncertainty.

TLDR:
- Terafab will produce two chip types; one for Tesla and Optimus, and a space-hardened D3 variant for orbit.
- Solar panels in space run five times more efficiently, making orbital AI cheaper to operate than ground-based systems.
- A lunar electromagnetic mass driver could slash payload launch costs from $1,200 per pound to just dollars in electricity.
- One entity now controls the rockets, chips, robots, and satellites needed to build an off-planet AI supply chain.
Terafab, a semiconductor facility developed by Tesla, SpaceX, and xAI, has officially broken ground. Elon Musk unveiled the project Saturday night at a decommissioned power plant in Austin, Texas.
The facility targets one terawatt of AI compute annually, roughly double the total electricity capacity of the United States.
Around 80% of its chip output is set for space deployment. Musk framed the effort as the start of what he called a galactic civilization.
Terafab’s Chip Strategy and Space-Bound AI Infrastructure
Terafab will produce two distinct types of chips. One type supports Optimus robots and Tesla vehicles. The other, designated D3, is hardened specifically for space.
Most of the facility’s output, roughly 80%, is directed toward orbital deployment. The remainder supports ground-based AI applications and consumer devices.
Musk expects Optimus robot production to reach 10 to 100 times the volume of car manufacturing. That points to billions of chips being produced annually.
The scale makes Terafab central to both commercial and space operations. No existing facility currently targets this combined level of output.
Musk told the Austin audience that solar panels in space operate five times more efficiently than on Earth. Milk Road AI reported this as a central part of its cost argument for orbital AI.
Space also provides uninterrupted sunlight, unlike ground-based installations. Over time, this positions orbital AI as cheaper to run than terrestrial alternatives.
Near-term chip output from Terafab is directed toward a data center under construction in Virginia. That facility serves as the initial hub before full orbital deployment begins.
It connects ground-level production to the broader space strategy. From there, the roadmap extends outward toward the moon.
Lunar Mass Driver and the Road to a Petawatt
Beyond the terawatt lies a petawatt target, one thousand times more powerful. Musk argued that reaching it requires moving manufacturing off-planet.
The moon, with its low gravity and no atmosphere, becomes the logical production site. A lunar base forms the next stage of the infrastructure plan.
Rather than rockets, the plan calls for an electromagnetic mass driver on the lunar surface. This magnetic cannon would launch AI satellites directly into deep space.
A Falcon rocket currently costs around $1,200 per pound of payload. A lunar mass driver could reduce that figure to just dollars per pound in electricity.
Milk Road AI described this as potentially the single biggest reduction in the cost of intelligence in human history, with the caveat that it must first work.
That qualifier is worth noting. No mass driver of this scale has been built or tested. The engineering challenges ahead remain unresolved.
Musk stated his goal to complete the lunar infrastructure within his own lifetime. Terafab has already broken ground, and the D3 chips are currently in design.
The race to place AI infrastructure in space has formally started. One entity now controls the rockets, the robots, the chips, and the satellites required to pursue it.

TLDR:
- Ethereum whales near breakeven signal reduced aggressive selling and late-stage accumulation.
- ETH price on the 4H chart shows an early downtrend with lower highs and key support zones.
- MACD and RSI indicators confirm weakening momentum and potential for further downside.
- Liquidity clusters above and below the current price suggest volatility expansion is imminent.
Ethereum whale unrealized profit ratio has dropped near zero, placing major holders at breakeven or loss. This aligns with weakening short-term price action and tightening liquidity zones, setting the stage for a decisive market move.
Whale Profitability and Market Structure
Ethereum whale unrealized profit ratio shows major holders of 100,000 ETH or more approaching breakeven or unrealized losses. Historically, such readings appear during late-stage bear markets or deep accumulation phases.
Past cycles provide context. Between 2018 and 2019, whale profit ratios dipped toward zero before the post-ICO market bottom stabilized. A similar pattern occurred in 2020 before a strong upward expansion.
Large holders typically have long-term strategies and superior market insight. Their positions reflect structural market conditions rather than short-term sentiment.
Unrealized losses at this scale indicate broad market compression and potential accumulation. Selling pressure often reduces under these conditions.
Whales generally avoid realizing losses unless forced by liquidity constraints, which can stabilize downside momentum. At the same time, accumulation tends to increase quietly.
Large holders often average down or reposition strategically during these periods. Retail sentiment contrasts with this behavior.
As price stagnates or decline, retail participants often panic. In contrast, whales being underwater suggests the market’s strongest participants are experiencing losses, which can indicate a closer proximity to the bottom ranges.
Price Action, Momentum, and Liquidity Zones
Ethereum’s 4-hour chart shows short-term momentum weakening after a peak near $2,300–$2,400. Price has entered a corrective phase with lower highs and mild lower lows, typical of early downtrend structure.
Current price levels around $2,080 sit near a horizontal support zone that previously acted as a consolidation base. Momentum indicators confirm weakness: MACD shows expanding bearish signals, while RSI near 35–40 suggests room for further downside before oversold conditions emerge.
Liquidity clusters define the next potential moves. A dense short liquidation zone exists between $2,180 and $2,220, while a strong long liquidation pool lies near $2,050–$2,100.
Price is currently trapped between these levels, creating a “liquidity sandwich” that often precedes volatility expansion.
Social media commentary reflects this tension: “Price is stuck between two liquidation magnets. One side will be cleared before expansion.” The market is range-bound, awaiting a catalyst.
A downside sweep appears slightly more likely due to recent bearish momentum, which could clear long positions before a potential relief bounce.
Whale positioning adds further insight. If large holders defend current support, the market may stabilize. Otherwise, ETH may search for deeper value before any recovery occurs.
Overall, the market is in a transitional phase with structural weakness balanced by potential accumulation.
TLDR:
- Strategy now holds 761,068 BTC valued at $52.36B amid ongoing purchases.
- Average acquisition cost for holdings stands at $75,696 per bitcoin.
- Moderate leverage and $38B derivatives exposure support the accumulation strategy.
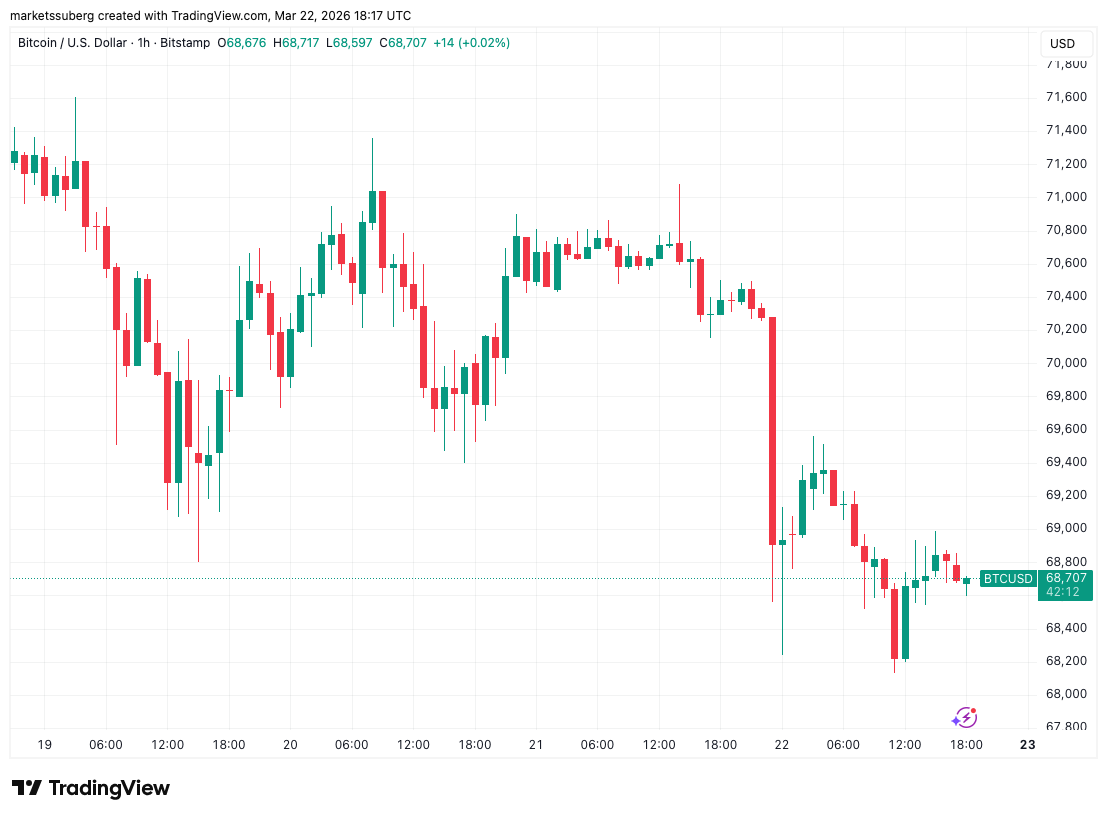
- Bitcoin consolidates near 68.7K after the recent 75–76K peak, showing a short-term pullback.
Michael Saylor’s Bitcoin accumulation continues as Strategy scales its treasury beyond 761,000 BTC. The approach combines moderate leverage, active market participation, and long-term capital allocation in bitcoin despite ongoing price volatility.
Strategy’s Growing Bitcoin Holdings and Market Engagement
Michael Saylor continues to expand Strategy’s corporate bitcoin holdings, posting on X on March 22, 2026, with his signature orange dot chart illustrating ongoing accumulation.
The chart visually tracks the company’s treasury growth despite market swings. A recent purchase of 22,337 BTC increased total holdings to 761,068 BTC, with a current valuation of $52.36 billion and an average acquisition cost of $75,696 per coin.
This reinforces the scale of corporate bitcoin adoption and the long-term focus of Strategy’s capital allocation.
Equity metrics show MSTR trading at $135.66, with a market capitalization of $46.814 billion and an enterprise value of $62.766 billion.
Trading volume reached $3.82 billion, and the 30-day average stood at $2.846 billion. These figures demonstrate active market participation alongside the accumulation strategy.
Leverage, Volatility, and Bitcoin Market Trends
Strategy uses moderate leverage, holding $8.254 billion in total debt alongside $2.25 billion in cash. Net leverage is 11%, indicating a controlled approach while supporting continued bitcoin purchases.
Open interest in derivatives totals $38.137 billion, and implied volatility is 55%, with historical volatility at 74%, reflecting significant market swings.
The bitcoin market currently shows a short-term pullback. Price peaked near 75–76K before consolidating around the 68.7K support region. Momentum indicators such as the MACD are negative, and the RSI hovers in the high-30s, approaching oversold levels.
This suggests sellers dominate the short-term market, while volume patterns indicate limited panic selling.
Key support levels include 68K, with further support near 66–64K, and resistance levels at 70–71K. Tweets from Strategy’s official account continue to emphasize the “Orange March,” signaling that accumulation is ongoing, and institutional confidence remains elevated.
Crypto World
XRP Price Prediction: Pepeto Races XRP Toward 150x as the Binance Listing Draws Near While Solana Signals Recovery
Goldman Sachs became the largest buyer of XRP ETF shares this quarter, and the SEC classified XRP as a digital commodity on March 17, ending years of legal confusion from the Ripple lawsuit.
Amid this development, Pepeto, an exchange presale from the cofounder who built the original Pepe coin to $11 billion, is pulling in wallets that track institutional flows before they reach the headlines. While the xrp price prediction hints at $4, 150x projections around Pepeto turn that target into a race between both entries.
XRP Price Prediction Turns Bullish After SEC Commodity Classification and $1.39 Billion in ETF Inflows
The SEC and CFTC jointly classified XRP as a digital commodity on March 17, placing it alongside Bitcoin and Ethereum under CFTC oversight, according to Phemex.
Spot XRP ETFs have pulled in $1.39 billion with 772 million tokens locked in custody, and Goldman Sachs emerged as the largest institutional buyer, according to Yahoo Finance.
The classification removes the legal overhang from 2020, but from $1.39 the xrp price prediction still measures returns in small multiples over years.
XRP Price Prediction and the Presale That Could Outperform
Pepeto: The Best Opportunity Of 2026
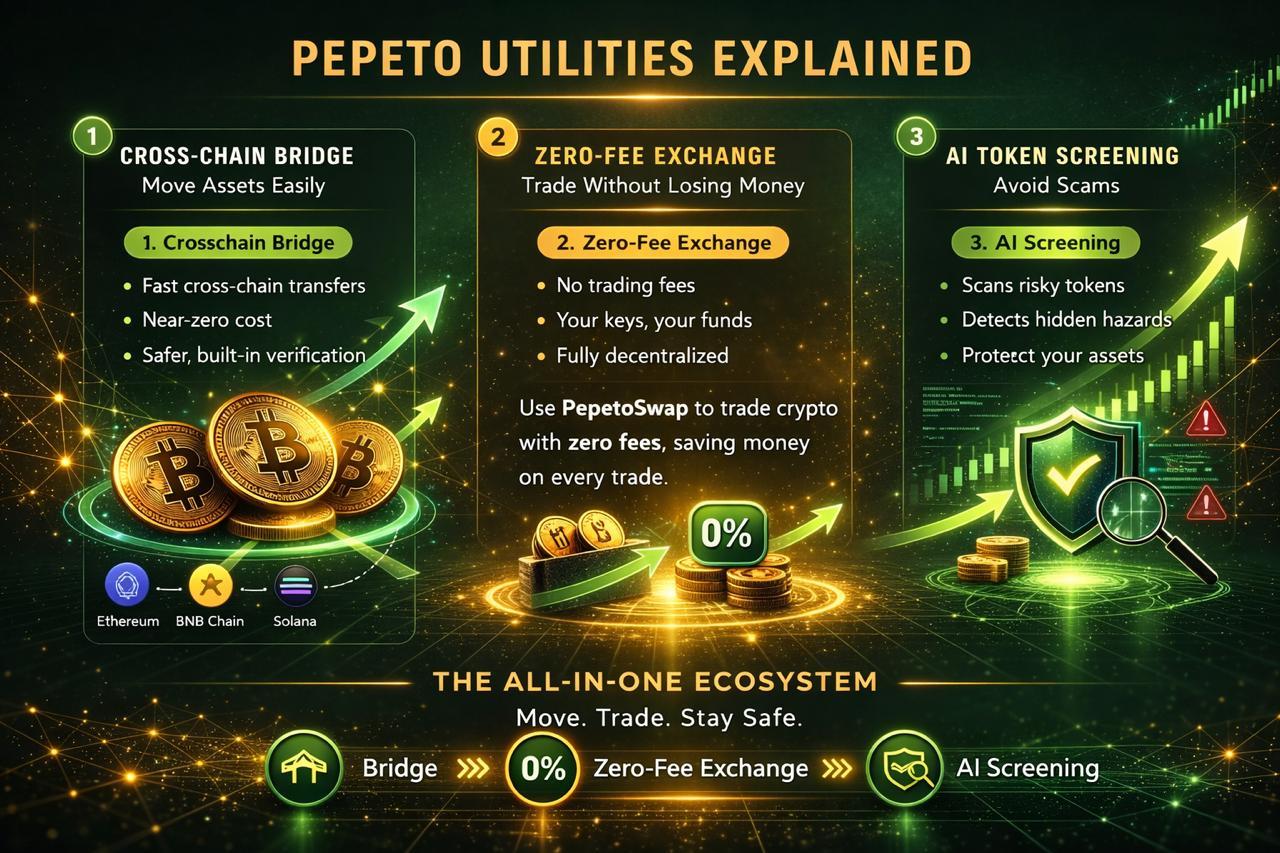
Most traders hear about a token only after it already printed 10x, 100x, or even 1000x in gains. Pepeto is the exchange being built to make sure you are positioned before the move, not reading about it after.
The platform is a complete trading hub designed to protect your capital. You can scan contracts for hidden risks before your wallet connects and stay ahead with tools that flag danger before a single dollar moves. For traders who lose money to scams, bad contracts, and hidden fees, this changes everything.

At the core of the exchange are three products that bring the system to life. PepetoSwap runs zero fee trades so your capital works for you instead of paying the platform. The risk scorer examines every contract for traps and scam code, giving you a clear answer in seconds so you never fall for a bad project again.
The presale has raised more than $8 million with the Binance listing approaching, and the cross chain bridge moves tokens between networks at zero cost. The cofounder who built Pepe to $11 billion with the same 420 trillion supply and zero products is now building an exchange. A SolidProof audit verified every contract, a former Binance expert is on the dev team, and 195% APY staking compounds in wallets that committed while others watched.
Pepe reached $11 billion with nothing. Matching that from the current presale entry of $0.000000186 is over 150x, and Pepeto has the exchange infrastructure Pepe never built. The wallets entering now are building the positions the xrp price prediction takes years to match.
XRP Price Prediction: Can XRP Reach $4 After the SEC Clears the Legal Path?
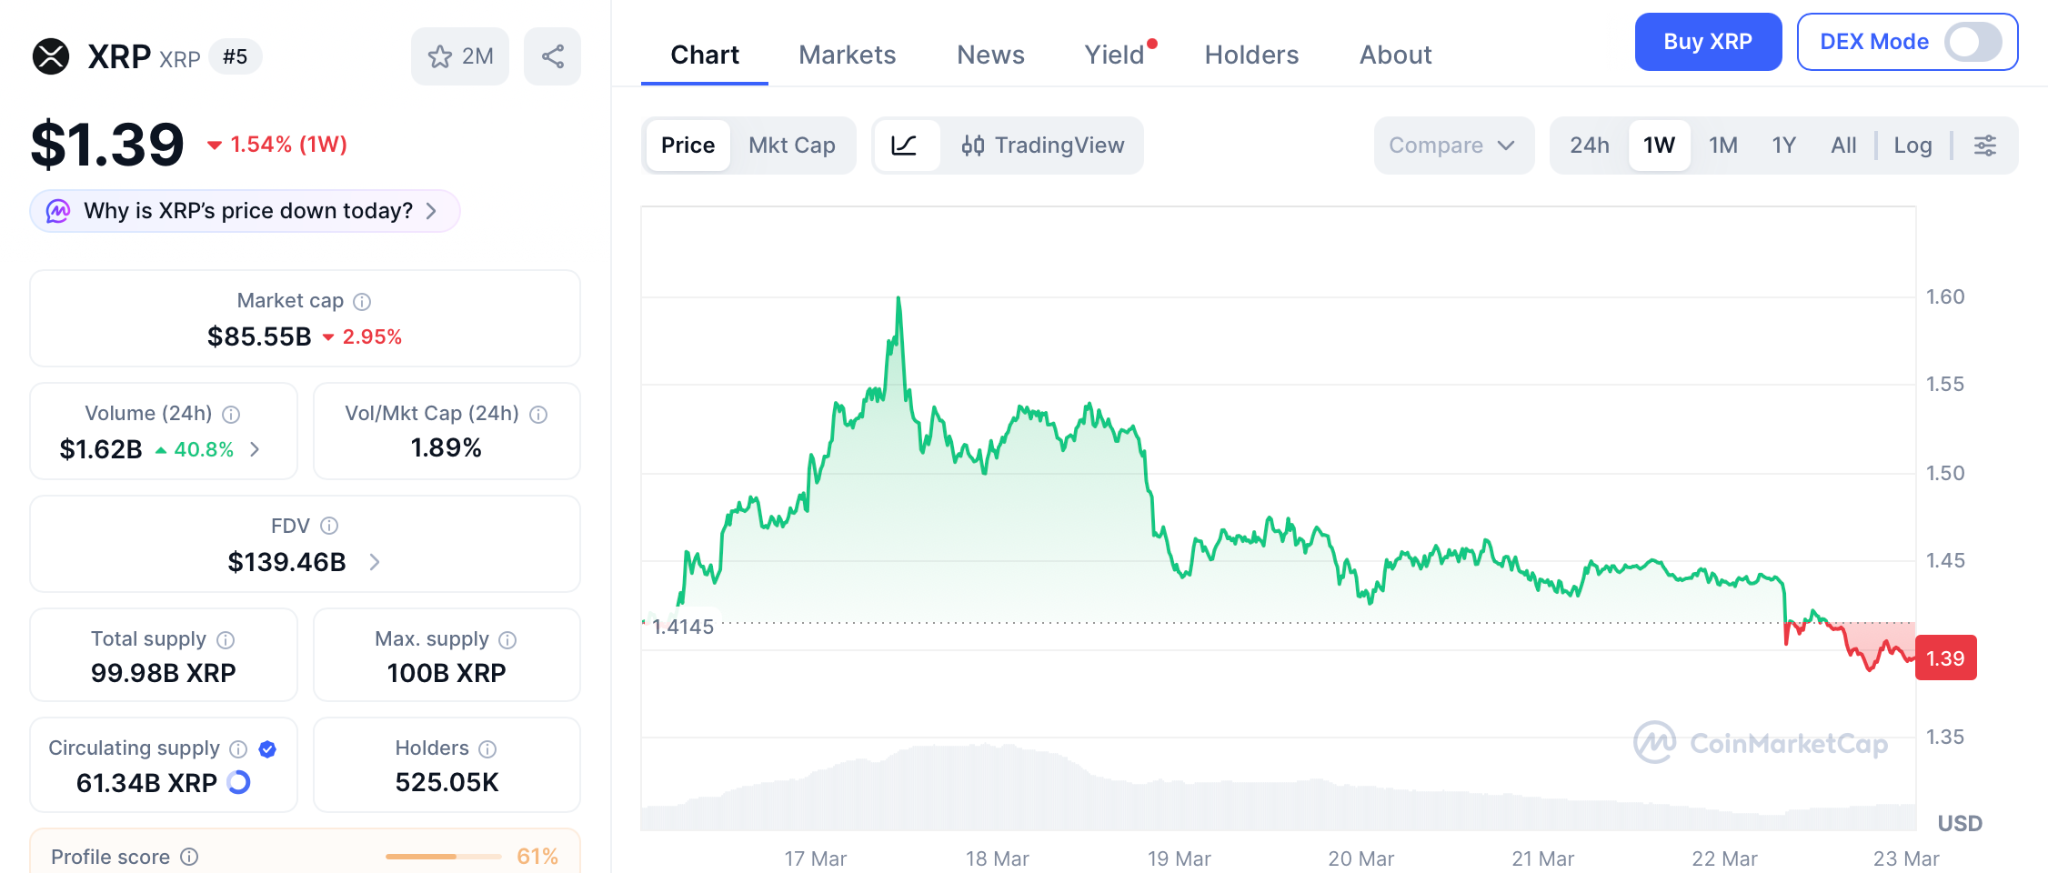
XRP trades near $1.39 as of March 22, up from $1.20 after the commodity classification removed the legal cloud, according to CoinMarketCap.
Analyst Ali Martinez identified a breakout zone and said clearing it could send XRP toward $4, according to TradingView.
More bullish forecasts place XRP at $5 to $6 by year end. But even the aggressive $6 target is a 4x return requiring the full cycle. The xrp price prediction delivers real returns over long timelines, not the 150x a presale to Binance listing compresses into the moment trading begins.
Solana
SOL trades near $87 as of March 22, down 75% from its cycle high above $260, according to CoinMarketCap.
An ascending trendline has provided support, and $100 is possible if it holds. But from $87, a 3x requires a recovery that could take quarters. SOL is signaling recovery, not delivering the entry that changes a portfolio.
Conclusion
The xrp price prediction is real, the commodity classification adds weight, and ETF inflows confirm the direction. But to grab the biggest returns from this shift, a portfolio needs an early entry that delivers multiples a large cap at $1.44 is too established to produce.
The Binance listing compresses that return window into days, and the wallets entering today at presale pricing are building the positions the rest of the market will spend this cycle wishing they had. The Pepeto official website is where the investors who see how rare this setup is are locking in their entries right now.
The xrp price prediction says $4. The Pepeto presale math says 150x, choose which distance defines your cycle.
Click To Visit Pepeto Website To Enter The Presale

FAQs
What is the xrp price prediction for 2026?
Analyst Ali Martinez forecasts XRP could reach $4, with bullish targets at $5 to $6. Pepeto at presale pricing targets over 150x to a market cap the same cofounder already achieved.
Can XRP reach $10 before Pepeto reaches the same level?
XRP at $10 is a 7x move analysts place in 2029 or 2030. Pepeto carries the same supply that took Pepe to $11 billion, making the distance much shorter.
Is Pepeto a better entry than the xrp price prediction right now?
The Pepeto official website offers a presale where matching Pepe’s market cap is over 150x, something the xrp price prediction from $1.39 cannot produce this cycle.
Disclaimer: This is a Press Release provided by a third party who is responsible for the content. Please conduct your own research before taking any action based on the content.
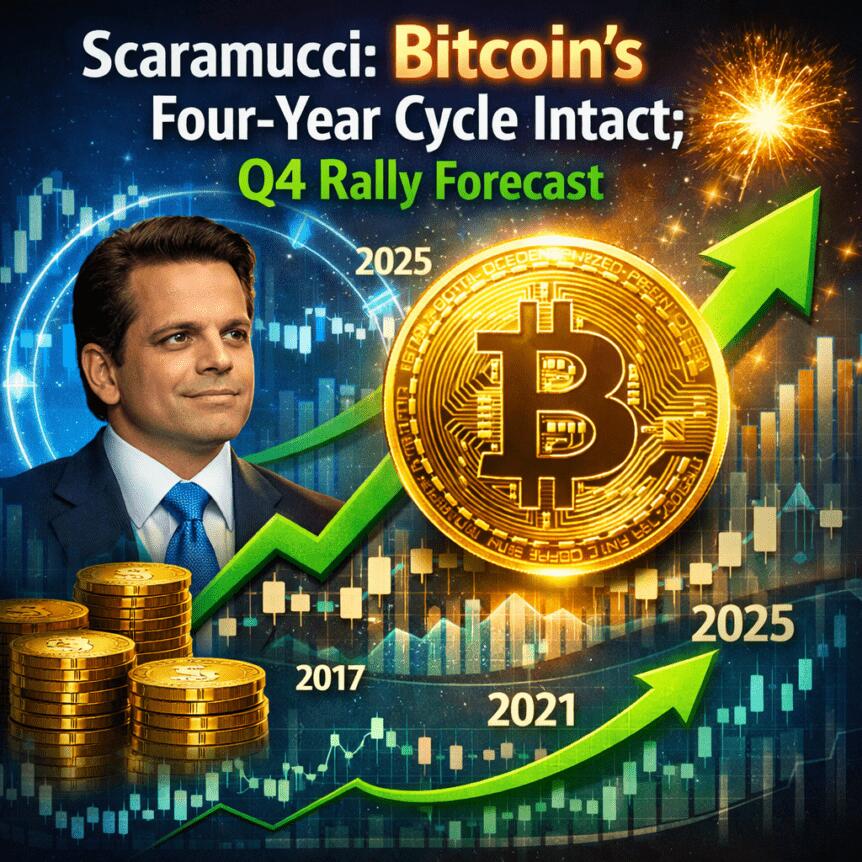
Bitcoin’s bear market has been framed by a familiar prism: the traditional four-year cycle. Yet proponents argue that institutional demand, particularly via BTC-focused exchange-traded funds, has muted volatility and may shape the path of prices through the next cycle. In a recent discussion, Anthony Scaramucci, managing partner of SkyBridge, suggested that while the cycle remains visible, its dynamics have been altered by new liquidity channels and changing market participation.
Speaking with Scott Melker on The Wolf of All Streets podcast, Scaramucci described the four-year pattern as “muted” by ETF inflows that have helped cushion sharp swings. “We’re in a four-year cycle, and there were some traditional whales, some OGs, that believe in the four-year cycle, and guess what happens in life when you believe in something? You create a self-fulfilling prophecy,” he said. The implication is that market psychology and the presence of ETFs have tempered the classic boom-bust rhythm that many investors associate with BTC.
Looking ahead, Scaramucci warned that BTC is likely to remain choppy for most of the year, with a renewed bull market emerging in the fourth quarter of 2026. He noted that the broader market narrative at the time had shifted away from a straightforward ascent toward a more nuanced trajectory, where macro and policy factors would matter just as much as on-chain signals.
The conversation also touched on the expectations that had circulated in late 2024 and early 2025. Market participants, including Scaramucci, had anticipated BTC could surge toward around $150,000 in 2025, driven by broad political momentum and regulatory openness in the United States. That consensus was upended by a sharp October downturn that pulled BTC from a prior peak to a much lower range, underscoring how quickly sentiment can swing in crypto markets.
History has repeatedly shown that price movements often defy prevailing sentiment. Scaramucci pointed to the early 2023 period, when BTC’s price action moved contrary to bright-eyed forecasts in the wake of the FTX collapse in November 2022. After a period of disinterest and malaise, the market reversed into a new upcycle, illustrating how catalysts can reset the mood even when the broader narrative appears unfavorable.
Key takeaways
- The four-year cycle remains a reference framework for BTC, but ETF inflows have muted its volatility and potentially altered how the cycle plays out.
- BTC is expected to experience choppy trading through much of this year, with the next major leg higher anticipated in the fourth quarter of 2026.
- Market expectations for a 2025 surge to around $150,000 were fueled by pro-crypto policy signals and regulatory warming, but an October crash shattered that consensus.
- Historical reactions show BTC can rebound after episodes of apathy or negative catalysts, reinforcing the idea that macro shocks and sentiment swings remain powerful drivers.
- Geopolitical developments and stock-market dynamics can influence BTC through correlations with risk assets, underscoring the need to monitor macro risk sentiment alongside on-chain activity.
The cycle, ETFs, and the evolving market backdrop
In the eyes of Scaramucci, the presence of BTC-focused exchange-traded funds has changed the game. ETFs offer a new, regulated channel through which institutional players can gain exposure, potentially dampening sharp drawdowns and tempering the kind of volatile spikes that once defined BTC cycles. This shift does not erase the cycle’s specter, but it reframes it—turning a potentially binary up- or down-market into a more nuanced, information-rich environment in which policy signals and fund flows matter as much as supply-demand fundamentals.
That framing sits alongside long-standing debates within the crypto industry about whether the four-year cycle remains intact. While some observers point to deviations in late 2025 or 2026, others, including Scaramucci, argue that the cycle still offers a useful heuristic for investors trying to gauge risk, duration, and potential turning points. The market’s sensitivity to events such as regulatory announcements, ETF inflows, or major macro shocks continues to complicate any simple forecast.
From peak to pause: how catalysts have shifted the narrative
The historical arc cited by Scaramucci stretches from BTC’s all-time run toward lofty levels to the subsequent retrenchment that has colored investor psychology for years. The narrative notes that BTC once traded near the upper stratosphere—around a $126,000 range in prior cycles—before the October pullback. From there, the price retraced to the $60,000 area, highlighting how quickly sentiment can reverse and the importance of liquidity and risk appetite in determining the price path.
Beyond these cycles, the market’s reaction to external shocks—such as the FTX collapse in late 2022—has underscored a pattern: even after periods of disillusionment, bitcoin has demonstrated resilience, often resuming an uptrend when investor interest returns and liquidity improves. The early months of 2023, in particular, showed that upside moves can unfold despite a broader backdrop of skepticism or unfavorable headlines.
Another facet of the discussion centers on whether 2025 and 2026 would deliver a fresh bull phase. While the consensus among several participants had anticipated a robust climb in 2025, the trajectory was interrupted by the October downturn and broader risk-off dynamics. The question remains whether the market will reassert its longer-term cycle or whether a new regime—shaped by macro policy, regulatory clarity, and global liquidity—will redefine BTC’s pace and scale.
Geopolitics, risk sentiment, and BTC’s market correlations
Macro shocks have always tested BTC’s claimed role as a hedge or diversifier. The recent wave of geopolitical tension and global risk-off periods have at times coincided with renewed pressure on risk assets, and BTC has not been immune. In the most recent turn, BTC dipped below a key psychological level in the wake of intensifying geopolitical events. At the same time, traditional stock indices have faced renewed selling pressure; the S&P 500 fell around 1.3% as the week closed, dipping below a widely watched moving average and highlighting a possible shift in the correlation between BTC and mainstream markets.
Analysts have warned that if BTC continues to exhibit a sustained positive correlation with equities, its downside could be more pronounced in risk-off environments—potentially amplifying losses in a scenario where macro catalysts favor traditional assets. Yet the crypto market has shown episodic decoupling at different points in history, illustrating that the relationship is not fixed and can diverge as new liquidity channels and market participants come into play.
The ongoing debate about Bitcoin’s cycle, and whether it remains a reliable compass for pricing, continues to draw attention from investors and researchers. Some industry voices argue that structural shifts—such as increasing institutional participation, evolving derivatives markets, and tighter regulation—could render the old four-year narrative less predictive than it once was. Others maintain that the cycle still captures a collective behavior pattern—cyclical expectations that influence trading and risk management, even if the visible price path changes in response to external shocks.
For readers seeking a synthesis, it’s not simply a question of whether the cycle endures, but how its cues interact with a broader market fabric that includes policy developments, ETF demand, and macro risk appetite. The interplay among these factors will likely determine how BTC navigates the remainder of this decade.
Longer-form reflections on the cycle’s fate have appeared in industry circles, including discussions in crypto-focused media that weigh the structural shifts against historical precedent. The tension between a legacy four-year rhythm and new market realities remains a core theme for traders and builders alike, as they assess timing, risk controls, and capitalization strategies in a landscape defined by rapid change and evolving incentives.
As the community weighs these signals, investors should stay alert to ETF flow data, central-bank signals, and regulatory developments that could reshape the calculus of risk and reward. The next few quarters will be telling in terms of whether BTC can establish a fresh breakout or whether the cycle will again be interrupted by macro or policy-driven shocks.
Looking ahead, observers will be watching how the market absorbs geopolitical risks, how the S&P 500 and other risk assets respond to policy news, and how BTC trades as liquidity conditions shift. The implications extend beyond price alone: they touch on institutional adoption, derivative markets, and the broader narrative around crypto’s role in diversified portfolios.
For now, the path remains uncertain but informed by a set of recognizable patterns and new inflows. The pace of ETF participation, the resilience of risk sentiment, and the cadence of regulatory clarity will help determine whether BTC’s next major leg higher lies in late 2026 or in a broader, more gradual re-acceleration beyond that horizon.
Readers should watch for how ETF allocations evolve and whether macro catalysts—such as policy shifts or geopolitical developments—alter the balance of risk and return in the coming months. The question of whether Bitcoin’s four-year rhythm endures or evolves is unlikely to be settled in the near term, but the signals from fund flows, price action, and policy readiness will continue to shape market expectations.


As platforms such as Polymarket gain mainstream visibility during U.S. election cycles and major geopolitical events, their prices are increasingly cited as real-time signals of truth. The pitch is seductive: let people put money behind beliefs, and the market will converge on reality faster than polls or pundits. But that promise collapses when a contract creates a financial incentive for someone to change the very outcome it claims to measure.
The problem is not volatility. It is design.
When a forecast becomes a plan
The most extreme example is the assassination market, a contract that pays if a named individual dies by a certain date. Most major platforms do not list anything so explicit. They do not have to. The vulnerability does not require a literal bounty.
It only requires an outcome that a single actor can realistically influence.
Consider a sports-adjacent case: a prop market on whether there will be a pitch invasion during the Super Bowl. A trader takes a large position on “yes,” then runs onto the field. It is not hypothetical. It has happened. That is not a prediction. It is execution.
The same logic extends well beyond sports. Any market that can be resolved by one person taking one action, filing one document, placing one call, triggering one disruption or staging one stunt embeds an incentive to interfere. The contract becomes a script. The trader becomes the author.
In those cases, the platform is not aggregating dispersed information about the world. It is pricing the cost of manipulating it.
Political and event markets carry a higher risk
This vulnerability is not evenly distributed across the prediction universe. It concentrates on thinly traded, event-based or ambiguously resolved contracts. Political and cultural markets are especially exposed because they often hinge on discrete milestones that can be nudged at relatively low cost.
A rumor can be seeded. A minor official can be pressured. A statement can be staged. A chaotic but contained incident can be manufactured. Even when no one follows through, the mere existence of a payout changes incentives.
Retail traders understand this instinctively. They know a market can be correct for the wrong reasons. If participants begin to suspect that outcomes are being engineered, or that thin liquidity allows whales to push prices for narrative effect, the platform stops being a credibility engine and starts looking like a casino with a news overlay.
Trust erodes quietly, then all at once. No serious capital operates in markets where outcomes can be cheaply forced.
“All markets are manipulable” misses the point
The standard defense is that manipulation exists everywhere. Match fixing happens in sports. Insider trading happens in equities. No market is pure.
That confuses possibility with feasibility.
The real question is whether a single participant can realistically manipulate the outcome they are betting on. In professional sports, results depend on dozens of actors under intense scrutiny. Manipulation is possible but costly and distributed.
In a thin event contract tied to a minor trigger, one determined actor may be enough. If the cost of interference is lower than the potential payout, the platform has created a perverse incentive loop.
Discouraging manipulation is not the same as designing against it.
Sports as a structural template
Sports markets are not morally superior. They are structurally harder to corrupt at the individual level. High visibility, layered governance, and complex multi-actor outcomes raise the cost of forcing a result.
That structure should be the template.
It is product integrity
Prediction platforms that want long-term retail trust and eventual institutional respect need a bright-line rule: do not list markets whose outcomes can be cheaply forced by a single participant, and do not list contracts that function as bounties on harm.
If a contract’s payout can reasonably finance the action required to satisfy it, the design is flawed. If resolution depends on ambiguous or easily staged events, the listing should not exist. Engagement metrics are not a substitute for credibility.
The first scandal will define the category
As prediction markets gain visibility in politics and geopolitics, the risks are no longer abstract. The first credible allegation that a contract was based on non-public information, or that an outcome was directly engineered for profit, will not be treated as an isolated incident. It will be framed as proof that these platforms monetize interference with real-world events.
That framing matters. Institutional allocators will not deploy capital into venues where the informational edge may be classified. Skeptical lawmakers will not parse the difference between open-source signal aggregation and private advantage. They will regulate the category as a whole.
The choice is simple. Either platforms impose listing standards that exclude easily enforceable or easily exploitable contracts, or those standards will be imposed externally.
Prediction markets claim to surface the truth. To do that, they must ensure their contracts measure the world rather than reward those who try to rewrite it.
If they fail to draw that line themselves, someone else will draw it for them.

The current Bitcoin (BTC) bear market can be explained by the four-year cycle and long-term BTC holders selling at the $100,000 psychological level, according to Anthony Scaramucci, managing partner of the SkyBridge investment firm.
Bitcoin’s four-year market cycle has been “muted” by institutional investors and inflows from BTC exchange-traded funds (ETFs) that have cushioned volatility, Scaramucci said, but the altered market dynamics have not fully erased BTC’s traditional cycles. He said:
“We’re in a four-year cycle, and there were some traditional whales, some OG’s, that believe in the four-year cycle, and guess what happens in life when you believe in something? You create a self-fulfilling prophecy.”
BTC will continue to see choppy price action for most of the year, until the fourth quarter of 2026, when prices will start to rise again in a new bull market cycle, he said.

Scaramucci said that market participants, including himself, were widely expecting BTC to climb to $150,000 in 2025, driven by US President Donald Trump’s pro-crypto agenda and US regulators warming up to the digital asset industry.
However, the October market crash, which dragged BTC down from an all-time high of about $126,000 to a low of $60,000, completely shattered the widely held consensus.
Markets often move in opposite ways to the prevailing investor sentiment, Scaramucci said, citing Bitcoin’s price action in the early months of 2023, following the November 2022 collapse of the FTX exchange, as an example.

“It was at a period of great disinterest and great apathy that the bull market started again,” he said, adding that the current BTC bear market is a “garden variety” correction in line with previous downturns.
To be sure, crypto industry executives, analysts, and market participants continue to debate whether Bitcoin’s four-year cycle theory is still valid after BTC ended 2025 in the red or if changing market dynamics have permanently altered how the price of BTC moves.
Related: Bitcoin price aims to hold $70K amid rising inflation concerns
Could Iran war and geopolitical turmoil bring BTC more pain?
The price of BTC fell below $69,000 on Saturday as the war in Iran entered its third week, jolting risk assets across the board.

Stock market investors saw the S&P 500 index extend its decline on Friday, dropping by about 1.3%. A day earlier the gauge closed below its 200-day moving average, a key technical indicator closely watched to assess the overall trend of equities markets, for the first time in 10 months.
Some analysts now forecast a potential 50% drop in BTC’s price in 2026 if it continues to exhibit a positive correlation with the S&P 500 index.
Magazine: The debate over Bitcoin’s four-year cycle is over: Benjamin Cowen
Crypto World
Bitcoin Holds as Gold Nears Bear Market: What the Divergence Says About Capital in 2026
TLDR:
- Gold has fallen nearly 20% from its highs, putting it close to official bear market territory in 2026.
- Bitcoin outperformed gold by roughly 20% since the Iran conflict started, per Whale Factor’s analysis.
- On an M2 liquidity basis, gold is trading near historical peak levels, signaling a long-term caution flag.
- Bitcoin remains in a consolidation range that mirrors pre-breakout patterns observed in previous market cycles.
Bitcoin is holding steady as gold slides toward bear market territory, raising fresh questions among traders. Gold has dropped nearly 20% from its recent peaks, while Bitcoin has held within its consolidation range.
This divergence is playing out against a backdrop of rising oil prices and persistent inflation pressures. The contrast is drawing attention to how capital behaves differently across asset classes during macro stress.
Gold Faces Macro Pressure From Rates and Rising Oil
Gold is now close to a technical bear market, down nearly 20% from its recent highs. This drop has persisted even as geopolitical tensions have remained elevated in recent months.
Higher-for-longer interest rates and rising oil prices have combined to weigh heavily on the metal. The issue appears rooted in macroeconomic conditions rather than in any single geopolitical event.
Crypto analyst CryptosRus pointed directly to macro conditions as the source of gold’s trouble. “Rates are staying higher for longer, and rising oil is pushing inflation expectations back up,” the analyst wrote.
That environment reduces demand for non-yielding assets like gold, as traders adjust their positions accordingly.
The liquidity picture is also working against gold on a longer-term basis. CryptosRus noted that gold, when measured against M2 money supply, is trading near historical peak levels.
That reading serves as a caution signal for investors tracking long-term price cycles. Meanwhile, elevated rates continue to offer competing returns that diminish gold’s relative appeal.
A recent trading session gave a concrete look at gold’s current vulnerabilities. Gold fell 5% as oil hit $100 per barrel and stocks touched new 2026 lows. Despite the risk-off environment, gold failed to draw the safe-haven demand traders typically expect.
Bitcoin Tracks Liquidity While Capital Behavior Shifts
Bitcoin has responded to the same environment in a markedly different manner. The asset has stayed within a consolidation range that resembles patterns seen in past market cycles.
Analysts tracking long-term Bitcoin behavior describe this phase as consistent with pre-breakout consolidation. That pattern, if sustained, could place Bitcoin in a more favorable position as macro conditions evolve.
Whale Factor, a market observer, noted the performance gap on one of gold’s worst recent sessions. “Gold crashed 5% today… Bitcoin? Down 1%,” the account wrote, pointing to the contrast directly. Bitcoin also outperformed gold by roughly 20% since the start of the Iran conflict.
On an M2-adjusted basis, Bitcoin is currently retesting its prior highs without a confirmed breakout. CryptosRus framed this as a liquidity retest, noting that a full breakout has not yet occurred. Still, the current setup mirrors historical patterns that preceded larger moves in prior cycles.
Bitcoin and gold are clearly absorbing the same macro conditions in very different ways. Gold is struggling under rate pressure, while Bitcoin continues to track long-term liquidity. The data, for now, shows Bitcoin holding ground in an environment where gold has not.
Bitcoin (BTC) traded below $69,000 on Sunday as the market faced a critical weekly candle close.
Key points:
-
Bitcoin approaches its 200-week trend line after sinking throughout the weekend.
-
BTC price action leaves traders firmly bearish on the immediate and long-term outlook.
-
A golden cross on the daily chart may provide some relief, analysis says.
Bitcoin returns to “unreliable” support
Data from TradingView showed BTC price action circling a key trend line after a weekend dip to near $68,000.

Bearish momentum entered into Saturday’s daily close and crypto longs suffered. Over $300 million in longs and nearly $100 million in shorts were liquidated in the 24 hours to the time of writing, per data from CoinGlass.

In so doing, BTC/USD set up a fresh showdown around its 200-week exponential moving average (EMA) near $68,300.
As Cointelegraph reported, the 200-week EMA was of major importance in prior BTC price cycles, but has become “unreliable” in 2026 due to failing to offer support.
Last week, trader and analyst Rekt Capital said that price should retest the 200-week trend line as support from above in order for it to provide the foundation for upside continuation.
“More, there’s also a chance that Bitcoin could simply meander in and around the 200-week EMA for a while, never really turning it into convincing resistance, never really turning it into convincing support, before ultimately breaking down into additional Macro Downside over time anyway,” he noted on X.

Others also retained bearish predictions, including trader Roman, who reiterated his $50,000 target.
“There are still 0 signs of bear market exhaustion on HTF. No divs, no bear PA exhaustion, no momentum loss, etc,” he told X followers on Sunday, referring to higher time frames.
“I still have high confidence in seeing 50k and likely a bit lower.”

BTC price “range game continues”
A potential silver lining on the day came from a “golden cross” involving two other moving averages.
Related: Bitcoin RSI signals potential bottom as analysts flag key setup
Here, the 21-day simple moving average (SMA) crossed over its 50-day equivalent, signalling stronger recent price momentum.

Commenting, Keith Alan, cofounder of trading resource Material Indicators, was cautiously optimistic.
“The Golden Cross will likely deliver some short term bullish momentum. Must watch to see if it develops into something durable,” he acknowledged in an X post.
“For now…the range game continues.”

Earlier in March, the BTC/USD chart produced two “death crosses,” a structure that typically implies more downside pressure to come. These in turn sparked warnings of a collapse below $40,000.
This article does not contain investment advice or recommendations. Every investment and trading move involves risk, and readers should conduct their own research when making a decision. While we strive to provide accurate and timely information, Cointelegraph does not guarantee the accuracy, completeness, or reliability of any information in this article. This article may contain forward-looking statements that are subject to risks and uncertainties. Cointelegraph will not be liable for any loss or damage arising from your reliance on this information.

The New Financial Order

Arsenal 0-2 Man City: Nico O’Reilly’s fairytale continues after Wembley double

Modi Reviews Energy Risks as Iran Urges India to Arbitrate Conflict


-

 Tech7 days ago
Your Legally Registered ‘Motorcycle’ Might Not Count Under Proposed US Law
-

 Fashion2 days ago
Weekend Open Thread: Adidas – Corporette.com
-

 Politics2 days ago
Jenni Murray, Long-Serving Woman’s Hour Presenter, Dies Aged 75
-
 Tech5 days ago
Are Split Spacebars the Next Big Gaming Keyboard Trend?
-

 Crypto World22 hours ago
Best Crypto to Buy Now: Strategy Just Spent $1.57 Billion on Bitcoin During Fear While Early Investors Quietly Enter Pepeto for 150x Potential
-

 News Videos4 days ago
RBA board divided on rate cut, unusually buoyant share market | Finance Report | ABC NEWS
-

 Crypto World23 hours ago
Bitcoin Price News: Bhutan Sells $72 Million in BTC Under Fiscal Pressure, but the Smart Money Entering Pepeto Sees What the Market Does Not
-
 Crypto World2 days ago
NIO (NIO) Stock Plunges 6.5% as Shelf Registration Sparks Dilution Worries
-

 Business6 days ago
Australian shares drop as Iran war enters third week
-

 Crypto World6 days ago
Crypto Lender BlockFills Enters Chapter 11 with Up to $500M in Liabilities
-

 Politics4 days ago
The House | The new register to protect children from their abusers shows Parliament at its best
-

 Fashion6 days ago
25 Celebrities with Curly Hair That Are Naturally Beautiful
-

 Tech3 days ago
inKONBINI Lets You Spend Summer Days Behind the Register
-
 Politics5 days ago
Real-time pollution monitoring calls after boy nearly dies
-

 Crypto World4 days ago
Canada’s FINTRAC revokes registrations of 23 crypto MSBs in AML crackdown
-
 NewsBeat4 days ago
Residents in North Lanarkshire reminded to register to vote in Scottish Parliament Election
-

 Business6 days ago
Meta planning major layoffs as AI spending and automation reshape workforce
-

 News Videos4 days ago
PARLIAMENT OF MALAWI – PAC MEETING WITH REGISTRAR OF FINANCIAL ON AMARYLLIS HOTEL – INQUIRY LIVE
-
Entertainment6 days ago
Oscars reunite Rob Reiner supergroup of 17 stars for emotional tribute: Here's who appeared on stage
-

 Business4 days ago
Who Was Alex Pretti? 5 Key Facts About the ICU Nurse Killed by Federal Agents in Minneapolis
You must be logged in to post a comment Login