Crypto World
Ethereum Analysis: Attempted Breakout from the Sideways Structure

Easing concerns over the situation in the Strait of Hormuz provided support for risk-sensitive assets. On 8 August, the Iranian side reported progress in talks with Oman over a possible new route through the strait, although the implementation of any agreement remains dependent on additional conditions. Reduced concerns over potential disruptions to energy supplies helped improve investor sentiment, although uncertainty surrounding the region continues to create the potential for increased volatility.
Technical Analysis of Ethereum

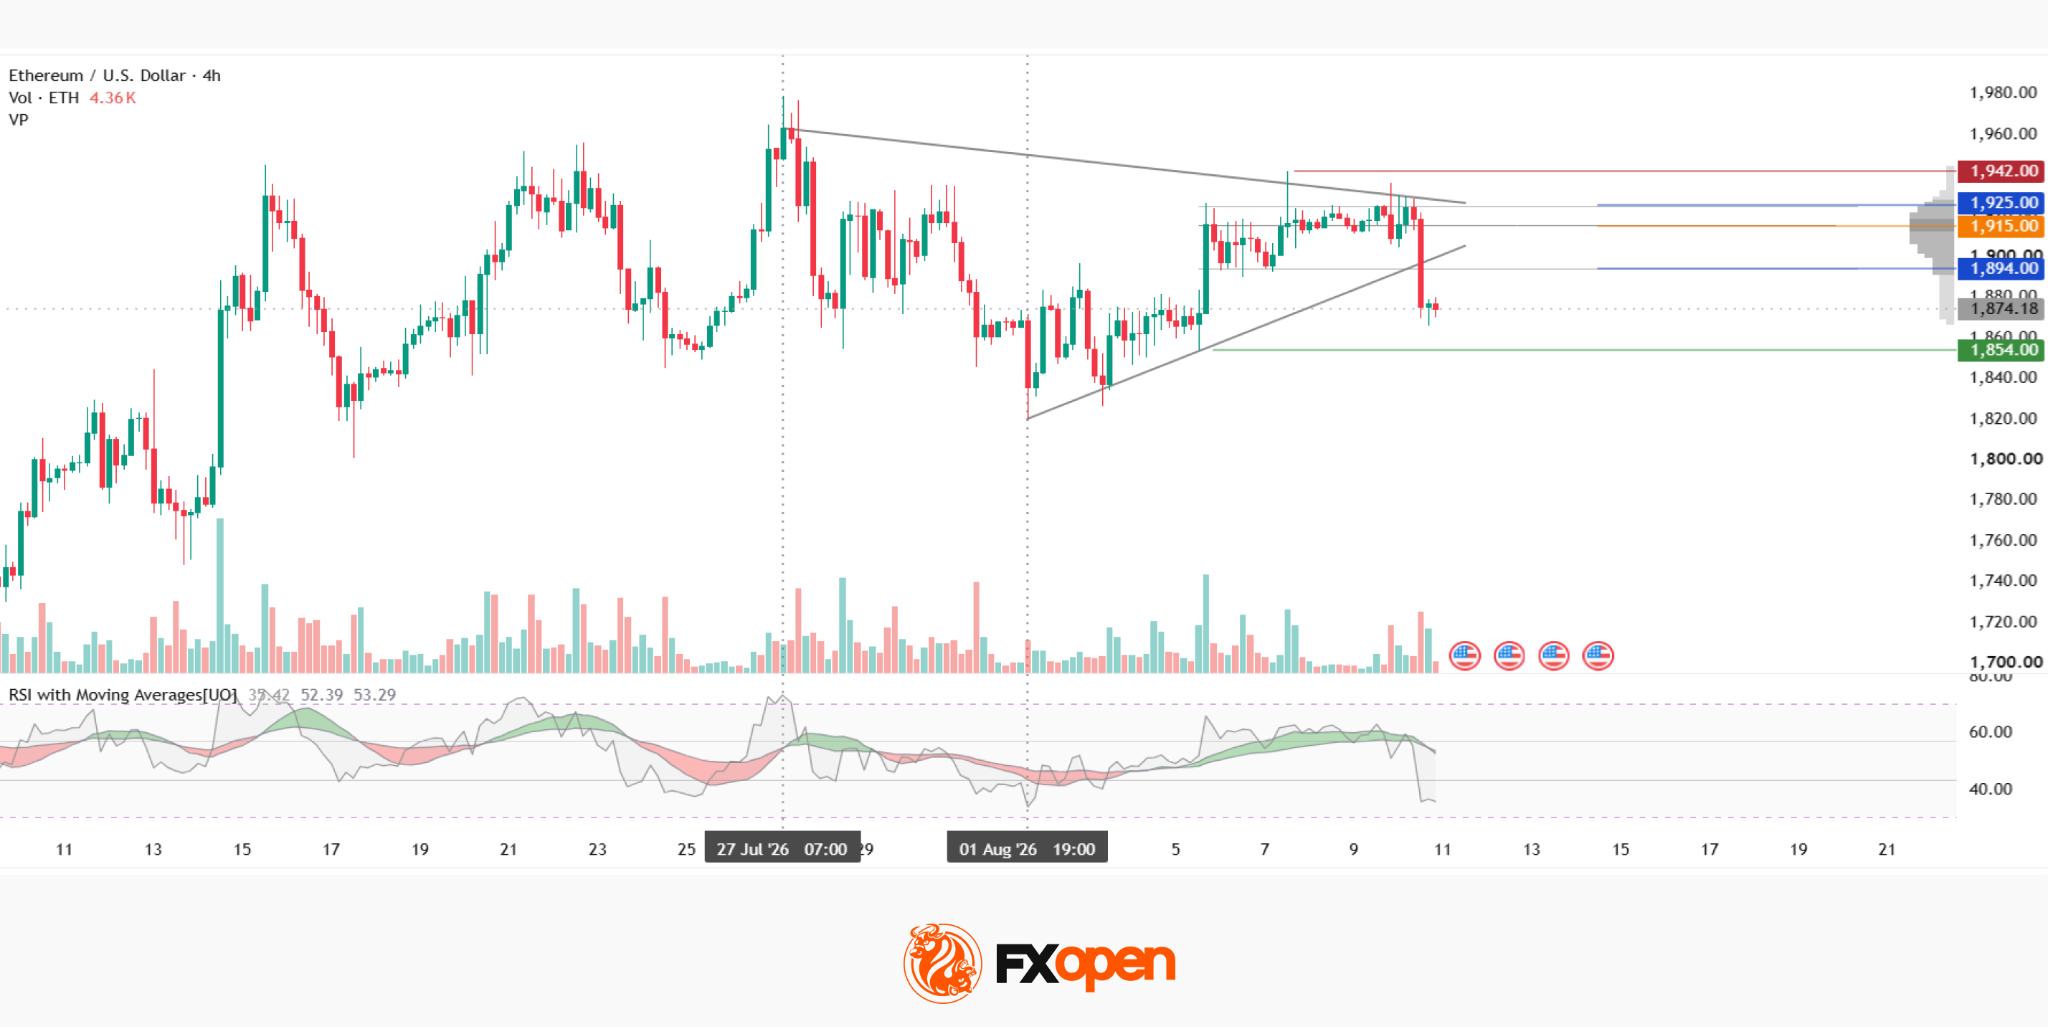
The ETH/USD technical picture shows that after peaking around $1,975 in late July, the price formed a pattern resembling a contracting triangle. The breakout occurred on 10 August, when a large red candle broke below both the triangle’s lower boundary and the lower boundary of the current market profile at $1,894, creating the conditions for a downside move out of the pattern. As a result, the price moved into the zone between the lower profile boundary and the green support level at $1,854. Continued selling pressure could pave the way for a test of this area.
If the trend reverses and the price returns to the profile range, market participants should focus on the area comprising the POC at $1,915 and the upper profile boundary at $1,925. Above these levels lies the red resistance level at $1,942. It is also worth noting that the breakout was accompanied by an increase in volume, indicating stronger selling activity at that point. Following the decline, the RSI + MAs indicator shows readings of 32, 52 and 53. The oscillator has moved out of the neutral zone, while the moving averages remain some distance from crossing below its lower boundary.
Summary
Geopolitical developments surrounding the Strait of Hormuz remain one of the key factors influencing sentiment across the cryptocurrency market, while the breakout from the contracting triangle on 10 August pointed to increased selling pressure in the short term. Ethereum’s further performance will depend on how the market responds to the latest news flow.
FXOpen offers the world’s most popular cryptocurrency CFDs*, including Bitcoin and Ethereum. Floating spreads, 1:2 leverage — at your service (additional fees may apply). Open your trading account now or learn more about crypto CFD trading with FXOpen.
*Important: At FXOpen UK, Cryptocurrency trading via CFDs is only available to our Professional clients. They are not available for trading by Retail clients. To find out more information about how this may affect you, please get in touch with our team.
This article represents the opinion of the Companies operating under the FXOpen brand only. It is not to be construed as an offer, solicitation, or recommendation with respect to products and services provided by the Companies operating under the FXOpen brand, nor is it to be considered financial advice.
You must be logged in to post a comment Login