Crypto World
Ethereum: Market Assesses the Strength of the Corrective Recovery

Following a period of heightened volatility in early June, investor attention in Ethereum has once again shifted towards institutional demand and the development of the spot ETF market in the United States. The funds launched last year continue to serve as one of the key channels for capital inflows into digital assets, while their daily flow statistics remain an important indicator of sentiment among major market participants. Expectations regarding the future direction of Federal Reserve monetary policy may also influence Ethereum’s price dynamics. Changes in interest-rate projections traditionally affect investors’ appetite for risk assets, including the cryptocurrency market.
Technical Picture

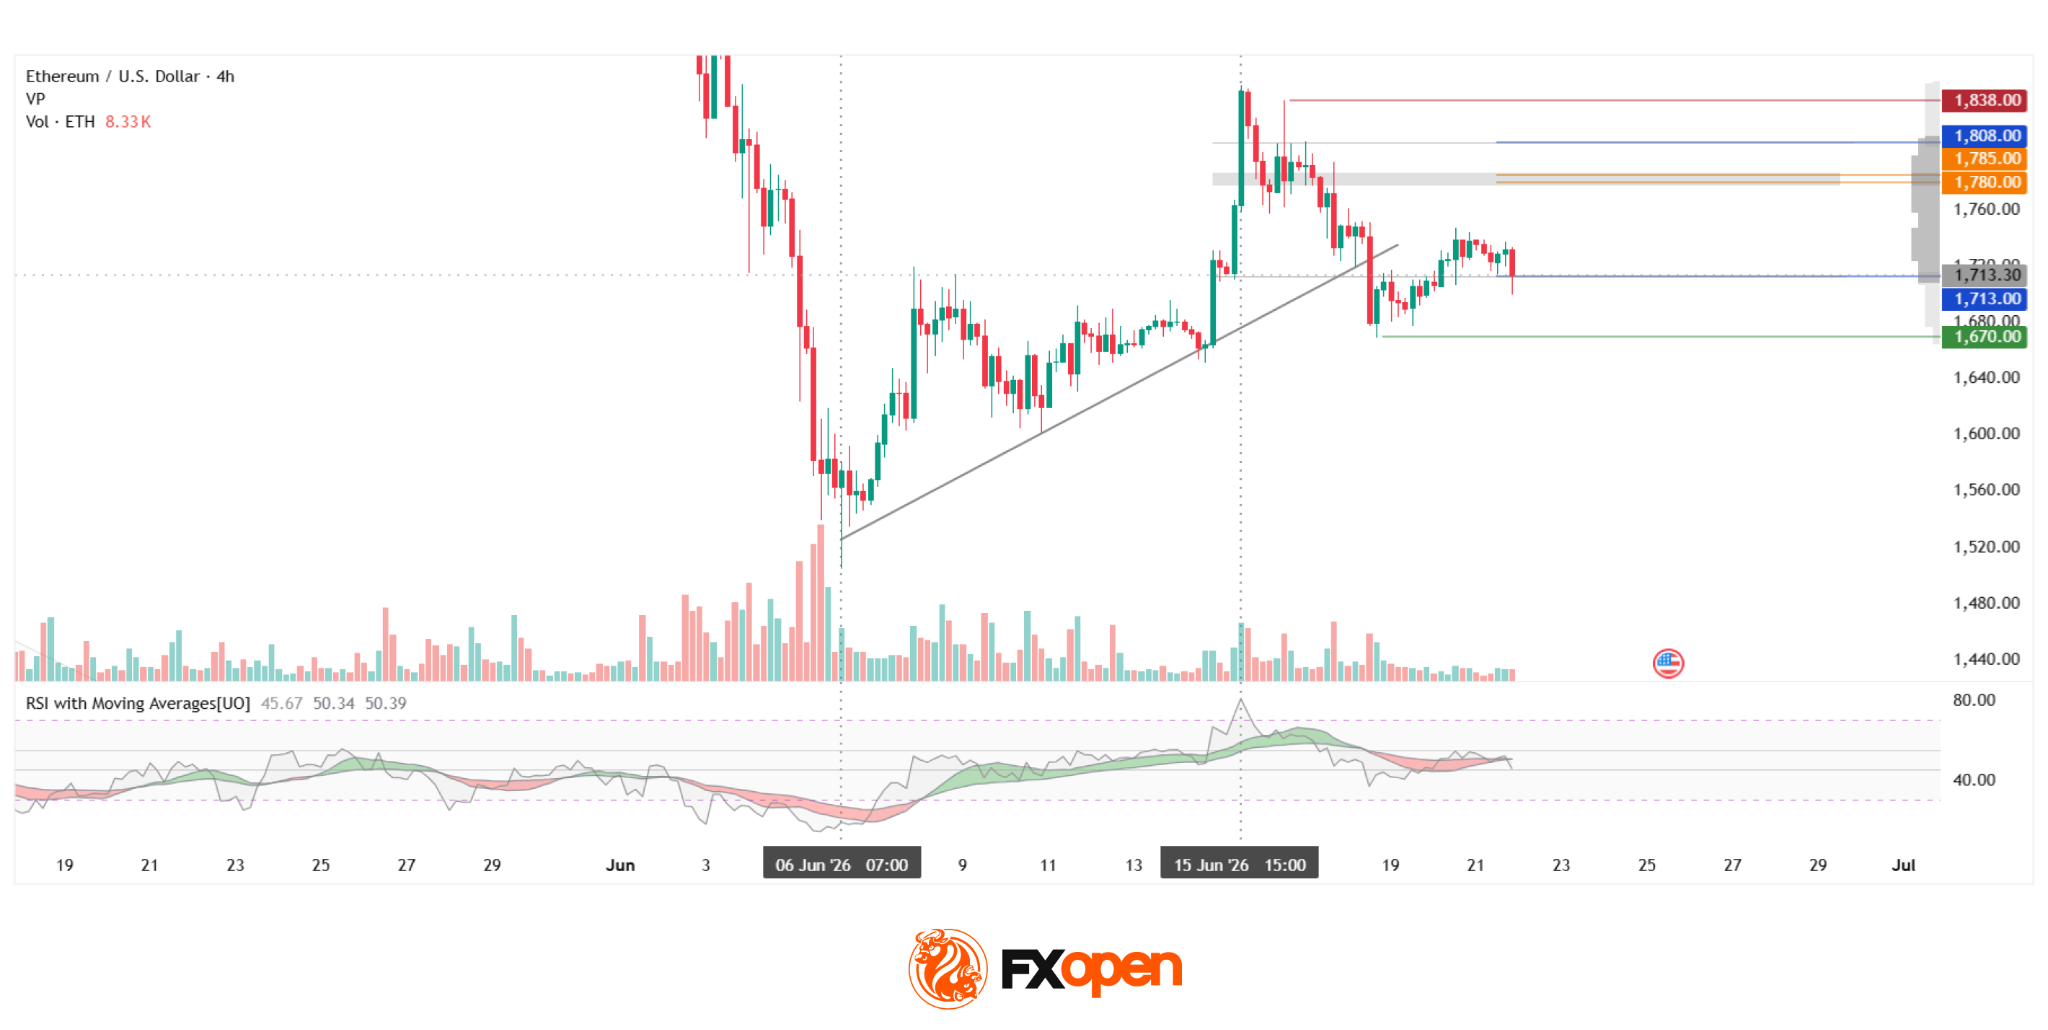
On the four-hour chart of ETH/USD, a corrective recovery can be observed from the June low, followed by the formation of a local high near the $1,838 resistance level. After reaching this area, buyers lost momentum and the price moved below the ascending trendline. The attempted trend break currently appears unconvincing and has so far been limited to a single bearish candle on 18 June, the impact of which was subsequently offset by the following candles.
Should selling pressure persist, the $1,670 area may come into focus for market participants. If the asset manages to establish itself above the lower boundary of the profile at $1,713 and continues its recovery within the current profile, the primary target could be the POC zone at $1,780–$1,785, followed by the upper boundary of the profile at $1,808. If the current profile density is overcome, the red resistance level may gain further significance. The RSI + MAs indicator shows readings of 46, 50 and 50. The main oscillator line and both moving averages remain in the middle of the neutrality zone, suggesting that the instrument currently has no clear directional bias.
Key Takeaways
Ethereum’s technical picture remains neutral, with RSI + MAs showing no signs of a clear directional impulse. In the coming weeks, additional volatility may be driven by capital flows into spot Ethereum ETFs and by changing expectations regarding the Federal Reserve’s next policy moves.
FXOpen offers the world’s most popular cryptocurrency CFDs*, including Bitcoin and Ethereum. Floating spreads, 1:2 leverage — at your service (additional fees may apply). Open your trading account now or learn more about crypto CFD trading with FXOpen.
*Important: At FXOpen UK, Cryptocurrency trading via CFDs is only available to our Professional clients. They are not available for trading by Retail clients. To find out more information about how this may affect you, please get in touch with our team.
This article represents the opinion of the Companies operating under the FXOpen brand only. It is not to be construed as an offer, solicitation, or recommendation with respect to products and services provided by the Companies operating under the FXOpen brand, nor is it to be considered financial advice.
You must be logged in to post a comment Login