
Crypto World
Ethereum NUPL on Binance Drops to Nine-Month Low as Unrealized Losses Mount
TLDR:
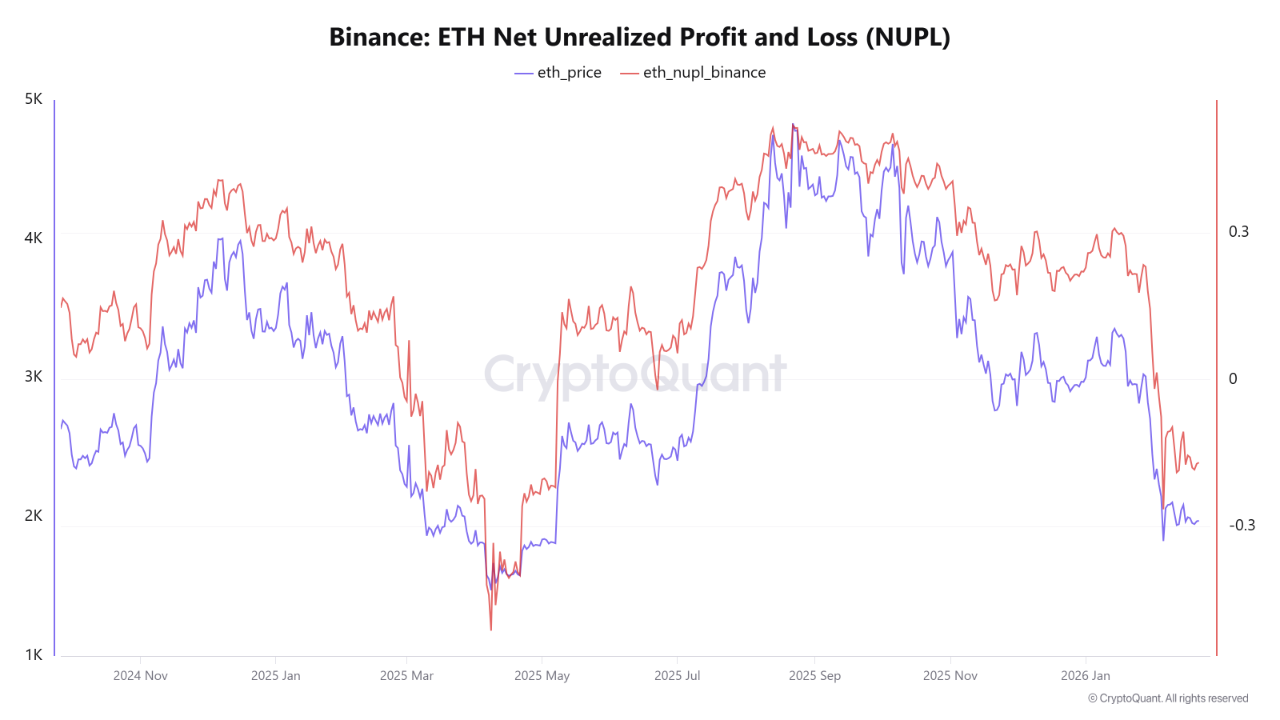
- Ethereum NUPL on Binance has fallen to -0.1689, marking its lowest recorded value in approximately nine months.
- A negative NUPL reading shows most Binance ETH reserves are currently sitting in unrealized loss territory near $1,973.
- The last comparable NUPL dip on Binance occurred around May 2024, during a sharp digital asset market correction.
- Historically, deep negative NUPL levels on Binance have been associated with reduced selling pressure and potential accumulation zones.
Ethereum NUPL on Binance has fallen to its lowest point in about nine months. The Net Unrealized Profit/Loss indicator is currently sitting near a value of -0.1689 on the exchange.
This places a considerable portion of Binance’s Ethereum reserves in unrealized loss territory. Ethereum is trading at approximately $1,973 at the time of writing.
The reading is drawing attention from market participants monitoring sentiment on the world’s most liquid crypto exchange.
What the Negative NUPL Reading Signals for Ethereum Holders on Binance
The Ethereum NUPL on Binance measures whether coins held in the exchange’s reserves sit in unrealized profit or loss.
It does not track the broader Ethereum network as a whole. Rather, it focuses solely on Binance’s reserve activity, offering exchange-specific sentiment data.
A negative reading like -0.1689 shows that most Ethereum held on Binance is currently at a loss. Historically, this type of reading tends to slow selling pressure on the market. Traders holding unrealized losses are less inclined to sell and lock those losses in.
Source: Cryptoquant
This shift matters because Binance is the world’s most liquid cryptocurrency exchange by volume. Activity on its platform carries outsized influence over broader market dynamics.
Binance processes billions in daily trading volume, making its reserve data particularly relevant. When its holders move into loss territory, the behavioral response often differs from what broader network data shows.
The NUPL chart therefore gives analysts a sharper picture of exchange-level positioning. It complements other on-chain tools by narrowing the focus to one key venue.
Analysts tracking exchange-specific data often prioritize this reading when assessing short-term market dynamics. For those watching selling pressure, the current negative reading is a notable development worth tracking.
How This Reading Compares to Historical Levels and What It Could Mean
The last time Ethereum NUPL on Binance registered similarly low values was around May 2024. That period coincided with a sharp market correction and widespread weakness in digital asset prices.
Since that point, the indicator largely recovered and traded near zero or above.
The return to negative territory today stands out against that backdrop. Over the past nine months, this represents one of the more pronounced dips recorded by the indicator.
That context adds weight to the current reading beyond just the number itself.
Some market participants historically associate these levels with potential accumulation zones. However, a negative NUPL reading alone does not confirm a price bottom has formed. It reflects current unrealized loss conditions within Binance reserves, nothing more and nothing less.
Traders and analysts continue to watch this metric as one data point among many. The current reading shows holders on Binance are underwater on their positions.
Whether that leads to accumulation or further pressure remains to be seen in the days ahead.


Bitcoin price is trading around $69,000, caught between two narratives that could lead to a single destructive prediction. Bloomberg Intelligence’s Mike McGlone has drawn a line in the sand at $75,000, hold it, and the bears retreat; fail it, and his $10,000 target comes back into serious conversation. One number separates a bull market continuation from a potential 85% drawdown.
McGlone, Bloomberg’s senior commodity strategist, is reiterating his controversial $10,000 call, this time anchoring it to a specific structural level. His thesis: the 2020–2021 liquidity supercycle, zero rates, stimulus checks, aggressive central bank expansion, artificially lifted BTC above its pre-pump equilibrium of roughly $10,000.
— Crypto Rover (@cryptorover) February 16, 2026
 BREAKING:
Mike McGlone says Bitcoin could fall to $10,000 as U.S. recession risks build. pic.twitter.com/CjRy9P2jj8
“Before the biggest money pump in history in 2020–21, Bitcoin hovered around $10,000, and it may be reverting,” McGlone posted on LinkedIn. With that liquidity era definitively over, he argues that mean reversion is the path of least resistance.
Tech selloffs, AI-driven risk-off sentiment, and persistent macro headwinds are all applying pressure to BTC’s current recovery attempt, making the $72,000–$75,000 resistance band the most important zone on the chart right now.
Discover: The best pre-launch token sales
Bitcoin Price Prediction: Reclaim $75,000 or a Drop to $55,000
Bitcoin is consolidating inside a descending channel formed after its October 2025 blow-off top above $126,000. The recent bounce off $60,000 demand has pushed the price back toward $72,000 resistance, but the 50-day moving average sitting at approximately $85,300 remains a distant ceiling, a reminder of just how much ground has been lost.
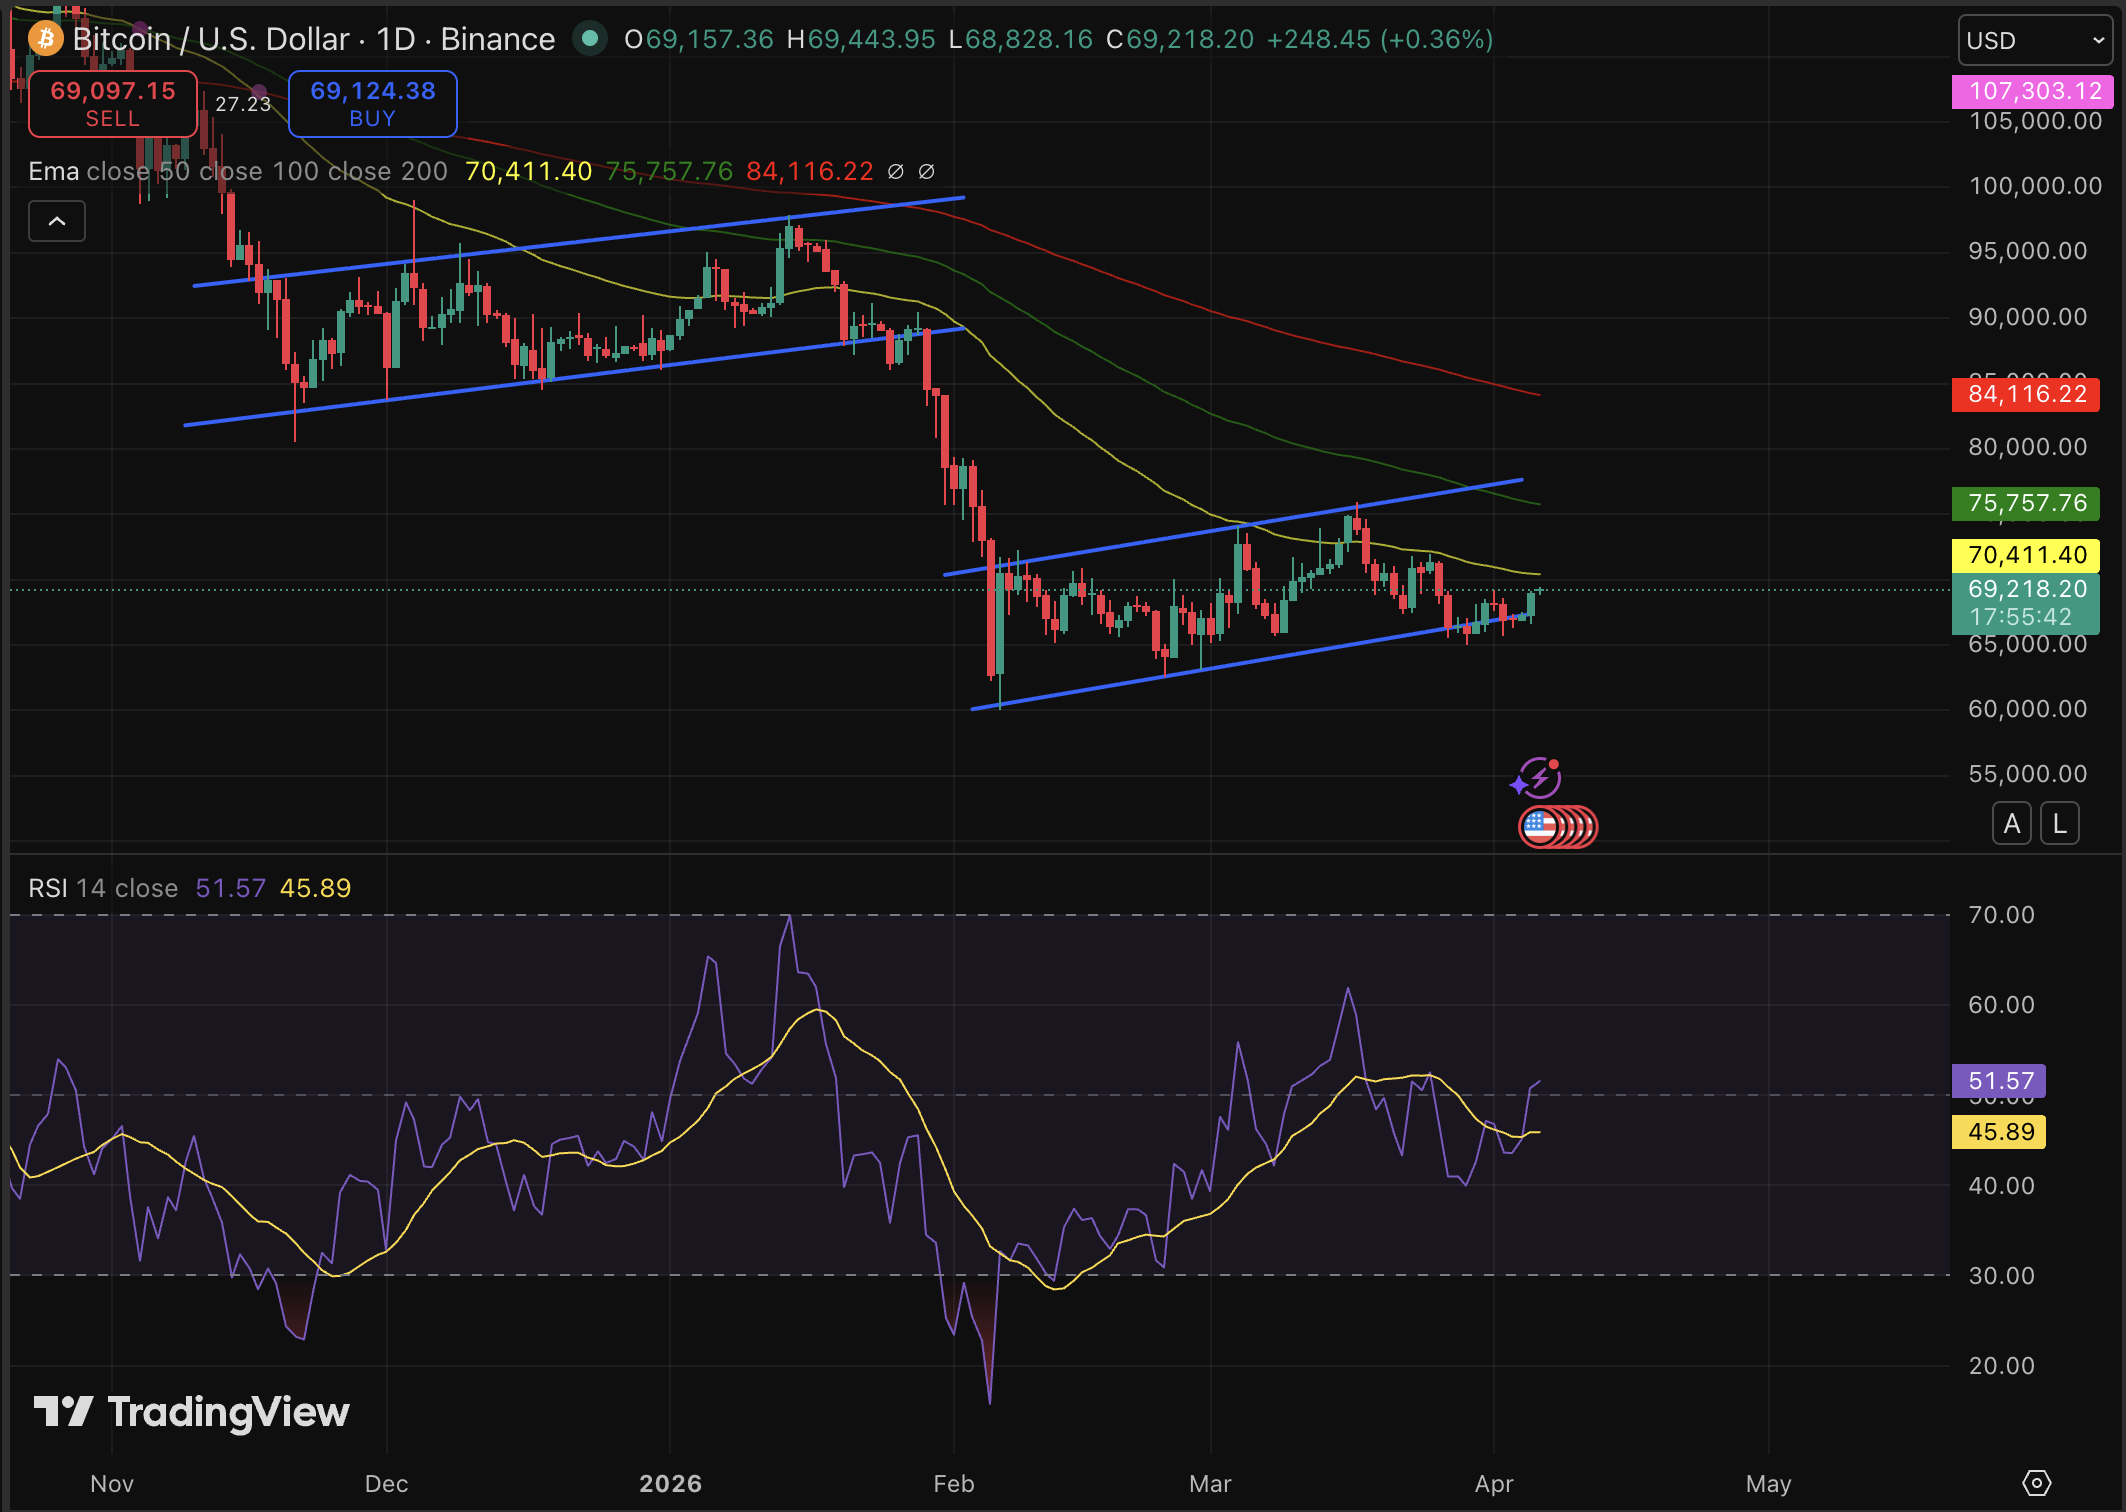
RSI readings are approaching oversold territory, which historically precedes short-term bounces, but MVRV and NUPL metrics continue to flash shakeout risk. Another analyst. Rongchai Wang sees a near-term range of $69,500–$72,000 over one week, expanding to $72,000–$75,000 over one month if momentum holds.
Watch $65,000 – $69,000 closely, a daily close below that level likely accelerates selling pressure toward the $60,000 demand zone.
Discover: The best crypto to diversify your portfolio with
Bitcoin Hyper Targets Early Mover Upside as BTC Tests Make-or-Break Levels
Bitcoin’s trapped range creates a specific frustration for holders: the upside case requires reclaiming levels 20%+ above current price, while the downside scenarios are uncomfortably close. That asymmetry, limited near-term reward, significant near-term risk, is driving some capital toward early-stage Bitcoin infrastructure plays where the entry math looks different.
Bitcoin Hyper ($HYPER) is positioning itself at the intersection of Bitcoin’s trust and Solana’s speed. The project claims to be the first-ever Bitcoin Layer 2 with SVM (Solana Virtual Machine) integration, promising lower latency than Solana itself while preserving Bitcoin’s security model.
The pitch is straightforward: Bitcoin’s $1.4 trillion ecosystem is bottlenecked by slow transactions, high fees, and near-zero programmability. Bitcoin Hyper’s decentralized canonical bridge and SVM-powered smart contracts address all three simultaneously.
The presale has raised more than $32 million at a current token price of $0.0136, with staking rewards available for early participants.
For those researching the space, explore Bitcoin Hyper’s presale details here.
The post Bitcoin Price Prediction: 75K or 10K appeared first on Cryptonews.


Strategy co-founder Michael Saylor’s latest post suggests the firm may once again resume its weekly Bitcoin purchases after a brief pause.
Summary
- Saylor signaled a return to weekly Bitcoin purchases after a one-week pause broke the firm’s accumulation streak.
- Strategy last bought about $77 million in BTC on March 23 and may have capacity for at least 1,821 BTC based on recent fundraising.
- The firm holds 762,099 BTC at an average cost of $75,694.
In a Sunday post on X, Saylor shared a StrategyTracker chart alongside the words “Back to Work,” a phrase he has often used ahead of fresh purchase disclosures. The timing has drawn attention, coming just days after the company skipped its usual weekly buy for the first time this year.
Strategy’s most recent acquisition came on March 23, when the firm bought roughly $77 million worth of BTC at $74,326 per coin, with the following week marking a rare pause that interrupted its steady buying rhythm.
Funding for these purchases continues to lean heavily on Strategy’s perpetual preferred stock offering, Stretch (STRC). The instrument is structured to hover near its $100 par value, supported by a mechanism that adjusts dividends on a monthly basis. New STRC shares are issued into the market, with proceeds then redirected toward Bitcoin accumulation.
Estimates from STRC.LIVE suggests the firm may already have capacity lined up for another sizable buy. Based on capital raised for the week ending April 3, the next purchase could reach at least 1,821 BTC if deployed.
Plans outlined in late March point to a much larger pipeline still in play. Strategy disclosed intentions to raise $44.1 billion, with funding expected to come primarily through sales of its common MSTR shares alongside STRC issuance.
Company disclosures show total holdings at 762,099 BTC, acquired at an average cost of $75,694 per coin. With Bitcoin trading near $69,100, the position currently sits below its aggregate entry price.
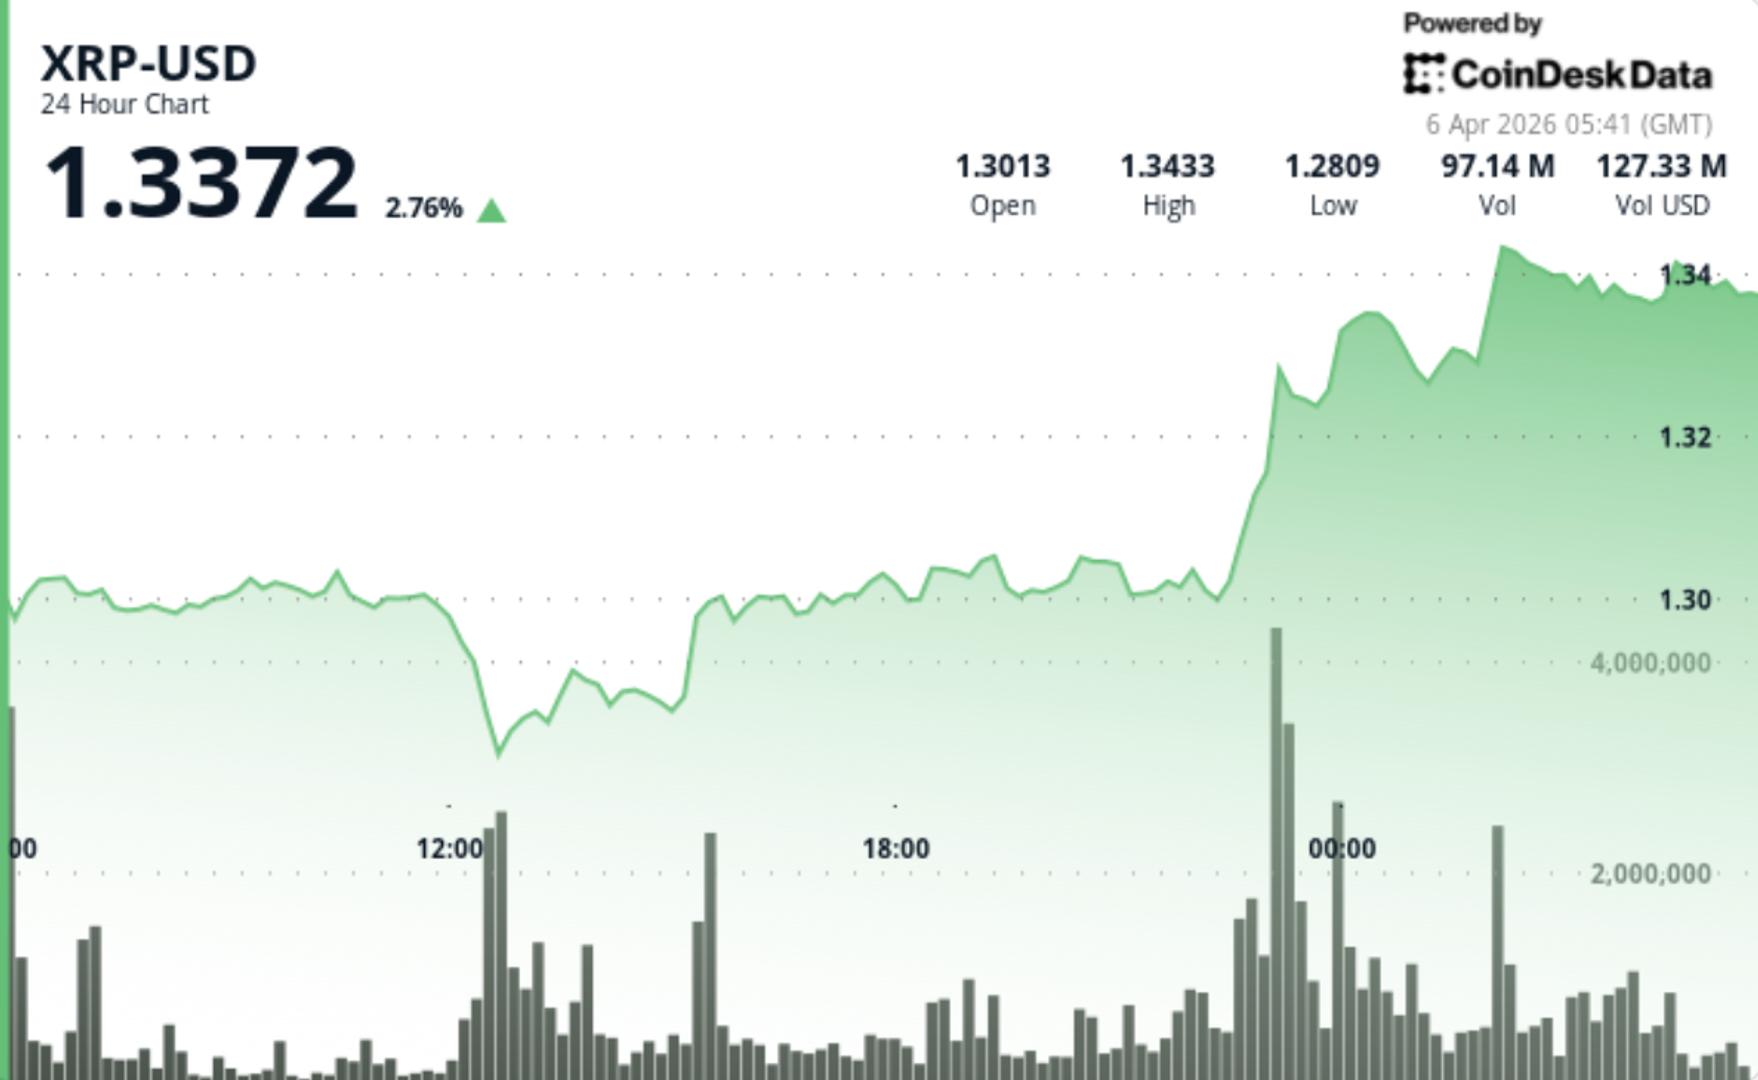

XRP moved modestly higher, but the bigger story is that it still isn’t breaking out. The token is holding above $1.30 and attracting more volume, yet price remains stuck in a narrow range, suggesting traders are positioning for a bigger move without committing to one just yet.
News Background
- XRP rose 1.08% to $1.3256, with trading volume running 23.4% above its 7-day average.
- The move came without a clear XRP-specific catalyst, with price largely tracking the broader crypto market.
- That tight correlation suggests XRP is still trading more as part of a general market rotation than on its own fundamentals.
Price Action Summary
- XRP moved from roughly $1.29 to $1.33 during the session, holding a modest upward bias throughout the day.
- Buyers defended dips near the $1.30 area, helping establish a sequence of higher lows.
- Breakout attempts near $1.33 were met with selling, keeping price capped despite heavier activity.
- Late-session trade stabilized in a tight band, pointing to consolidation rather than expansion.
Technical Analysis
- The main takeaway is that XRP is holding support, but still lacks the momentum needed to break clear of its range.
- Volume has picked up, which suggests growing participation, but the limited price response shows that conviction is still mixed.
- The structure has improved at the margin, with higher lows forming above $1.30, but overhead supply is still keeping a lid on price.
- That leaves XRP in a compression phase, where the range tightens and pressure builds until one side gives way.
What traders say is next?
- Traders are watching the $1.30-$1.32 zone as the floor that needs to hold to preserve the current setup.
- On the upside, XRP needs to clear the $1.33-$1.35 area before traders start looking for a stronger move higher.
- Until then, the token remains range-bound, with a breakout or breakdown likely to determine the next meaningful directional move.


Jack Dorsey developed decentralized messaging app Bitchat has been taken down from Apple’s App Store in China after it violated the country’s internet service regulations.
Summary
- Bitchat was removed from Apple’s China App Store after regulators flagged it under rules governing apps that can influence public opinion.
- The decentralized messaging app remains available globally and continues to see rising downloads, with over three million installs recorded.
On Sunday, Dorsey confirmed that Bitchat was removed from the App Store in February, according to a message from Apple’s app review team issued at the request of the Cyberspace Administration of China (CAC).
The CAC has stated that Bitchat violated Article 3 of its regulations, a provision covering online services with public opinion or social mobilization capabilities that came into force in 2018. As part of this framework, any such services would have to undergo a security assessment before launch and be responsible for the outcome.
According to Apple, all apps must comply with local requirements in the countries where they are available.
“We know this stuff is complicated, but it is your responsibility to understand and make sure your app conforms with all local laws, not just the guidelines below,” the Apple review team said, adding that apps promoting or encouraging “criminal or reckless behavior” would be rejected.
The latest disruption only impacts China, and Bitchat remains available across other countries globally.
Bitchat thrives against censorship
Bitchat has gained attention during periods of political unrest as the app’s decentralized nature allows communication even during internet shutdowns. This also puts it at odds with China’s tightly controlled internet censorship regime.
Data from Chrome download statistics shows that the app has been downloaded more than three million times, with weekly downloads reaching over 92,000.
As previously reported by crypto.news, Bitchat downloads surged in Uganda as locals turned to the app during election-related internet shutdowns. At the time, Nyombi Thembo said authorities had the technical capacity to shut it down.
However, adoption continued to rise, especially as the app was promoted by opposition candidate Bobi Wine as a way to bypass connectivity restrictions.


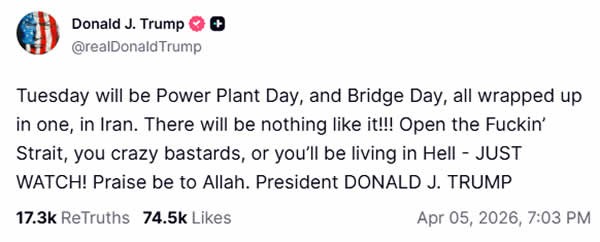
United States President Donald Trump has again warned that the U.S. army will target Iran’s infrastructure next if Tehran doesn’t comply by April 7.
Summary
- Trump warned of strikes on Iran’s power plants and infrastructure if the Strait of Hormuz is not reopened by the latest deadline.
- Iran rejected the ultimatum and said it would respond in kind to any attack on its infrastructure.
After attacking Iran’s Ghadir Bridge last week, the U.S. president on Sunday said that further attacks would target power plants across Iran unless the Strait of Hormuz is reopened.
“Tuesday will be Power Plant Day, and Bridge Day, all wrapped up in one, in Iran. There will be nothing like it!!! Open the Fuckin’ Strait, you crazy bastards, or you’ll be living in Hell – JUST WATCH! Praise be to Allah,” Trump said in a Truth Social post.
Trump’s latest warning comes as the key maritime passage has remained closed to global shipping for more than three weeks now. Disruption of this vital waterway has led to skyrocketing oil prices globally, as the Strait of Hormuz accounts for roughly 20% to 30% of the world’s total oil consumption and transit.
Since then, President Trump has issued a series of deadlines for Iran to meet his demands to reopen the strait or face devastating military strikes against its energy grid.
During a media appearance following his Sunday remarks, Trump said there was a “good chance” of reaching a deal on Monday, while also warning he was considering “blowing everything up and taking over the oil” if talks collapsed.
However, Iranian leadership has not softened its stance and has instead warned that it would respond “in kind” to any attack on its infrastructure and would “react in kind.”
“Our armed forces have made it clear that in case Iran’s infrastructure is attacked, we would react in kind […] Our armed forces would target any similar infrastructure that is owned or in any way or manner related to the United States or contributes to their act of aggression against Iran,” Iran’s Foreign Ministry spokesperson Esmail Baghaei said in recent comments.
Iran plans to keep the strait closed as it considers imposing transit tolls to compensate for infrastructure damage, according to Mahdi Tabatabaei, a spokesman for Iran’s president’s office.
Tabatabaei said the strait would reopen once a portion of transit tolls is used to compensate for all the damage caused.
Meanwhile, Gen Ali Abdollahi Aliabadi of Iran’s central military command called Trump’s threat a “helpless, nervous, unbalanced and stupid action,” adding that “the gates of hell will open” for the U.S. leader.
Odds of the US invading Iran spook markets
As tensions escalated, the odds of a U.S. invasion surged to 63% on the platform Polymarket. This is starting to weigh on investor sentiment across markets, including cryptocurrencies.
Brent crude oil, a widely used pricing benchmark in the global spot oil market, remains elevated, closing Thursday at more than $109 per barrel. With trading scheduled to resume on Monday, the latest developments could further pressure markets and put Bitcoin’s short-term recovery at risk.
The flagship crypto has recovered from last week’s lows near $66,000 and was trading just below $69,200 at press time. The total crypto market cap was up 2.2% during the same period.
A key oil market metric that has preceded major market collapses since 1987 is closing in on its danger zone.
The crude’s 12-month rate of change (ROC) is now sitting at 91%. Analysts suggest that each time this metric breached 100%, a market crash followed.
Five Crashes, One Oil Playbook
Analyst and trader Jack Prandelli noted that the pattern spans nearly four decades. In 1987, 1990, the dot-com bust, the 2008 financial crisis, and the 2022 bear market, oil’s 12-month ROC crossed the 100% line.
Follow us on X to get the latest news as it happens
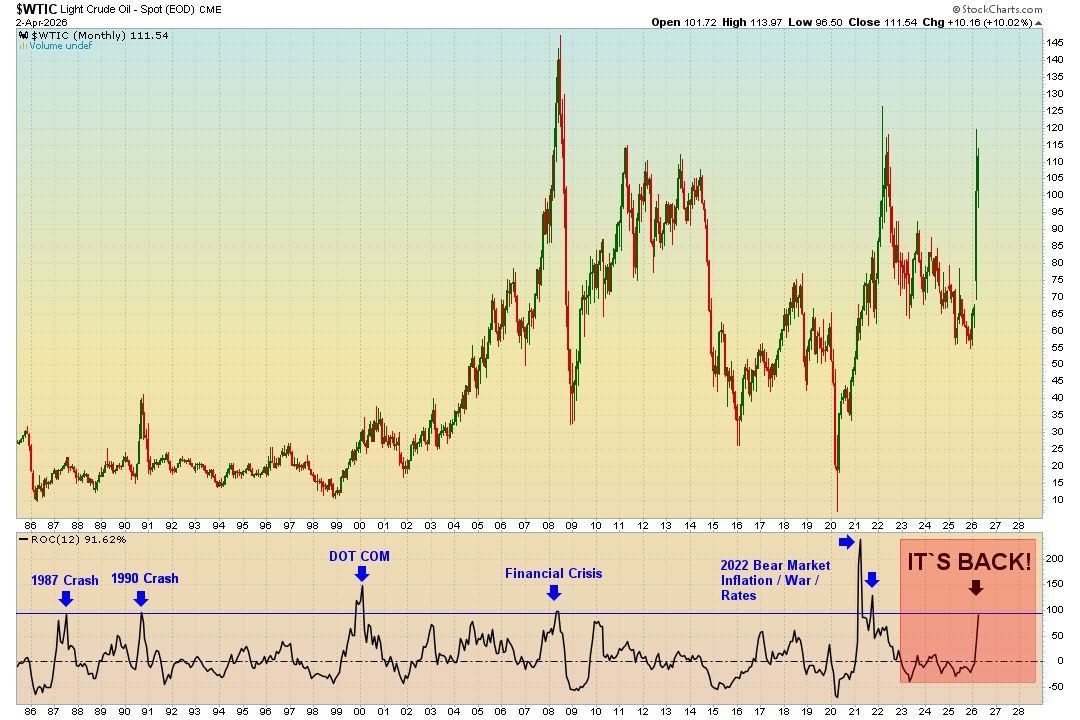
The current 91% reading leaves a narrow 9-point buffer, one that may be quickly erased as supply shocks build. Oil prices have surged since the US-Israeli strikes on Iran began on February 28, rattling energy markets and fueling recession fears.
“When oil moves this fast, economies break. Will this time be different? History says no,” Prandelli remarked.
Nick Colas, co-founder of DataTrek Research, previously noted that when oil prices double within a 12-month window, it may be a warning sign that a recession could follow.
“The rule of thumb I learned from auto industry economics in the 1990s is that if oil prices go up 100% in a one-year period, expect a recession,” he said.
Meanwhile, the supply disruption that could push oil past that threshold may already be underway. Tanker traffic through the Strait of Hormuz, which carried roughly 20% of global oil supply before the conflict, has stalled.
US President Trump has issued a fresh ultimatum. He threatened strikes on Iran’s infrastructure if the strait is not reopened by Tuesday. Iranian officials, however, say the waterway will remain closed until war reparations are addressed.
On Monday, Brent crude climbed above $111 per barrel, up 1.9%. West Texas Intermediate hovered near $112 in Asian trading hours. Amid the surging prices, the question may no longer be whether the pattern holds. It is whether the trigger gets pulled.
Subscribe to our YouTube channel to watch leaders and journalists provide expert insights
The post The Oil Signal That Preceded Major Market Crashes Since 1987 Is Flashing Again appeared first on BeInCrypto.
Crypto markets bounced 2.5% as US President Donald Trump sent mixed signals over a potential deal with Iran to reopen the Strait of Hormuz, including reports of a possible ceasefire that could permanently end the war.
In an expletive-laden post on the Truth Social platform on Sunday, Trump threatened that Iran would be “living in Hell” if the Strait of Hormuz is not reopened.
However, he also acknowledged in a Fox News interview that Iran is “negotiating now” and expressed optimism about a “good chance” of a deal within 24 hours.
Total market capitalization has climbed about $70 billion, or 2.5%, to an 11-day high of $2.44 trillion in early trading on Monday on the news. Bitcoin tapped $69,500 on Coinbase, according to TradingView.
The small jump has led to total liquidations of around $255 million over 24 hours, 73% of them being short positions, according to data from CoinGlass.
Trump’s comments come after more than a month of war, contributing to surging global oil prices that some fear could lead to a global economic recession.
Trump initially gave Iran a 10-day window to reopen the Strait of Hormuz, but his latest post suggests that Iran now has until Tuesday to reopen the waterway, or the US would attack Iran’s power plants and bridges.
“There will be nothing like it!!! Open the fuckin’ Strait, you crazy bastards, or you’ll be living in Hell – JUST WATCH!” he said.

A potential deal within 24 hours
Despite the aggressive rhetoric, Trump also acknowledged that Iran is “negotiating now” and expressed optimism about a “good chance” of a deal within 24 hours.
He also said, “If they don’t make a deal and fast, I’m considering blowing everything up and taking over the oil.”
Related: New Bitcoin price lows ‘matter of time’ says trader with BTC stuck at $67K
A report from Axios, meanwhile, suggests that the US, Iran and a group of regional mediators are discussing the terms of a 45-day ceasefire that could lead to an end of the war, adding further mixed signals.
Oil prices surge, adding inflation pressure
The ongoing war in the Middle East and the closure of the Strait of Hormuz have pushed crude oil prices back up to about $112 per barrel on Monday morning.
The Kobeissi Letter predicted that if current levels are sustained for another seven weeks, US Consumer Price Index-related inflation will rise to around 3.7%.
Meanwhile, Americans have spent an additional $240 million per day on fuel costs since the Iran war began Feb. 28, it added.
Magazine: No more 85% Bitcoin collapses, Taiwan needs BTC war reserve: Hodler’s Digest
Bitcoin jumped 3% to $69,120 on Monday as traders returned from the Easter weekend to a burst of optimism around a potential Iran ceasefire, pushing the largest cryptocurrency to its highest level in over a week and squeezing $196 million in short positions over the past 24 hours.
Ether led a bump among major tokens with a 3.7% gain to $2,130, its strongest daily move in the past week. SOL rose 2% to $82, XRP added 2.2% to $1.34, and dogecoin climbed 1.7% to $0.093. The broad rally pushed the total crypto market cap back above $2.5 trillion.
The catalyst was an Axios report that the U.S., Iran, and a group of regional mediators are discussing terms for a potential 45-day ceasefire that could lead to a permanent end to the six-week-old conflict.

Reports that more ships had passed through the Strait of Hormuz added to the relief, even as Trump issued increasingly aggressive threats to destroy Iran’s power plants starting Tuesday.
The liquidation data tells the story of how the market was positioned heading into the weekend.
Of the $273.8 million in total 24-hour liquidations across 81,819 traders, shorts accounted for $196.7 million versus $77.1 million in longs, a ratio of nearly 3-to-1 that indicates traders were heavily positioned for further downside after last week’s sentiment collapse. The largest single liquidation was a $10.17 million ETH-USDT short on Binance.
Bitcoin’s 24-hour range stretched from $66,634 to $69,350, a $2,700 swing that caught the worst of the short positioning.
The move came after Santiment data over the weekend showed social media sentiment had hit its most bearish skew since the war began, with five negative posts for every four positive ones. As is often the case in crypto, the most bearish sentiment reading of the cycle produced the sharpest bounce.
The move reclaims the top of bitcoin’s five-week war range but does not break it. The $65,000 to $73,000 channel that has contained every rally and selloff since the conflict began remains intact.
Resistance levels at $71,500 and $81,200, corresponding to the Lower Band and Trader On-chain Realized Price indicators as tracked in a CoinDesk report, sit overhead as the next meaningful tests if the ceasefire momentum holds.
Whether this rally has more substance than the last three depends entirely on whether the 45-day ceasefire materializes or becomes another headline that gets walked back within 48 hours.
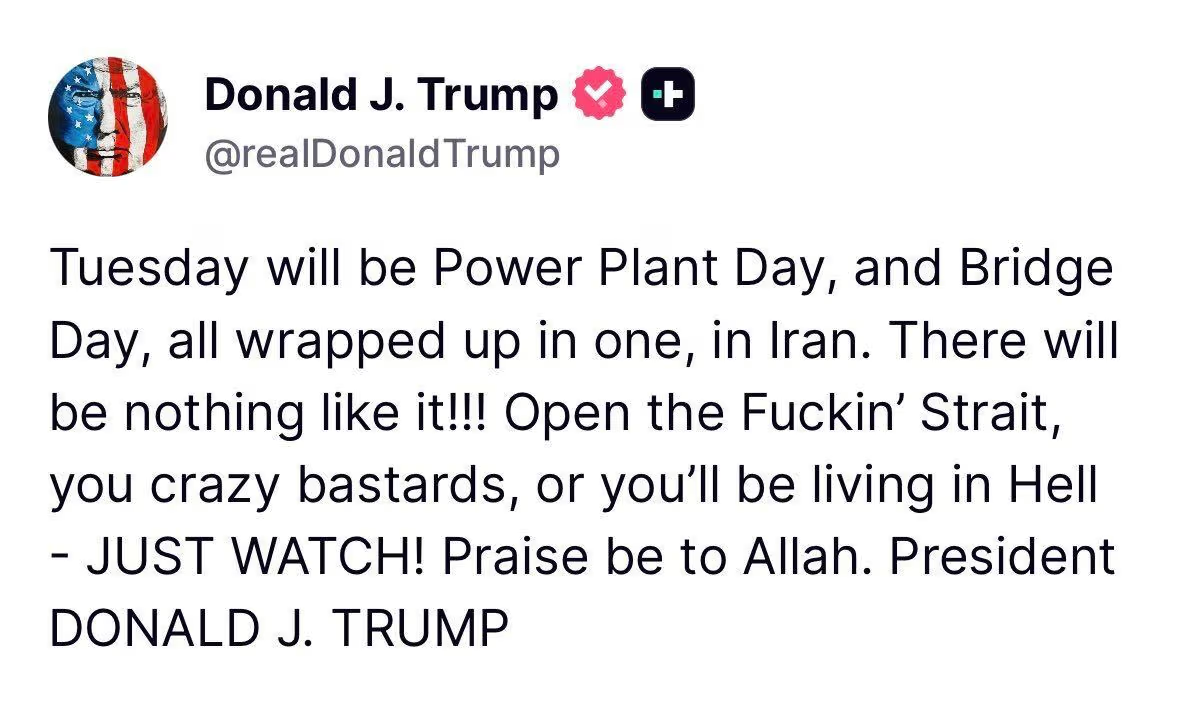
Rwanda’s central bank has doubled down on its crypto stance, warning that payments and trading using the local currency remain illegal even as Bybit rolls out support for the Rwandan franc on its peer-to-peer (P2P) platform. The National Bank of Rwanda (NBR) said crypto-assets are not authorized for FRW payments, FRW conversions, or FRW-based P2P trading, flagging “serious financial risks and no recourse in case of loss.”
The warning followed Bybit’s Friday post announcing that the Rwandan franc could be used to buy and sell crypto via its P2P service. In a separate note, the NBR underscored that FRW is the sole legal tender in the country and that NBR-licensed financial institutions are prohibited from converting FRW into crypto assets or vice versa. Critics say the move reflects Rwanda’s broader policy of keeping monetary sovereignty tightly controlled while still pursuing digital-era infrastructure through non-cash instruments.
Bybit did not immediately respond to requests for comment, and the exchange’s announcement appears to sit at odds with the central bank’s reiterated position. The clash illustrates the tension between global crypto offerings and national regulators that have pressed to limit on- and off-ramp activity in local currencies.
Rwanda has been quietly advancing a digital-money agenda alongside its fiat framework. The country has an ongoing effort centered on a central bank digital currency (CBDC) known as the e-franc rwandais, which remains in a proof-of-concept stage with potential to move into a pilot phase. The e-franc is part of a broader push in parts of Africa to explore digital currencies while enforcing strict controls on the use of private crypto assets.
Rwanda is not alone in this approach. Across the continent, policymakers have sought to preserve monetary sovereignty and regulate crypto services more narrowly, a stance that has intensified as the sector grows. In Rwanda’s case, authorities emphasize that while they are open to regulated innovation, crypto should not replace the FRW in everyday transactions.
Key takeaways
- NBR warning on FRW-based crypto activity: Crypto payments, FRW conversion, and FRW FRW-based P2P trading remain outside the legal framework, with officials flagging financial risk and lack of recourse.
Bybit has enabled FRW for P2P crypto trading, but the central bank maintains that such activity is not authorized under current law. The e-franc rwandais is in a proof-of-concept stage and could progress to a pilot, signaling a measured move toward digital-state money. A draft law from the Capital Market Authority aims to regulate virtual asset service providers, with licensing and supervision, and specific prohibitions on mining, mixers, and FRW-pegged tokens. Chainalysis data place Rwanda low in Sub-Saharan crypto adoption for 2024–2025, highlighting a contrast with higher-adoption peers in the region and suggesting regulatory clarity will be pivotal for future growth.
NBR’s stance and the Bybit friction
The central bank’s message was issued via its official communications channel, reaffirming that FRW remains the only legal tender and stressing that licensed institutions are barred from converting FRW into crypto assets or the reverse. This stance aligns with a cautious regulatory environment that has accompanied Rwanda’s broader efforts to regulate and supervise crypto-related activities through licensing regimes rather than embracing open, unrestricted crypto use. The stated risk is not merely financial but also anchored in a lack of formal recourse for losses arising from crypto trades executed in FRW terms.
Bybit’s involvement underscores a growing appetite among global exchanges to experiment with fiat-backed P2P rails in markets with strict crypto rules. The exchange’s Friday post indicated that users could leverage FRW to engage in crypto trades on its platform, effectively creating a channel for on-and-off ramps that regulators have not approved. The net effect is a policy ambiguity that can complicate decision-making for local users and financial institutions alike.
Regulatory momentum: licensing, supervision, and the path forward
In March, Rwanda’s Capital Market Authority released a draft framework aimed at regulating virtual asset service providers. The document frames a licensing and supervision scheme intended to foster “responsible innovation” while limiting potential risk to financial stability. The bill would prohibit crypto assets as legal tender, ban crypto mining, disallow mixing services, and bar tokens pegged to the FRW. It also outlines a pathway for crypto service providers to operate under a formal license, signaling a more formalized approach to crypto activity in the country.
These developments come as Rwanda seeks to balance digital modernization with prudent oversight. The CMA’s draft suggests a future in which regulated entities can offer crypto-related services without eroding the authority of the FRW-based financial system. In practical terms, this means licensed exchanges and wallet providers could operate within a defined legal framework, while unregulated activity remains off-limits or subject to penalties.
Adoption landscape and regional context
Chainalysis data illustrate a nuanced picture of crypto adoption in Sub-Saharan Africa, placing Rwanda toward the lower end of the spectrum for 2024–2025. The analysis shows that residents in Rwanda captured only a fraction of the crypto value observed in higher-adoption countries such as Nigeria and South Africa. Policymakers in Rwanda have repeatedly cited financial sovereignty and consumer protection as reasons for tightening crypto access, even as the country explores digital central bank money and modern payment rails.
Observers note that Rwanda’s cautious approach could shape how quickly crypto services gain traction in the country. A clearer licensing regime and defined boundaries between FRW and crypto usage could reduce regulatory risk for compliant providers, but the absence of a clear green light from the central bank can also dampen consumer and merchant enthusiasm for crypto as a payments instrument.
As Kigali advances its digital-money strategy, market participants will be watching for the CMA’s final version of the virtual assets bill, any official guidance on P2P FRW activity, and how the e-franc PoC evolves toward a broader rollout. The balance between enabling innovation and maintaining monetary control will likely define Rwanda’s crypto trajectory in the near term.
Readers should stay tuned for updates on regulatory progress, the evolution of the e-franc project, and any practical clarifications from the NBR and CMA that could affect the viability of FRW-linked crypto services in the country.
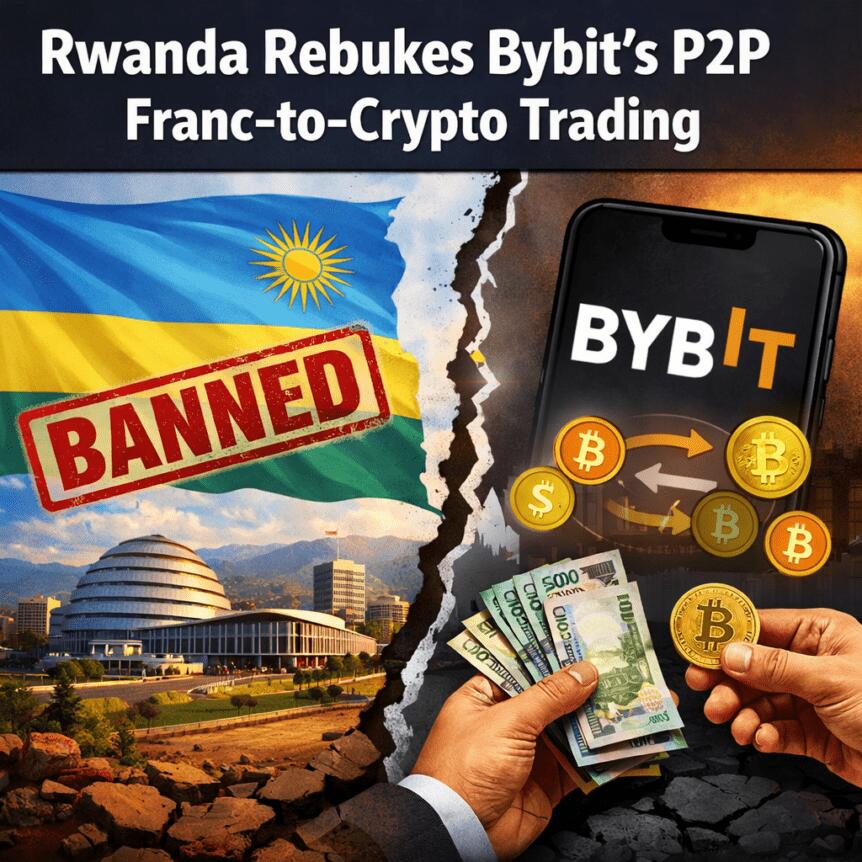
Ethereum (ETH) derivatives activity has surged to levels that dwarf the spot market. On Binance, futures volumes are now running roughly seven times higher than the actual buying and selling of the asset.
The imbalance signals that speculative positioning, not organic demand, is the primary force behind recent ETH price movements.
Binance Dominates a Leverage-Heavy ETH Market
According to analyst Darkfost, ETH open interest across exchanges is approximately 6.4 million ETH. That figure approaches the all-time high of 7.8 million ETH set in July 2025, following a gradual recovery from a low of around 5 million ETH in October 2025.
Binance alone accounts for roughly 2.3 million ETH in open interest, or about 36% of the global total. Moreover, the spot-to-futures trading volume ratio on the exchange has fallen to 0.13, marking the lowest annual reading ever recorded for Ethereum.
“In practical terms, this means that futures volumes are now about seven times larger than spot volumes. In other words, for every $1 traded on the spot market, roughly $7 flows through futures contracts,” the analyst said.
Follow us on X to get the latest news as it happens
The analyst warns that leverage-heavy positioning leaves ETH exposed to sharp swings, as forced liquidations or position unwinds could trigger outsized price moves.
“This dynamic suggests that speculation is currently driving price movements on Ethereum. The extensive use of leverage does not provide a strong structural foundation and can amplify volatility through position adjustments or liquidation events,” Darkfost wrote.
Geopolitical Stress Fuels the Divide
The derivatives-heavy structure has taken shape against a volatile macro backdrop. The ongoing US-Israeli military conflict with Iran and disruptions near the Strait of Hormuz have pushed oil prices sharply higher throughout 2026.
Rising energy costs have fed inflation expectations and dampened risk appetite across traditional and digital asset markets. Darkfost said that this environment has pushed more cautious investors to the sidelines.
However, speculative participants remain active in the derivatives market, widening the gap between leveraged and spot-based activity.
Heavy reliance on leverage without a strong spot demand foundation makes the market vulnerable to sudden dislocations. When large leveraged positions begin to unwind, cascading liquidations can follow, amplifying price swings in both directions.
Whether spot demand returns to stabilize the structure may depend on how quickly geopolitical and macroeconomic conditions improve.
Subscribe to our YouTube channel to watch leaders and journalists provide expert insights
The post Ethereum Derivatives Flash Warning as Leverage Outpaces Spot Demand appeared first on BeInCrypto.

'Positives' for tourism despite Iran war uncertainty
Bitcoin Price Prediction: 75K or 10K

Strictly Come Dancing: 17 Stars Rumoured To Be Replacing Tess Daly And Claudia Winkleman


-

 NewsBeat3 days ago
Steven Gerrard disagrees with Gary Neville over ‘shock’ Chelsea and Arsenal claim | Football
-

 Business3 days ago
No Jackpot Winner and $194 Million Prize Rolls Over
-

 Fashion2 days ago
Weekend Open Thread: Spanx – Corporette.com
-
Entertainment7 days ago
Fans slam 'heartbreaking' Barbie Dream Fest convention debacle with 'cardboard cutout' experience
-

 Crypto World4 days ago
Gold Price Prediction: Worst Month in 17 Years fo Save Haven Rock
-

 Business7 hours ago
Three Gulf funds agree to back Paramount’s $81 billion takeover of Warner, WSJ reports
-
Crypto World6 days ago
Dems press CFTC, ethics board on prediction-market insider trades
-

 Sports1 day ago
India men’s 4x400m and mixed 4x100m relay teams register big progress | Other Sports News
-

 Business4 days ago
Login and Checkout Issues Spark Merchant Frustration
-

 Tech7 days ago
Apple will hide your email address from apps and websites, but not cops
-

 Tech6 days ago
EE TV is using AI to help you find something to watch
-

 Sports6 days ago
Tallest college basketball player ever, standing at 7-foot-9, entering transfer portal
-

 Politics6 days ago
Should Trump Be Scared Strait?
-

 Tech6 days ago
Flipsnack and the shift toward motion-first business content with living visuals
-
Tech6 days ago
Daily Deal: StackSkills Premium Annual Pass
-

 Fashion7 days ago
The Best Spring Trends of 2026
-

 Crypto World6 days ago
U.S. rule change may open trillions in 401(k) funds to crypto
-

 Sports6 days ago
Women’s hockey camp eyes fitness boost, tactics ahead of WC 2026 campaign | Other Sports News
-

 Tech6 days ago
How to back up your iPhone & iPad to your Mac before something goes wrong
-

 Politics7 days ago
BBC slammed for ignoring author of The Fraud
You must be logged in to post a comment Login