Crypto World
Ethereum Price Analysis: Is a Drop to $2.4K Next After ETH’s Latest Rejection?

Ethereum is consolidating below $2.7K after a sharp recovery from the June lows. The charts show a constructive medium-term structure, although momentum has cooled after ETH failed to sustain its move into the $2.7K resistance area. The key question now is whether the price can hold above the rising trendline and the nearby demand zone around $2.4K.
Ethereum Price Analysis: The Daily Chart
On the daily timeframe, ETH has undergone a significant structural improvement since the June low near $1.5K. The asset has formed a sequence of higher lows along the ascending trendline and recently broke above the $2.4K area, which had previously acted as resistance.
The breakout accelerated ETH toward the $2.7K region, where the market encountered a clearly defined resistance zone. The price briefly pushed toward $2.8K before retreating, and the latest candles show a modest pullback around $2.68K. This suggests that buyers have yet to establish a sustained breakout above the upper resistance band.
The most immediate support is around $2.4K, where the latest consolidation occurred. The moving averages also provide an important structural reference. The 100-day and 200-day moving averages are converging around the $2.1K region and are likely to form a bullish crossover soon, which could indicate a long-term bullish shift in market structure after months of bearish price action.
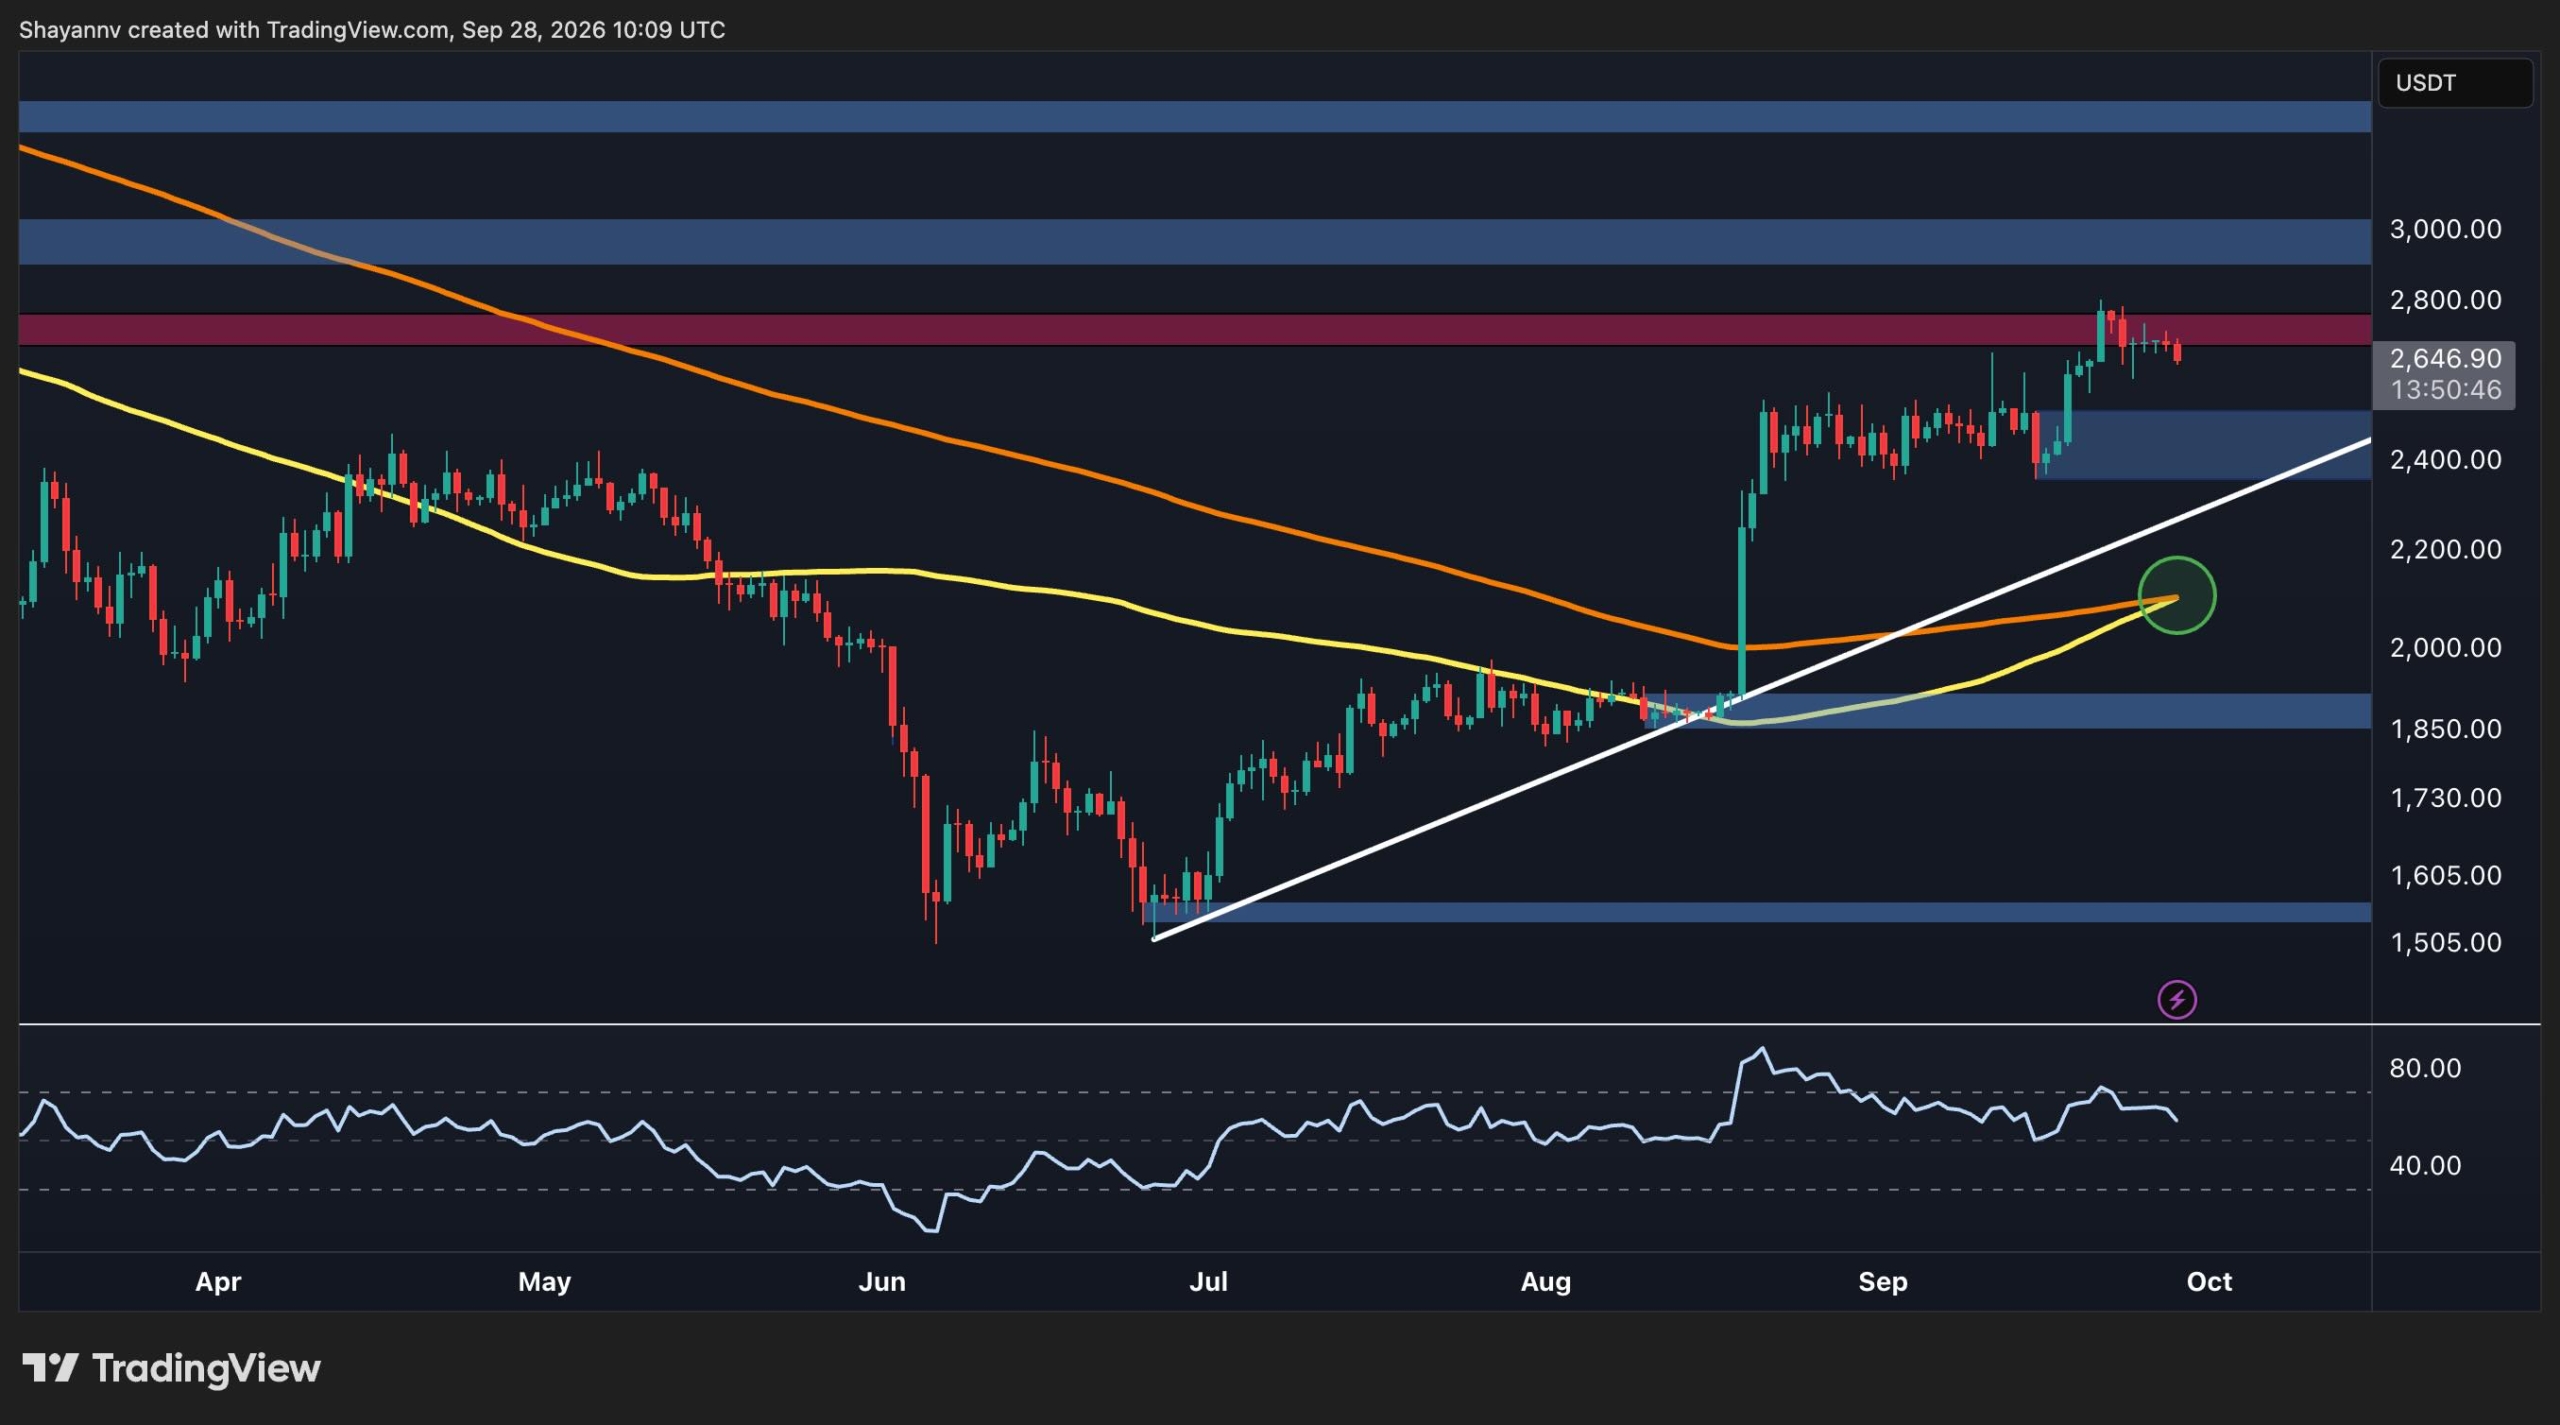
ETH/USDT 4-Hour Chart
The 4-hour chart provides a more neutral short-term picture. ETH rallied sharply from roughly $2.4K and established a new local high near $2.8K, but the price has subsequently entered consolidation beneath the $2.7K resistance zone.
The current price around $2.65K is therefore positioned between resistance near $2.7K and the short-term bullish order block around $2.5K. The latter is particularly important because it represents the area from which the latest impulsive move higher began.
The rising white trendline remains another structural reference. It has supported the sequence of higher lows and currently points toward the $2.3K-$2.4K area. A decisive break below this trendline would signal a more meaningful deterioration in the short-term structure.
The 4-hour RSI has fallen back below the mid-range after reaching overbought territory during the September rally. This cooling-off period is consistent with the current consolidation rather than an outright trend reversal.
Therefore, the immediate structure can be viewed as a range between approximately $2.5K and $2.7K. A breakout from either side should provide greater clarity on the next directional move. Above resistance, the $3K psychological level becomes the main reference, while below support, the $2.2K-$2.3K area becomes increasingly relevant.

On-Chain Analysis
The Ethereum transaction-count chart shows an interesting divergence between network activity and price. The total transaction count has recovered significantly from the lows seen around early 2026. The metric recently jumped from roughly 1.6M transactions to above 2M, indicating a renewed increase in network activity.
However, the latest price recovery toward $2.6K coincides with a drop in transaction activity, which provides some key insights about market participation. This divergence could indicate that the rise in price has led to more holding by investors rather than engaging in short-term trading and profit-taking.
Therefore, with the price chart being the most constructive seen in months, and the divergence in network activity pointing to holding behavior, investors can be optimistic that ETH will likely reach higher prices in the coming weeks. Unless a catastrophic event in geopolitics or the macroeconomy overpowers the positive sentiment in the crypto market.

The post Ethereum Price Analysis: Is a Drop to $2.4K Next After ETH’s Latest Rejection? appeared first on CryptoPotato.
You must be logged in to post a comment Login