
Crypto World
Ethereum price forms a large cup and handle pattern, eyes upside to $3,000 on breakout
Ethereum price has fallen by over 35% since the beginning of this year. However, a bullish pattern forming on charts now suggests a potential bounce back to earlier levels if confirmed.
Summary
- Ethereum remains down over 35% year to date, trading near $2,172 amid macro pressure from geopolitical tensions, inflation risks, and a hawkish Fed outlook.
- A cup and handle pattern has formed on the daily chart, with a breakout above $2,400 potentially opening the path toward $3,000.
- Institutional sentiment shows early recovery signs with $302.8 million in ETF inflows this month, though momentum indicators still reflect weak bullish strength.
According to data from crypto.news, Ethereum (ETH) price was trading at $2,172 at press time, down 8% from its weekly high and 35.7% from its year-to-date high of $3,379.
Ethereum price fell in tandem with Bitcoin (BTC) and the wider crypto market as the macro environment for risk-on assets continued to deteriorate across the globe.
Some of the headwinds that have weighed investor sentiment down include U.S. tariff threats against the EU and Canada, the successive escalation of war between the U.S. and Iran in the Middle East, and a hawkish stance from the Federal Reserve on interest rate cuts for this year.
Investors have also been rotating to traditional safe-haven assets such as Gold and other precious metals as they seek protection against geopolitical instability and inflationary pressures.
Outflows from spot Ethereum ETFs over the past two months also left the market vulnerable to sudden price swings. These institutional vehicles have, however, shown a resurgence this month, drawing in $302.8 million in total net inflows so far, a sign that institutions are betting on a recovery at these discounted levels.
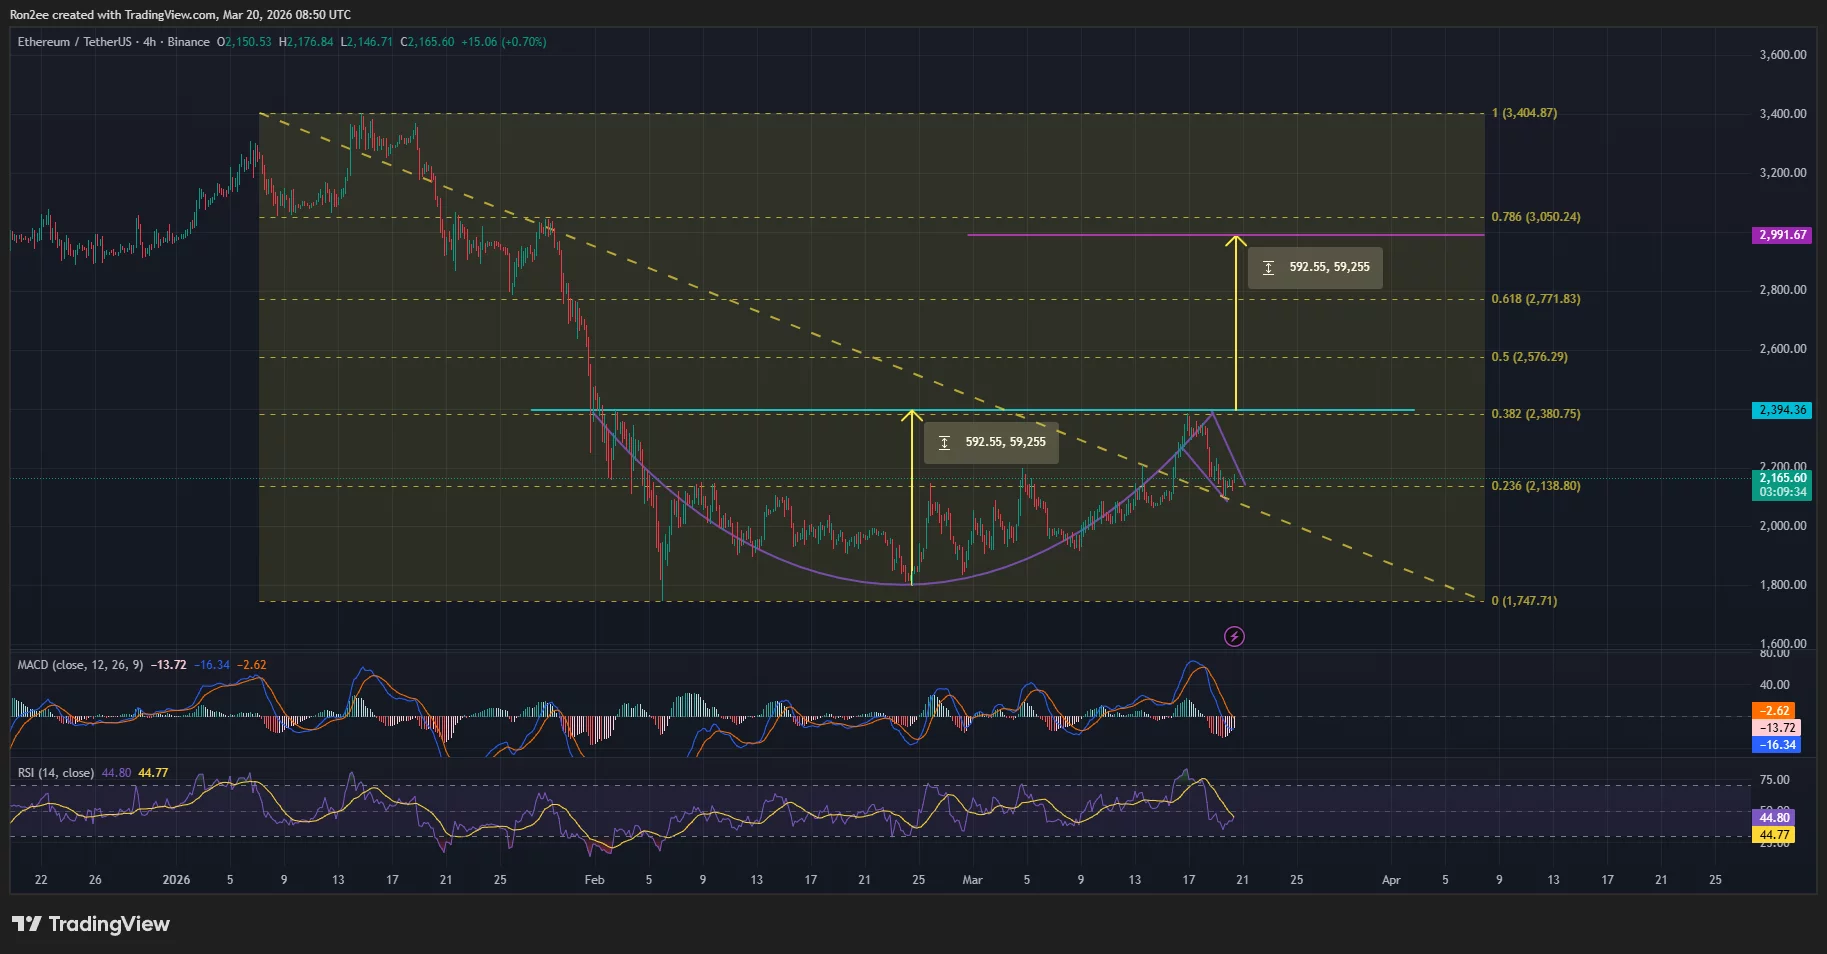
On the daily chart, Ethereum price has been forming a large cup and handle pattern since early February this year. The pattern is formed with a rounded bottom representing a period of stabilization and a slight downward handle indicating a final shakeout of weak hands.

The neckline of the pattern lies at the $2,400 psychological resistance level. A decisive breakout here could push Ethereum up all the way to $3,000, a level calculated by adding the height of the cup formed to the point at which the pattern would be confirmed.
Momentum indicators seem to suggest that bears were still dominating the market at press time. The MACD lines were pointed downwards while the Relative Strength Index was at 40.85, slightly under the neutral thresholds but beginning to flatten as selling pressure exhausts.
For now, the key resistance to watch is the $2,400 psychological barrier, which it failed to break during the market-wide bounce on Tuesday. On the lower side, $2,000 remains a critical support zone that must hold to prevent a slide back toward the yearly lows.
Disclosure: This article does not represent investment advice. The content and materials featured on this page are for educational purposes only.


TLDR
- JPMorgan reported that the Iran war triggered a surge in oil trading on Hyperliquid.
- Traders turned to Hyperliquid’s CL USDC perpetual as CME markets closed over the weekend.
- The oil contract reached a peak daily trading volume of $1.7 billion during the spike.
- Open interest on the contract climbed to around $300 million following the volatility.
- The bank said demand for 24 7 access to traditional assets is driving activity on decentralized exchanges.
Oil price swings linked to the Iran war have driven traders toward decentralized exchange Hyperliquid, JPMorgan reported on Wednesday. The bank said non-crypto investors increased activity in oil-linked perpetual futures as traditional markets closed over the weekend. As a result, Hyperliquid recorded sharp growth in volume and open interest on its CL-USDC contract.
Iran war triggers surge in oil trading on Hyperliquid
JPMorgan said the Iran war caused heavy oil volatility and pushed traders toward platforms that never close. The bank reported that activity surged when Iranian infrastructure strikes occurred over the weekend. Because CME markets were shut, traders sought alternatives for immediate price exposure.
Nikolaos Panigirtzoglou led the analyst team that tracked the flow into Hyperliquid. He wrote, “Oil trading exploded on the Hyperliquid exchange early this month when the Iran war erupted.” He added that CME traders could not react when strikes happened outside trading hours.
The CL-USDC perpetual contract remained open for continuous price discovery during the weekend. The contract uses USDC as margin and offers up to 20x leverage. According to the bank, daily peak volume reached $1.7 billion during the surge.
Open interest on the oil-linked contract climbed to about $300 million. The product now ranks as Hyperliquid’s third-most traded market. Traders used the instrument to maintain exposure while traditional venues remained offline.
JPMorgan highlights growing demand for 24/7 markets
JPMorgan stated that demand for 24/7 access to traditional assets continues to increase. The analysts said decentralized exchanges attract traders seeking constant market access. They pointed to oil as the latest example of that shift.
Perpetual futures allow traders to hold positions without expiry dates. These derivatives use funding rates to align prices with the spot market. As volatility increased, traders used these features to manage short-term risks.
Hyperliquid operates with an onchain order book rather than an automated market maker. The structure offers tighter spreads and execution closer to traditional exchanges. The platform also provides sub-second finality and portfolio margining.
JPMorgan said these features appeal to institutional participants. Faster execution supports active strategies during volatile periods. Portfolio margining also allows traders to deploy capital more efficiently.
The analysts reported that decentralized exchanges are taking share from mid-tier centralized derivatives platforms. They cited speed, liquidity, and self-custody as key drivers. Continuous access also supports trading during geopolitical events.
Hyperliquid’s native token, HYPE, has risen about 25% year-to-date. The token has outperformed much of the broader crypto market over the same period. The bank released its report on Wednesday with updated trading data.

Disclosure: This article does not represent investment advice. The content and materials featured on this page are for educational purposes only.
With market uncertainty rising, investors turn to NOW DeFi’s cloud mining model to generate income beyond price speculation.
Summary
- NOW DeFi offers cloud mining services, enabling users to earn crypto income without owning physical mining hardware.
- The platform uses AI-driven cloud computing, providing automated mining plans and real-time earnings tracking.
- NOW DeFi promotes low-cost entry, green energy infrastructure, and instant withdrawals for passive crypto income seekers.
The cryptocurrency market is no stranger to dramatic market swings. After Bitcoin surged to an all-time high on October 6, 2025, investor optimism reached fever pitch, with many expecting a continued bull run. Instead, the market took an unexpected shift.
Bitcoin is currently trading around $70,000, a steep 44% decline from its peak. As the largest and most influential cryptocurrency, Bitcoin often sets the tone for the entire market. Its downturn has triggered a ripple effect, dragging down major assets like Ethereum, XRP, and Solana, all of which had been gaining strong momentum before the sudden U-turn.
Now, the market is moving erratically without a clear direction, and in moments like these, investors feel the blow. Volatility poses serious risks to investors by causing rapid, unpredictable price swings that can lead to substantial capital losses, emotional investing (panic selling), and liquidation of leveraged positions. In the past 24 hours, over $300 million has been liquidated from the crypto market, according to data from Coinglass.

With uncertainty dominating the market, investors are increasingly looking for smarter ways to stay profitable, without relying solely on price speculation. Traditional buy-and-sell strategies become far less effective in sideways or declining markets, pushing traders to explore alternative income streams.
This shift in investor behavior is exactly what led to the emergence of NOW DeFi, a platform designed to offer stable opportunities beyond conventional cryptocurrency trading.
NOW DeFi is a cloud mining service provider, giving investors the opportunity to generate income from cryptocurrency mining without owning physical mining hardware. By connecting to the platform’s crypto cloud computing services, investors can earn income consistently even during times of high volatility.
Why NOW Defi stands out
To start using NOW Defi’s infrastructure, users simply select a compute plan, and once activated, the platform automatically allocates cloud computing resources to support cryptocurrency mining participation.
For investors already trading major assets like Bitcoin, Ethereum, or XRP, the search for a reliable alternative income stream has become increasingly important. NOW DeFi positions itself as a simplified gateway into alternative crypto earnings.
The platform is powered by AI, allowing both experienced traders and newcomers to generate passive income with minimal hands-on management.
The platform offers a range of distinctive features that make it different from other cloud mining platforms:
- New users receive free hash power after completing registration
- Its infrastructure is powered by green energy resources
- Users can monitor earnings in real-time using the platform’s interactive dashboard
- Earnings can be withdrawn instantly without any hidden fees
- Flexible mining contracts starting at as low as $22
NOW DeFi is a UK-based, legally registered crypto cloud computing platform, giving users greater confidence in its legitimacy and reducing the risks commonly associated with unverified crypto services.
The bottom line
In a market defined by uncertainty and sharp reversals, the ability to adapt is what separates resilient investors from the rest. The evolving crypto environment is pushing investors to explore more stable, diversified income approaches, and platforms like NOW DeFi are positioning themselves at the center of that shift. DeFi offers a pathway for investors to navigate volatility with greater confidence — turning market turbulence from a threat into a potential opportunity.
Welcome to the official NOW DeFi platform: Visit the official website to securely download the mobile application.
Disclosure: This content is provided by a third party. Neither crypto.news nor the author of this article endorses any product mentioned on this page. Users should conduct their own research before taking any action related to the company.
CoinDesk Indices presents its daily market update, highlighting the performance of leaders and laggards in the CoinDesk 20 Index.
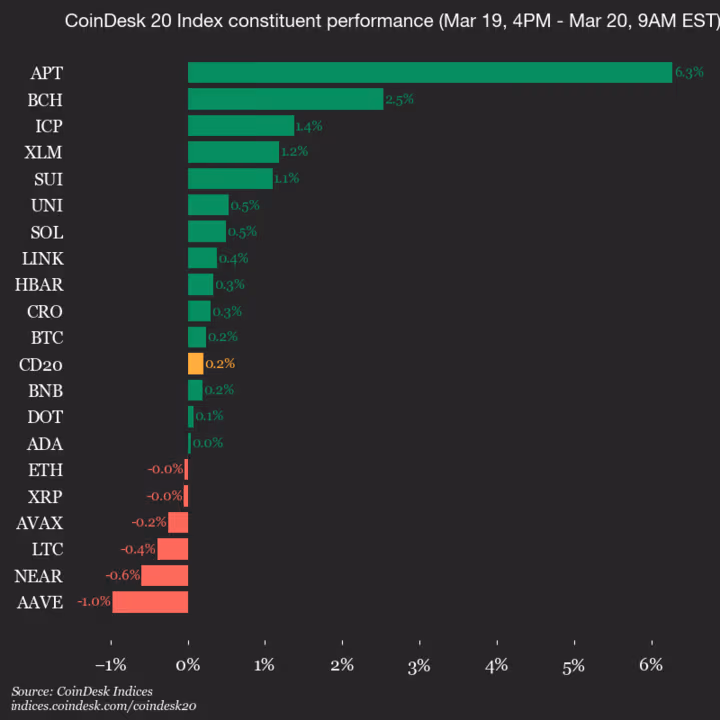
The CoinDesk 20 is currently trading at 2039.71, up 0.2% (+4.1) since 4 p.m. ET on Thursday.
Fourteen of 20 assets are trading higher.

Leaders: APT (+6.3%) and BCH (+2.5%).
Laggards: AAVE (-1.0%) and NEAR (-0.6%).
The CoinDesk 20 is a broad-based index traded on multiple platforms in several regions globally.


Kalshi Inc. raised more than $1 billion in a funding round led by Coatue Management, Bloomberg reported Thursday, citing people familiar with the matter.
The round valued the prediction market platform at $22 billion, Bloomberg said, double the valuation of the previous round in December, when it also raised $1 billion. That funding round was led by Paradigm, with participation from veteran venture capital firms including Sequoia Capital, ARK Invest, Andreessen Horowitz and CapitalG, Alphabet’s growth-equity arm.
The New York-based company declined to comment when approached by CoinDesk.
The new investment highlights investor interest in the fast-growing market despite criticism from legislators regarding insider trading and manipulation. In February, trading volume on the platform exceeded $10 billion, or 12 times its level just six months earlier, KalshiData shows. Its biggest rival, Polymarket, has grown at a similar pace, though it focuses primarily outside the U.S. Kalshi’s annualized revenue is currently $1.5 billion, according to the Bloomberg report.
Kalshi, which is regulated as a financial exchange, offers contracts tied to the outcome of a wide array of real-world events. It was founded in 2018 and exploded in popularity receiving permission to offer trading on the outcome of the 2024 U.S. presidential election. The company is overseen by the Commodity Futures Trading Commission (CFTC), allowing it to operate nationwide under federal rules, unlike traditional gambling companies that answer to state regulators.
Still, prediction market providers are facing pushback in over a dozen state actions, with state-level regulators arguing that they have jurisdiction over at least sports-related betting products.
Last month, Kalshi reported uncovering and penalizing two users for insider-trading activity, including an editor for the popular social-media star MrBeast. The company at the time also revealed more than a dozen active insider-trading cases among 200 it investigated.
On Thursday, the Ninth Circuit Court of Appeals denied Kalshi’s attempt to stave off an expected temporary restraining order from Nevada, clearing the way for a ban on its operations in the state. On Wednesday, Arizona charged Kalshi with 20 criminal counts, accusing it of operating an illegal gambling business and offering election wagering in the state.


Ledger has appointed a new chief financial officer and opened a New York office as the crypto security firm expands its U.S. presence ahead of a planned public listing.
The company said John Andrews, a former Circle (CRCL) executive, will take on the CFO role. Andrews spent more than two decades in finance and most recently led capital markets and investor relations at the stablecoin issuer. His appointment comes as Ledger positions itself for closer engagement with institutional investors and public markets.
The New York office, backed by a multi-million dollar investment, will serve as a hub for Ledger’s enterprise business. The firm is hiring across institutional and marketing roles as it builds out services for banks, asset managers and other financial firms entering digital assets.
Ledger said the move reflects growing demand for secure infrastructure as more institutions hold and manage crypto.
The expansion lands as Ledger explores an initial public offering in the United States. The company is reportedly working with major banks including Goldman Sachs, Jefferies and Barclays on a listing that could value the firm at more than $4 billion. CEO Pascal Gauthier has previously pointed to rising revenue tied to an increase in crypto hacks, which has driven demand for secure storage.
Ledger is best known for its hardware wallets, but it has pushed deeper into enterprise services in recent years. Its platform offers tools for institutions to store, manage and trade digital assets with internal controls, similar to how a bank might oversee client funds across multiple approvals.
The company says it secures a large share of retail-held stablecoins and has sold more than 8 million devices globally. Still, its track record includes setbacks. A 2020 data breach exposed customer information, and a later exploit in 2023 affected decentralized finance integrations tied to its ecosystem.
Ledger’s U.S. push follows a broader shift in the crypto sector, where firms are again testing public markets after a volatile period. Custodian BitGo (BTGO) recently went public, marking one of the first listings in the sector this year. Tokenization firm Securitize has plans to IPO as soon as it receives the green light from regulators. Meanwhile, crypto exchange Kraken has paused its IPO plans as it waits for better market conditions, CoinDesk reported earlier this week.

Key Takeaways
- Jefferies elevated SolarEdge from Underperform to Hold while increasing the price target from $30 to $49
- European TTF natural gas prices have jumped approximately 94% amid recent geopolitical tensions
- During the previous energy crisis, SolarEdge’s European sales expanded from $630M in 2020 to $1.9B by 2023
- The firm boosted its 2027 and 2028 revenue projections by 17% and 19% respectively
- SEDG shares have surged roughly 60% year-to-date, approaching the 52-week peak of $48.60
SolarEdge (SEDG) shares advanced approximately 4% during Friday’s premarket session following an analyst upgrade and improved price outlook from Jefferies.
SolarEdge Technologies, Inc., SEDG
Jefferies shifted its stance on SEDG from Underperform to Hold while boosting the price objective from $30 to $49 — representing approximately 7.3% potential upside from Thursday’s closing price.
The catalyst behind Jefferies’ revised outlook centers on energy market dynamics. Natural gas prices in Europe, measured by the TTF benchmark, have climbed roughly 94% since the onset of the latest Middle Eastern conflict. Such dramatic price increases historically incentivize consumers and enterprises to transition toward solar and energy storage solutions as hedges against volatile energy expenses.
This scenario has played out previously. During 2022, when Russian natural gas supply disruptions triggered soaring European energy costs, solar installations accelerated significantly. SolarEdge‘s revenue from European markets expanded from $630 million in 2020 to $1.9 billion by 2023.
Jefferies acknowledges that a complete replay of that surge seems unlikely. Europe’s renewable energy infrastructure has matured considerably, and electricity prices have remained comparatively stable despite rising gas costs. Any uptick in demand will likely be more gradual this time around.
Nevertheless, the investment firm believes SolarEdge is better positioned than before. Inventory adjustments that previously pressured financial performance have largely resolved, and SEDG has expanded its footprint in commercial and industrial segments while maintaining residential market share.
Updated Revenue Projections
Jefferies increased its revenue expectations for 2027 by 17% and for 2028 by 19%. The 2026 forecast remained essentially flat, with the firm noting continued customer hesitancy amid prevailing macroeconomic uncertainty.
Despite the upgrade, Jefferies refrained from issuing a Buy recommendation. Valuation concerns remain central to this cautious stance. SEDG has rallied approximately 60% in 2026 thus far and currently trades around 18x projected 2027 EV/EBITDA — marginally above comparable companies. Jefferies suggests the market has already incorporated expectations of improved demand and competitive positioning into current pricing.
The wider analyst community maintains a reserved posture. Among 25 analysts tracking SEDG, just one recommends buying, 18 rate it a Hold, and six suggest selling. MarketBeat’s consensus lands at “Reduce” with an average price target of $29.09 — substantially below current trading levels.
Latest Quarterly Performance
SolarEdge’s latest quarterly results exceeded Wall Street expectations. The company reported EPS of -$0.14, surpassing the consensus estimate of -$0.19. Revenue reached $333.8 million against forecasts of $330.3 million, marking a 70.9% year-over-year increase.
Net margin remains in negative territory at -34.23%, and analysts anticipate full-year EPS of -$4.54 for the current fiscal period.
Institutional investors control approximately 95% of outstanding shares. Multiple major stakeholders expanded their holdings in recent quarters, with UBS Group notably increasing its position by 234.8% during Q3.
SEDG commenced Friday trading at $45.66, marginally below its 52-week high of $48.60.
Bitcoin RSI signals approached a key moment as analysis said that a higher low was needed next to allow bullish BTC price continuation.
Bitcoin (BTC) is hinting at its next long-term bottom as a key leading indicator preps a higher low.
Key points:
-
Bitcoin RSI is approaching a critical long-term position for the fate of the bear market.
-
RSI needs a weekly bullish divergence to repeat its early-2023 rebound.
-
A trader says he is “not in a rush” to reenter the market with the comedown from all-time highs just a few months old.
Bitcoin RSI: All eyes on higher low
New analysis covering relative strength index (RSI) data on BTC/USD concludes it could soon be “time to pay attention.”
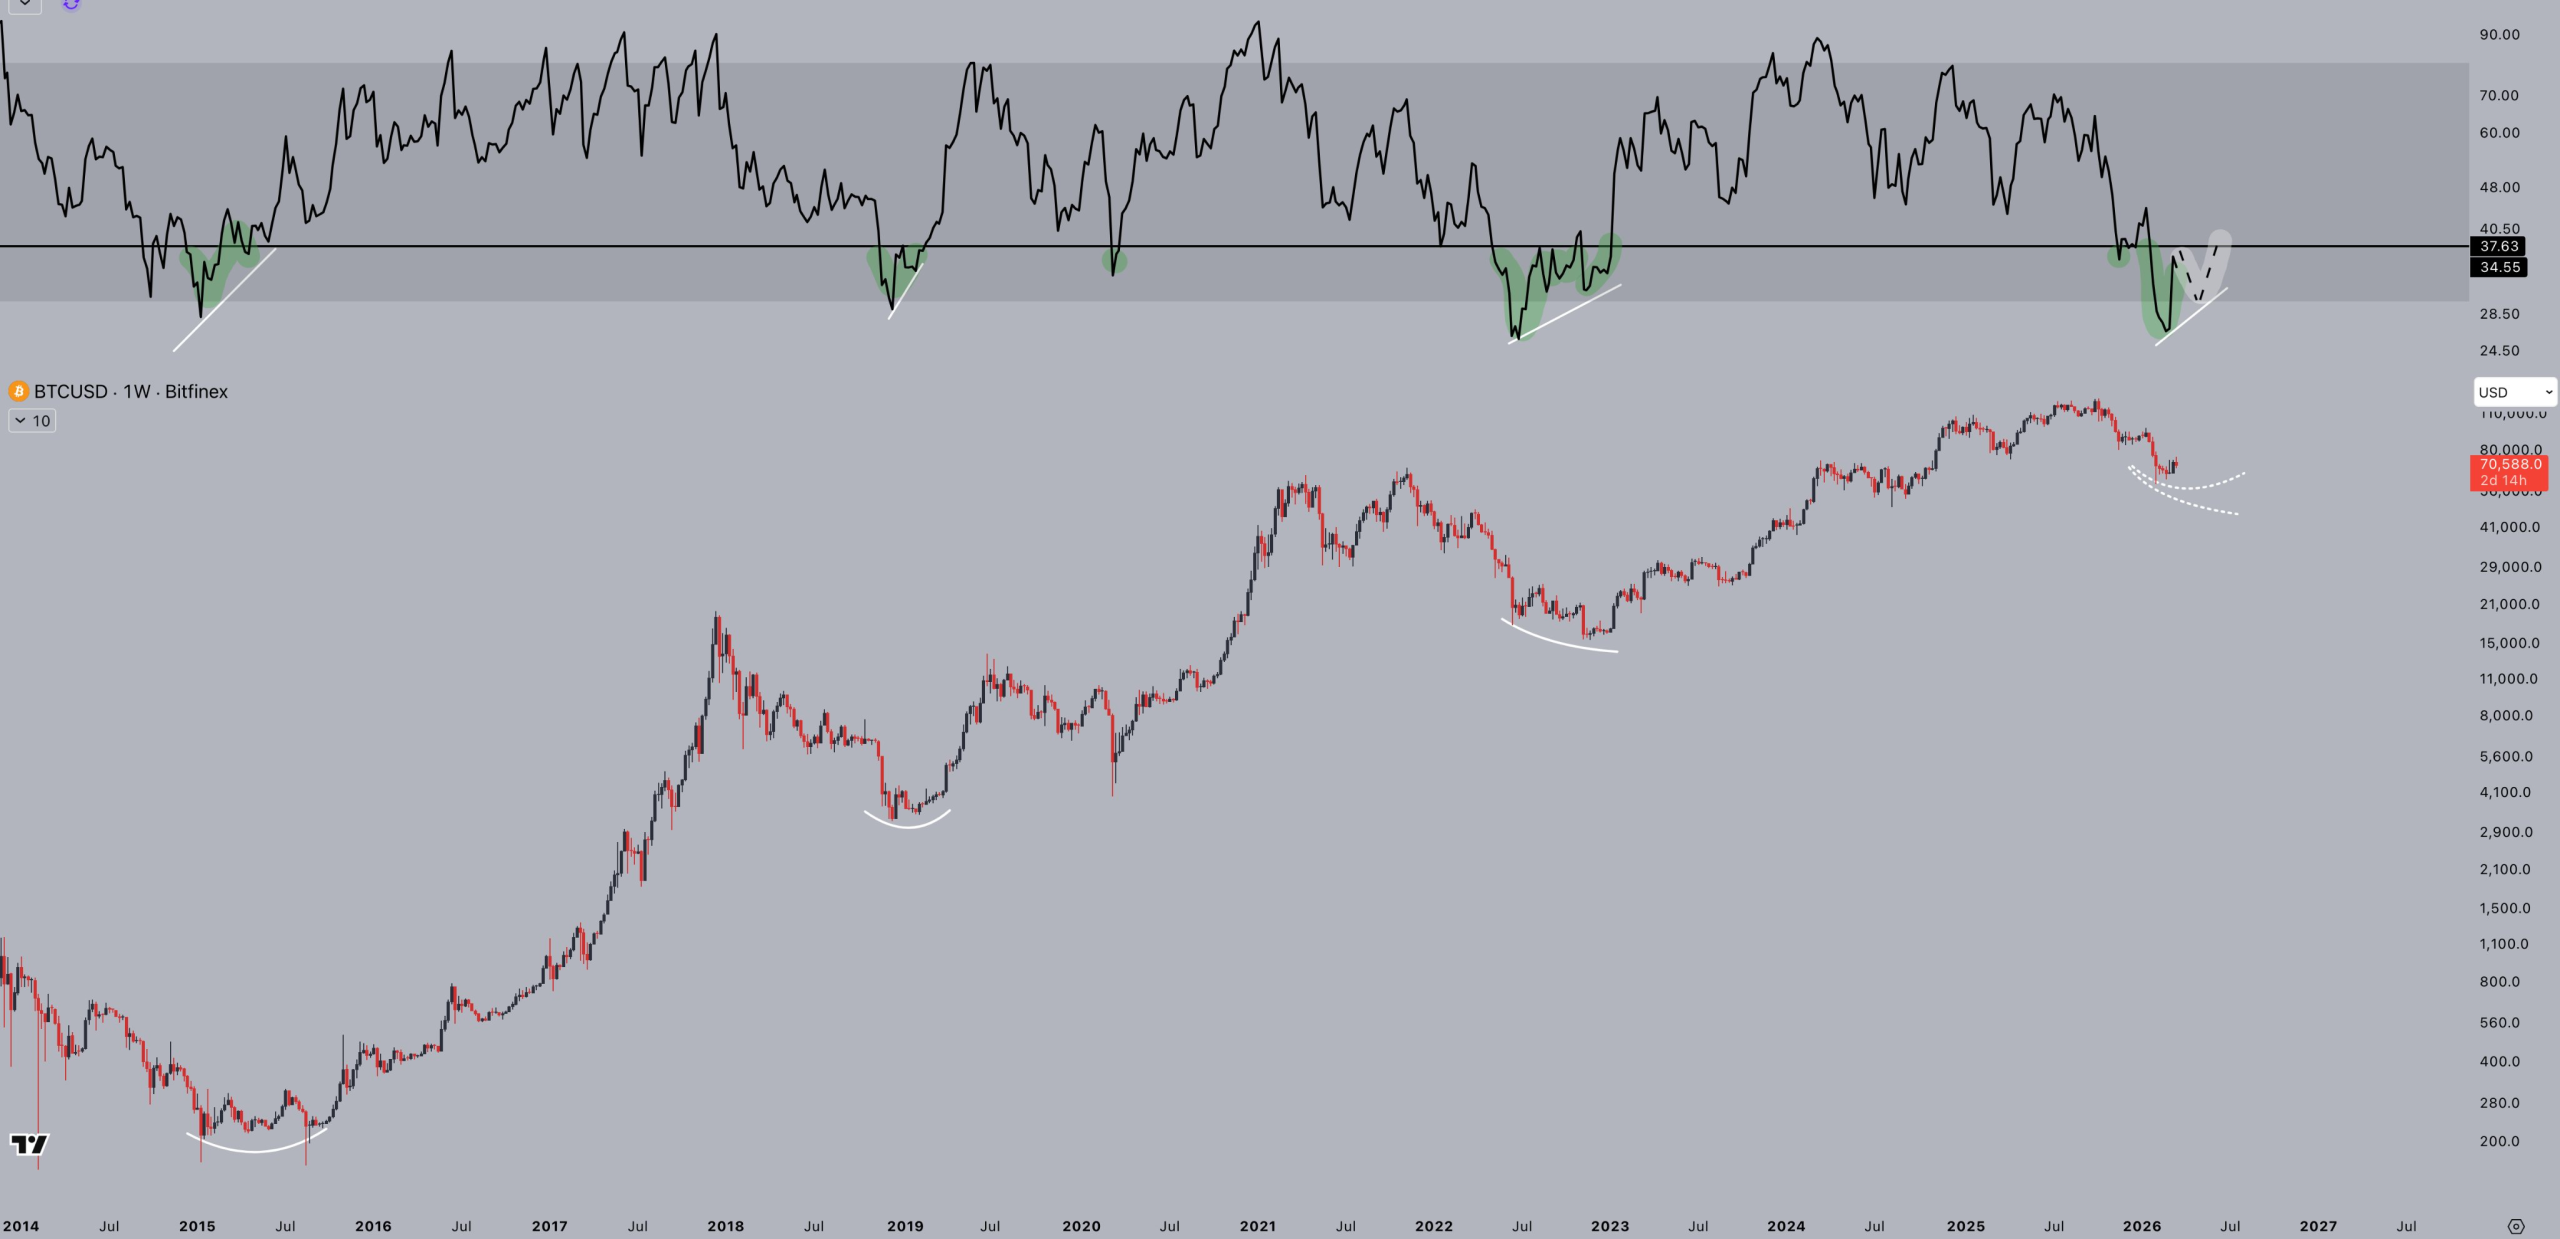
Bitcoin bear-market bottoms often follow the start of a bullish divergence with RSI on weekly time frames.
For trader Jelle, current market behavior is following historical trends, and Bitcoin’s next inflection point may be around the corner.
“When $BTC’s weekly RSI makes a higher low again, it’s time to pay attention,” he wrote on X.
A classic bullish divergence locks in when RSI makes a higher low while price makes lower lows. Jelle, however, says that price has room to maneuver and still preserve the emerging recovery.
“Doesn’t matter if BTC makes a higher low, equal low, or lower low,” he continued.
“When RSI starts moving higher again, the bottom is very close – or already in.”

BTC price bear flag still in play
RSI last flipped bullish at the end of Bitcoin’s 2022 bear market, and its signals preceded a period of upside that continued for over a year.
Related: Bitcoin tests old 2021 top as gold falls to six-week lows under $4.7K
At the time, talk also focused on reclaiming the 200-week exponential moving average (EMA) as support, something that occurred in March 2023.
As Cointelegraph reported, the 200-week EMA was only lost again last month, with analysis calling the trend line “unreliable.”

Jelle, meanwhile, is among those speculating that previous cycles demand a much longer bear market than the few months that have elapsed so far.
“Previous bear markets all lasted around a year. $BTC topped just 23 weeks ago, and looks like this,” he told X followers.
“I’m not in a rush to buy back in.”

A separate chart drew attention to a possible bear flag formation under development — a sign of weakness that could result in a fresh support failure in a manner similar to January.
This article does not contain investment advice or recommendations. Every investment and trading move involves risk, and readers should conduct their own research when making a decision. While we strive to provide accurate and timely information, Cointelegraph does not guarantee the accuracy, completeness, or reliability of any information in this article. This article may contain forward-looking statements that are subject to risks and uncertainties. Cointelegraph will not be liable for any loss or damage arising from your reliance on this information.
Crypto World
Dell (DELL) Stock Climbs 3% While Super Micro (SMCI) Crashes 25% Following Export Violation Charges

Key Points
- US authorities charged Super Micro co-founder Wally Liaw and two associates with allegedly orchestrating the diversion of approximately $2.5 billion in Nvidia-based servers to China in breach of export regulations.
- Following revelations of alleged involvement, Super Micro suspended two staff members and terminated a contractor’s agreement.
- Super Micro (SMCI) shares tumbled more than 25% during Friday’s premarket session.
- Dell (DELL) shares advanced approximately 3% in premarket activity as Super Micro’s main competitor.
- Industry analysts at Bloomberg Intelligence cautioned that reputational harm could trigger extended customer attrition for Super Micro.
Shares of Dell Technologies (DELL) advanced approximately 3% during Friday’s premarket session following a dramatic collapse in Super Micro Computer (SMCI) stock, which plummeted over 25% after federal prosecutors charged a company co-founder with violations of export regulations related to Nvidia technology.
Federal prosecutors on Thursday made public criminal charges against Yih-Shyan “Wally” Liaw — who serves as Super Micro’s senior vice president for business development and holds positions as co-founder and board member — alleging he orchestrated the unlawful transfer of billions of dollars in artificial intelligence servers to Chinese entities.
Prosecutors allege that Liaw, along with two accomplices, arranged sales of export-restricted Nvidia-equipped servers through an Asian intermediary, with full knowledge that the hardware would ultimately reach China in contravention of federal export restrictions.
The additional defendants named in the case include Ruei-Tsang “Steven” Chang, who managed sales operations at Super Micro’s Taiwan facility, and Ting-Wei “Willy” Sun, an independent contractor whom federal prosecutors characterized as a facilitator who allegedly coordinated elements of the operation.
Throughout 2024 and into 2025, the Asian intermediary entity acquired roughly $2.5 billion in server equipment, which was subsequently repackaged and transported to destinations in China, according to Justice Department filings.
Super Micro acknowledged the charges and announced it has placed both employees on administrative suspension while terminating its relationship with the contractor upon discovering the allegations.
Notably, Super Micro itself was not designated as a defendant in the criminal proceedings.
Super Micro Issues Official Statement
In a Thursday evening statement, Super Micro declared that “the conduct by these individuals alleged in the indictment is a contravention of the Company’s policies and compliance controls.”
The technology firm emphasized its operation of a “robust compliance program” and reaffirmed its dedication to full adherence to American export and re-export regulations. The company further noted its ongoing cooperation with federal investigators.
This represents another chapter in Super Micro’s recent regulatory challenges. The company experienced significant stock volatility in August 2024 when a short-selling firm questioned its financial reporting practices, coupled with the firm’s postponement of its mandatory annual 10-K disclosure.
An independent review commissioned by the board subsequently cleared the company of fraud or wrongdoing, and the outstanding filing was completed in February 2025 — allowing Super Micro to avoid potential removal from Nasdaq listing.
Dell Positioned to Capture Market Share
As Super Micro’s primary rival in the artificial intelligence server sector, Dell emerged as the clear market winner in Friday’s trading activity.
Woo Jin Ho, an analyst with Bloomberg Intelligence, observed that “given the reputation damage, risks for share losses to Dell are heightened long term” — suggesting Super Micro may experience significant customer migration.
Ho further commented that the criminal indictment underscores what he perceives as insufficient advancement by Super Micro in strengthening its internal financial oversight mechanisms.
Super Micro’s stock declined more than 25% in premarket activity and extended losses beyond 27% following the opening bell Friday. Meanwhile, Dell registered gains of approximately 2–3% during the corresponding period.


Ripple said a new 2026 survey shows digital assets are moving closer to the center of financial services strategy.
- Ripple found stablecoins lead demand as finance firms seek faster treasury tools and working capital efficiency.
- Banks and asset managers ranked custody and secure storage among top tokenization infrastructure priorities.
- Most respondents said security certifications and trusted providers matter most when choosing digital asset partners.
Meanwhile, the company polled more than 1,000 finance leaders across banks, asset managers, fintechs, and corporates, with 72% saying firms must offer digital asset solutions to stay competitive.
Ripple said stablecoins ranked as the top digital asset use case in the survey. About 74% of respondents said stablecoins can boost cash-flow efficiency and unlock trapped working capital, showing that many firms now view them as tools for treasury and liquidity management, not only payments.
The report linked that demand to wider market growth. Ripple noted that the stablecoin market cap moved above $300 billion in early March, as adoption expanded across payments, trading, and business settlement.
The survey also showed rising interest in tokenization. Among banks and asset managers looking at tokenization partners, 89% said custody and secure storage were a main priority. Banks ranked token lifecycle management at 82%, while asset managers placed primary distribution at 80%.
Ripple said the results show that many firms are now focused on the systems needed to support digital assets. “The key takeaway here is that finance leaders want more from the crypto companies offering these solutions,” the company wrote, adding that institutions want a provider that can support current and future needs.
Additionally, security ranked as the top factor in partner selection. Ripple said 97% of respondents viewed certifications such as ISO and SOC II as important or very important. Post-integration technical support followed at 88%, while industry experience and financial strength also ranked highly.
The survey also found that many firms prefer one provider for several digital asset services. Ripple said 71% of corporates favor a one-stop-shop model, while slightly more than half of fintechs and financial institutions do the same.
Ripple expands as adoption grows
The findings match broader adoption trends, where firms are moving from early testing to live digital asset plans. Ripple said,
“Most finance leaders aren’t debating digital assets anymore. They’re figuring out how to build with them and who to build with.”
As previously reported by Crypto News, that shift also comes as Ripple expands in Latin America. The company recently said it plans to apply for a VASP license in Brazil, adding to its push in payments and tokenization in the region.
Disclosure: This article does not represent investment advice. The content and materials featured on this page are for educational purposes only.

Key Takeaways
- Spotify (SPOT) dropped 6.62% Thursday following a significant technical malfunction that caused Premium subscribers to experience advertisements and had their accounts appear as free-tier memberships.
- The technical failure sparked worries about customer retention and system dependability.
- Institutional shareholder Alecta Tjanstepension Omsesidigt reduced its SPOT holdings, contributing to downward momentum.
- Evercore ISI lowered its SPOT price target from $700 down to $650, while maintaining an Outperform designation.
- SPOT shares have declined 11.02% since the beginning of the year, with InvestingPro analysis indicating the stock trades above its Fair Value estimate.
Shares of Spotify tumbled 6.62% Thursday, weighed down by a perfect storm of platform malfunction, reduced Wall Street expectations, and institutional investor exits.
Trouble emerged when Premium-tier subscribers experienced an unexpected technical failure that began displaying advertisements and downgraded their account status to resemble free memberships. For a streaming giant whose revenue engine runs on premium subscriptions, such a malfunction represents far more than a minor inconvenience.
The technical mishap eroded investor confidence in the platform’s stability during a critical period, with the company’s quarterly financial report on the horizon. Even subtle indications that premium customers might reassess their membership decisions capture immediate market attention.
Selling momentum accelerated throughout Thursday’s trading session. News surfaced that institutional stakeholder Alecta Tjanstepension Omsesidigt had reduced its SPOT stake. Additional shareholders appeared to secure profits, amplifying the day’s losses.
Evercore ISI Reduces Price Expectations
Evercore ISI adjusted its price objective for SPOT downward this week, revising it from $700 to $650. Despite the reduction, the firm maintained its Outperform designation and simultaneously increased its financial forecasts for the streaming company.
The adjustment stems from recalibrated assumptions regarding currency strength and taxation rates rather than diminished faith in Spotify’s core operations. Evercore ISI currently anticipates gross margins reaching 35.4% by 2028, surpassing the consensus Wall Street estimate of 34.9%.
According to the firm, market participants continue to undervalue Spotify’s Two-Sided Marketplace — the suite of promotional and advertising tools offered to musicians and record companies for platform visibility.
Other Wall Street firms have similarly recalibrated their forecasts. Cantor Fitzgerald maintains a $525 target with a Neutral stance. Guggenheim positions at $600 with a Buy recommendation. Jefferies and Benchmark both carry Buy ratings at $650 and $760 respectively.
This broad range in analyst perspectives highlights the ongoing discussion surrounding how to properly assess Spotify’s expansion potential against its current valuation.
Valuation Questions Persist
InvestingPro analysis indicates the stock currently trades above its Fair Value calculation, despite Thursday’s selloff. SPOT has surrendered 11.02% of its value since January began.
Five Wall Street analysts have recently upgraded their earnings projections, and the streaming giant carries a PEG ratio of 0.47, indicating the market may be underestimating anticipated growth rates.
Spotify’s gross profit margin stands at 32% across the trailing twelve months. Management has prioritized margin expansion, and analyst models suggest upward potential.
Fourth-quarter operating income exceeded previous projections by 8%, or 1% when excluding social charges, based on Cantor Fitzgerald’s analysis of the financial results.
Regarding artificial intelligence developments, Jefferies observed that Google’s introduction of the Lyria 3 music generation capability within the Gemini application warrants monitoring, though the firm retained its Buy rating, implying confidence that Spotify can navigate the competitive threat.
Shares concluded Thursday’s session with a market capitalization of $106.4 billion, accompanied by typical daily trading volume around 2.86 million shares.

FINALLY : The Most Important Day in XRP History

Chuck Norris dies at 86 after medical emergency in Hawaii

Commonwealth Bank Shares Slip 1% on Heavy Volume as ASX Weighs Broader Market Pressures

Smart energy pays enters the US market, targeting scalable financial infrastructure

Why Israel is blocking foreign journalists from entering

Bitcoin: We’re Entering The Most Dangerous Phase
FINALLY : The Most Important Day in XRP History

Crypto Trading LIVE: BTC Live Trading Bitcoin Analysis | 19 MAR #crypto #bitcoin #btc

AO VIVO: CAMINHONEIROS ADIAM GREVE; ANP COBRA PETROBRAS POR MAIS OFERTA – 20/03/2026 | CNN MONEY
-
Crypto World6 days ago
HYPE Token Enters Net Deflation as HyperCore Buybacks Outpace Staking Rewards
-

 Tech5 days ago
Your Legally Registered ‘Motorcycle’ Might Not Count Under Proposed US Law
-

 Fashion7 days ago
Weekend Open Thread: Addict Lip Glow
-
 Tech3 days ago
Are Split Spacebars the Next Big Gaming Keyboard Trend?
-
Sports6 days ago
Why Duke and Michigan Are Dead Even Entering Selection Sunday
-

 Business5 days ago
Search for Savannah Guthrie’s Mother Enters Seventh Week with No Arrests
-

 Business6 days ago
US Airports Launch Donation Drives for Unpaid TSA Workers as Partial Government Shutdown Enters Fifth Week
-
Crypto World6 days ago
Coinbase and Bybit in Investment Talks: Could Bybit Finally Enter the US Crypto Market?
-

 Business4 days ago
Australian shares drop as Iran war enters third week
-

 Business6 days ago
Country star Brantley Gilbert enters growing non-alcoholic beer market
-

 Crypto World4 days ago
Crypto Lender BlockFills Enters Chapter 11 with Up to $500M in Liabilities
-

 Sports7 days ago
College Basketball Best Bets: Conference Tournament Semifinal Picks
-

 Politics2 days ago
The House | The new register to protect children from their abusers shows Parliament at its best
-

 News Videos2 days ago
RBA board divided on rate cut, unusually buoyant share market | Finance Report | ABC NEWS
-

 Fashion4 days ago
25 Celebrities with Curly Hair That Are Naturally Beautiful
-

 Tech9 hours ago
inKONBINI Lets You Spend Summer Days Behind the Register
-

 Crypto World2 days ago
Canada’s FINTRAC revokes registrations of 23 crypto MSBs in AML crackdown
-
 Politics3 days ago
Real-time pollution monitoring calls after boy nearly dies
-

 Crypto World6 days ago
Crypto Losses Drop 87% in February, But Hackers Are Now Targeting People, Not Code
-
 NewsBeat2 days ago
Residents in North Lanarkshire reminded to register to vote in Scottish Parliament Election


You must be logged in to post a comment Login