

Crypto World
Ethereum Price In Trouble Again? Big Liquidation Risk Builds
Ethereum price is down about 1.4% over the past 24 hours, extending its broader weakness. At first glance, this looks like a routine pullback inside a consolidation phase. But this decline did not appear randomly. It came right after a warning signal flashed on the daily chart, suggesting the recent recovery may already be losing steam.
What makes this moment unusual is the reaction from traders. Instead of reducing risk, leveraged long positions have surged past $1 billion. This creates a dangerous contradiction. The same conditions that are warning of a deeper drop are also attracting aggressive bullish bets. This disconnect could now decide Ethereum’s next major move.
Bearish Divergence And Supply Cluster Are Now Pointing To The Same Risk
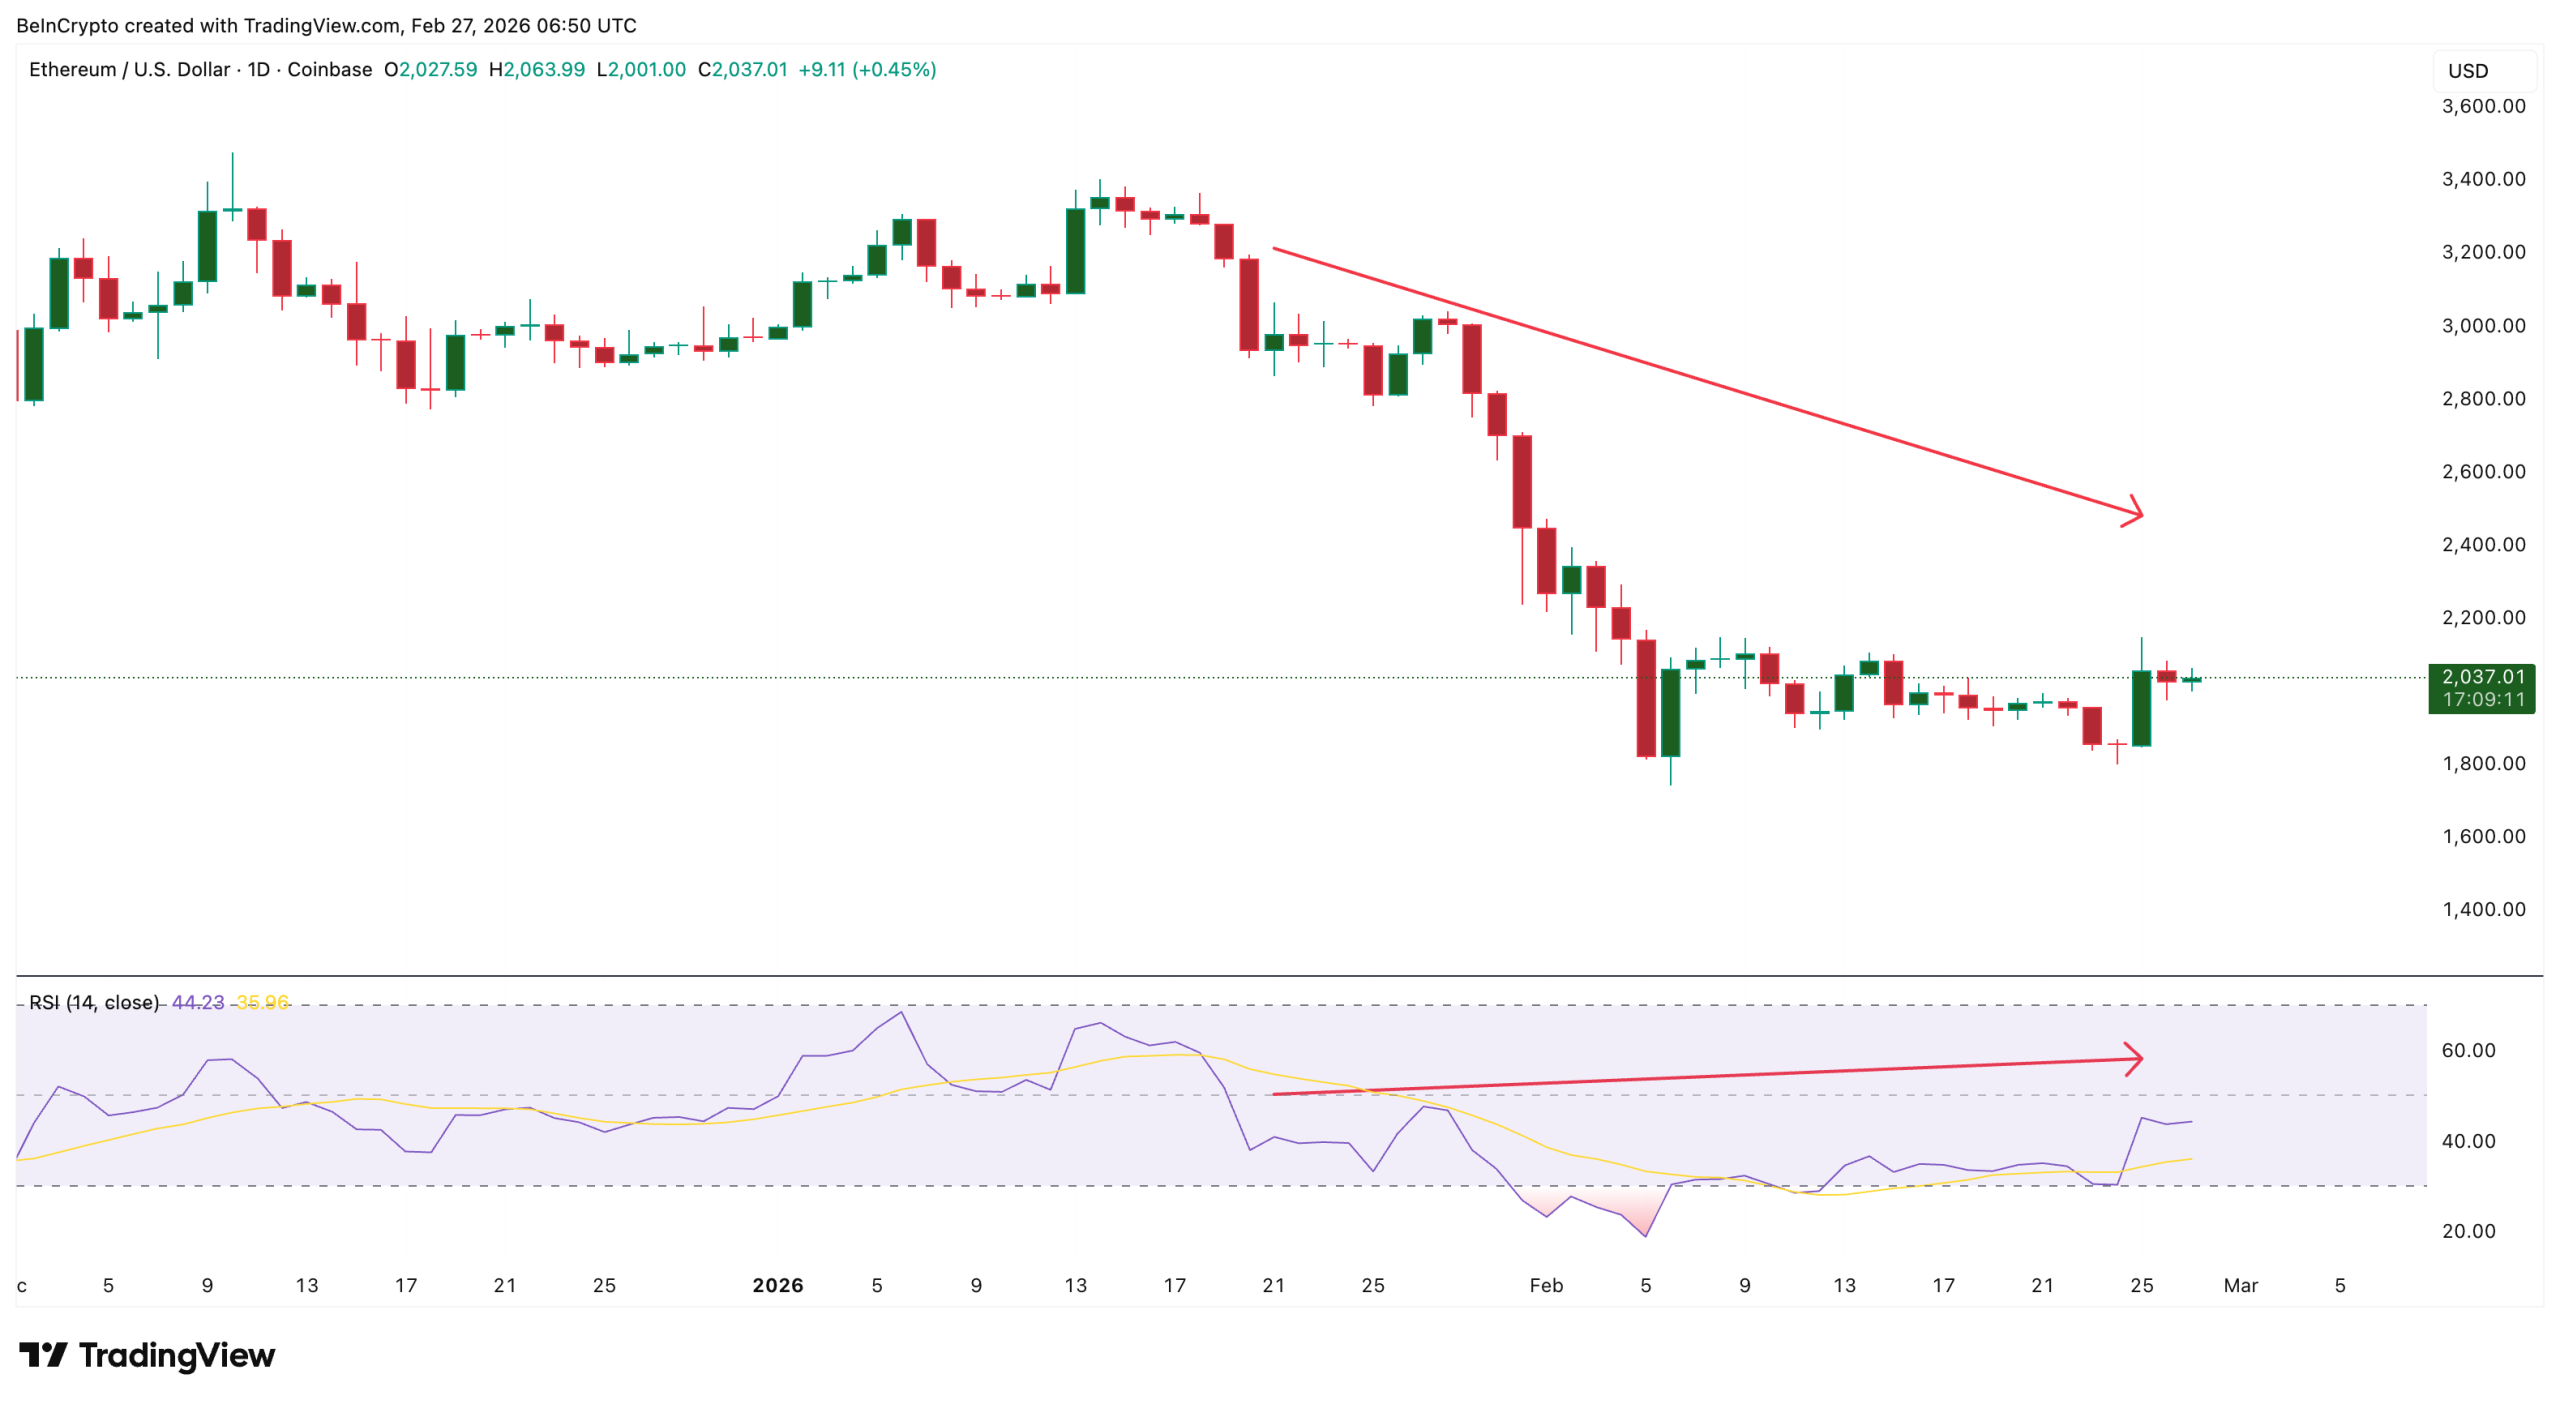
The first warning sign appeared through a hidden bearish divergence on the daily chart. Between January 21 and February 25, the Ethereum price formed a lower high. This means the recent recovery was weaker than the previous rally, confirming the broader downtrend remains intact.
At the same time, the Relative Strength Index (RSI), which measures momentum strength, formed a higher high. This creates a hidden bearish divergence. This pattern usually appears during downtrends and signals that the recovery is only temporary, with the larger decline likely to continue.

Want more token insights like this? Sign up for Editor Harsh Notariya’s Daily Crypto Newsletter here.
This signal becomes more important because Ethereum is already down about 32% over the past 30 days. That confirms the broader structure remains bearish. Now, on-chain data shows where this pullback could accelerate.
The Ethereum cost basis heatmap reveals a major support cluster between $1,870 and $1,890. Around 1.40 million ETH was accumulated in this range. This level is important because it represents the average buying zone for a large group of holders.
These holders are still in profit at current prices. But if Ethereum falls into this zone while fear increases, many may sell to protect their gains. This could weaken support and allow the pullback to deepen.
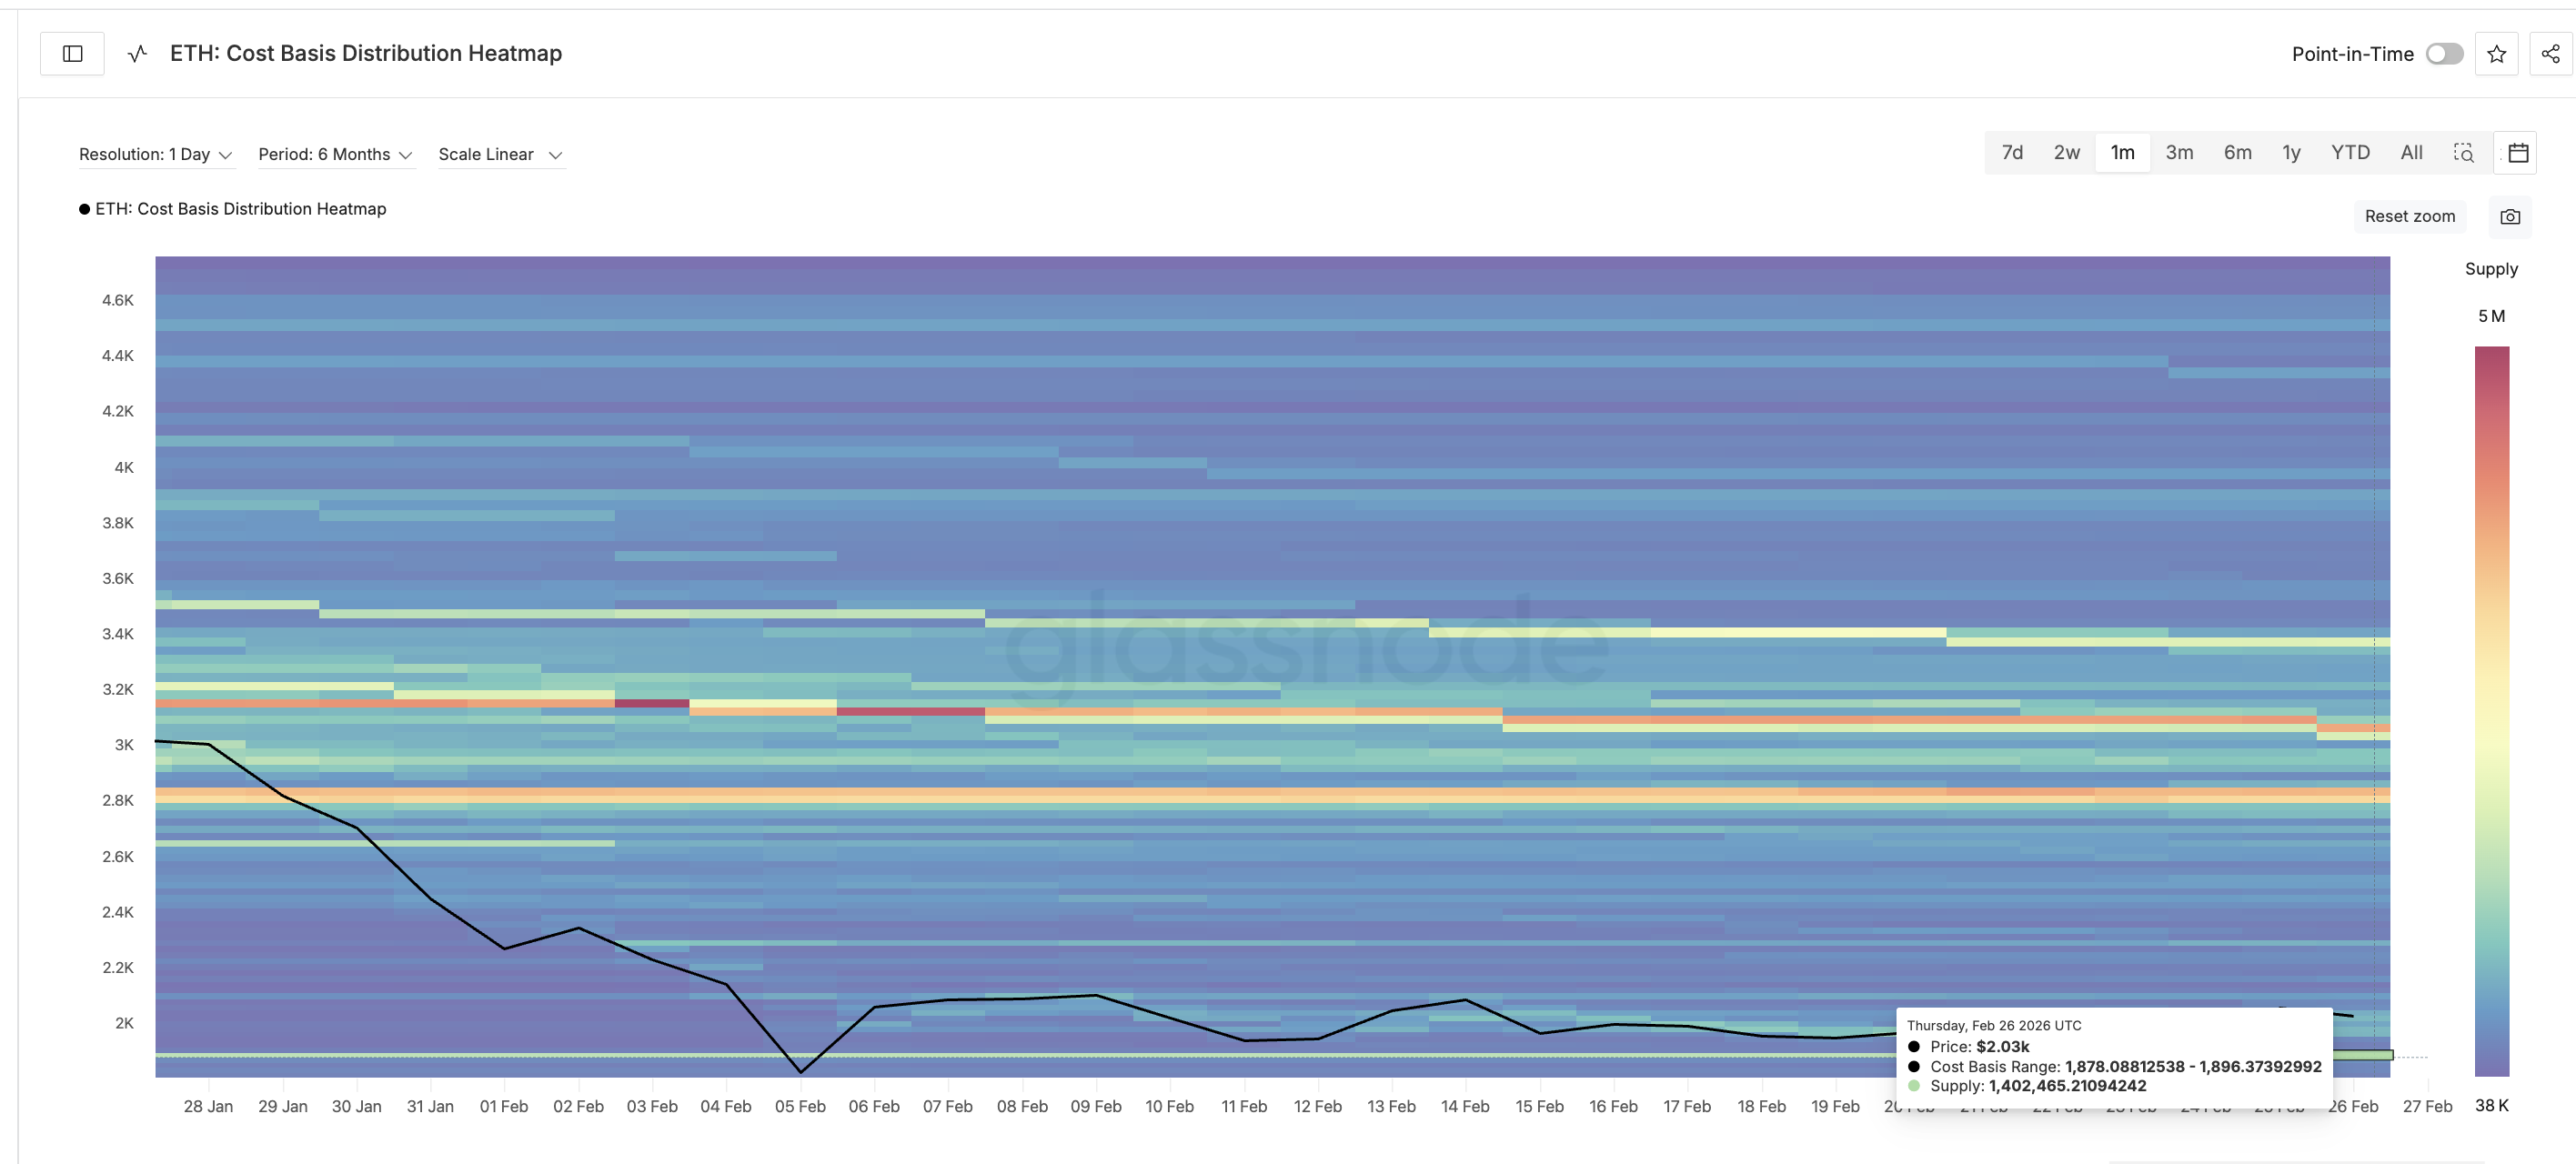
This makes the divergence warning more dangerous as a key support lies nearby.
Whale Selling And $1 Billion Long Exposure Create A Dangerous Conflict
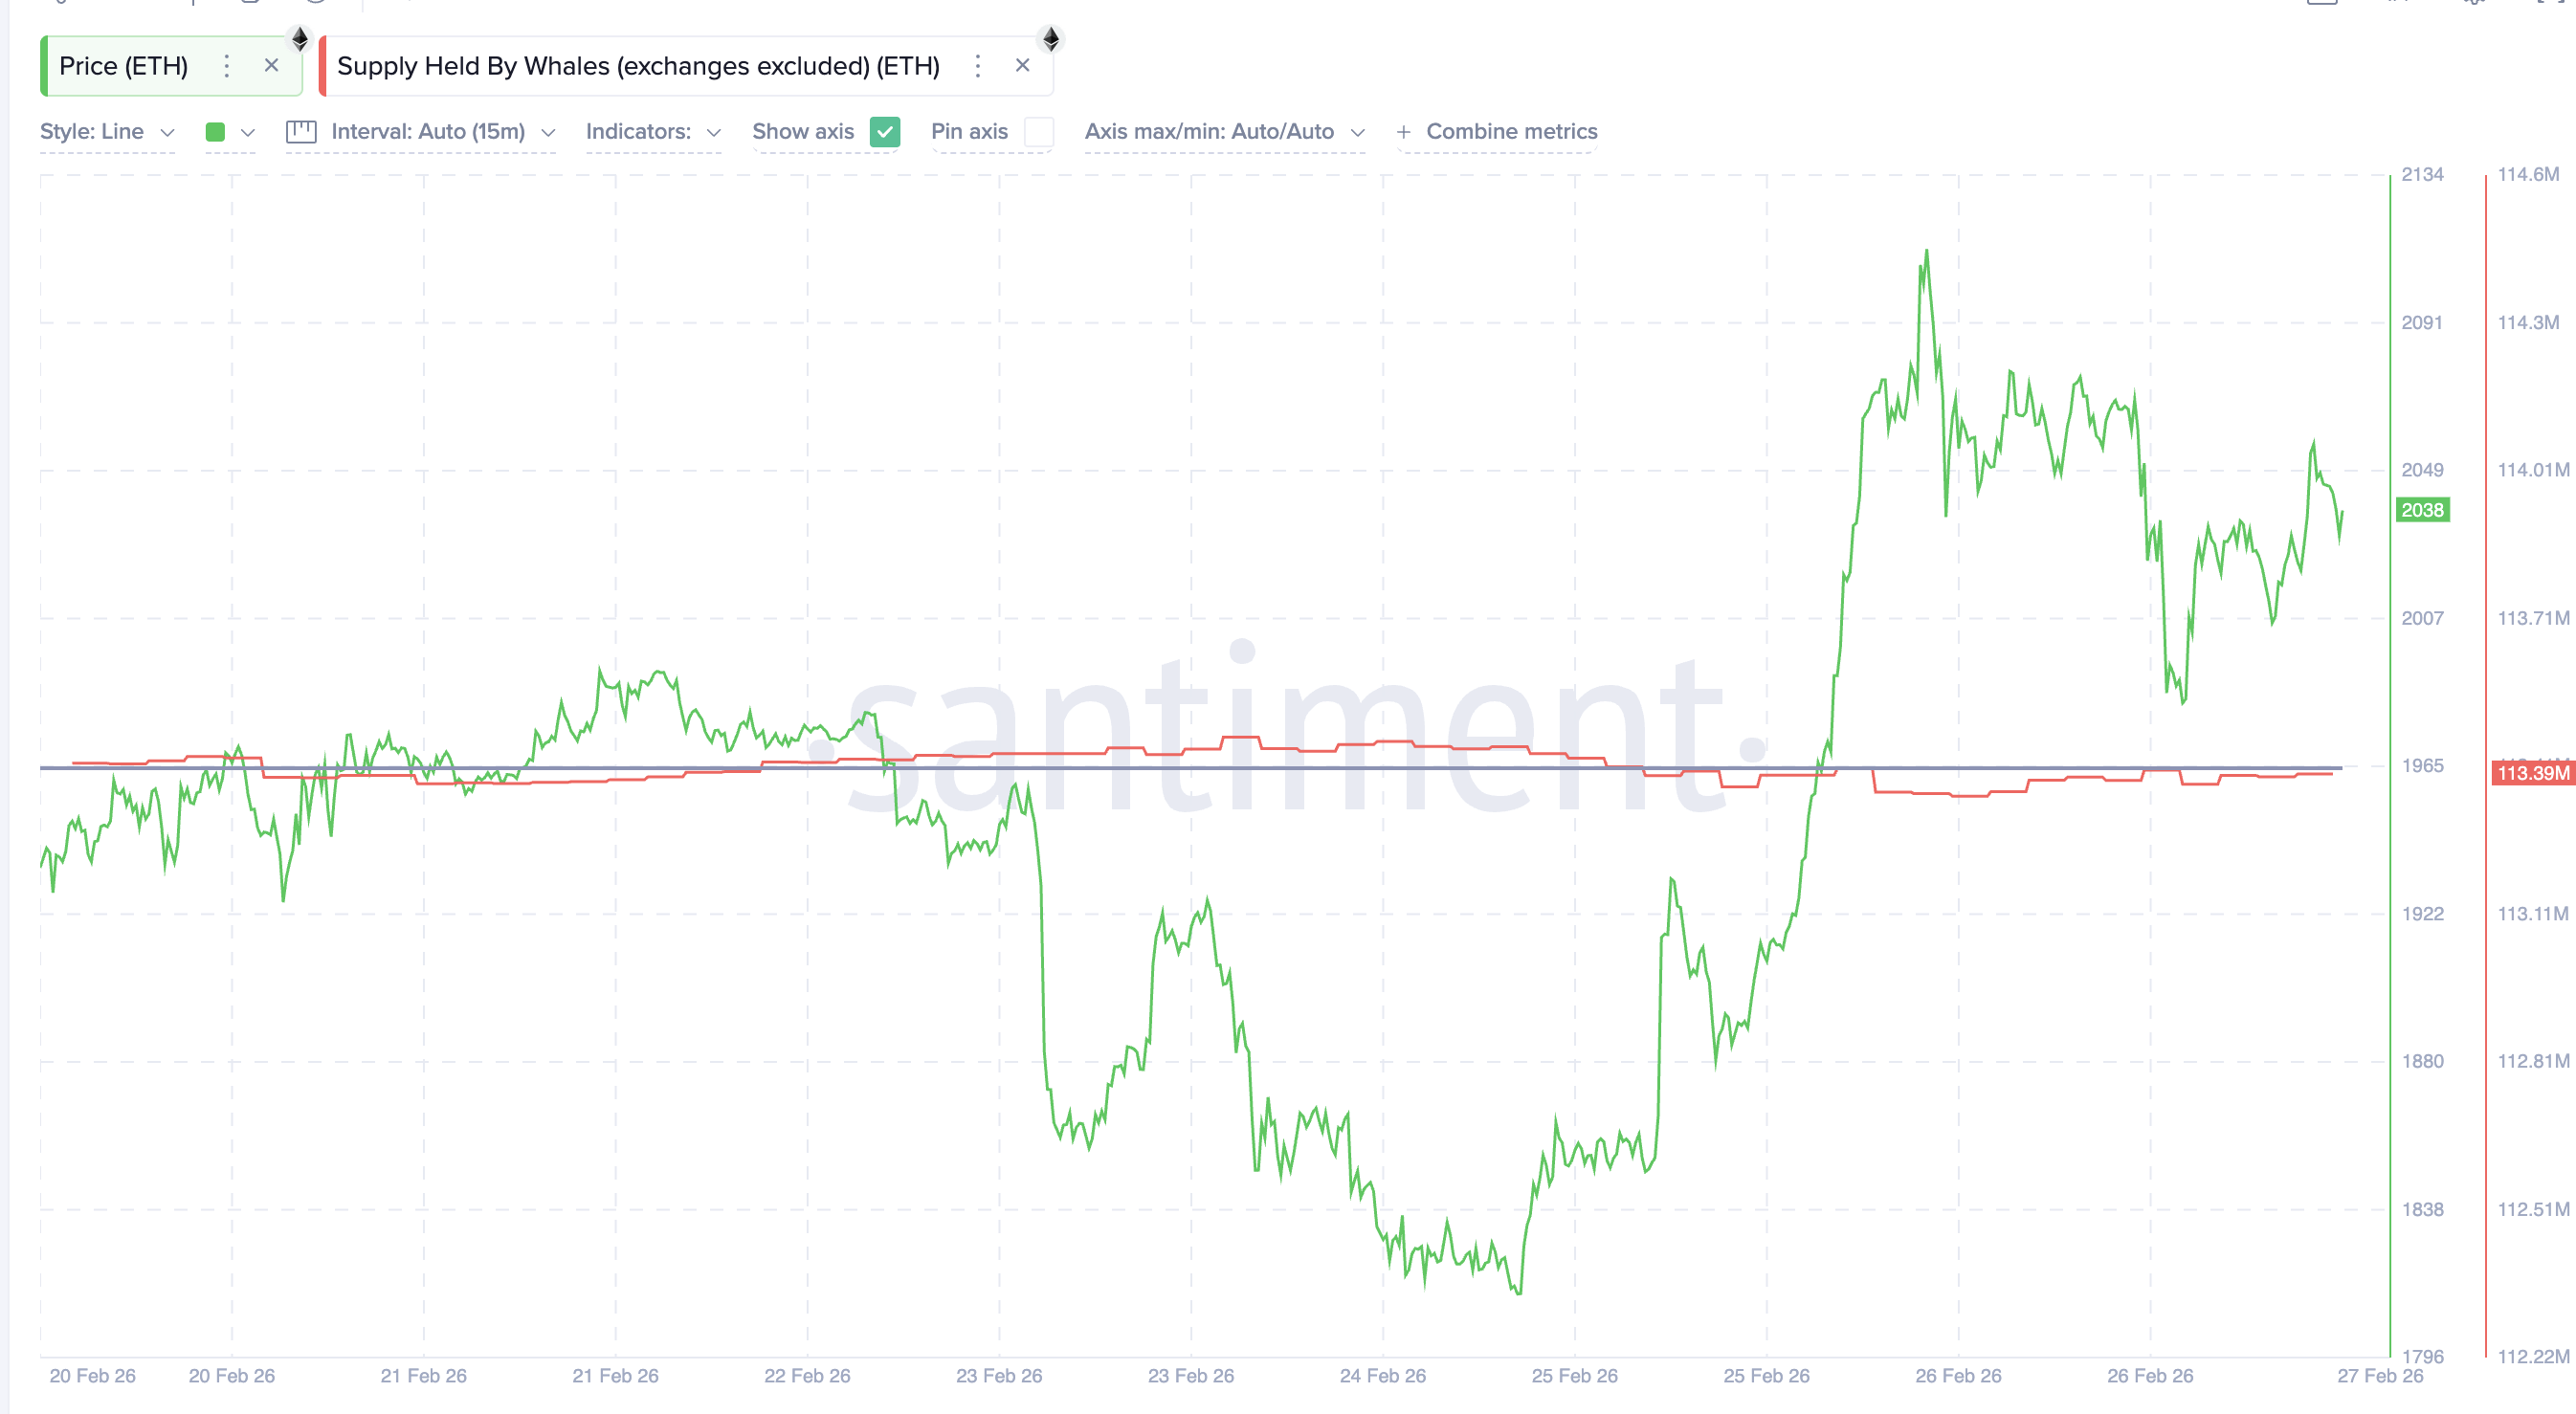
At the same time, large holders are starting to show caution.
Ethereum supply held by whales has dropped slightly from 113.41 million ETH on February 25 to 113.39 million ETH now. This is not a large drop, somewhere in the $40 million range, but it confirms that whales are no longer aggressively accumulating.
This matters because whale activity often signals future price direction. When whales stop buying or begin selling, it weakens market confidence. But derivatives traders are reacting in the opposite way.
Binance liquidation data shows cumulative long leverage has crossed $1 billion. Short leverage, in comparison, sits near $382 million. This means long exposure is nearly three times higher. Even more importantly, nearly $697 million of long leverage is concentrated near $1,870. Per the map, the risk starts developing if the ETH price drops under $2,015.
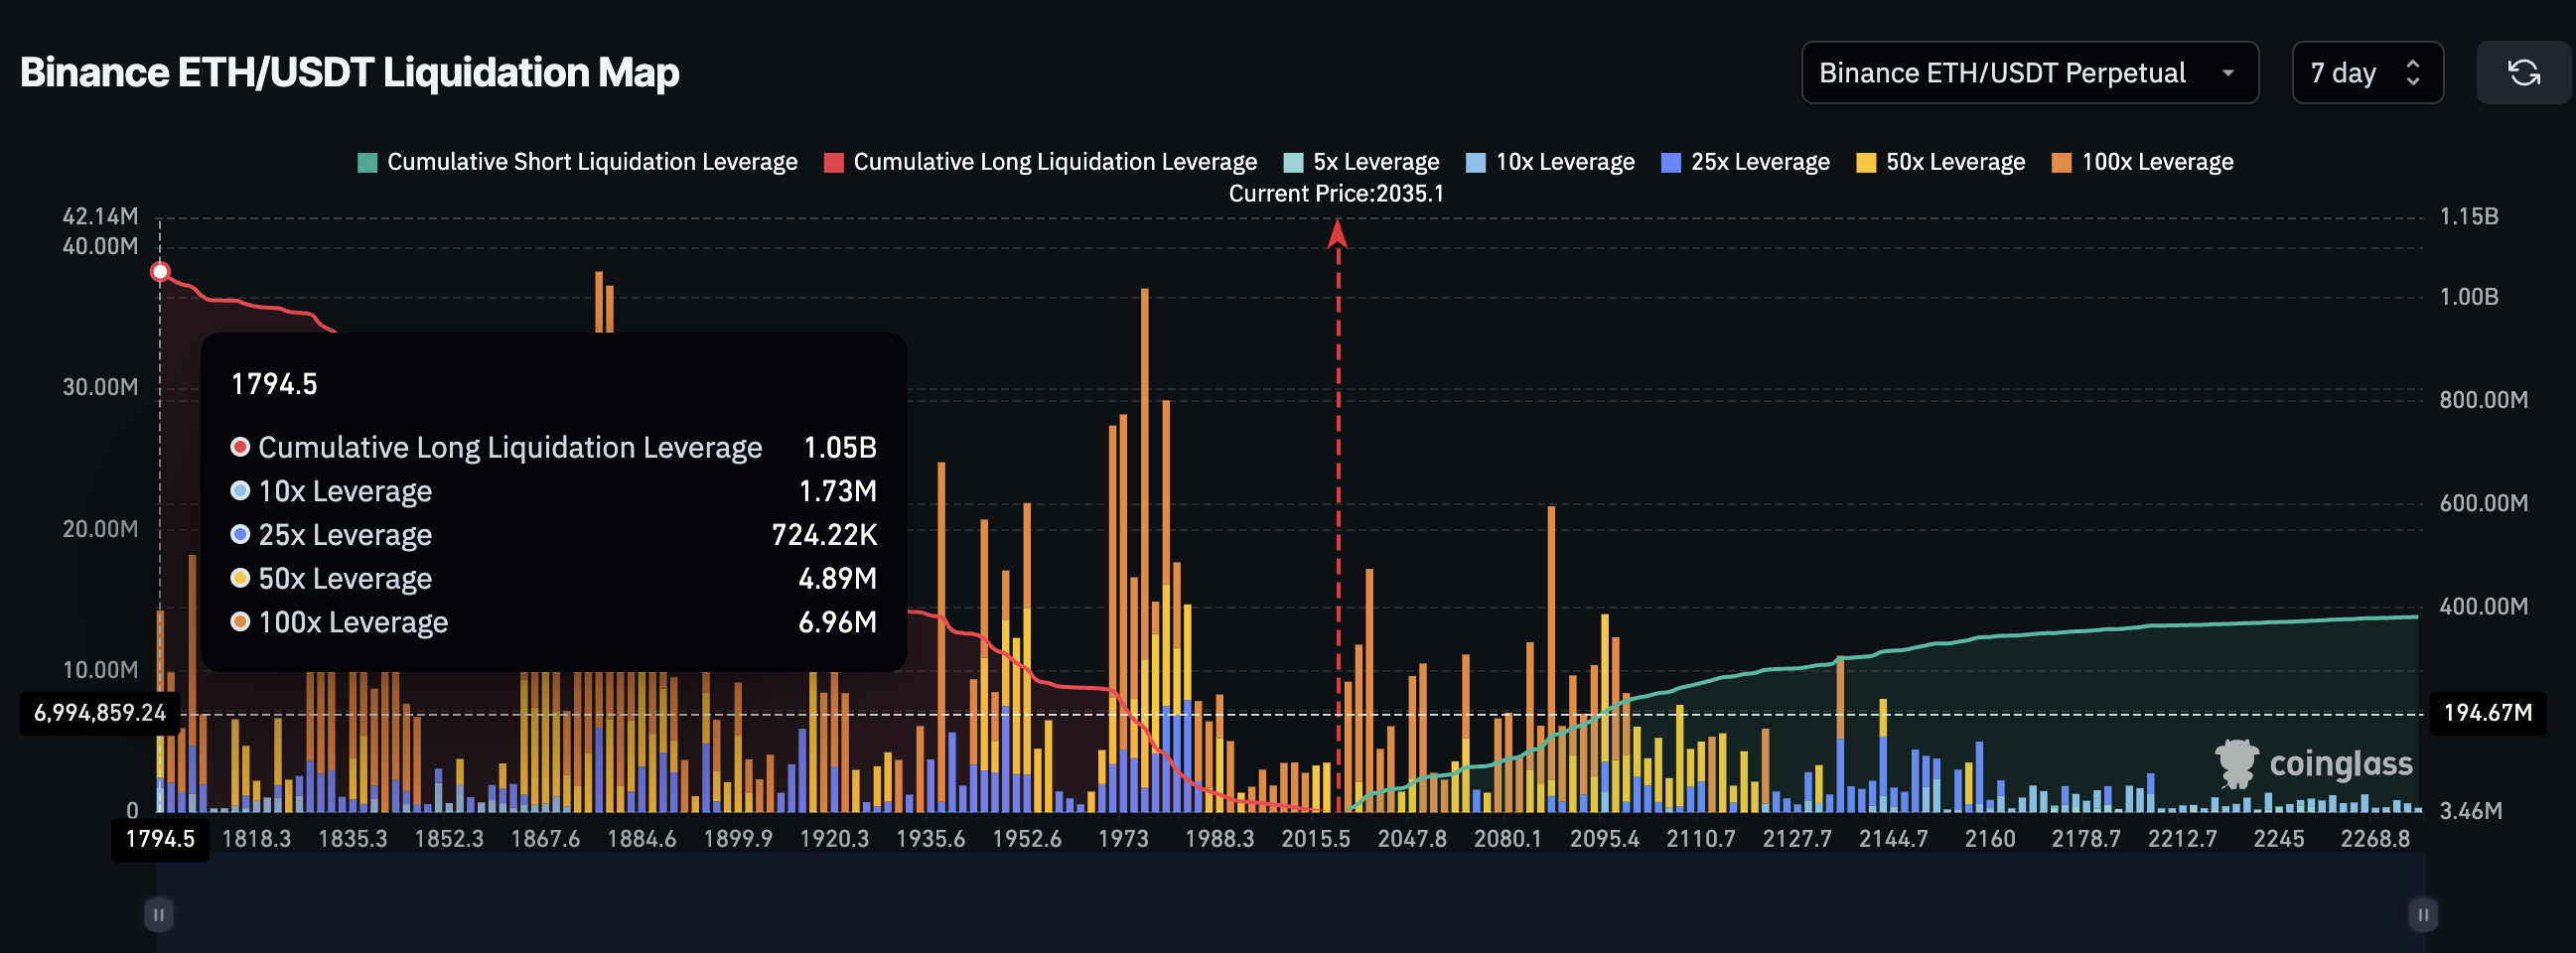
This level aligns almost perfectly with the cost basis cluster starting near $1,870. This creates a high-risk situation.
If Ethereum falls into this zone, holders may begin selling while leveraged long positions are forced to close. These forced liquidations would push the price even lower and accelerate the correction. That risk could be the reason why whales have stepped back, for now.
But despite these risks, traders are still betting on a breakout. The reason becomes clear in Ethereum’s price structure itself.
Ethereum Price Structure Explains Both The $2,600 Hope And The Breakdown Risk
Ethereum’s recent price structure is creating the optimism that derivatives traders are betting on. On the 8-hour chart, Ethereum is forming a cup and handle pattern. This is a bullish structure that often appears before upward breakouts.
The handle is forming now as a consolidation phase, something that the traders might be considering as a lull before the breakout.
The neckline of this pattern is sloping upward. An upward-sloping neckline strengthens breakout expectations, provided the price can break past key resistance levels. The critical ones are now revealed by the technical projections.
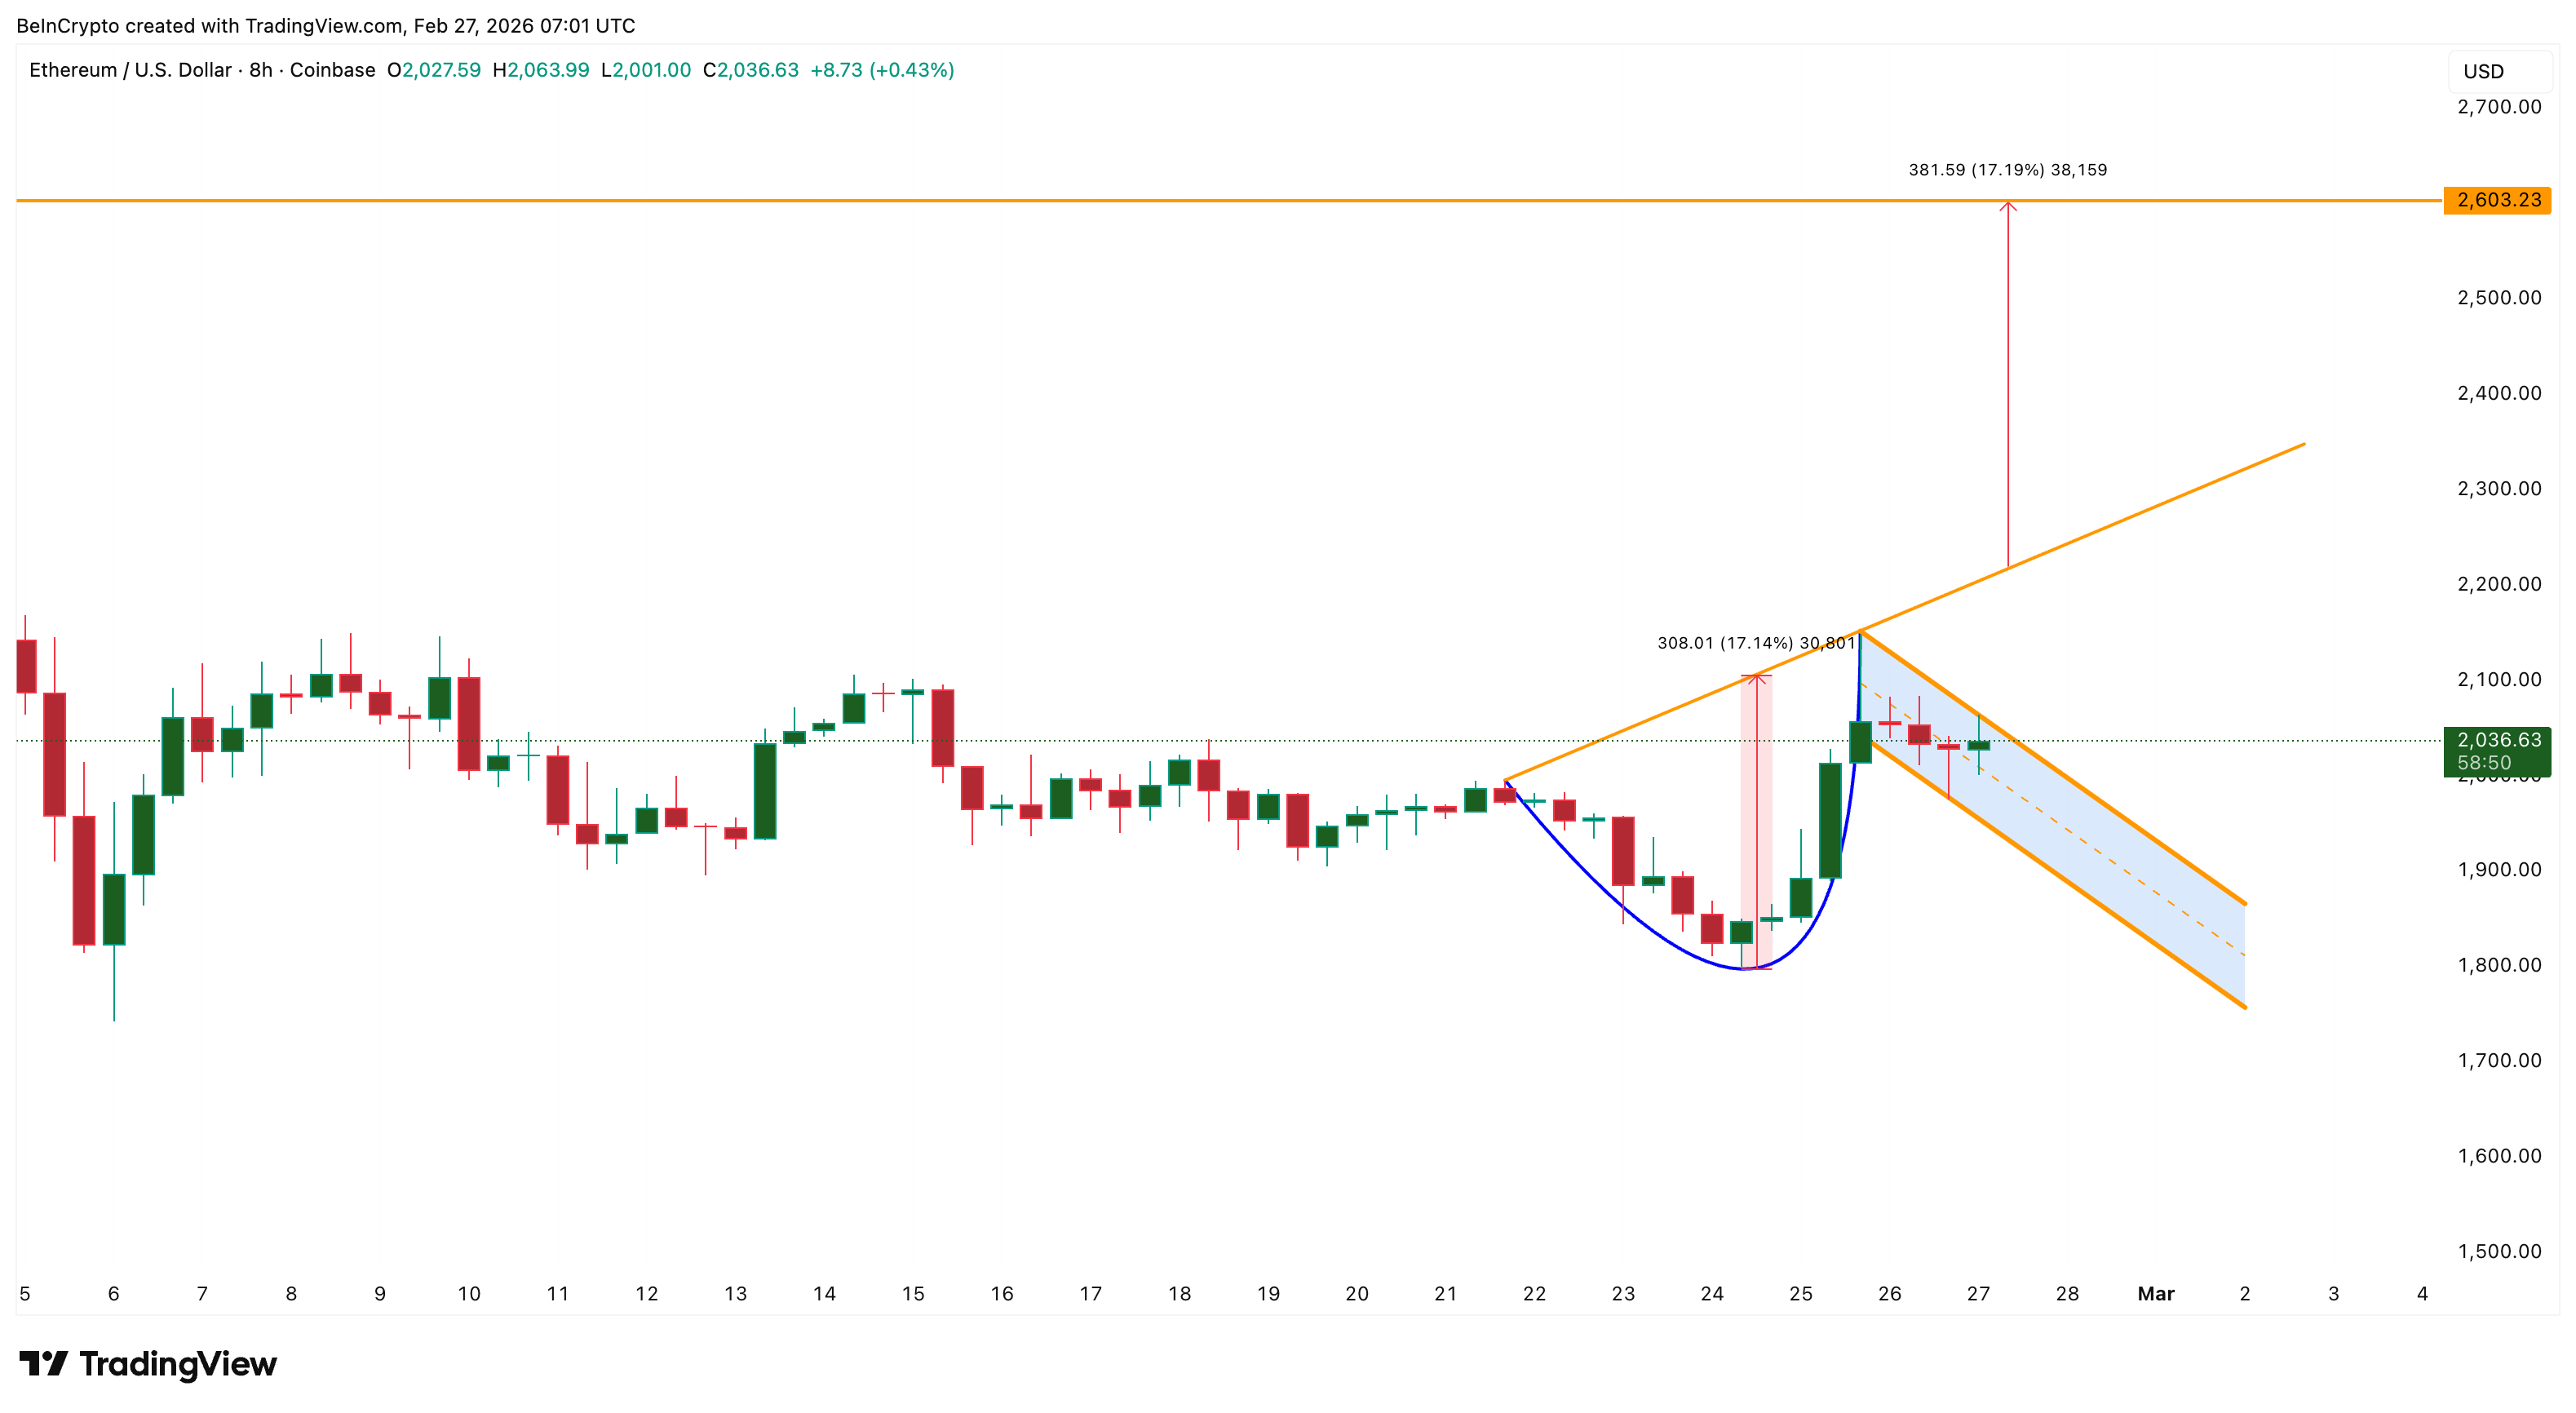
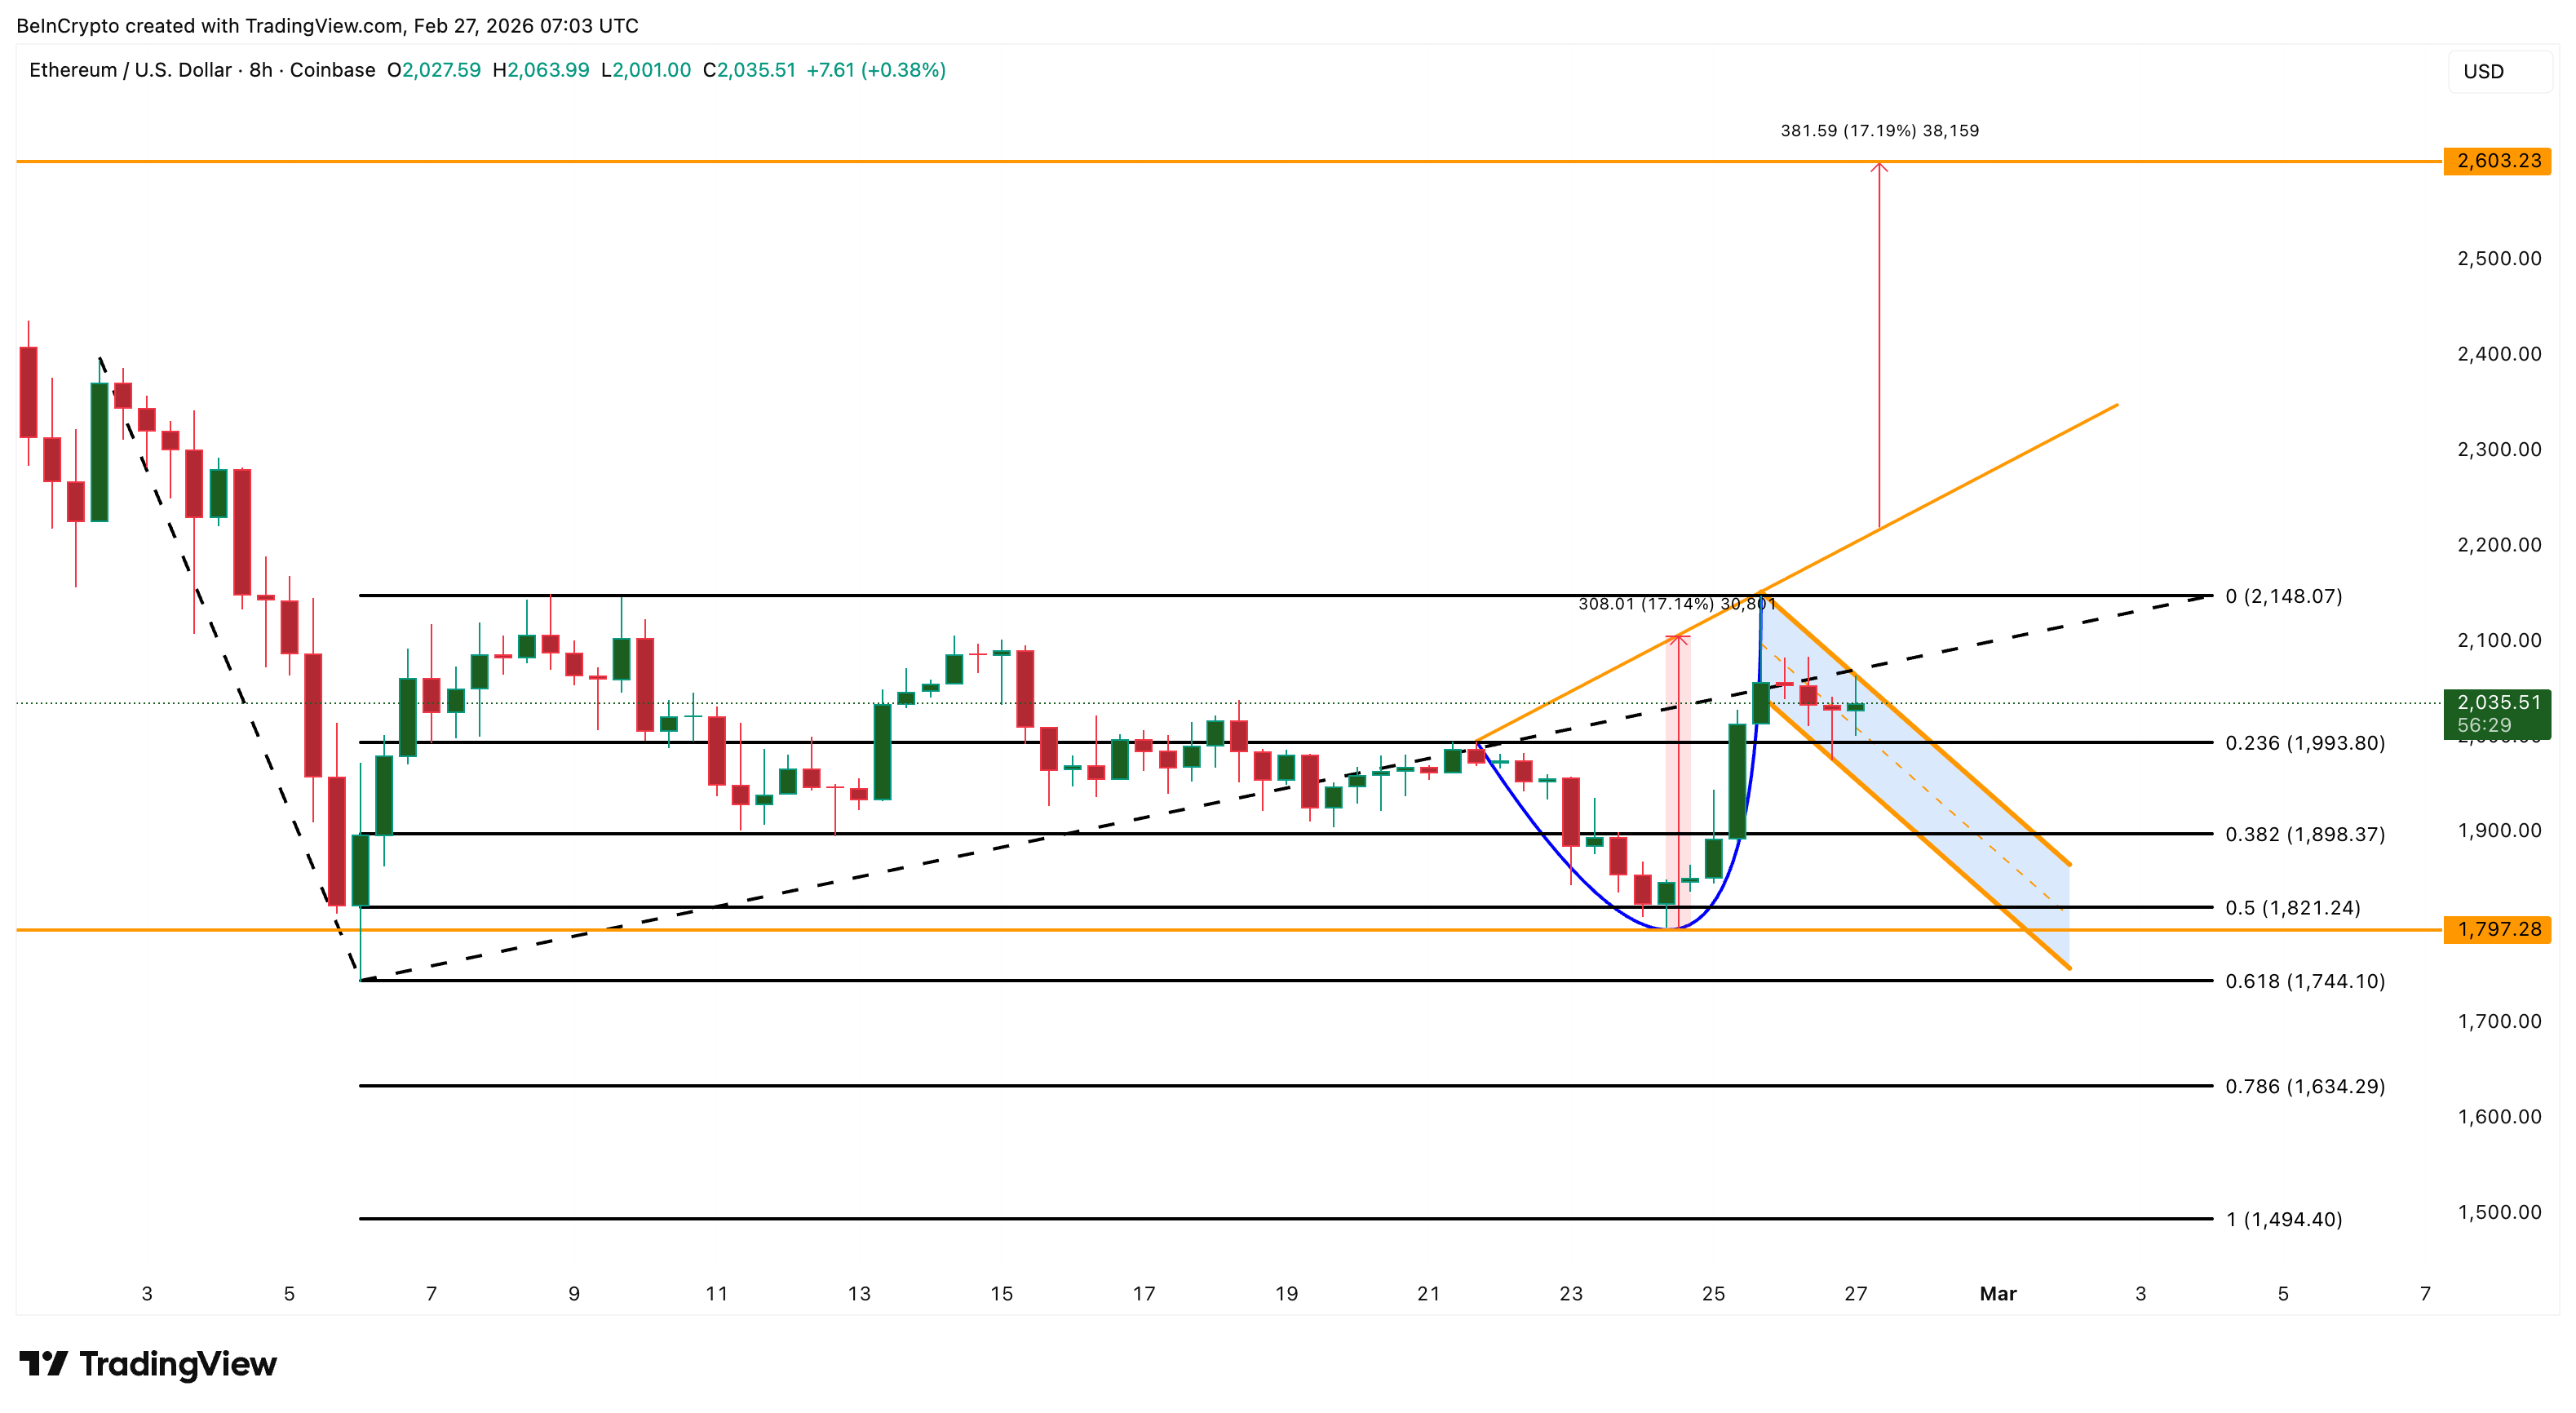
If Ethereum breaks above $2,140, the pattern breakout hopes rise. While the neckline will still be at a distance, the hopes of a 17% rally toward $2,600 would surface. This upside potential possibly explains why traders continue opening long positions despite growing warning signs.
But this optimism depends entirely on Ethereum holding its support levels. If Ethereum falls below $1,990, weakness begins increasing, although the pattern still survives.
A drop below $1,890 would become much more serious. This level sits directly at the top of the cost basis cluster between $1,870 and $1,890. Losing this zone would weaken holder confidence and expose Ethereum to a deeper decline.
Below $1,820, the bullish structure would begin failing. If Ethereum falls below $1,790, the cup and handle pattern would be invalidated completely. This would remove the bullish setup and could trigger large-scale long liquidations.
That is why the same price structure attracting $1 billion in bullish bets is also sitting directly above the most dangerous breakdown zone. Recovery is still possible. But Ethereum must break above $2,140 first. Until then, Ethereum remains stuck between breakout hope and breakdown risk.

Solana’s SOL (SOL) is down 72% from its all-time high of $295 and well below the $188 level seen during its spot exchange-traded funds (ETFs) launch in October 2025. Since early December 2025, spot SOL ETF inflows have slowed while the price retraced sharply over four months.
At the same time, Solana’s onchain volumes and revenue metrics continue to rank higher against competitors, raising questions on whether SOL’s longer-term price prospects tilt toward a return to its all-time high.
SOL ETF resilience aligns with network use
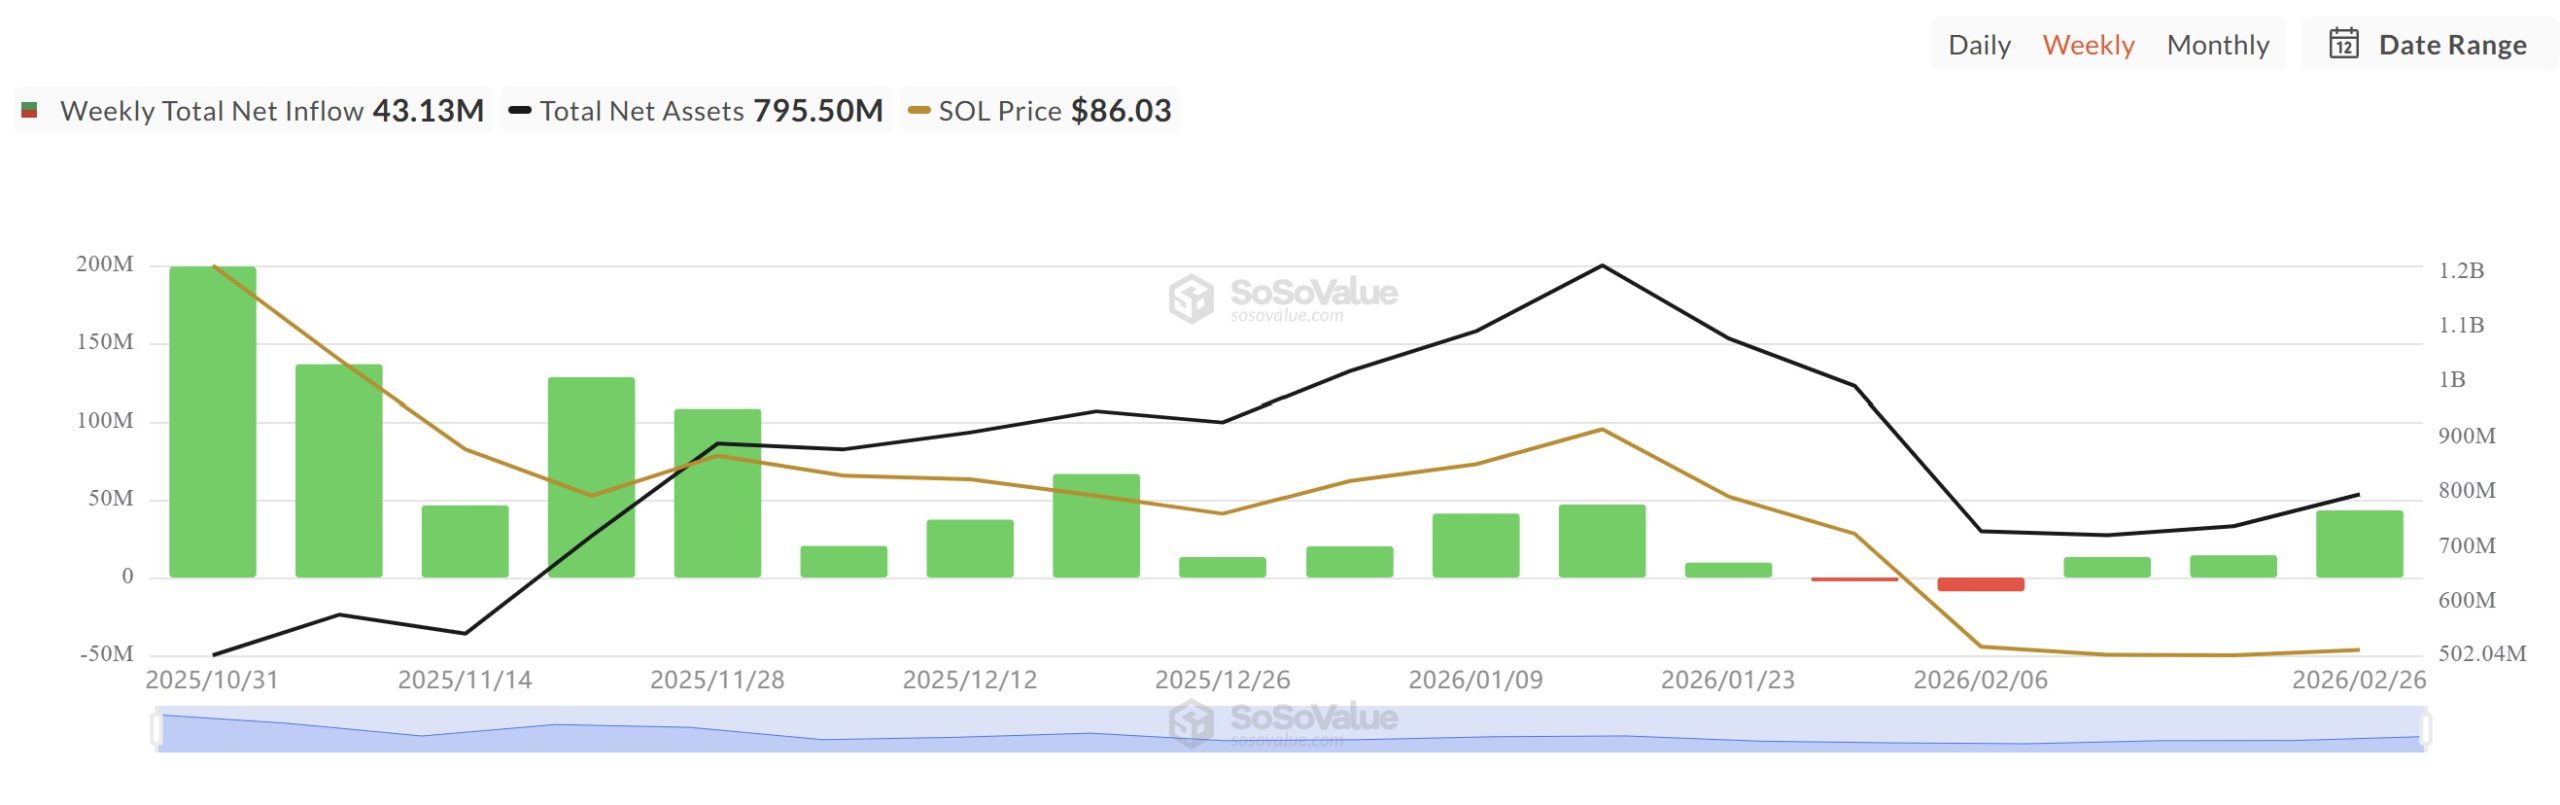
Spot SOL ETFs launched in late October 2025, drawing over $100 million in average net inflows during their first five weeks. Since December 2025, the weekly inflows have decreased, averaging $20 million to $25 million as SOL price slid to $86 in February 2026.

Across the four-month drawdown, the cumulative outflows total just $11.3 million over two weeks. Spot Bitcoin (BTC) and Ether (ETH) ETFs, by comparison, have logged four consecutive months of negative flows in the same period.
Solana’s network activity tells a different story than its price. Over the past 30 days, Solana processed $108 billion in decentralized exchange (DEX) volume, ahead of Ethereum’s $63.7 billion and Base’s $31.48 billion. Volumes in January reached $117 billion, exceeding those in December and November for the chain as well. The weekly averages since January 2025 have hovered near $20 billion to $25 billion.

In the last 24 hours, Solana generated $3.1 million in app revenue versus Ethereum’s $2.95 million. Active addresses stood at 2.17 million against 682,236, while chain fees reached $722,706 compared to Ethereum’s $356,438.
Solana’s RWA sector has also climbed to an all-time high of $1.71 billion, up 45% in 30 days, but Ether holds $15 billion of the $25.37 billion distributed asset value in that industry.
Related: ETH’s next big move depends on daily close above $2.1K: Data
SOL support cluster and valuation gap
Crypto trader Scient noted two macro areas that may shape a potential bottom. The first is the 0.75 Fibonacci retracement zone of $60 to $70, a level associated with deeper pullbacks within larger uptrends.

The second is a weekly demand fair value gap (FVG) between $22 and $29, an area of prior liquidity imbalance that preceded the explosive rally to $200 from $25.
For now, the structure remains capped as the price holds below the weekly resistance of $120.
On the weekly chart, SOL has already tested the demand zone of $51 to $80, aligning with that retracement pocket, and may head for a recovery from its current price.
UTXO Realized Price Distribution (URPD) data adds context. Over 6% of the supply last moved within the current price cluster, creating a dense cost basis zone. The next significant concentration, above 3% of supply, sits between $20 and $30.

From a valuation standpoint, SOL is near a realized supply cluster, while the ETF positioning has not unwound, and DEX turnover leads other chains despite its lower total value locked (TVL).
The price compression alongside consistent capital inflows and rising network use reveals a measurable gap between activity and valuation.
Whether that gap resolves through SOL’s price action depends on how the $51 to $80 level and the $120 resistance level interact with these factors over the coming months.
Related: Solana leads crypto recovery with 10% gain: Is $100 SOL price next?
This article does not contain investment advice or recommendations. Every investment and trading move involves risk, and readers should conduct their own research when making a decision. While we strive to provide accurate and timely information, Cointelegraph does not guarantee the accuracy, completeness, or reliability of any information in this article. This article may contain forward-looking statements that are subject to risks and uncertainties. Cointelegraph will not be liable for any loss or damage arising from your reliance on this information.
Bitcoin (BTC) and gold are showing very different profiles in 2026. Gold has climbed 153% since the start of 2024, while Bitcoin is down roughly 30% over the same stretch.
One analyst said that the gap lines up with steady growth in global money supply, cooling appetite for risky tech stocks, and falling crypto exchange balances. Together, these changes are shaping how both assets are trading in the market.
Rising liquidity and tech stock speculation fail to supercharge Bitcoin
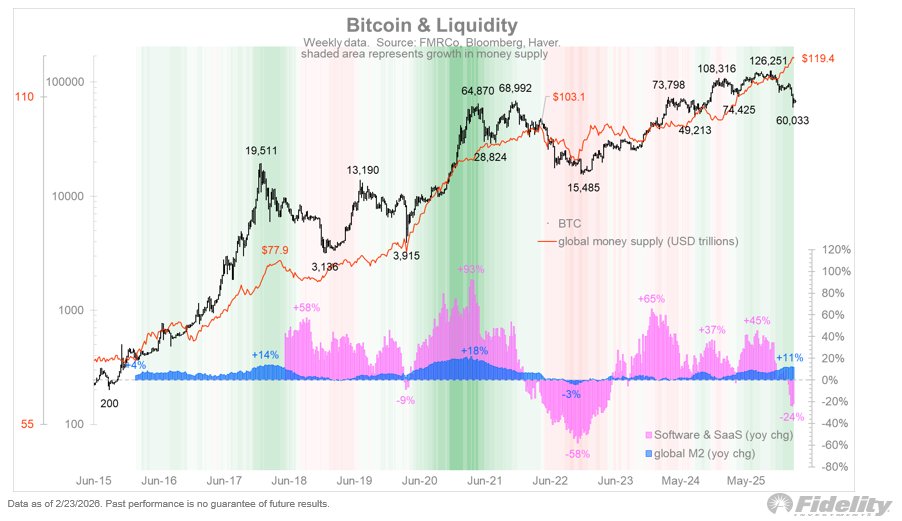
In an X post, Fidelity director of global macro, Jurrien Timmer said that gold has behaved as expected in a bull market, with sharp pullbacks attracting short-term buyers. Timmer described gold as a pure “hard money” asset that has tracked global money supply growth closely.
Bitcoin follows the global money supply growth over time, shown by the steady rise in global M2 (orange line). When M2 expands, BTC has generally trended higher. However, the chart shows that Bitcoin’s strongest rallies occurred when liquidity growth aligned with rising software and Software-as-a-Service (SaaS) stocks, each being a proxy for speculative appetite.

In 2017–2018 and again in 2020–2021, the software stocks posted gains of roughly 58% and 93% year-over-year, and Bitcoin price rallied sharply during those periods. In 2022, software stocks fell by around 58%, and Bitcoin experienced a deep drawdown even as the money supply levels stayed elevated.
The data shows that money supply growth supports the long-term trend, while shifts in tech-sector speculation tend to amplify or dampen Bitcoin’s price swings. This indicates that Bitcoin carries hard money exposure and high-beta characteristics, amplifying moves in both directions.
Timmer noted that liquidity is ample while speculative sentiment sits in a bear phase. In this scenario, gold and money supply have rallied together, while Bitcoin has struggled to keep pace.
Related: Bitcoin threatens new breakdown as US PPI sends gold to 1-month high
Gold draws demand on crypto exchanges
Demand on crypto-native platforms has also rotated toward gold-linked products. On Jan. 5, Binance launched 24-hour, 7-day gold futures trading. The cumulative volume of this product is approaching $35 billion, with more than $4 billion recorded on the most active day. The weekly volume averages about $4.7 billion, according to crypto analyst Darkfost.

Activity accelerated immediately after gold posted a two-day correction exceeding 20%. The spike highlights the demand for tokenized exposure to traditional hard assets within crypto venues.
At the same time, CryptoQuant data shows Binance’s total portfolio value across BTC, ETH, XRP, and major ERC20 and TRC20 stablecoins has fallen to roughly $102 billion. That marks the lowest reading since April 2025, down from about $140 billion in August 2025.

The $38 billion decline reflects lower asset prices and user withdrawals into self-custody during bearish volatility.
For Bitcoin, this points to reduced capital on exchanges, which may signal cautious trader positioning and thin near-term liquidity.
Related: Bitcoin to $30K? Analysts debate when and at what price BTC will bottom
This article does not contain investment advice or recommendations. Every investment and trading move involves risk, and readers should conduct their own research when making a decision. While we strive to provide accurate and timely information, Cointelegraph does not guarantee the accuracy, completeness, or reliability of any information in this article. This article may contain forward-looking statements that are subject to risks and uncertainties. Cointelegraph will not be liable for any loss or damage arising from your reliance on this information.


Disclosure: This article does not represent investment advice. The content and materials featured on this page are for educational purposes only.
A new report shows that 58% of Ethereum’s top-holder capital sits outside ETH, reshaping how dominance, concentration, and systemic risk are understood.
Summary
- Aggregated rankings reveal $426b in top-address holdings versus $189b under ETH-only measurement, with nearly half of the Top-1,000 addresses changing once tokens are counted.
- Smart contracts now control nearly 40% of top-holder capital, signaling a structural shift from individual holders to protocol-driven mechanisms.
- The newly introduced Printing-Press Index (PPI) shows DeFi balances cluster around ~50% self-issued tokens, highlighting rising wrong-way risk and potential systemic fragility in a token-heavy market.
Ethereum’s largest balances look dramatically smaller through an ETH-only lens. When address holdings are evaluated by total on-chain assets, ETH plus ERC-20 tokens and stablecoins valued in USD, the apparent capital at the top expands by more than 2x. This isn’t just a valuation tweak: once tokens and stablecoins are included, smart contracts and protocol-controlled entities represent over 40% of top-holder capital, fundamentally altering the visible structure of Ethereum’s market.
What to know
- Once addresses are ranked by total USD holdings (ETH plus ERC-20 tokens and stablecoins), the leaderboard captures far more capital than ETH-only rankings. In the Aggregated Top-10,000, total balances amount to $426B, compared with $189B when measured by ETH alone, a 2.2x difference in the capital visible at the top. The composition also shifts: in the Top-1,000, only 537 addresses overlap between the ETH-only and aggregated rankings.
- This view also changes who appears to control Ethereum’s largest balances. In the Aggregated Top-1,000, smart contracts account for nearly 40% of the capital. The shift implies that a large share of Ethereum’s economic weight sits in automated, protocol-controlled structures rather than externally owned accounts, altering how concentration, liquidity, and counterparty exposure should be interpreted.
- A Printing-Press Index (PPI) helps separate externally sourced value from self-minted balance-sheet mass. In DeFi-related balances, self-issued components cluster around 50%, a level that moves from “detail” to systemic fragility because even modest selling pressure can trigger wrong-way dynamics and accelerate a death-spiral-style unwind. A practical risk threshold often begins around ~20%.
About Ethplorer.io report
This report uses an aggregated ranking of Ethereum addresses based on totalBalanceUsd, which includes ETH, ERC-20 tokens and stablecoins valued in USD.
The Beacon deposit contract is excluded because it is a technical registry, not a wallet. It only logs staking deposits, meaning the ETH shown there is not withdrawable capital. While traditional rankings often display about 77.8M ETH (~$258B) at this address, the economically relevant staking balance is closer to ~36M ETH (~$118B) – roughly 2.2x lower.
Token contracts are also excluded to focus on economically meaningful holders.
Altseason already happened: Just not on the price charts
Crypto markets have moved beyond price discovery and into a phase of power discovery. Prices, market caps and TVL are transparent, but it remains unclear who actually controls liquidity, issuance and systemic risk across Ethereum’s on-chain economy.
In earlier cycles, this distinction mattered less. Through most of 2017–2021, ETH represented the majority of Ethereum’s economic value, while tokens and stablecoins played secondary roles. ETH price and market cap were often sufficient proxies for economic influence.
That structure has since changed. By 2022–2023, token-denominated balances reached ETH in economic weight.
In Ethereum’s aggregated rating, ETH no longer dominates portfolios
According to the Ethplorer.io report, the top addresses hold about $426.3B in total value. Of this amount, $177.5B is held in ETH, roughly 42%, while the remaining ~58% is denominated in tokens. Stablecoins alone account for around 26% of the average large-address balance.
Importantly, this is not just a matter of composition. When ranked by Aggregated value, only 537 addresses overlap with the ETH-based Top-1,000, meaning nearly half of the largest holders emerge only once tokens are counted.
In that sense, a form of “alt-season” may have already occurred, just not in the way markets traditionally expect. Dominance did not arrive through broad price appreciation or new all-time highs, but quietly, through balance-sheet accumulation.
This disconnect helps explain why the shift went largely unnoticed. Market participants were watching charts, while structural dominance was changing on-chain.
What this reveals is not a failed altseason, but a transformed one. Capital did not rotate into altcoins through explosive price appreciation. Instead, it expanded laterally, across a growing number of protocols, tokens and smart contracts, while prices remained largely range-bound.
When size stops signaling strength
Over the past year, Top-100 addresses did not preserve capital better than the broader Top-1,000. Despite expectations of superior information or positioning at the very top, concentration did not translate into structural outperformance.
By calculating the Median balance (~$122M), the Maximum balance ($35.2B), and their ratio (Max / Median ~290×) for the Aggregated Top-1000, a clear conclusion emerges. Taken together, these metrics point to a shift from market risk to system risk. A nearly 290× gap between the largest and median balances reflects structural concentration rather than distributed exposure. In such an environment, losses are driven less by adverse price movements and more by the liquidity conditions and mechanics of leading protocols.
For investors, the implication is practical rather than theoretical.
In a token-heavy, sideways market, strategies centered on capital preservation and yield capture, staking, liquid staking, restaking, and stablecoin-based returns appear more consistent with how large holders are actually positioning on-chain than speculative bets on illiquid tokens or leveraged exposure.
In other words, structural change is already reflected in balances, while expectations continue to follow charts.
If tokens now represent the majority of Ethereum’s economic weight, the more important question is no longer whether this shift exists, but what risks it introduces. Especially when a growing share of that capital is self-issued.
The Printing-Press Index: Measuring self-minted wealth
To separate externally sourced capital from value inflated by self-issuance, the Printing-Press Index (PPI) is calculated by Ethplorer as the share of a project’s own tokens within its total token-denominated portfolio:
PPI = Own tokens (USD) / Total tokens (USD).
*Only liquid assets are included. Spam tokens are filtered using Ethplorer.
At a group level, the results are uneven:
- DeFi protocols cluster around ~50% self-issued tokens (e.g. UNI, AAVE, MNT).
- Centralized exchanges average ~7% (BNB, CRO, LEO), but with notable outliers:
- Within the Bitget-linked address group, 31 related addresses hold roughly $11B in total assets, of which ~$3.25B is denominated in BGB, implying a group-level PPI of ~30%.
As Ethereum’s economy shifts toward tokens, balance size becomes a weaker indicator of risk. High PPI introduces a well-documented structural risk known as wrong-way risk, where a system’s stability depends on the value of its own token.
At low levels (roughly 10-20%), self-issued tokens function as a design feature. Beyond ~40-50%, the system enters a fragile regime: modest external pressure can impair confidence, compress liquidity, and trigger reflexive sell-offs characteristic of a death-spiral dynamic. At this point, PPI shifts from a descriptive metric to a signal of systemic vulnerability.
The UST-LUNA collapse represents the extreme case, with a PPI near 100%, where self-referential backing led to a reflexive unwind once confidence broke.
The FTX-FTT case shows that even ~40% self-issued exposure can destabilize a system when liquidity thins.
In both cases, balance-sheet size masked fragility rooted in token self-dependence.
In short
In a token-heavy market, what matters is no longer how big a balance is, but what it consists of. PPI provides a practical filter for assessing balance-sheet quality, separating externally sourced capital from value amplified through self-issuance. In a market where structural dominance has already shifted and prices remain range-bound, attention naturally moves from chasing expansion to managing exposure. For analysts and investors, monitoring how capital is composed, not just how much exists, becomes central to evaluating resilience, concentration and risk in a post-ETH-dominance landscape.
Smart contracts vs. HODLers: When risk moves from holders to mechanisms
When Ethereum was conceived in 2013, Vitalik Buterin framed it in his White Paper not as a currency system, but as a platform for self-executing smart contracts and decentralized applications. Aggregated on-chain data now shows that Ethereum’s largest holders increasingly reflect this architecture:
When viewed through an ETH-only lens, smart contracts appeared as a minority participant in Ethereum’s wealth distribution. Aggregated balances change that picture materially.
In the Aggregated Top, smart contracts control nearly 40% of total capital, roughly three times their share in ETH-only rankings.
This is not just a classification shift, it is a risk transfer.
When capital sits in externally owned accounts, risk is tied to individual behavior. When capital moves into smart contracts, risk becomes embedded in mechanisms: code logic, collateral design, liquidity assumptions and token economics.
For analysts and investors, this changes how exposure should be evaluated.
A large balance no longer implies resilience. What matters is whether that balance is externally sourced, or recursively backed by its own issuance. In a contract-dominated landscape, headline TVL or balance size can mask fragility rather than signal strength.
Operationally, this shifts analysis from protocol narratives to address-level balance inspection.
Evaluating a protocol increasingly means identifying its associated on-chain entities, aggregating their balances, and measuring how much of that capital is represented by the project’s own token. This process relies on address attribution and tagging rather than price charts alone.
This is where PPI becomes operational rather than theoretical.
Using tagged project addresses, available across modern blockchain explorers, analysts can quantify self-issued exposure directly. A PPI above roughly 20-30% signals rising wrong-way risk, where protocol stability increasingly depends on the market value of its own token rather than external capital.
Final insight: What the new structure of Ethereum actually means
Ethereum’s on-chain data no longer supports analysis based on ETH balances alone. Once capital is viewed in aggregated USD terms, a different market structure emerges, one that materially changes how exposure, dominance and risk should be interpreted:
- Smart contracts are no longer marginal holders, they are core economic actors.
With nearly 40% of top-holder capital controlled by contracts, risk increasingly resides in protocol mechanics rather than individual decision-making. - The altseason did not disappear, it changed form. Capital expanded across protocols and balance sheets rather than through price appreciation, explaining why structural dominance shifted without new All-Time Highs.
- Balance size is no longer a proxy for resilience. High PPI levels show that large balances can be internally reinforced by self-issued tokens, introducing wrong-way risk even in systems that appear well-capitalized.
- Exposure analysis must shift from narratives to balance composition. Evaluating protocols now requires inspecting aggregated balances, address attribution, and self-issued exposure, not just TVL, token price or brand perception.
Disclosure: This content is provided by a third party. Neither crypto.news nor the author of this article endorses any product mentioned on this page. Users should conduct their own research before taking any action related to the company.

TLDR:
- USDCx is a Cardano-native stablecoin backed 1:1 by USDC held in Circle’s xReserve smart contract.
- IOG will subsidize USDCx bridge fees for the first 10 days to reduce onboarding costs for new users.
- Minswap, Liqwid, and SundaeSwap are live integrations at launch, enabling real DeFi utility from day one.
- Users with USDC on Base can deposit and withdraw USDCx without interacting with Ethereum at all.
USDCx on Cardano is now live, marking a key step in the blockchain network’s push toward real-world financial utility.
Input Output Global (IOG), in collaboration with Circle, has deployed the technical infrastructure for the stablecoin.
The asset is backed 1:1 by USDC held in Circle’s xReserve smart contract. To ease onboarding, IOG will subsidize bridge fees for the first 10 days. Pentad and Midgard Labs supported the build, operation, and security of the infrastructure.
How USDCx Works on Cardano
USDCx is a Cardano-native token linked directly to USDC held in Circle’s xReserve smart contract. Users can deposit USDC on Ethereum and mint USDCx on Cardano at a 1:1 ratio.
They can also burn USDCx to release USDC back on Ethereum. This removes the need for third-party bridges, keeping the process straightforward.
A dedicated USDCx Bridge web application supports these transfers. Through the app, users can also swap USDC directly into Cardano-native assets via Minswap.
Centralized exchange users with USDC on Base can deposit and withdraw without touching Ethereum at all. This removes extra steps for a wider group of users.
IOG shared the news directly, noting the role of community funding:
“This integration was delivered through the Cardano ecosystem’s Critical Integrations program, funded by the community. Your support has helped bring tier one stablecoin infrastructure to Cardano.”
At launch, Minswap, Liqwid, and SundaeSwap are already integrated with USDCx. This means the stablecoin is usable from day one across major Cardano DeFi platforms.
Early on-chain activity is observable, which adds credibility to the rollout. The integration is built on real usage, not just a technical deployment.
Use Cases and Ecosystem Growth
USDCx on Cardano targets several key financial use cases across the ecosystem. Lending, borrowing, and liquidity provisioning all benefit from a dollar-backed stablecoin.
Stable yields become more viable when dollar-denominated assets are readily available. DeFi markets also function more efficiently with a trusted stablecoin in circulation.
Beyond DeFi, USDCx supports cross-border payments and remittances. Users in regions with unstable local currencies gain access to dollar-denominated value on-chain.
Real-world asset settlement also becomes more practical with a reliable dollar rail. Tokenized securities and credit instruments require this kind of stable backing to function properly.
For institutional participants, USDC carries established compliance standards across global markets. Bringing that infrastructure to Cardano lowers the barriers for enterprise adoption.
Treasury management and dollar-priced applications also become more accessible as a result. This aligns Cardano with existing financial flows rather than operating outside them.
The rollout is designed for long-term reliability, not a short-term initiative. Progress will remain measurable through on-chain activity as more platforms integrate USDCx.

TLDR
- Engie received full commercial approval for the Assu Sol solar complex in Brazil on February 13, 2026.
- The project has a peak capacity of 895 MWp and includes 16 plants with over 1.5 million panels.
- Brazil has faced recurring curtailment since 2023 due to grid bottlenecks and excess renewable generation.
- Engie is studying Bitcoin mining as a flexible offtaker to monetize surplus electricity.
- The company estimates it would need about two years to deploy any mining or storage solution.
Engie has secured full approval for its Assu Sol solar complex in Brazil and has begun studying Bitcoin mining to monetize surplus electricity. The project reached commercial clearance on February 13, 2026, and now operates as the company’s largest solar asset worldwide. Engie plans to evaluate mining and battery storage to capture value from recurring grid curtailment.
Brazil Grid Bottlenecks Drive Search for Flexible Demand
Brazil has expanded wind and solar generation faster than its transmission infrastructure has developed, and that gap has led to recurring curtailment since 2023. Grid operators have forced plants to shut down during oversupply periods, and producers have lost revenue on unused megawatt-hours. Engie now seeks a flexible demand solution that can consume excess electricity behind the meter and reduce financial losses.
The Assu Sol complex carries 895 MWp of peak capacity and 753 MW of installed capacity across 16 plants. The BRL 3.3 billion project spans more than 1.5 million photovoltaic panels in northeastern Brazil. Brazilian authorities granted full commercial approval on February 13, 2026, and Engie confirmed operational status.
Bitcoin Mining and Storage Under Review
Engie is assessing whether Bitcoin mining facilities can operate as a flexible offtaker for surplus power. Mining rigs can switch on and off quickly, and operators can match activity with excess generation periods. The company has stated that it does not seek speculative crypto exposure but aims to protect plant revenues.
Eduardo Sattamini, Engie’s country manager in Brazil, addressed the timeline for any deployment. He said, “We would need around two years to develop and implement a mining or storage solution.” He also confirmed that Engie continues to evaluate utility-scale battery systems as an alternative option.
Brazil’s foreign trade council has reduced import duties to zero on high-efficiency mining equipment through January 2028. That temporary measure lowers capital expenditure requirements for energy-linked mining operations. Engie is reviewing both mining and storage models before making a final investment decision.
The company has framed the initiative as a revenue management strategy tied to curtailed output. Engie plans to operate any mining capacity only during periods of excess supply. Company officials have confirmed that studies remain ongoing and that no final commitment has been announced.
Assu Sol now stands as Engie’s largest solar asset globally, and the company continues to monitor grid conditions in Brazil. Executives have stated that the project must align with regulatory requirements and operational standards.
Solana price remained under pressure this week, continuing a downward trend that started in September last year when it peaked at $252.
Summary
- Solana price continued its strong downward trend this week.
- Key network metrics like active addresses and transactions continued soaring.
- Its ETF inflows continued rising and is beating Ethereum.
Solana (SOL) token dropped for eight consecutive weeks and is now hovering near its lowest level since January 2024. It has dropped by over 73% from its highest level in January last year.
The ongoing Solana price crash continued even as the network growth gained momentum and beat Ethereum (ETH) on key metrics.
For example, data compiled by SoSoValue shows that spot Solana ETFs added over $61 million in inflows this month. They have added assets in the last five consecutive months, bringing the cumulative inflows to over $932 million. These funds now hold over $795 million in assets under management.
On the other hand, Ethereum ETFs shed over $326 million in assets in February. They have shed over $2 billion in the last four months, bringing the cumulative net assets inflows to over $11.6 billion.
Solana is also beating Ethereum in other areas, by far. For example, data compiled by Nansen shows that Solana handled over 2.6 billion transactions in the last 30 days, while Ethereum processed 66.7 million.
Similarly, Solana made over $25 million in fees, while Ethereum made $18 million in the same period. These fees made it the second most profitable chain in the crypto industry after Justin Sun’s Tron.
Meanwhile, the number of active addresses in Ethereum dropped by 5.3% in the last 30 days, while Solana’s rose by 30% to over 114 million.
Solana price prediction: Technical analysis
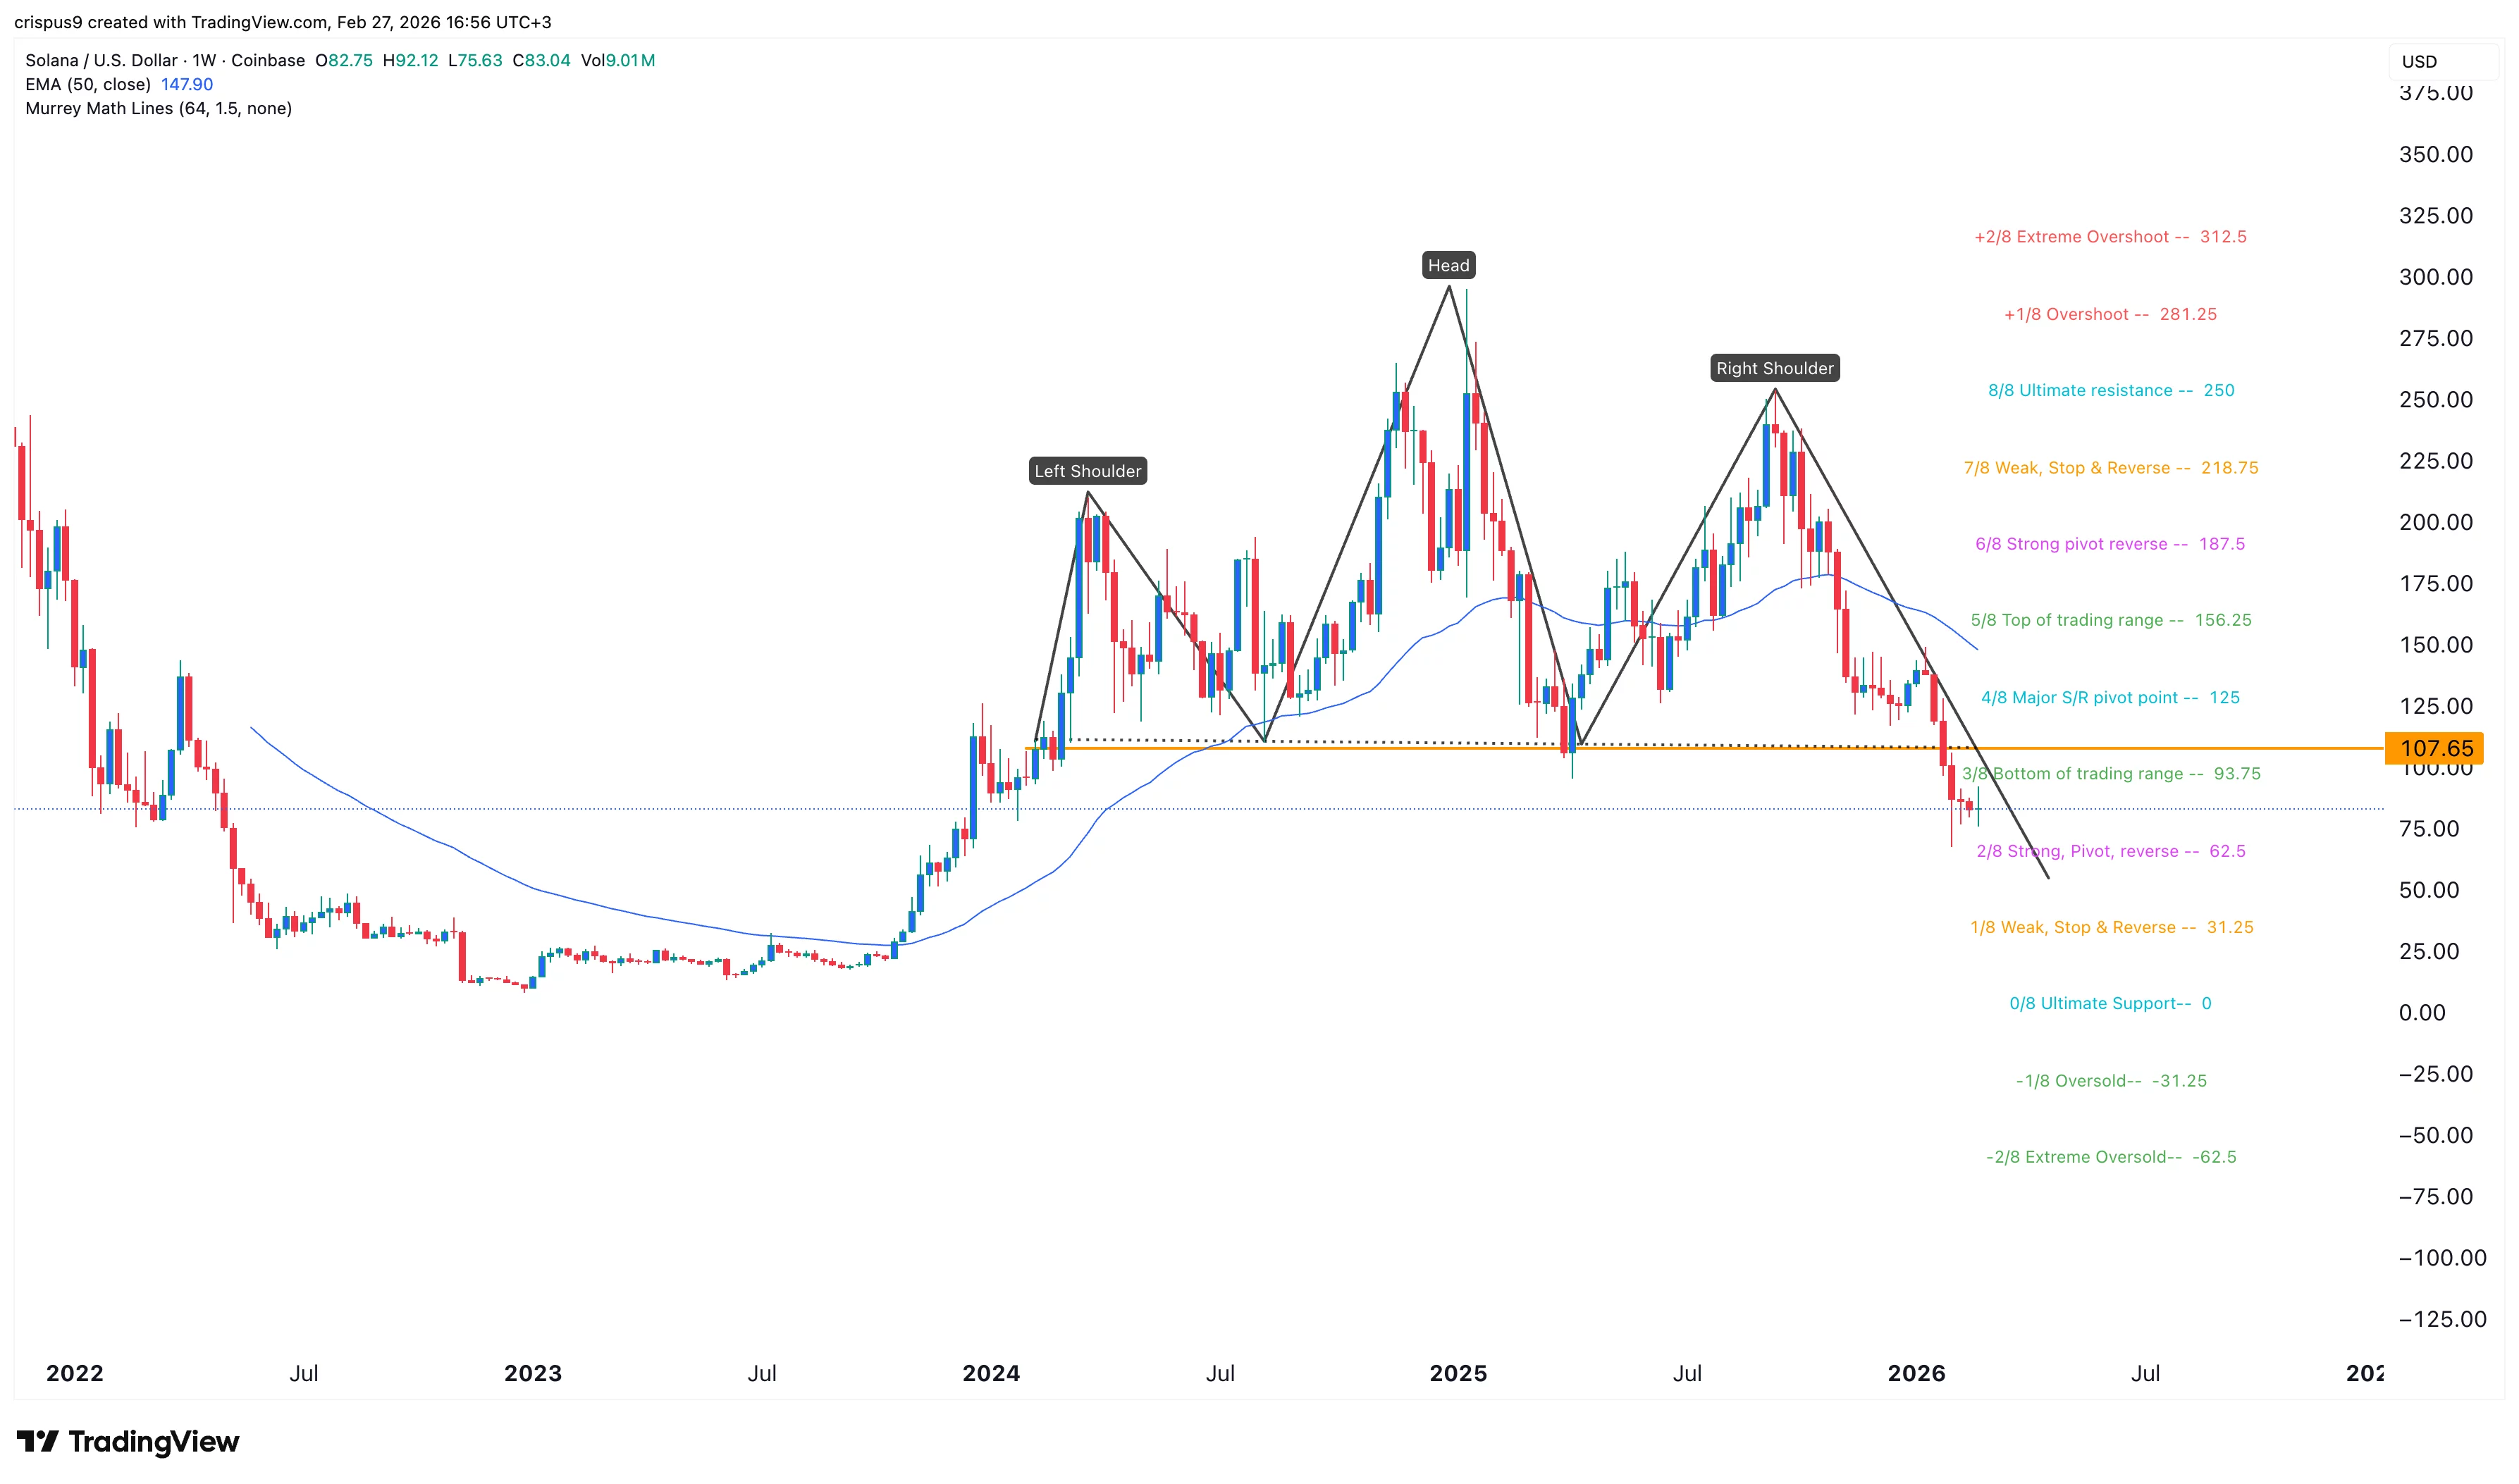
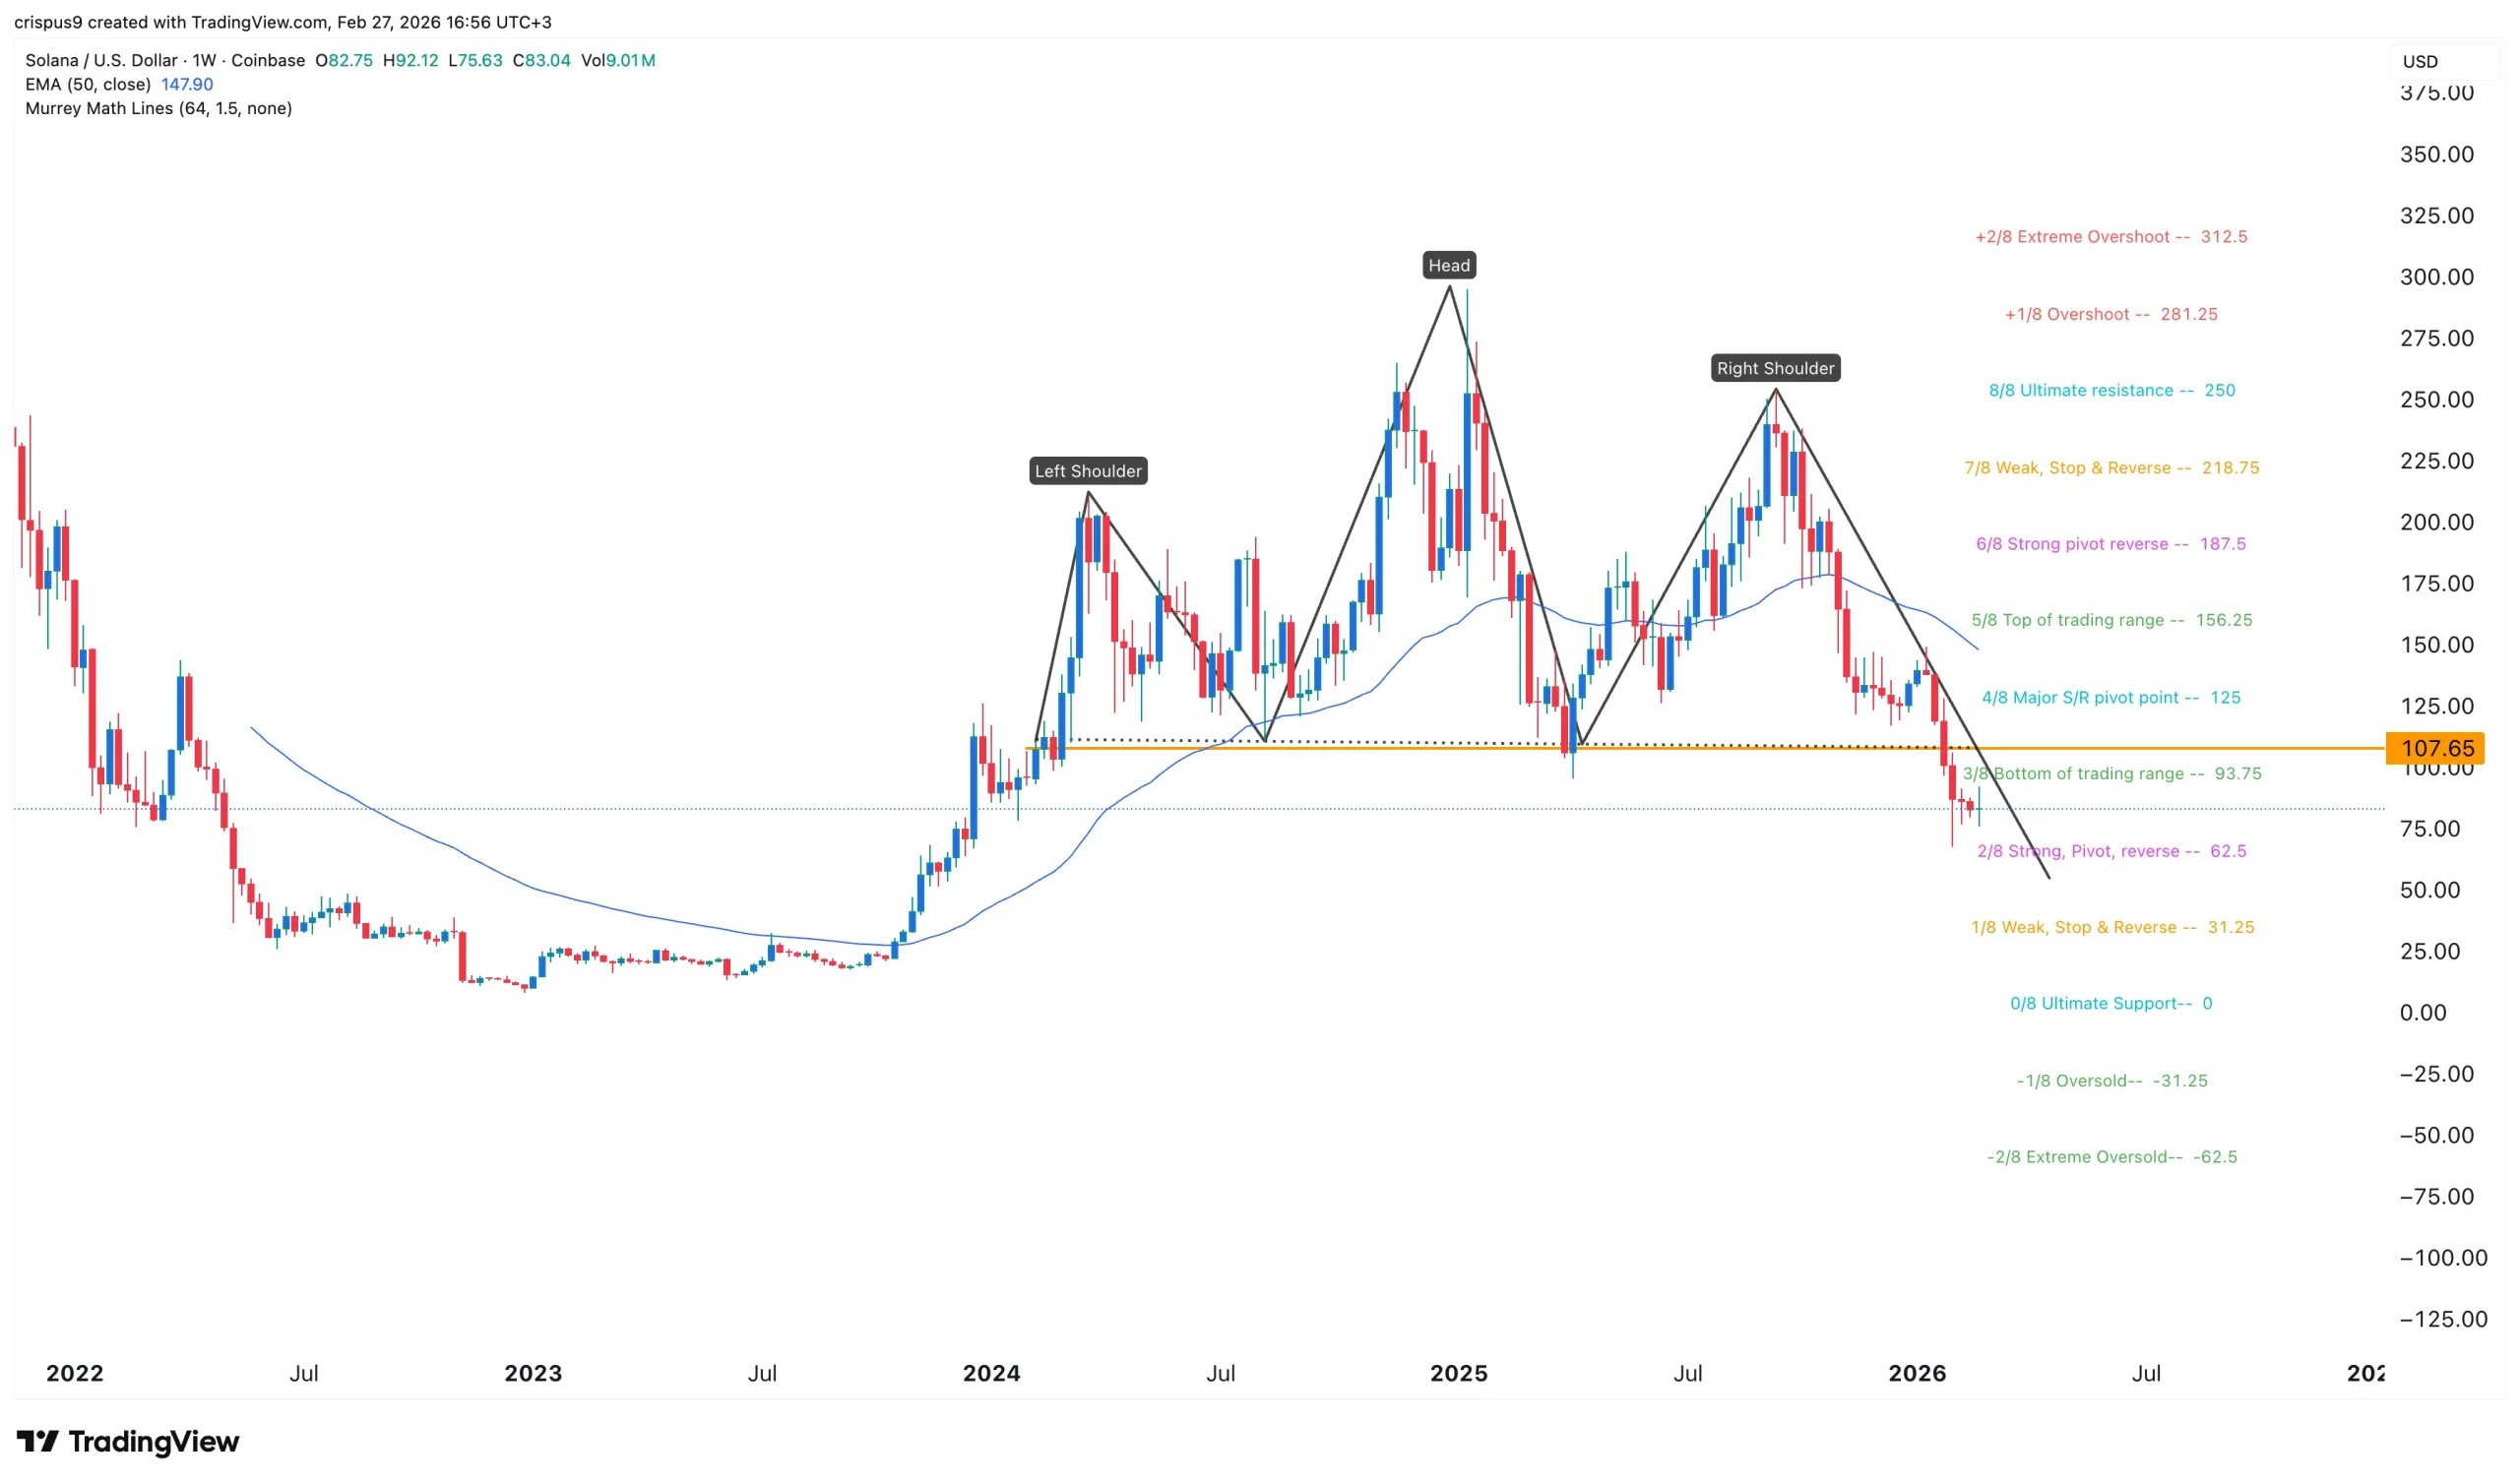
The weekly timeframe chart shows that SOL price has remained in a bear market in the past few months. It has dropped below the key support level at $107, the neckline of the head-and-shoulders chart pattern.
The token has dropped below the key support level at $93.75, the Bottom of trading range of the Murrey Math Lines tool. It also remains below the 50-week and 100-week Exponential Moving Averages.
Solana also remains below the Supertrend indicator. Therefore, the token will likely continue falling, potentially to the Strong, Pivot, and Reverse of the Murrey Math Lines tool at $62.5.
The coin will then bounce back when the ongoing crypto market crash fades, which may happen in the next few weeks or months.

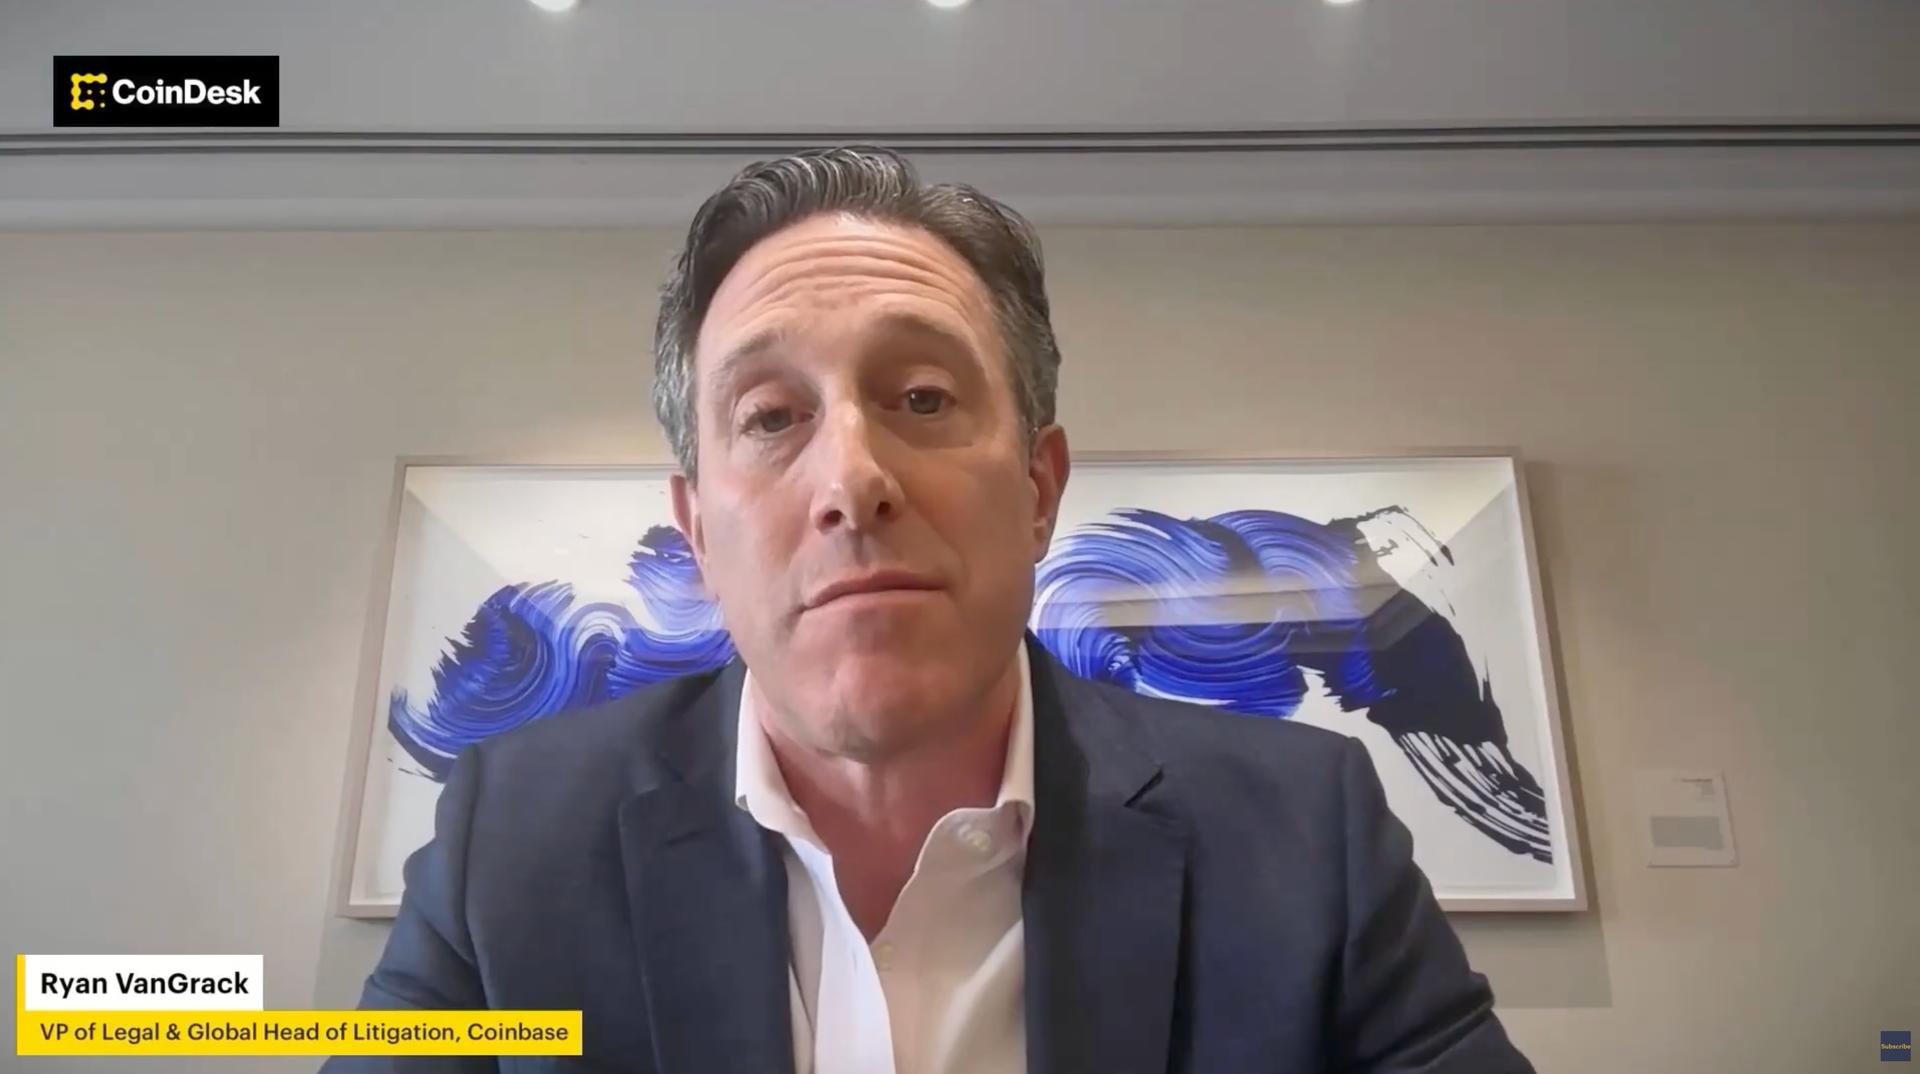
Why it matters: Ryan VanGrack, Coinbase’s VP of legal and global head of litigation, is sharpening Coinbase’s challenge to state regulators, saying they are trying to rewrite Congress’ authority over derivatives.
- Coinbase has filed lawsuits in Connecticut, Illinois, Michigan and Nevada after launching prediction markets in partnership with Kalshi.
- Some of those states issued cease-and-desist letters or public warnings, arguing sports event contracts amount to illegal gambling.
- VanGrack said those actions left customers facing “real and imminent” threats that forced Coinbase to seek clarity in federal court.
The argument: VanGrack says states are framing the issue incorrectly.
- Illinois officials argued in court that without state intervention, the markets would go unregulated due to limited CFTC resources.
- VanGrack called that claim “gaslighting,” saying the Commodity Futures Trading Commission has long overseen multi-trillion-dollar derivatives markets.
- He pointed to recent CFTC enforcement reminders around insider trading in event contracts as evidence the agency is actively policing the space.
Federal vs. state power: At the center is who gets to regulate sports-related event contracts.
- VanGrack argued the Commodity Exchange Act grants the CFTC exclusive jurisdiction over swaps and derivatives, including event contracts.
- The law contains a “special rule” allowing the CFTC — not states — to prohibit gaming event contracts on public policy grounds.
- States are attempting to carve sports contracts out of the federal definition of swaps, a reading VanGrack said is unsupported by the statute’s text or precedent.
Sports betting distinction: Coinbase says exchange-traded contracts differ fundamentally from sportsbook wagers.
- On a designated contract market like Kalshi, buyers and sellers set prices on an exchange overseen by the CFTC.
- In traditional sportsbooks, operators set odds and take the other side of the bet, a structure regulated by states.
- No one is arguing the CFTC regulates sportsbooks, VanGrack said — only that exchange-traded event contracts fall under federal derivatives law.
Bigger stakes: The dispute mirrors broader crypto fights over fragmented oversight.
- VanGrack said states retain authority over consumer protection and fraud.
- But subjecting national derivatives markets to “a patchwork of 50 regulators” would undermine investor confidence and market stability.
- Congress long ago chose a unified federal framework for derivatives, he said, and prediction markets should be treated no differently.

Democrats in the U.S. Senate continue to pile onto Binance, asking the Treasury and Justice departments to investigate its sanctions compliance and protections against illicit finance following reports of potential terrorism funding.
Nine senators, including a few that have been instrumental in negotiations over the crypto industry legislation known as the Digital Asset Market Clarity Act, sent a letter Friday to the chiefs of the federal agencies, requesting they probe the exchange after news reports on possible breaches, which also claimed the company had fired some of the compliance personnel involved in discovering the transactions.
The latest move from Democrats follows an announcement earlier this week from Senator Richard Blumenthal, a Connecticut Democrat who is a senior member of the Senate Homeland Security Committee, that he was inquiring into Binance and had written a letter to the company asking for information. However, neither he nor the other Senate Democrats are in the majority, meaning they don’t currently have control over committee investigations.
Richard Teng, Binance co-CEO, has said some of the earlier media reports were “inaccurate” and “defamatory.” A spokesperson for the company didn’t immediately respond to a request for comment Friday on the senators’ request, which had been sent to Secretary of the Treasury Scott Bessent and Attorney General Pam Bondi.
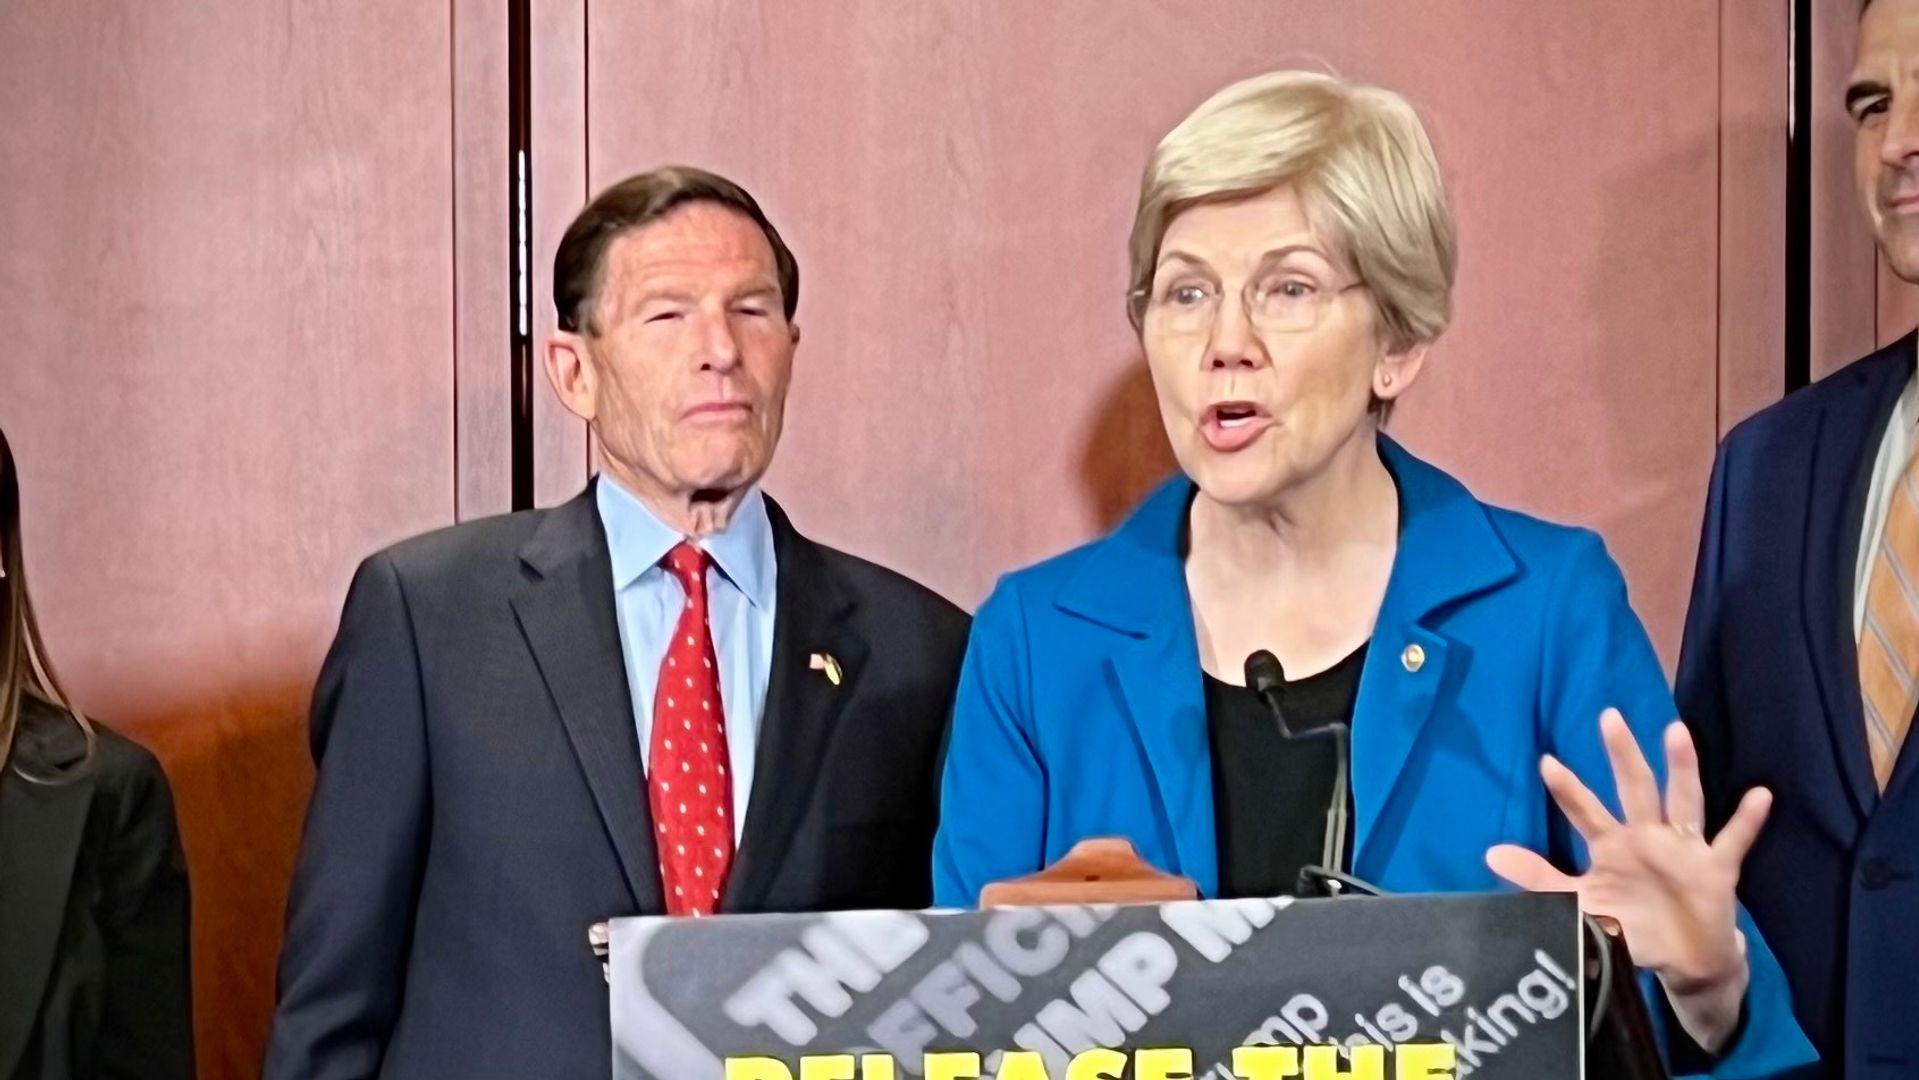
“These allegations raise grave concerns that poor illicit finance controls at Binance remain a significant threat to national security,” according to the Friday letter from senators including Elizabeth Warren, Ruben Gallego, Angela Alsobrooks, Mark Warner and five others, who also asked for information about the company’s compliance with requirements from its 2023 settlement.
“Our illicit finance controls are dangerously compromised if enormous sums can flow through Binance to terrorist groups or sanctions evaders,” they wrote in the letter, which comes at a delicate point in the ongoing discussions over U.S. legislation that would govern the crypto markets.
The prevention of illicit finance in crypto is among the issues that are still being discussed in that bill. Senator Warner has taken a lead among Democrats seeking to hash out legislative language on the topic.
Another unresolved issue centers around U.S. President Donald Trump and his family’s crypto activities, which the letter also referenced. The lawmakers wrote that they “recognized” Binance had ties to World Liberty Financial, the Trump-backed crypto venture behind the USD1 stablecoin. They also referenced Trump’s pardon of Binance founder Changpeng “CZ” Zhao — he had pleaded guilty and served four months in prison tied to Binance’s past issues with anti-money laundering and know-your-customer provisions.
TLDR
- Senate Democrats urged the Justice Department and Treasury to investigate Binance over alleged Iran sanctions violations.
- Lawmakers cited reports that $1.7 billion in digital assets moved to Iranian entities through Binance.
- The senators raised concerns that Binance may have breached its 2023 federal settlement obligations.
- The letter referenced Binance’s ties to a Trump family-backed stablecoin project.
- Binance denied the allegations and said it remains committed to its compliance agreements.
Senate Democrats have urged the Justice Department and Treasury to investigate Binance over Iran sanctions concerns and Trump-linked ties. Lawmakers sent a formal letter requesting a prompt federal review of the crypto exchange’s compliance controls. They cited reports that billions in digital assets flowed to sanctioned Iranian entities through the platform.
Binance Faces Scrutiny Over Iran Sanctions Compliance
Sen. Mark Warner led the letter and secured signatures from Sen. Elizabeth Warren and nine other Democrats. The senators asked Attorney General Pam Bondi and Treasury Secretary Scott Bessent to open a comprehensive review. They referenced media reports that linked Binance to illicit finance activity tied to Iran.
According to the letter, compliance staff identified $1.7 billion routed to Iranian entities last year. Those entities included the Iran-backed Houthis and the Islamic Revolutionary Guard Corps. The senators also claimed that a Binance vendor moved $1.2 billion connected to Iran-linked actors.
The lawmakers stated that Iranian users accessed more than 1,500 Binance accounts. They also raised concerns about the possible use of the platform by Russian actors to evade sanctions. They warned that such activity could breach Binance’s 2023 federal settlement obligations.
The letter alleged that Binance dismissed employees who flagged the transactions. It also claimed the exchange became less responsive to law enforcement requests. The senators argued that those actions would conflict with the company’s plea agreement terms.
In 2023, Binance pleaded guilty to violating U.S. sanctions laws and anti-money laundering rules. The company agreed to pay more than $4 billion in penalties. It also committed to enhanced know-your-customer procedures and sanctions screening under U.S. supervision.
Trump Ties and Russia Concerns Add Pressure
The senators also pointed to business links involving President Donald Trump and his family’s crypto ventures. They referenced Binance’s promotion of USD1, a stablecoin issued by World Liberty Financial. Lawmakers stated that the project has ties to the Trump family.
According to the letter, Binance offered interest incentives to users holding USD1. The exchange also assisted with technology related to the token. Lawmakers further cited a $2 billion investment tied to the stablecoin.
The senators referenced Trump’s pardon of Binance founder Changpeng Zhao last fall. Zhao had pleaded guilty to failing to implement an effective anti-money laundering program. He served a four-month prison sentence before receiving the pardon.
Beyond Iran, the lawmakers cited Binance’s launch of crypto-linked payment cards in parts of the former Soviet Union. They warned that similar products have helped users bypass restrictions on Russia’s financial system. They also noted Binance’s partnership with Kyrgyzstan on a stablecoin and digital currency initiative.
“These allegations raise grave concerns that poor illicit finance controls at Binance remain a threat to national security,” the senators wrote. They urged federal agencies to conduct what they described as a “thorough, impartial” probe.
The market mood has shifted as cross-asset dynamics tighten around valuation, policy uncertainty, and the path of inflation. A respected equity research team recently downgraded US stocks to neutral, citing high price levels, a weaker dollar, and lingering policy risks that could cap upside in the near term. Against this backdrop, traders are weighing whether the growth-driven narrative in artificial intelligence and related infrastructure can sustain earnings momentum, while risk-off currents push alternative assets into sharper focus. The combination of these factors creates a delicate balance for investors seeking yield, capital preservation, and growth in a tightening macro regime.
Key takeaways
- UBS’s global equity strategy team downgraded US equities to neutral, highlighting stretched valuations, dollar strength concerns, and policy headwinds that could limit upside.
- With limited upside for the S&P 500, there is a possibility of capital rotating toward non-equity assets, a dynamic that could create space for crypto and other alternative stores of value if macro conditions deteriorate.
- A fresh wave of inflation data intensified rate‑cut uncertainty, as the January producer price index rose 0.5%, contributing to a risk-off impulse that nudged government yields and equities lower in tandem.
- The yield on the 10-year Treasury declined to 3.97% from around 4.21% just weeks earlier, signaling a shift toward more risk-averse positioning as traders reassess the trajectory of monetary policy.
- While AI investment remains a tailwind for earnings, the UBS note cautions that AI-driven growth may not decouple the US equity market from broader macro and policy tensions, keeping a lid on broad risk appetite in the near term.
Tickers mentioned: $BTC, $TSLA
Sentiment: Neutral
Price impact: Negative. Bitcoin traded under important intraday resistance after inflation data, reflecting a risk-off impulse that pressed risk assets broadly.
Market context: The environment sits at the intersection of elevated equity valuations, a debate over rate paths, and rising interest in non-traditional asset classes as investors reassess risk premia in a high-valuation regime.
Why it matters
The UBS downgrade to neutral underscores a broader question facing markets: can the US equity complex sustain elevated multiples amid policy ambiguities and a dollar that has shown episodic strength? The report points to asymmetric downside risks if policy moves introduce volatility in credit conditions or weigh on consumer and business spending. In that sense, the market narrative is bifurcated. On one side, corporate earnings in AI-enabled sectors may show resilience, but on the other, policy frictions, tariffs, and potential reforms could erode the optimism priced into equities.
Against this backdrop, investors are turning their attention to the so‑called rotation trade—the idea that capital could shift from richly valued equities toward other assets that offer hedging properties or different risk premia. In practice, that can mean more demand for fixed income, gold, or other non-traditional stores of value, and it leaves room for crypto to be considered as part of a diversified risk-off toolkit. The notion benefits from a mounting narrative that a variety of macro catalysts—rising inflation surprises, policy uncertainty, and the prospect of a more cautious stance from central banks—could reweight portfolios away from equities and into assets that historically behave differently in downturns.
The report also remarks on the size and structure of the US market, noting that even a sizable reallocation may not dramatically swing the broader risk landscape. The US market, with its outsized capitalization and deep liquidity, remains a dominant engine, but valuations in the US are increasingly stretched relative to global peers. UBS’s longer‑range target for the S&P 500 remains a key consideration for investors mapping risk budgets. In this framework, the relative attractiveness of international equities, commodities, and emerging-market exposure could rise if the US growth outlook deteriorates or if currency dynamics continue to shift in a way that compounds downside risk for US assets.
On the inflation front, the January PPI data added to the challenge of predicting monetary policy paths. A 0.5% month‑over‑month uptick intensified concerns about price pressures, complicating expectations for rapid rate cuts. Traders often interpret such surprises as signals that the Federal Reserve might maintain a higher-for-longer stance than priced into some market scenarios. The ripples extend beyond equities; higher inflation prints can alter risk premia across asset classes, including crypto, where liquidity conditions and hedging demand remain important determinants of price action in both the short and long term.
The Treasury market has also shown a cautious tilt. The 10-year yield’s move down toward 3.97% reflected a flight to quality in times of uncertainty. When risk appetite wanes, investors gravitate toward safer, longer-duration assets, and the pullback in yields can support risk-off trades across a spectrum of markets. The interplay between yields, inflation data, and equity valuations continues to shape the liquidity environment in which crypto assets operate, underscoring why macro signals often drive cross-asset moves as investors reassess correlations and diversification benefits.
Within the broader crypto narrative, the possibility of increased institutional involvement—whether through strategic BTC reserves or ETF exposure—has long been cited as a potential catalyst for sentiment and liquidity. The UBS note does not hinge on a single outcome but acknowledges that capital could migrate toward non-equity assets as a form of hedge or ballast when stock markets look vulnerable. The dynamics are not deterministic, and the timing of any shift remains uncertain. Still, market participants increasingly weigh the conditional probability that the macro backdrop could align with a crypto‑positive regime—especially if new large holders step into the space or if instrument design enables easier access for institutional buyers.
As the debate about AI’s impact on productivity and earnings continues, the market remains cognizant that technology-driven drivers can influence multiple asset classes, sometimes in ways that are not perfectly correlated. Even in a scenario where AI spending sustains corporate profits, the degree to which this translates into a broad risk-on environment will depend on policy developments, inflation trajectories, and global economic momentum. The nuanced picture, therefore, is one of cautious optimism paired with prudent risk management—a stance that may favor assets offering diversification benefits, including those with distinct liquidity and return dynamics.
In practical terms, traders are watching whether new entrants—sovereign funds or large corporates—will disclose any BTC reserve commitments or equity-like exposure to crypto via ETF structures. The timing remains uncertain, but historical precedents show that when marquee players announce sizable crypto bets, market psychology can shift rapidly. Tesla (EXCHANGE: TSLA) has previously been cited as a bellwether in this regard, illustrating how a single high-profile position can alter risk perceptions and liquidity dynamics, even if such moves do not instantly reshape price trajectories. The implication for market structure is clear: if institutional appetite for crypto grows, liquidity can improve, correlations may shift, and price discovery could become more resilient to stock market downturns.
Ultimately, the near-term narrative suggests that crypto will remain sensitive to the health of traditional risk assets. The absence of a decisive decoupling signal means that Bitcoin and other digital assets could still track broader market tides, especially in sessions dominated by inflation surprises, policy hints, or unexpected macro data. Yet, the longer-term picture remains open to revision as new players and new structures emerge, potentially altering the calculus for diversification, inflation hedging, and the role of crypto in a multi‑asset portfolio.
What to watch next
- Monitor upcoming inflation and employment data for evolving rate‑cut expectations and policy signaling that could recalibrate risk appetite.
- Watch for any announcements or filings related to strategic BTC reserves by major corporations or sovereign entities, including progress on the Missouri Bitcoin Strategic Reserve HB2080.
- Track flows into spot Bitcoin ETFs and other crypto investment vehicles that could shift liquidity and price discovery dynamics.
- Observe earnings commentary on AI infrastructure and related capital expenditure to gauge whether the sector can sustain earnings growth without amplifying macro risks.
Sources & verification
- UBS global equity strategy note discussing US equities’ valuation, dollar dynamics, and policy risk (CNBC coverage referenced in the input).
- U.S. Producer Price Index data for January showing a 0.5% month‑over‑month increase.
- U.S. 10-year Treasury yield movements, with the yield dipping to 3.97% from a prior level around 4.21%.
- Discussion of AI adoption’s potential impact on earnings and risk sentiment referenced to CNBC and related materials in the input.
- Missouri Bitcoin Strategic Reserve HB2080 and related coverage in the input materials.
Market reaction and key details
Bitcoin (CRYPTO: BTC) traded in a risk-off framework after the latest inflation data reinforced uncertainty about the pace of monetary policy normalization. The move came as the broader market weighed a UBS downgrade of US equities to neutral—an assessment rooted in valuations, policy risk, and a less favorable macro backdrop. While this dynamic pushed a rethink of how capital may reallocate, it also underscored the complexity of predicting how crypto assets fit within a tightening cycle and a volatile macro mosaic. The path forward remains contingent on a constellation of factors, including central bank signals, fiscal policy developments, and the evolving appetite of large holders to commit capital to BTC or related crypto exposures.
The price action reflected a tug-of-war between resilience in certain technology-led earnings and the reality of a cautious macro environment that values liquidity and risk controls. As yields retreated and inflation surprises persisted, traders sought safer havens and diversified strategies. In this context, the potential for institutional involvement—whether through strategic BTC reserves or ETF exposure—keeps the dialogue alive about crypto’s role as a hedge or diversification asset. While such developments could alter sentiment, the near-term setup remains sensitive to the cadence of macro data releases and policy commentary, rather than a single catalyst alone.
In terms of market structure, the conversation around gold and other traditional stores of value continues to frame how investors think about risk allocation. With gold already commanding a roughly $36.5 trillion market capitalization and the tech behemoths aggregating around $24.2 trillion in value, the relative scale of Bitcoin—though substantial in its own right within the digital asset class—highlights the challenge of achieving parity with more established assets. Even a substantial upside for BTC would have to contend with the macro framework and the liquidity dynamics that shape how capital moves between risk-on and risk-off regimes. Still, the possibility of a broader rotation toward non-equity assets—should the S&P 500 struggle to upside—remains a plausible scenario for patient investors exploring hedges and diversification strategies, including those that could involve crypto exposures in a regulated, institutional-friendly format.
As the year unfolds, the market will likely hinge on a mix of data points, policy signals, and the willingness of large players to publicly disclose crypto-related exposures. The ongoing dialogue about regulatory clarity and the evolution of crypto infrastructure will ultimately influence how readily crypto assets participate in broad market rotations. In the meantime, traders and investors will continue to assess whether the current macro setup favors a more defensive posture and how any future developments could alter the balance between traditional assets and digital currencies.

James Martin of Glawning speaks of Dragon Den tv appearance

iPhone 18 Pro Max Enters Testing Phase as Rumors Point to Record Battery

Solana ETF Flow, DEX Activity, Fee Revenue Rise: Is SOL discounted?


-

 Politics6 days ago
Baftas 2026: Awards Nominations, Presenters And Performers
-

 Sports4 days ago
Women’s college basketball rankings: Iowa reenters top 10, Auriemma makes history
-

 Politics4 days ago
Nick Reiner Enters Plea In Deaths Of Parents Rob And Michele
-

 Business3 days ago
True Citrus debuts functional drink mix collection
-

 Politics23 hours ago
ITV enters Gaza with IDF amid ongoing genocide
-

 Fashion4 hours ago
Weekend Open Thread: Iris Top
-

 Crypto World4 days ago
XRP price enters “dead zone” as Binance leverage hits lows
-

 Business5 days ago
Mattel’s American Girl brand turns 40, dolls enter a new era
-

 Business5 days ago
Law enforcement kills armed man seeking to enter Trump’s Mar-a-Lago resort, officials say
-

 NewsBeat2 days ago
Cuba says its forces have killed four on US-registered speedboat | World News
-
 NewsBeat2 days ago
Manchester Central Mosque issues statement as it imposes new measures ‘with immediate effect’ after armed men enter
-

 Tech3 days ago
Unsurprisingly, Apple's board gets what it wants in 2026 shareholder meeting
-
 NewsBeat5 days ago
‘Hourly’ method from gastroenterologist ‘helps reduce air travel bloating’
-

 Tech5 days ago
Anthropic-Backed Group Enters NY-12 AI PAC Fight
-

 NewsBeat5 days ago
Armed man killed after entering secure perimeter of Mar-a-Lago, Secret Service says
-

 Politics5 days ago
Maine has a long track record of electing moderates. Enter Graham Platner.
-

 Business2 days ago
Discord Pushes Implementation of Global Age Checks to Second Half of 2026
-
 NewsBeat3 days ago
Police latest as search for missing woman enters day nine
-
 Sports4 days ago
2026 NFL mock draft: WRs fly off the board in first round entering combine week
-

 Business1 day ago
Only 4% of women globally reside in countries that offer almost complete legal equality