Crypto World
Ethereum price trapped below $1,920, is $2,000 next?

Ethereum price traded near $1,905 on Aug. 18 as tightening daily and 4-hour ranges placed the $1,920 resistance level at the center of its next major move.
Summary
- Ethereum price has formed a symmetrical triangle between roughly $1,850 and $1,930.
- A 4-hour close above $1,909 could expose the stronger $1,920 resistance level.
- Liquidation clusters are concentrated near $1,925–$1,930 and below $1,890.
- Analysts see $2,000 as the next target if Ether breaks its current range.
Ethereum price tightens inside a symmetrical triangle
According to data from crypto.news, Ethereum (ETH) price was trading at $1,904.89 after moving between an intraday low of $1,885.78 and a high of $1,914.38. The price was down about 0.5% on the day but remained inside the narrow range established since late July.
Ether’s recent lower highs and higher lows have created a symmetrical triangle on the daily chart. The upper trendline has fallen from near $1,980 toward $1,920, while the lower boundary has risen from around $1,800 toward $1,880.

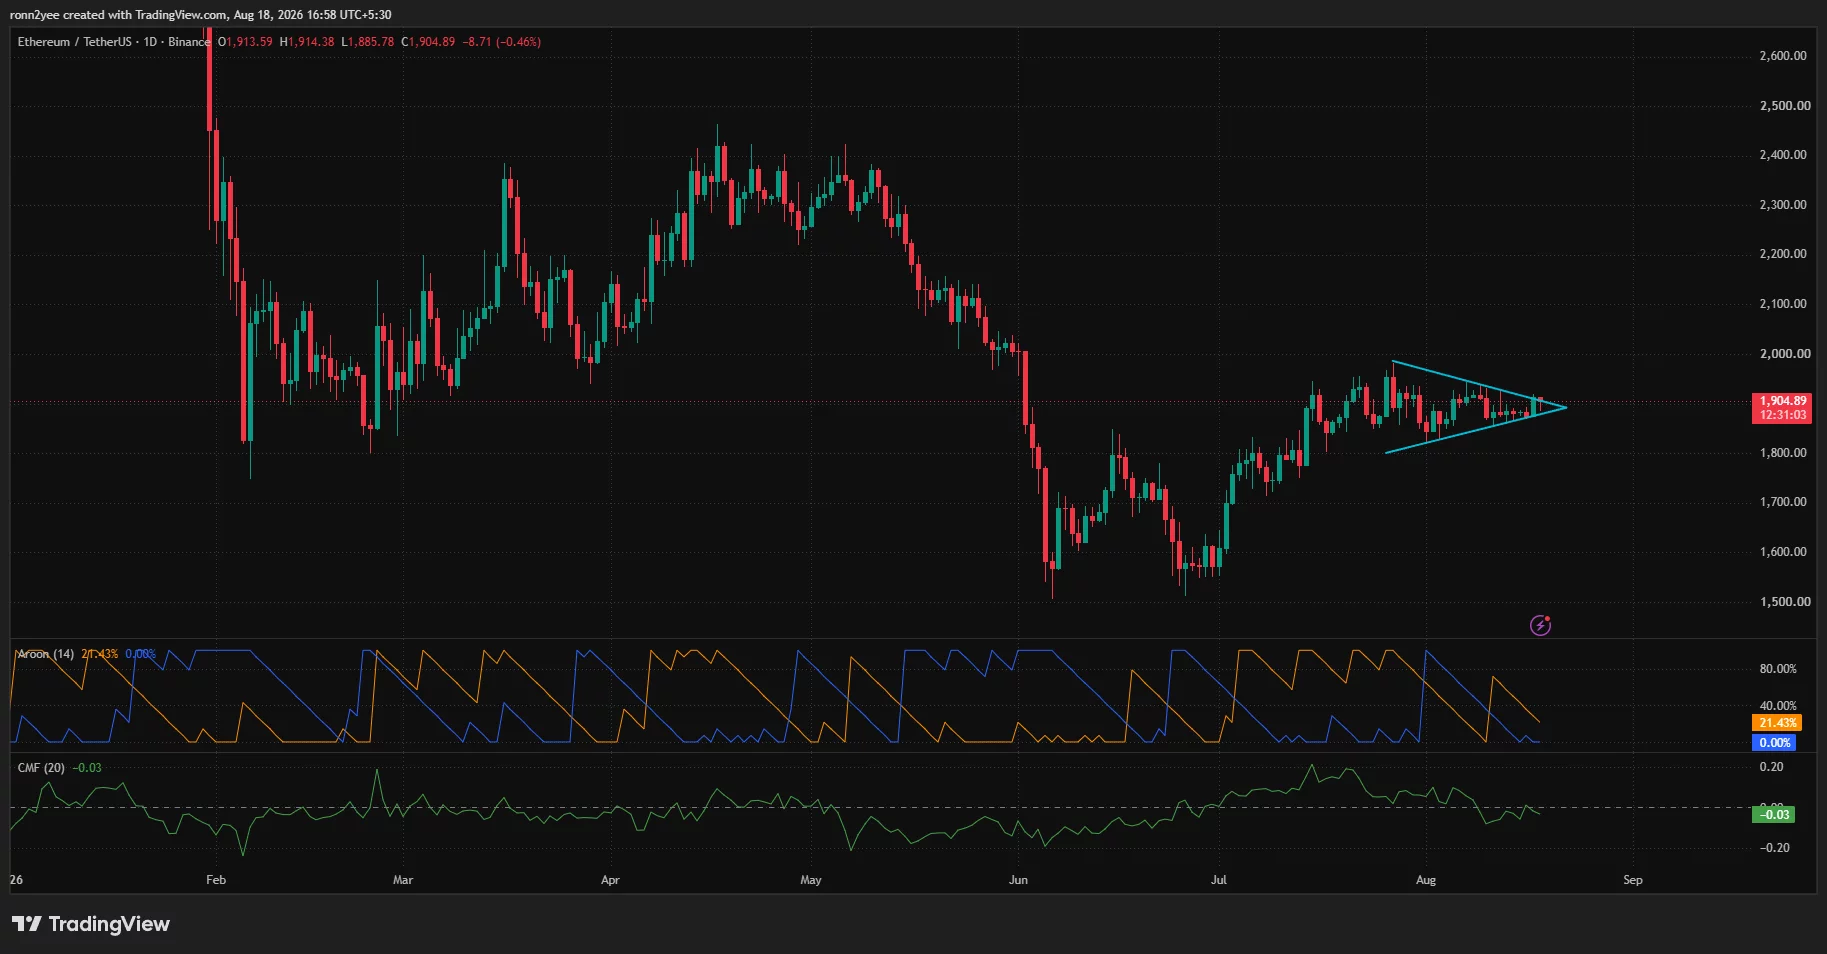
Price has now moved close to the triangle’s apex, where shrinking space between the two boundaries typically precedes a wider move. The formation remains neutral until ETH closes outside either trendline, meaning confirmation matters more than intraday movement within the pattern.
Momentum readings have not yet provided a clear directional signal. The daily Aroon readings were weak, with one line at 21.43% and the other at 0%, reflecting a lack of a strong recent high or low.
Chaikin Money Flow stood at -0.03, slightly below the neutral line. The reading shows that selling pressure has a small advantage, but the figure is not low enough to confirm strong capital flight.
Ether’s inability to break higher comes as large holders reportedly sold around $3 billion in ETH since Aug. 10. Decentralized exchange trading volume has also contracted by about 42% over recent months, while a negative Coinbase Premium Index has pointed to weak demand from US-based buyers.
4-hour chart puts $1,909 and $1,870 in focus
The 4-hour chart shows a more immediate battle between Supertrend resistance at $1,908.59 and support at $1,869.92. Ether briefly traded above $1,905 but had not secured a candle close over the upper Supertrend level at the time of the chart.
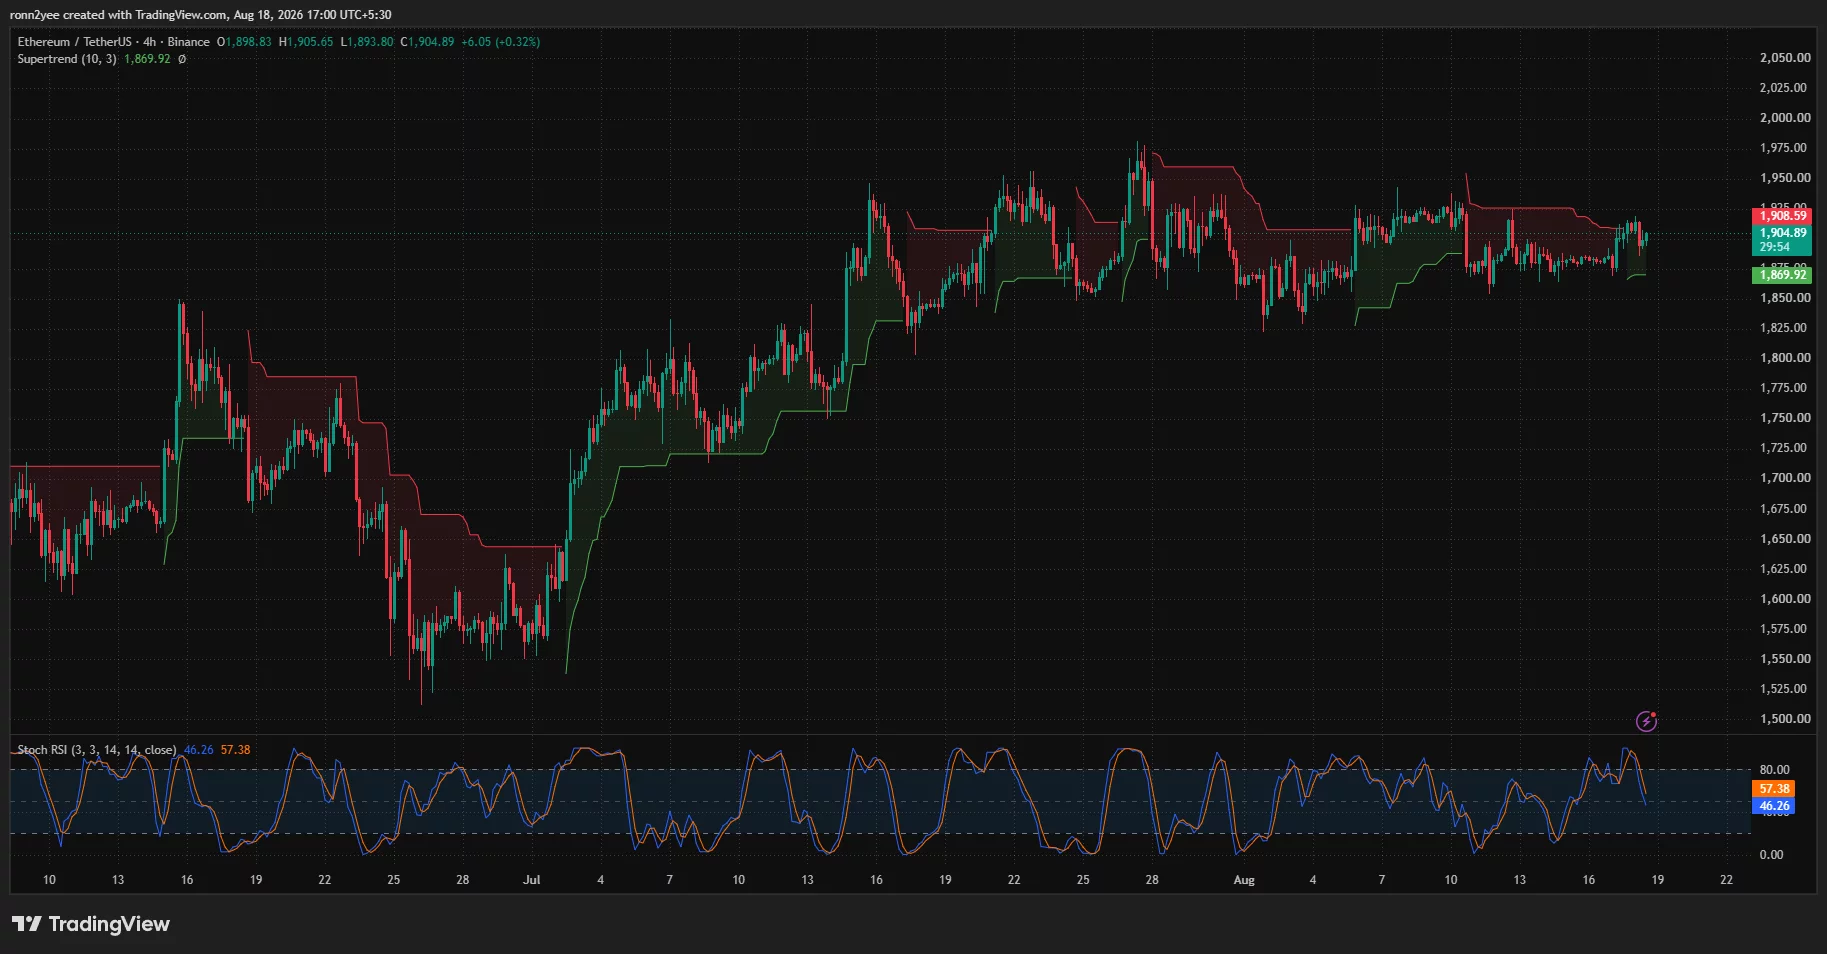
A confirmed move above $1,909 would weaken the short-term bearish signal and bring $1,920 into view. ETH has repeatedly struggled between $1,915 and $1,930, making that area the first meaningful test for buyers.
The Stochastic RSI has also turned lower after approaching overbought territory. Its two lines stood at 46.26 and 57.38, with the faster line below the slower one. The crossover shows that short-term momentum cooled during the latest push toward resistance.
However, the oscillator remains near the center of its range rather than in oversold territory. Bulls could regain momentum without requiring a deeper reset if ETH holds above $1,890 and breaks through $1,909.
Failure to clear the Supertrend barrier would keep the price exposed to $1,890, followed by the $1,870 support line. A 4-hour close below $1,870 would weaken the sequence of higher lows and shift attention toward $1,850.
Ethereum liquidation map points to $1,925
CoinGlass’ three-day liquidation heatmap shows the largest nearby concentration of leveraged positions above the market between roughly $1,925 and $1,930. Additional liquidity appears around $1,940–$1,950 and close to $1,980.
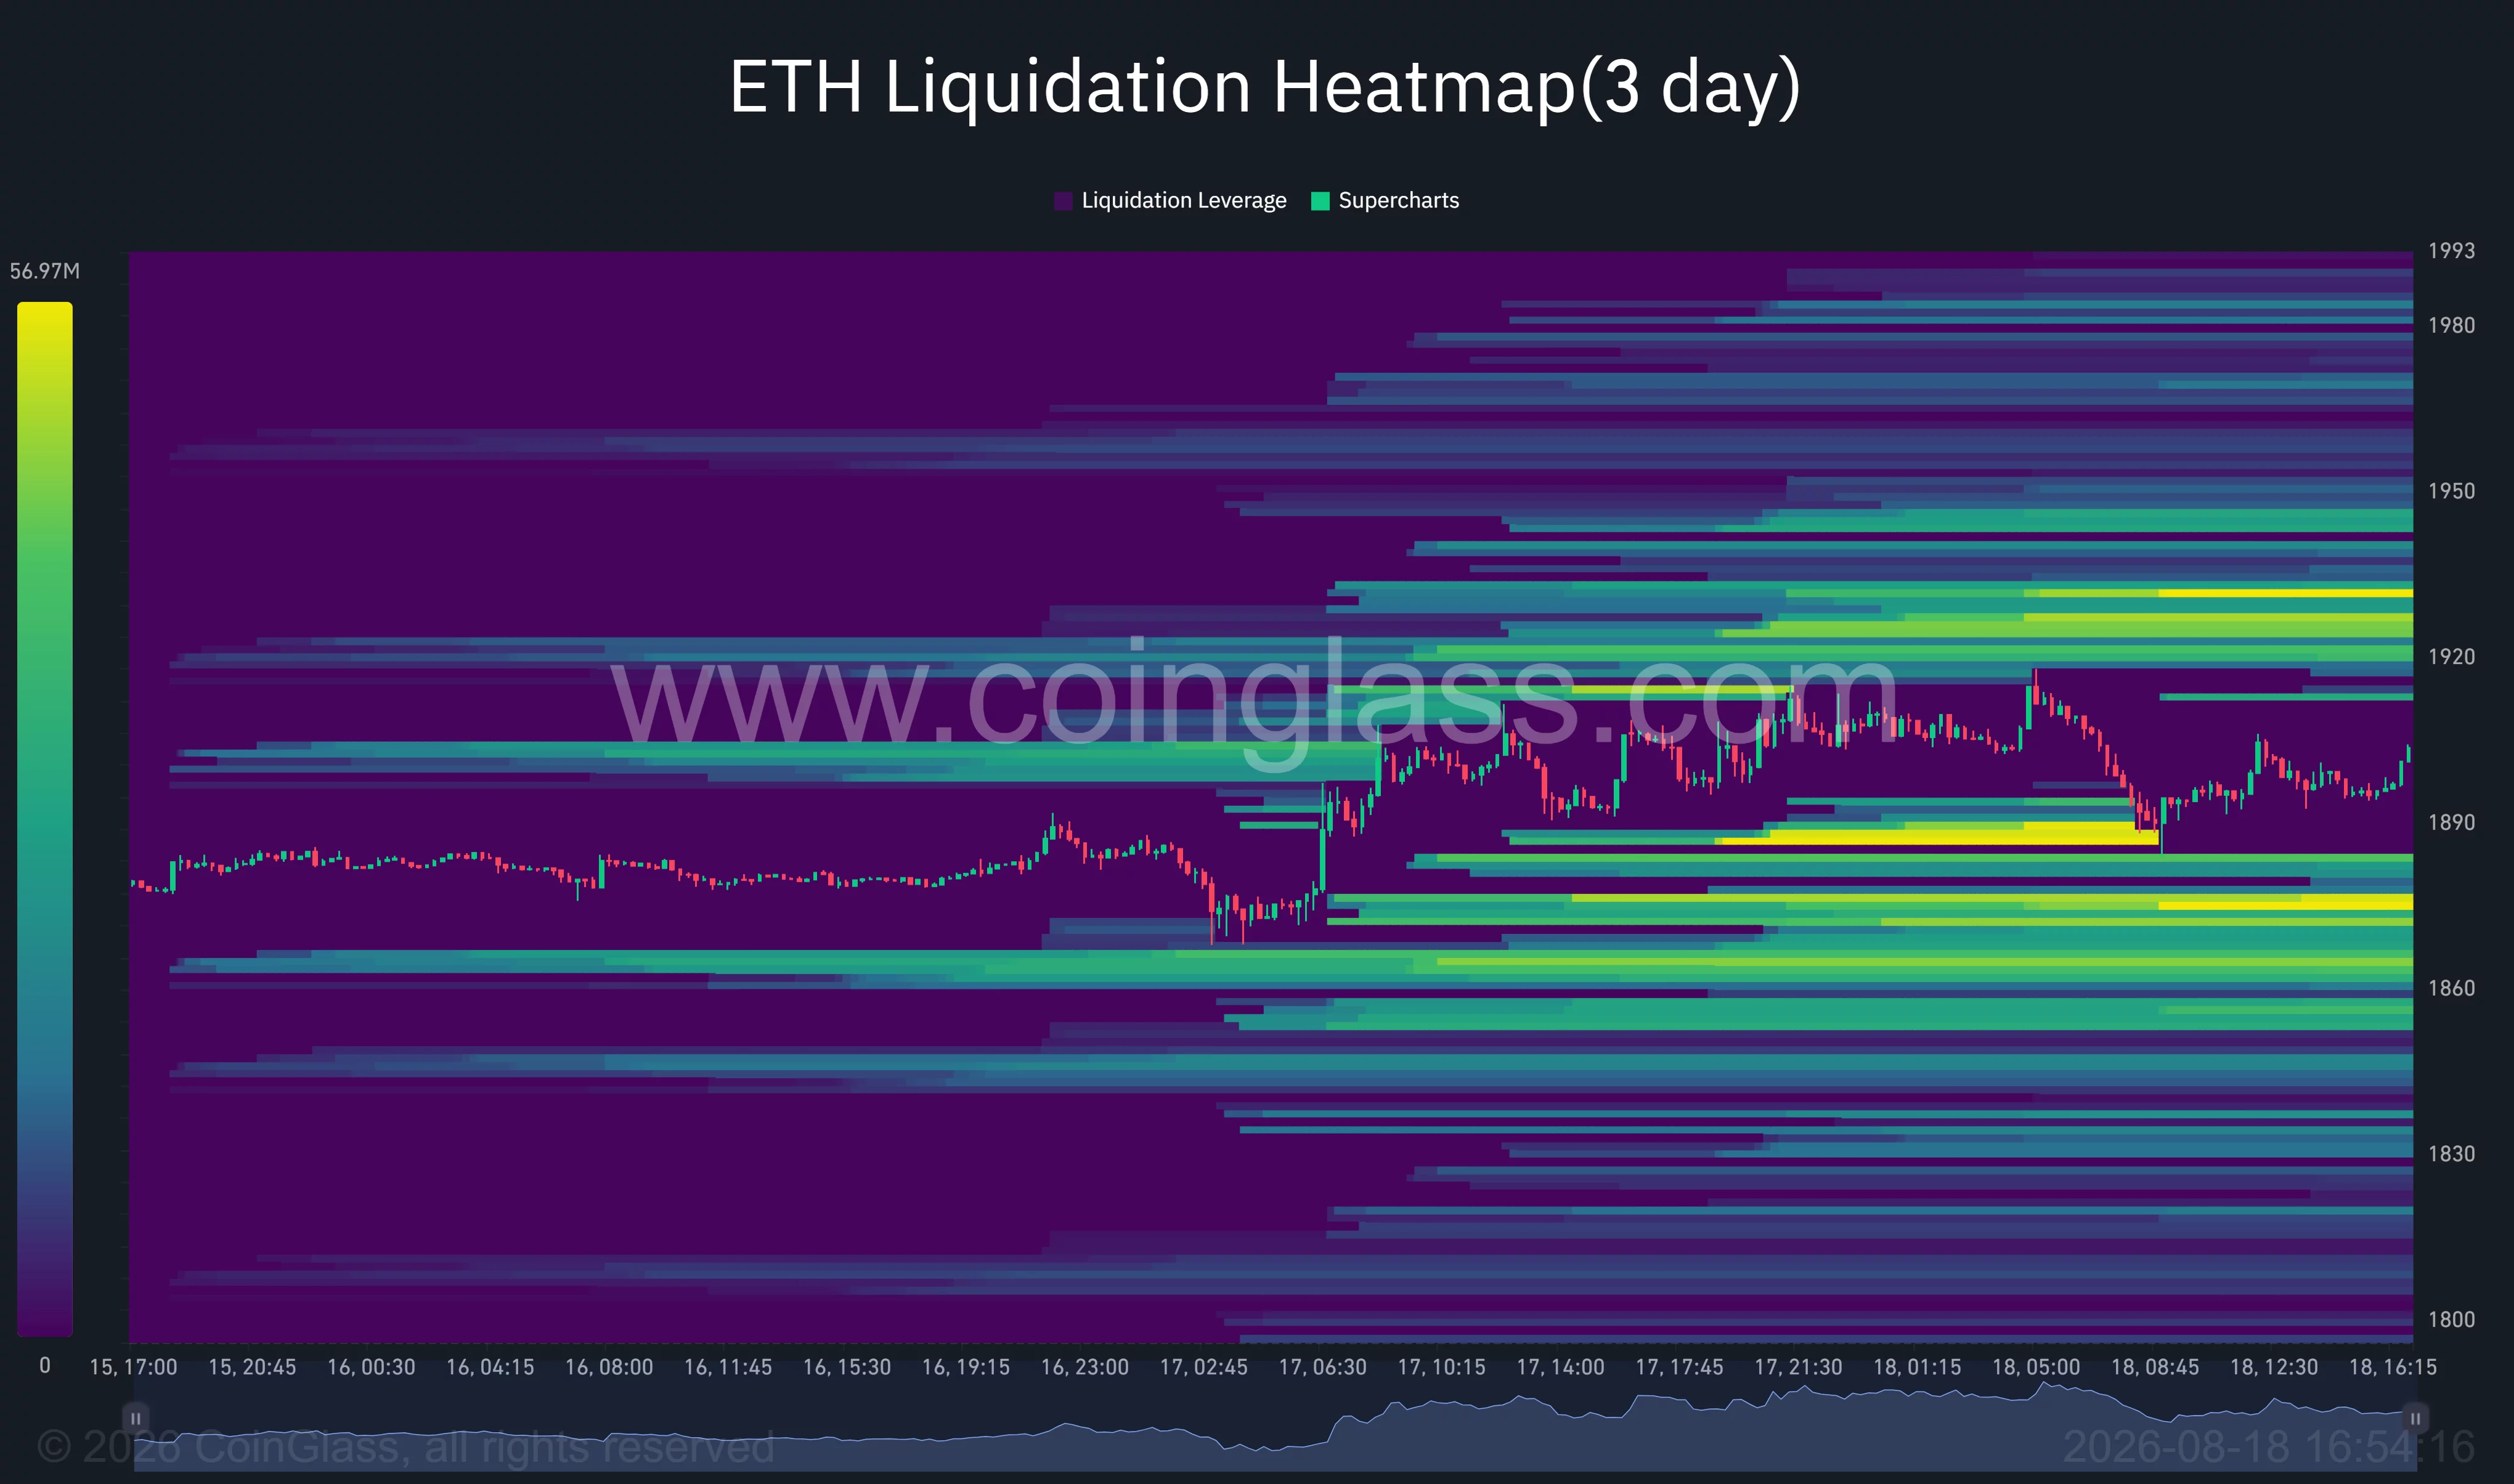

A move through $1,920 could force short positions to close around the first cluster. Such liquidations may add market buying and help ETH accelerate toward the $1,940–$1,950 region.
The downside also contains several active liquidity zones. The closest cluster sits around $1,885–$1,890, followed by stronger concentrations near $1,870 and $1,860.
Price briefly moved into the $1,885 region earlier on Aug. 18 before recovering above $1,900. The rebound suggests buyers remain active near the lower liquidation band, although repeated tests could weaken that defense.
A sweep below $1,885 could therefore pull ETH toward $1,870, which aligns with the 4-hour Supertrend support. The overlap between technical support and liquidation liquidity makes $1,870 the main short-term invalidation level for the bullish setup.
Analysts target $2,000 after a $1,920 breakout
Analyst Michaël van de Poppe said Ethereum remained stuck in a range and had not matched Bitcoin’s larger move. He identified $1,920 as the resistance level that could unlock a stronger advance.
“However, once it cracks through the resistance at $1,920 I would assume we’re going to see a big move happening towards $2,000 here.”
His target matches the daily chart, where the psychological $2,000 level sits above the triangle and recent swing highs. ETH would first need to clear the supply zone between $1,920 and $1,950 before testing that target.
Analyst Ted Pillows presented a longer-term threshold, arguing that a weekly close above $2,500 would confirm that Ethereum’s bear market had ended. Such a close would allow ETH to reclaim its 200-week simple and exponential moving averages, according to his chart.
The $2,500 condition remains well above the current market and does not affect the immediate range. It instead shows that even a break above $2,000 would represent an early recovery step rather than confirmation of a full long-term trend reversal.
US flows remain a barrier for Ethereum
US-listed spot Ethereum exchange-traded funds recently recorded $2.26 million in net outflows, interrupting a multi-week inflow streak. The negative Coinbase premium also shows that US demand has not yet provided enough support to drive ETH through its current resistance.
Investors are waiting for the upcoming Federal Reserve minutes after annual US inflation slowed to 3.4%. Any signal that policymakers are moving closer to lower interest rates could affect demand for risk assets, including Ether.
For now, Ethereum remains compressed between nearby liquidity on both sides of the market. A sustained break above $1,920 would favor a move toward $1,950 and $2,000, while rejection followed by a loss of $1,870 would expose $1,850 and potentially $1,800.
Disclosure: This article does not represent investment advice. The content and materials featured on this page are for educational purposes only.
You must be logged in to post a comment Login