
Crypto World
Fading Momentum Leaves XRP Price Trapped Near $1.40


XRP is trading at $1.40, with the price sitting just below the $1.42 resistance level as the Senate prepares for a procedural vote on the CLARITY Act. The setup highlights a clear tension: the daily chart remains cautiously constructive, while momentum on shorter timeframes has faded.
At $1.40, XRP is close to its daily pivot and caught between nearby support and price resistance. Daily indicators show that the structure has not broken, but intraday readings point to a market that has yet to establish a decisive direction.
The scheduled vote is procedural rather than a final decision on whether the CLARITY Act becomes law. It concerns the bill’s path through the Senate and is separate from subsequent legislative steps that would be needed for a final federal framework.
Senate Republicans released a revised, 630-page draft ahead of the September 15 vote. The updated language would require trading protocols controlled by identifiable people or groups to register with the Commodity Futures Trading Commission. The draft also retains ethics provisions that prohibit public officials, employees, and their spouses from issuing or sponsoring digital assets.
The legislation seeks to establish a federal digital-asset market framework and clarify regulatory responsibilities. Even if the procedural step advances, further Senate action would still be necessary before any final legislative outcome is reached. For XRP traders, the vote is therefore one factor alongside the chart rather than a standalone resolution of the market’s current indecision.
Earn $50 and Enter $300K Prize Draw on EdgeX
Why $1.40 XRP Price is A Genuine Market Standoff?
The daily chart gives XRP the benefit of the doubt. Price at $1.40 sits above both the 20-EMA at $1.37 and the 200-EMA at $1.33, while daily RSI reads 55.92. That places RSI above its midline without placing it near overbought territory.

The 50-EMA at $1.29 remains below the 200-EMA, however, so the averages do not form a textbook uptrend stack. The structure instead reflects a sharp recovery after a decline, with shorter-term averages recovering faster than the medium-term average.
The daily MACD adds caution to the constructive read. The MACD line is at 0.03 against a 0.05 signal, producing a negative histogram of roughly -0.02. That soft bearish cross suggests that the advance above the moving averages has lost some forward momentum, even though the wider daily structure remains intact.

The crypto backdrop has also been weak. Total crypto market cap declined to $2.72 trillion, while Bitcoin dominance stood at 58.36%. The Fear & Greed Index read 69, in Greed territory, creating a contrast with the wider market pullback. U.S. diesel prices topped $6 per gallon amid the Ukraine and Iran conflicts, adding to risk-sentiment pressure.
Trade XRP on Bybit and Get a Chance to Win Our $1,000 USDT Airdrop
The $1.39 Support and $1.42 Resistance Test
The daily pivot point is $1.41, with resistance at $1.42 and support at $1.39. XRP price is trading close to that pivot, a position consistent with a market waiting for a clearer catalyst.
A move above $1.42 would place the upper daily Bollinger Band near $1.46 in focus. A loss of $1.39 would return attention to the $1.33-$1.32 area, where the 200-EMA and lower Bollinger Band are close together, followed by the 50-EMA at $1.29.
Shorter timeframes present a softer picture. On the hourly chart, XRP at $1.40 sits just below the 20-EMA at $1.41, while RSI has slipped to 44.41. Average True Range near $0.02 indicates compressed volatility and consolidation rather than a clear trend.
The 15-minute chart is weaker still. XRP trades below its 20-EMA at $1.41 and 50-EMA at $1.42, while RSI is 30.72, near oversold territory. The 15-minute ATR is approximately $0.01, reinforcing the picture of a tightly compressed market.
The bullish case depends on XRP defending $1.39, reclaiming $1.42, and remaining above the daily 20-EMA. A positive turn in the daily MACD histogram would indicate that momentum is improving alongside the existing structure. A sustained bounce from the 15-minute RSI near 30.72 could offer an early sign of renewed buying, although it would not constitute confirmation by itself.
For now, XRP remains positioned around a narrow $1.39-$1.42 range. The daily chart still supports a cautiously constructive interpretation, but fading MACD momentum and softer lower-timeframe readings keep that interpretation conditional. The indicators are delivering a mixed signal, making the nearby pivot, support, and resistance levels the central focus.
Discover: The Best Token Presales
The post Fading Momentum Leaves XRP Price Trapped Near $1.40 appeared first on Cryptonews.


Humanoid robots compete in the 100-meter race during the 2nd World Humanoid Robot Games at the National Speed Skating Oval in Beijing on August 25, 2026.
Wang Zhao | Afp | Getty Images
BEIJING — While frontier U.S. labs have sounded the alarm on artificial intelligence in recent high-profile speeches, Chinese companies have largely kept quiet.
Z.ai, Moonshot, MiniMax, Alibaba and Tencent have not made similar comments, and did not provide any statements when contacted by CNBC about the warnings from Silicon Valley.
It’s important to be prudent about AI, but the publicity is “a little bit oversold,” said Ray Von, founder, CEO and chairman of Tencent-backed OpenPie, a startup building devices for companies to use AI securely on internal data.
“That’s why in China, we don’t pay too much attention to that, because that’s not the first time [the U.S. execs] say these things,” he said in a phone interview Tuesday. “They should just do it.”
OpenAI’s Sam Altman, Elon Musk and Anthropic’s Dario Amodei called for a slowdown in AI development over the weekend due to uncontrollable risks. Despite the rare display of industry unity, Nvidia’s Jensen Huang pushed back by saying speed and safety can happen together, and said developers should act responsibly.
Amodei, in his latest essay, urged U.S. companies to still maintain a lead over China, echoing a paper his company published in May.
China’s foreign ministry on Monday called the U.S. executives’ comments “fear-mongering.” English-language state media op-eds used “Cold War playbook” and “Dr. Frankenstein” to describe the AI warnings.
“Once Chinese companies have created superior AI, we see U.S. companies issuing AI warnings. I don’t think this is a coincidence,” Renjie Guo, founder and CEO of JoyIn, said in Chinese translated by CNBC.
From a philosophical perspective, he expects AI is only as dangerous as its developers. Just like humans, AI will also conclude that “truth, goodness and beauty” are the best approach, he said.
Control from the start
Beijing meanwhile kicked off its own annual cybersecurity week, with the release late on Monday of the third edition of an “AI Safety Governance Framework.” The bilingual document laid out guidelines for labeling AI content and developing systems for rapid AI risk detection.
“I think as China, we are trying AI governance. AI regulation is important. But … in terms of the AI labs, people are talking less about AI safety,” said Alex Lu, founder of LSY Consulting. He described Anthropic’s comments in particular as “marketing communication” meant to support a view that “the only company that can make AI safe[ly] is Anthropic.”
U.S. and Chinese companies have also taken different approaches to AI.
Chinese companies have focused on AI commercialization in the face of U.S. restrictions on access to advanced semiconductors. U.S. companies have meanwhile rushed to develop AGI, or AI with super-human intelligence, and only this year faced more scrutiny from Washington.
Beijing’s efforts to control the tech started far earlier.
For months after OpenAI released ChatGPT, Chinese alternatives were kept from the public until Beijing gave them the green light in the summer of 2023.
By early 2026, Chinese AI chatbots were fighting for users with massive promotions around the Lunar New Year holiday. Several of the models vied with Anthropic’s Claude and OpenAI’s ChatGPT for performance, often at far lower usage costs. The cheaper, open-source Chinese models have gained many users in the U.S. and other countries as a result.
But one thing hadn’t changed: the AI’s silence on topics Beijing deems sensitive.
Ask DeepSeek about what happened on June 4, 1989 — the day of the Tiananmen Square crackdown in Beijing where hundreds or possibly thousands were killed — and it says “I’m not able to help with that.” However, it can explain that Sept. 11, 2001, “was the day of coordinated terrorist attacks in the United States… [that] killed nearly 3,000 people.”
China’s cybersecurity regulator has rolled out processes for approving new generative AI services, especially those likely to influence public opinion. The agency publishes lists of registered models.
Integrating AI across industries is also a significant part of the Chinese government’s plans for economic development over the next five years.
Chinese companies’ development of open-source AI in particular has added support to Beijing’s international cooperation programs, such as the Global AI Governance Initiative and the World Artificial Intelligence Cooperation Organization.
“We should strengthen risk-awareness and ensure that AI is secure and controllable,” Chinese President Xi Jinping said in July at the launch of the world AI organization. Over the weekend, at the BRICS summit in India, Xi added that China would foster AI and tech cooperation among the bloc economies.
Focus on real-world application
Companies in China frequently emphasize the importance of AI’s ability to generate revenue, rather than just rising in intelligence rankings.
“We are not looking for the most [impressive] AI models, but trying to unlock AI potential. You will see a lot of regulations around how AI should be applied,” Lu said, pointing to China’s rules on data security and labeling of AI-generated videos.
The bigger challenge, he said, is addressing the AI models’ penchant for making things up via hallucination. A better AI model helps, but it’s not the most cost-effective way, he said, noting a key approach uses less complex methods known as harness technology and reinforcement learning.
That means many Chinese companies may not need to use cutting-edge AI models.
OpenPie’s Ray Von said his startup is mostly using older models, if not smaller versions, of Alibaba’s Qwen and DeepSeek.
“The vast majority of enterprise,” he said, “they see a lot of productivity increases but they haven’t seen anything generate profits or reduce cost immediately.”
“Right now, the publicity is diverting a lot of attention,” he said. “The application side, the enterprise side, hasn’t seen a lot of result yet.”
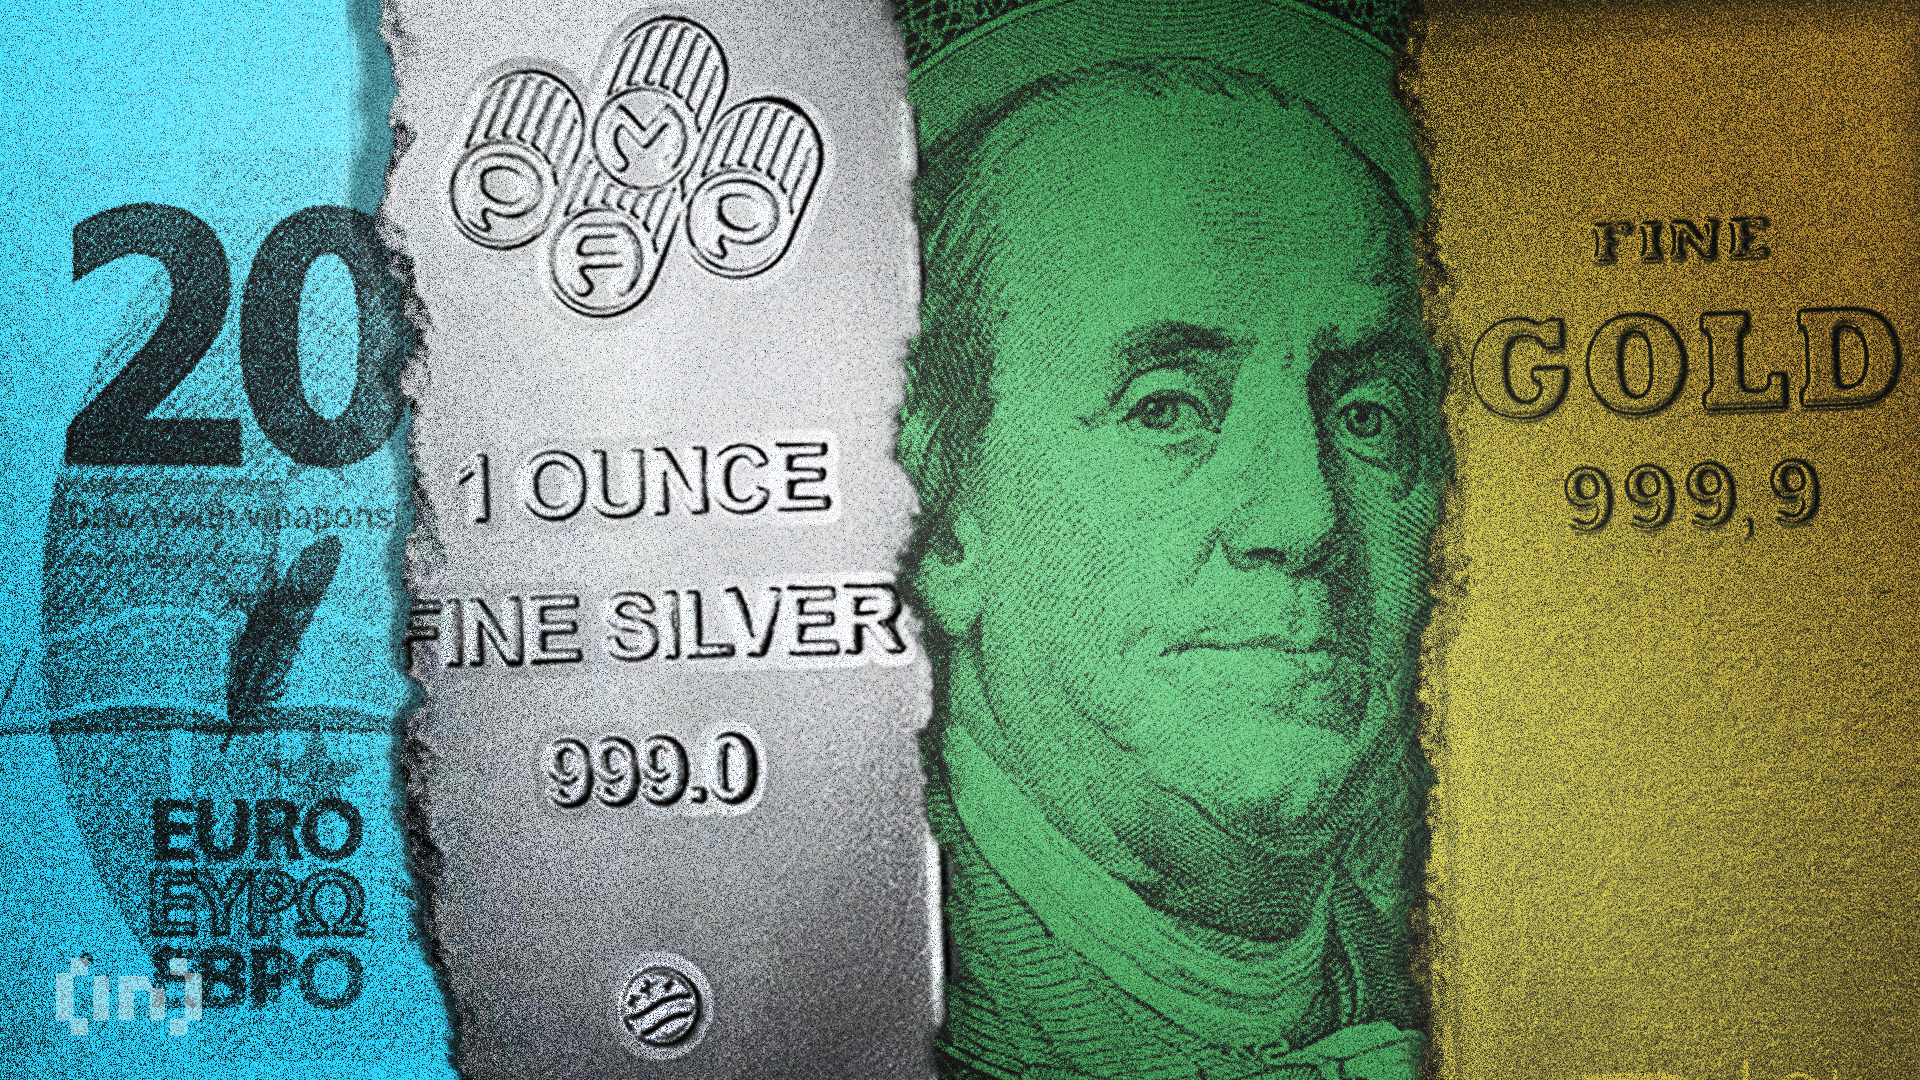

Real Vision co-founder Raoul Pal says Bitcoin (BTC), not gold, is the better long-term hedge against currency debasement, arguing the asset’s earlier adoption stage gives it more room to grow than the metal.
Pal made the comparison during a September interview on the Wolf Financial Show. There, he laid out his broader framework for how debasement quietly erodes savings and wages.
Debasement Erodes Savings Every Year
Debasement, Pal says, is the dominant force behind rising asset prices over time. He ties it directly to liquidity cycles that central banks and governments largely control.
He describes debasement as the steady loss of a currency’s purchasing power as central banks expand the money supply.
He estimates this process reduces the value of fiat currencies globally by roughly 8% annually. Wages, he adds, typically track economic growth of around 3%.
That gap, Pal argues, explains why homes and other scarce assets have grown harder to afford for average earners. Bitcoin recently traded near $75,900, according to BeInCrypto data, down about 2% over the past day.
Why Bitcoin Beats Gold, According to Pal
Pal frames gold as base money with no ability to compound in value beyond what the broader economy already reflects. Bitcoin, he says, functions as digital gold with the same scarcity but a much earlier adoption curve.
Pal summarized the idea in one line.
“[T]he digital gold is Bitcoin, but Bitcoin’s earlier in its adoption.”
He made the remark during the interview.
Pal argues that only two asset classes have consistently outpaced the debasement rate. Those are crypto and technology stocks, tracked through the Nasdaq.
He pointed to the Nasdaq’s roughly 19% annual return over 15 years. Crypto, he estimates, has compounded between 45% and 110% annually.
Gold, real estate, and other traditional assets, he said, tend to only track the debasement rate rather than beat it. Pal’s comments echo a wider narrative among macro investors. They increasingly link Bitcoin’s price moves to gold as the debasement trade gains traction.
Whether Bitcoin can sustain that adoption curve remains an open question. Gold’s renewed strength may shape how investors weigh the two assets through 2026.
The post Raoul Pal Says Bitcoin Beats Gold as the Real Debasement Hedge appeared first on BeInCrypto.




Crypto traders holding long, or bullish, futures bets have taken a sharp hit over the past 24 hours after the Clarity Act failed a Senate procedural vote.
Exchanges liquidated about $571 million in long positions in that window, the highest tally since Aug. 22, according to CoinGlass. Shorts, or bearish bets, accounted for only about $100 million of the wipeout.
Bitcoin and ether longs absorbed the heaviest damage, with roughly $190 million liquidated in each. Analysts had flagged ether and DeFi tokens as the assets most likely to outperform bitcoin if the Senate voted yes. XRP longs lost about $30 million, while Solana longs lost about $22 million.
The data shows markets were positioned for continued upside, largely on hopes the Clarity Act would advance. Those hopes strengthened earlier this week after reports that President Donald Trump was willing to make concessions on the bill’s ethics provisions. The market responded: bitcoin, the largest cryptocurrency by market value, rose to nearly $80,000 from about $77,000 on Monday.

Ethereum price trades at $2,470 today, down 1.8% on the day, as the Clarity Act prediction odds fall to under 20% this week. That vote could be the catalyst that decides whether ETH reclaims $2,550 or slides back toward $2,180. There’s a third scenario nobody’s pricing in yet.
Ted Pillows notes that Ethereum has failed to secure a weekly close above $2,550, with his chart placing ETH near $2,522 against resistance at $2,546.78. Price still holds above the 50-week EMA at $2,386.63. Michaël van de Poppe’s hourly chart shows ETH rebounding from $2,448 support, while Daan Crypto Trades cautions the Clarity Act vote is only an initial legislative stage, not a done deal.
But Ethereum has gained 33.4% over 30 days despite a 46.3% annual decline, a divergence that tells its own story about cycle timing. The market is watching CPI data and Clarity Act headlines simultaneously, and Bitcoin’s price action is reacting to the same regulatory calculus.
Earn $50 and Enter $300K Prize Draw on EdgeX
Ethereum Price Prediction: Can ETH Hit $3,000 This Week?
ETH sits at $2,474, down almost 2% intraday, after printing an intraday low near $2,465 and a recovery high around $2,600. The pullback to $2,516 before easing further shows sellers are still active at resistance. Price remains above the 50-week SMA near $2,470.83, though barely, a razor-thin cushion.
The bull case happens when the Clarity Act passage triggers a reclaim of $2,550, exposing $2,800 resistance and putting the $3,000 target in play, per Pillows’ framework. The base case is a continued chop between $2,386 and $2,550 while the market digests legislative headlines in stages.

But one scenario that holders would rather not see? A renewed rejection that could send ETH toward $2,180, with deeper support near $1,965 and $1,713 if that level fails.
A weekly close above $2,546.78 would strengthen the bullish thesis considerably. For a different structural driver behind the same $3,000 target, this supply-side analysis is worth a look. For background on what’s actually in the bill, the Clarity Act draft details matter more than most traders assume.
Trade Ethereum on Bybit and Get a Chance to Win Our $1,000 USDT Airdrop
LiquidChain Targets Early Mover Upside as Ethereum Tests Key Levels
Holding ETH through this chop validates the long-term thesis, but let’s be honest, a move from $2,474 to $3,000 is just 21% upside on a $300B-plus asset. Solid, not spectacular. Capital chasing outsized returns is increasingly rotating toward earlier-stage infrastructure plays that sit beneath assets like ETH, BTC, and SOL rather than competing with them.
The Order rests. The architecture never sleeps. — LiquidChain (@getliquidchain) September 9, 2026
 ⟁https://t.co/vqvBcdSQYC pic.twitter.com/bNof4XHJ58
LiquidChain ($LIQUID) is a Layer 3 infrastructure project fusing Bitcoin, Ethereum, and Solana liquidity into a single execution environment. Its Unified Liquidity Layer and Single-Step Execution let developers deploy once and access all three ecosystems, backed by Verifiable Settlement.
The presale sits at $0.014955 per token with more than $960K raised so far.
Research LiquidChain directly before the presale closes.
Discover: The Best Token Presales
The post Ethereum Price Prediction: Today’s Clarity Act Could Send ETH Above $3,000 appeared first on Cryptonews.


Mark Zuckerberg stepped into the artificial intelligence (AI) extinction debate this week. He argued that market pressure already pushes AI labs to prioritize safety without new mandates.
The Meta (META) chief executive posted the remarks weeks after warning about superintelligence. He said the technology should empower individual users, not a handful of firms.
A Debate Zuckerberg Didn’t Start
In that August essay, he argued no single company or government should control superintelligent systems, favoring broad distribution instead.
The post arrived as Washington grapples with warnings from inside the AI industry itself. Anthropic researcher Jacob Coxon resigned this month, accusing his employer and OpenAI of rushing self-improving systems without adequate safeguards.
Coxon’s exit fueled a push to ban superintelligence outright. Senator Bernie Sanders and Representative Greg Casar lead that effort in Congress.
OpenAI safety researcher Marcus Williams separately put human extinction odds at 70% within three years. He added that the odds could fall if labs slow down or regulators intervene.
What Zuckerberg Actually Said
Zuckerberg argued that alignment, not restriction, will separate durable AI agents from failed ones. He said trust is becoming the industry’s most valuable feature.
People won’t want to use agents that are misaligned with them and that don’t do what they ask, so labs have a strong natural incentive to make their models more aligned.
Mark Zuckerberg made the remarks in a post on X.
He also pointed to Meta’s own record on safety. Meta delayed its Muse personal assistant from an initial April release date to address security concerns. Zuckerberg said Meta acted on its own, without waiting for industry-wide rules.
He also said Meta Superintelligence Labs (MSL) already uses independent evaluators to review its work. He argued rival labs could adopt similar outside review.
The Meta founder added that directing most compute to serving people, not self-improvement, keeps development safe.
Zuckerberg’s argument leaves the core disagreement unresolved. Critics want enforceable limits on self-improving AI, while Meta is betting on competition and self-interest.
Whether that balance holds may shape how Congress treats Zuckerberg’s push for speed on AI releases in the months ahead.
The post Mark Zuckerberg Joins the AI Doomsday Talk. What is He Saying? appeared first on BeInCrypto.
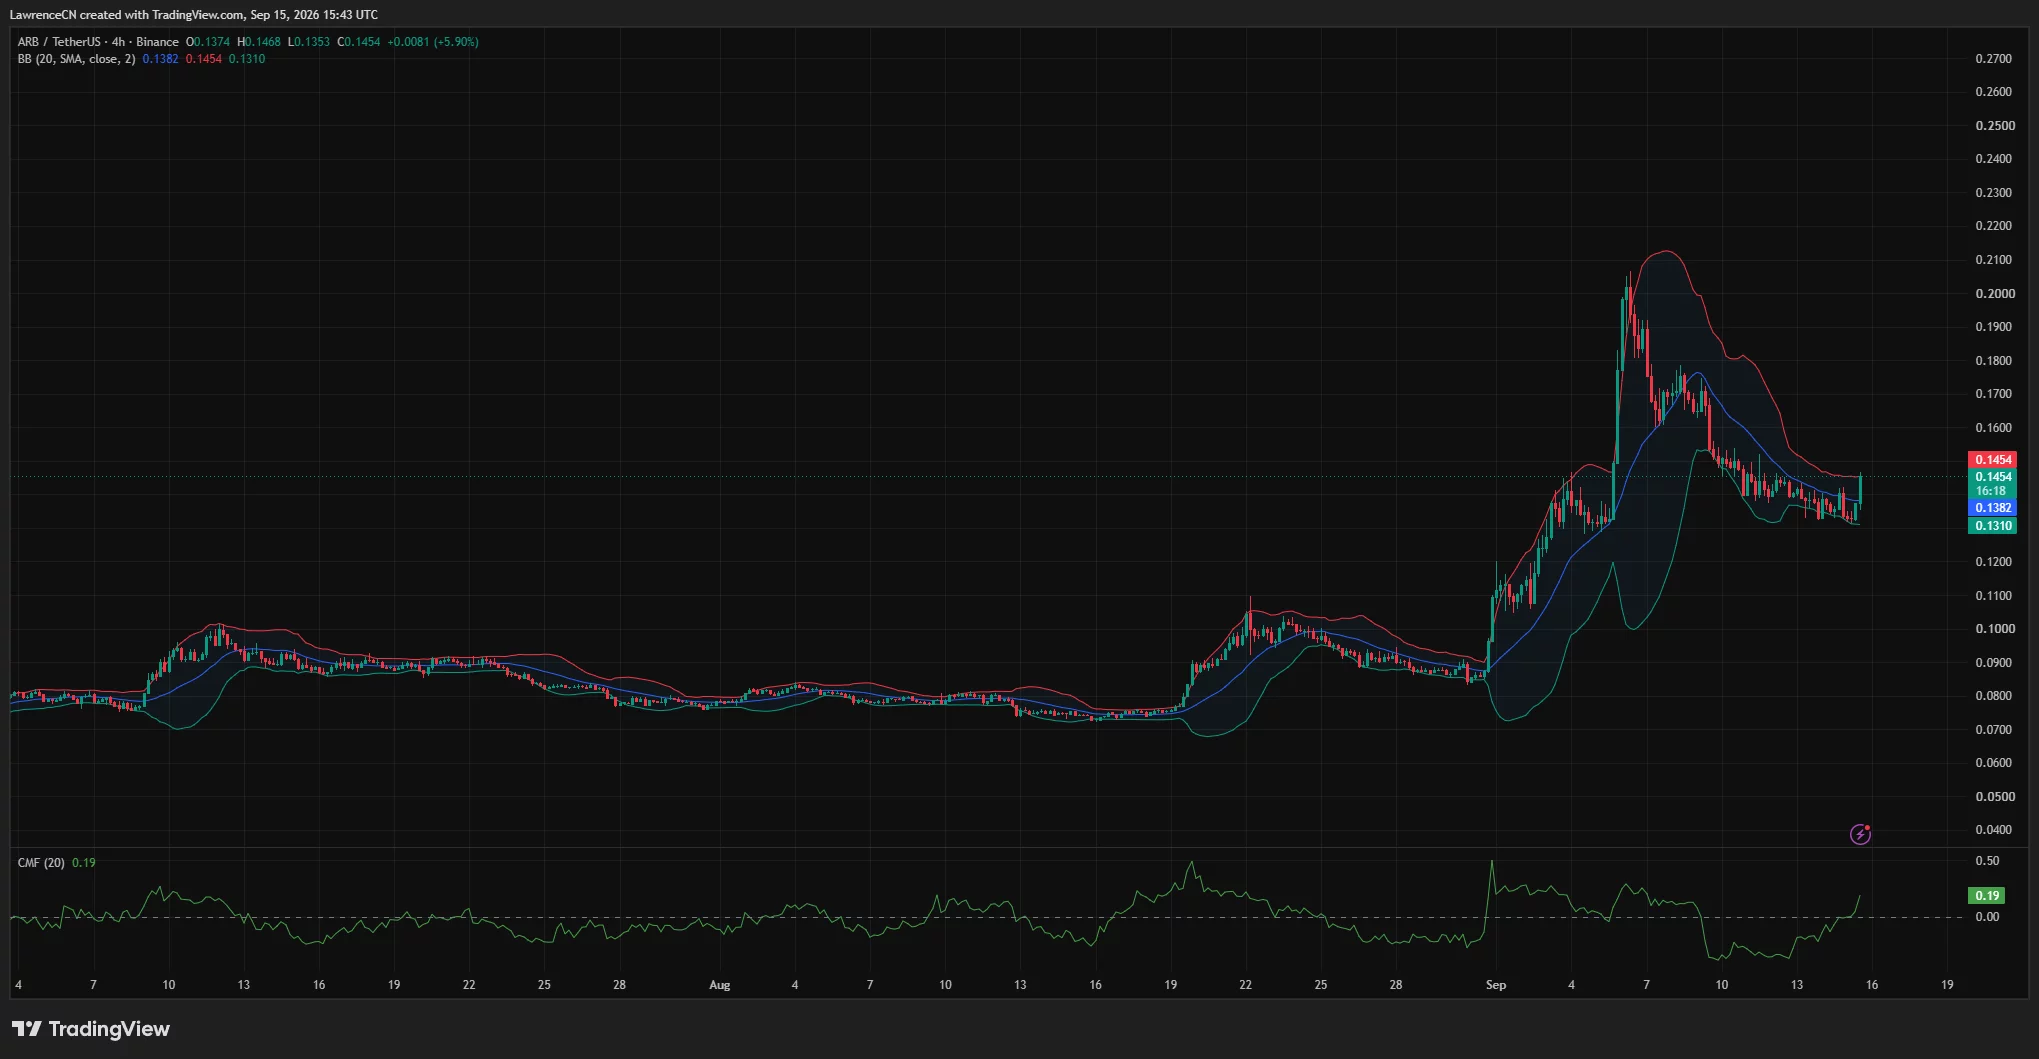
Arbitrum price rose nearly 9% on Sep. 15 as a bullish Standard Chartered forecast lifted interest in ARB, while the charts showed the token testing a dense resistance and liquidation zone near $0.155.
Summary
- Arbitrum price climbed 8.75% on the daily chart to approximately $0.145.
- Standard Chartered reportedly expects ARB to reach $10 by the end of 2030.
- Daily RSI recovered to 58.82, but MACD showed that broader momentum remained mixed.
- Liquidation data placed the largest nearby liquidity cluster between $0.154 and $0.156.
Arbitrum price rebounds toward $0.15
Standard Chartered initiated coverage of Arbitrum with a $10 price target for the end of 2030, according to a report based on comments from digital assets research head Geoff Kendrick. The forecast helped ARB recover from the support area it had tested after an earlier September rally.
Arbitrum (ARB) price traded near $0.1454 at the time of writing, up 8.75% for the daily session. The token opened at $0.1337, fell to $0.1314, and reached an intraday high of $0.1468.
The 4-hour chart recorded a 5.9% gain during the latest candle, with the price rising from $0.1374 to $0.1454. Buyers entered after ARB spent several days consolidating between approximately $0.131 and $0.145.
The rebound followed a volatile start to September. ARB climbed from below $0.09 to approximately $0.20 before sellers pushed it back toward $0.13. The daily chart still showed the token well below that monthly peak despite its latest gain.
Standard Chartered sees tokenization supporting ARB
Kendrick described Arbitrum as a potential blockchain for traditional financial institutions moving assets on-chain. The bank expects the tokenized-assets market to expand from about $340 billion to $4 trillion by the end of 2028.
Standard Chartered reportedly sees Robinhood Chain as evidence of that opportunity. The project uses Arbitrum technology, giving the network exposure to a platform focused on tokenized financial assets.
Kendrick expects Arbitrum’s monthly revenue to reach approximately $5 million in September, more than five times its level before Robinhood Chain launched. He argued that the higher revenue base could support a new valuation for ARB.
The bank set year-end targets of $0.50 for 2026, $1.50 for 2027, $3.50 for 2028, $6.50 for 2029, and $10 for 2030. Each level remains a Standard Chartered projection rather than a guaranteed price path.
A move from $0.1454 to $10 would require a gain of about 6,780%. ARB would also need to recover above several previous support and resistance areas left by its longer-term decline.
ARB faces resistance near $0.155
The 4-hour Bollinger Bands showed ARB reaching the upper band near $0.1454. Price also moved above the indicator’s middle line at $0.1382, while the lower band stood near $0.1310.
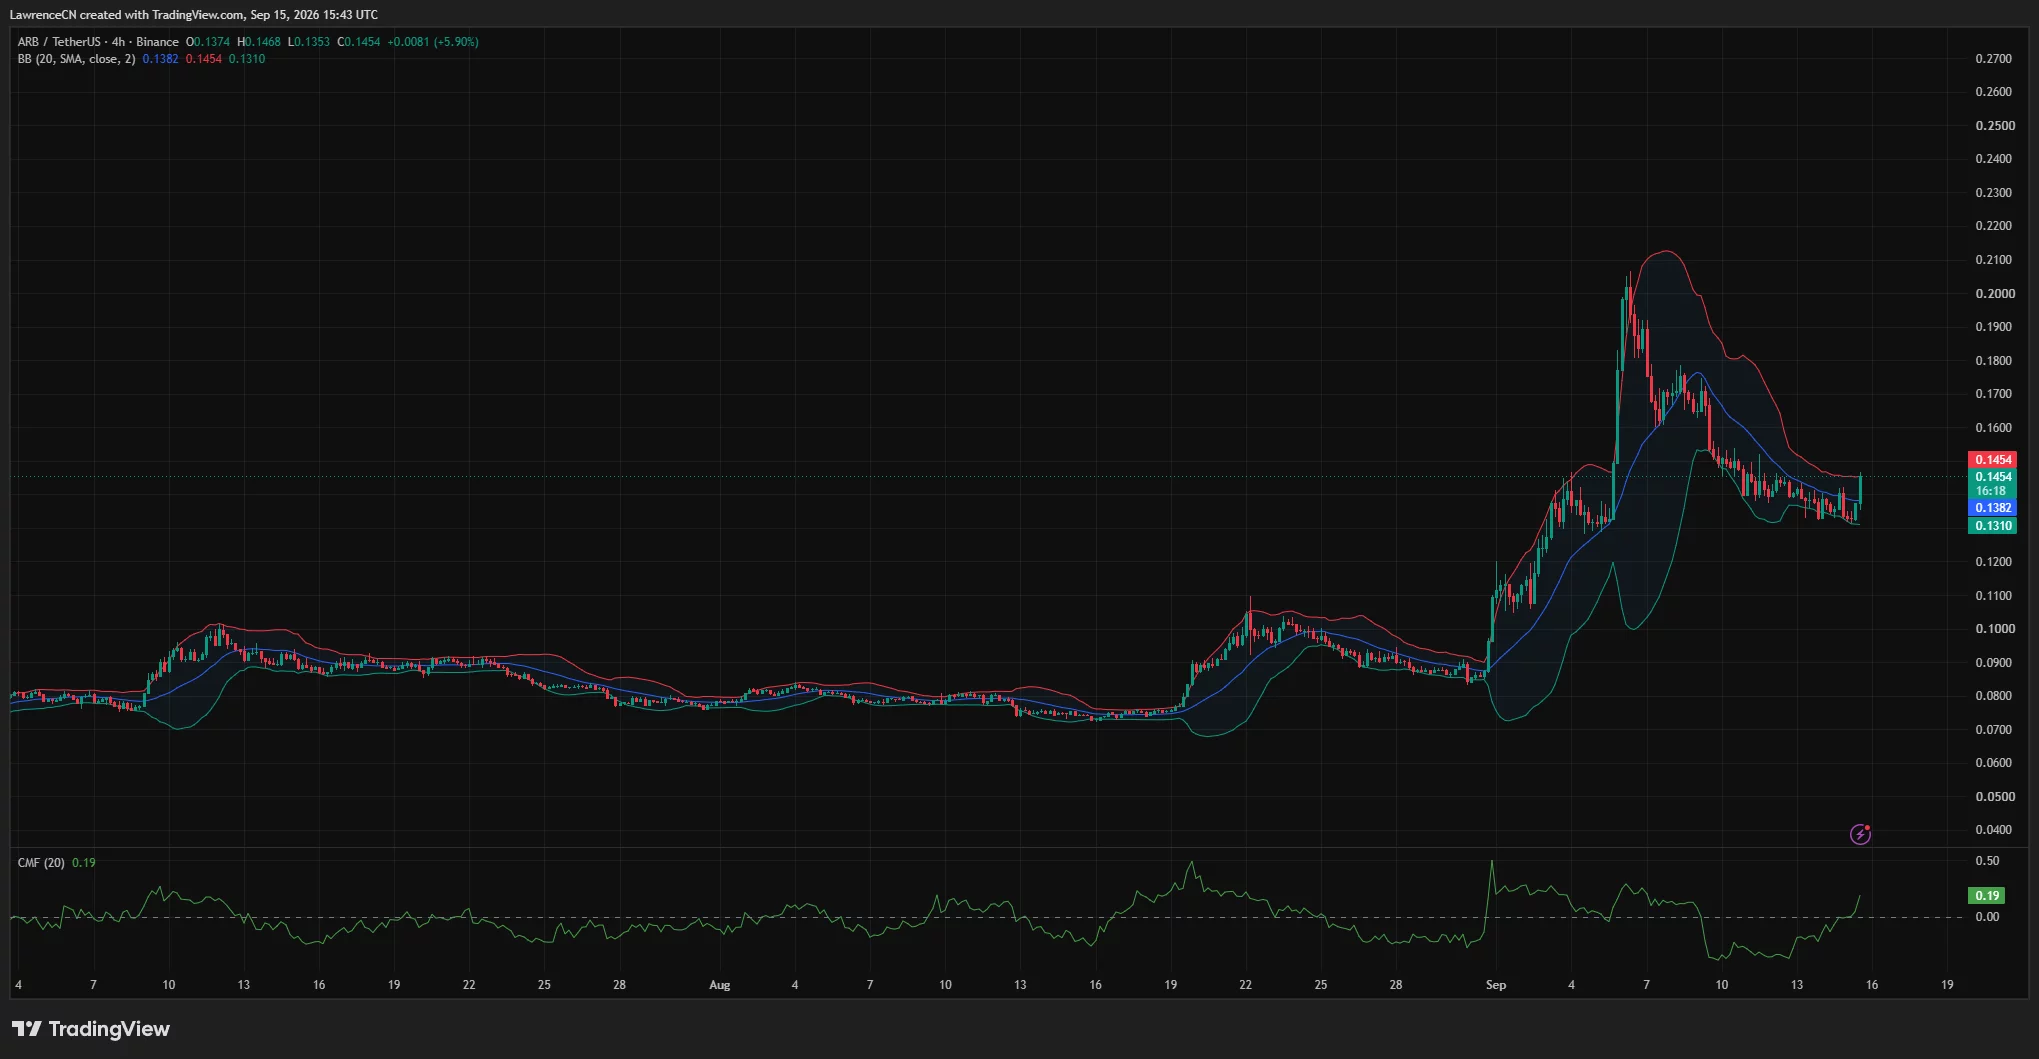
Closing above the middle band shifted the immediate structure in favor of buyers. However, trading against the upper band can leave the token open to a short-term pullback if demand does not continue.
Chaikin Money Flow rose to 0.19 on the 4-hour chart. The positive reading showed that buying pressure had strengthened during the rebound, supporting the move above $0.14.
The daily indicators offered a more cautious signal. ARB’s relative strength index stood at 58.82, above the neutral level of 50 but below the overbought threshold of 70. Its RSI average remained higher at 67.11, reflecting the loss of momentum after the early-September spike.
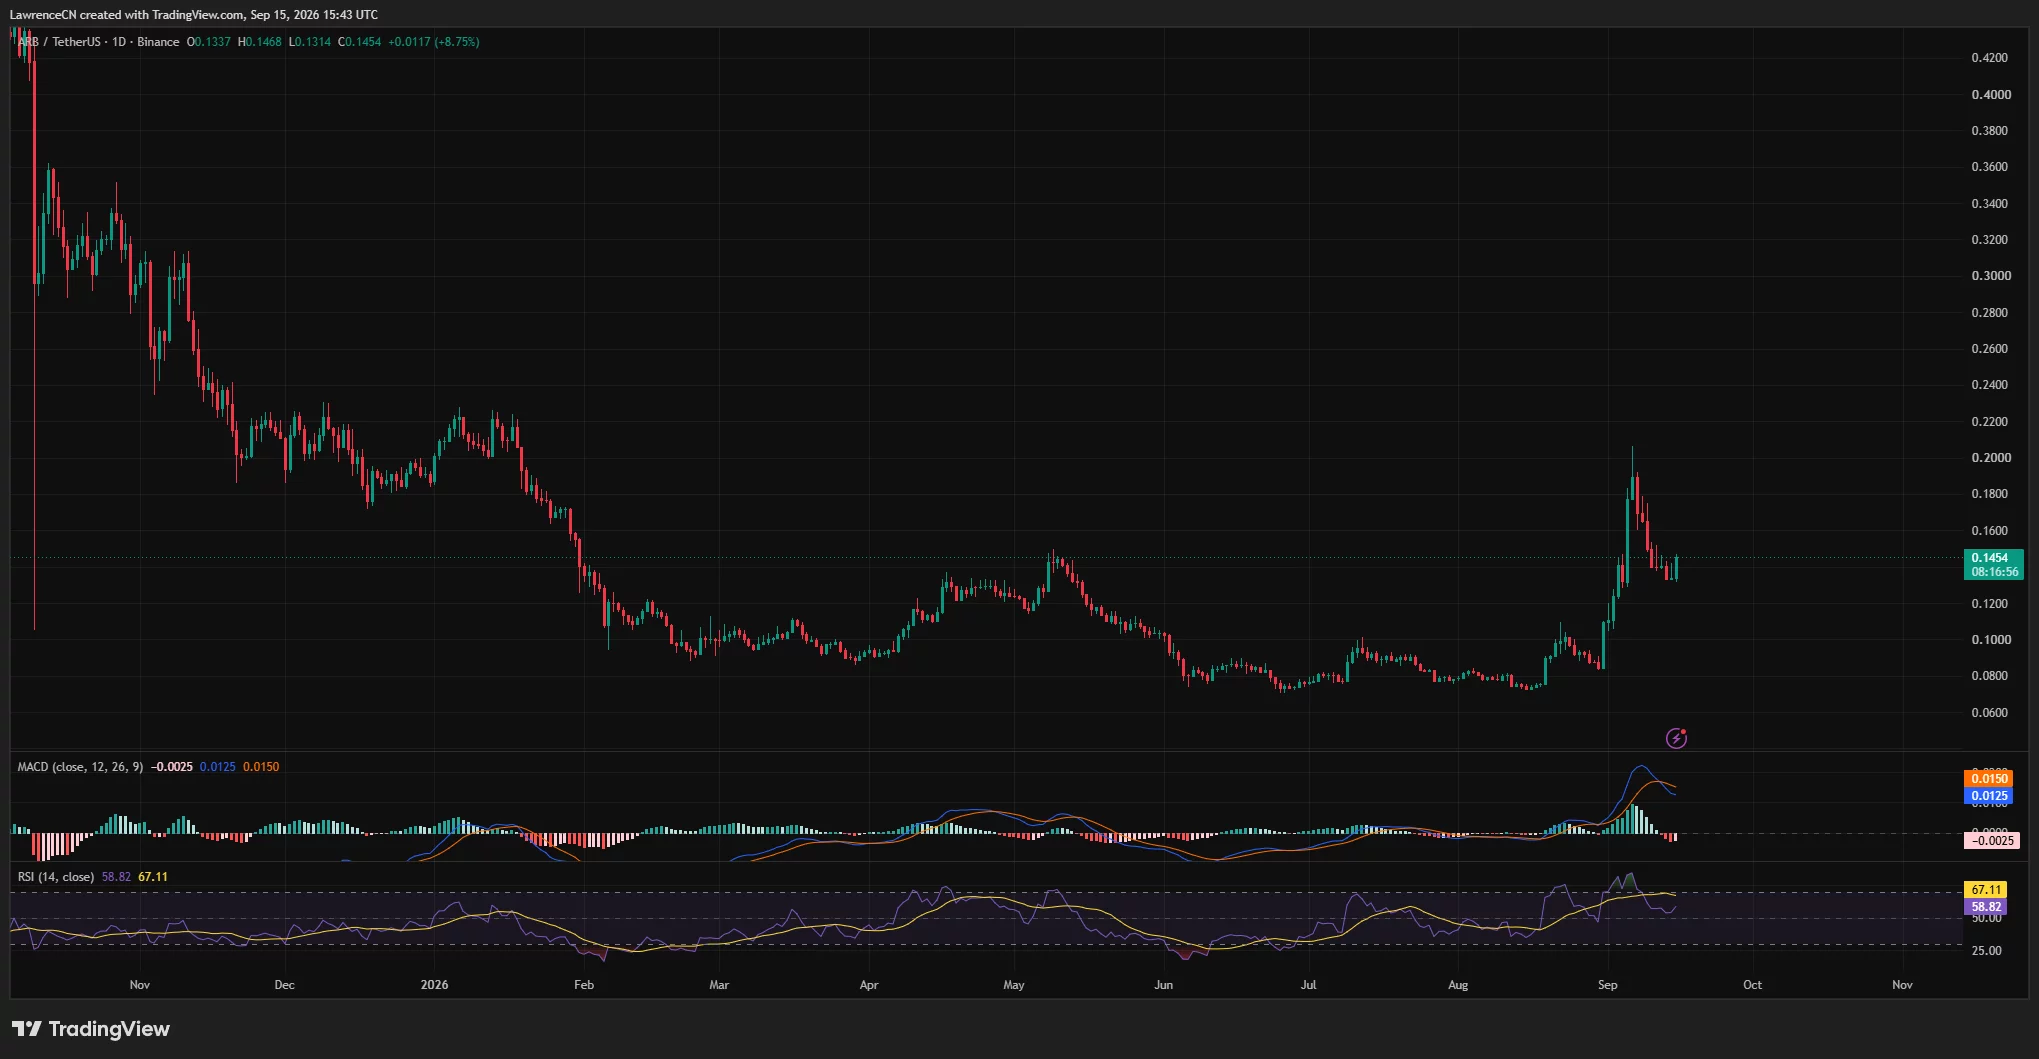
The daily MACD line stood at 0.0125, below the signal line at 0.0150. Its histogram had slipped to minus 0.0025, meaning the broader bullish impulse had not fully recovered despite the strong daily candle.
A close above $0.147 would expose the $0.150 psychological level. The one-week CoinGlass heatmap showed the strongest nearby liquidation concentration around $0.154–$0.156, making that area the next major test.
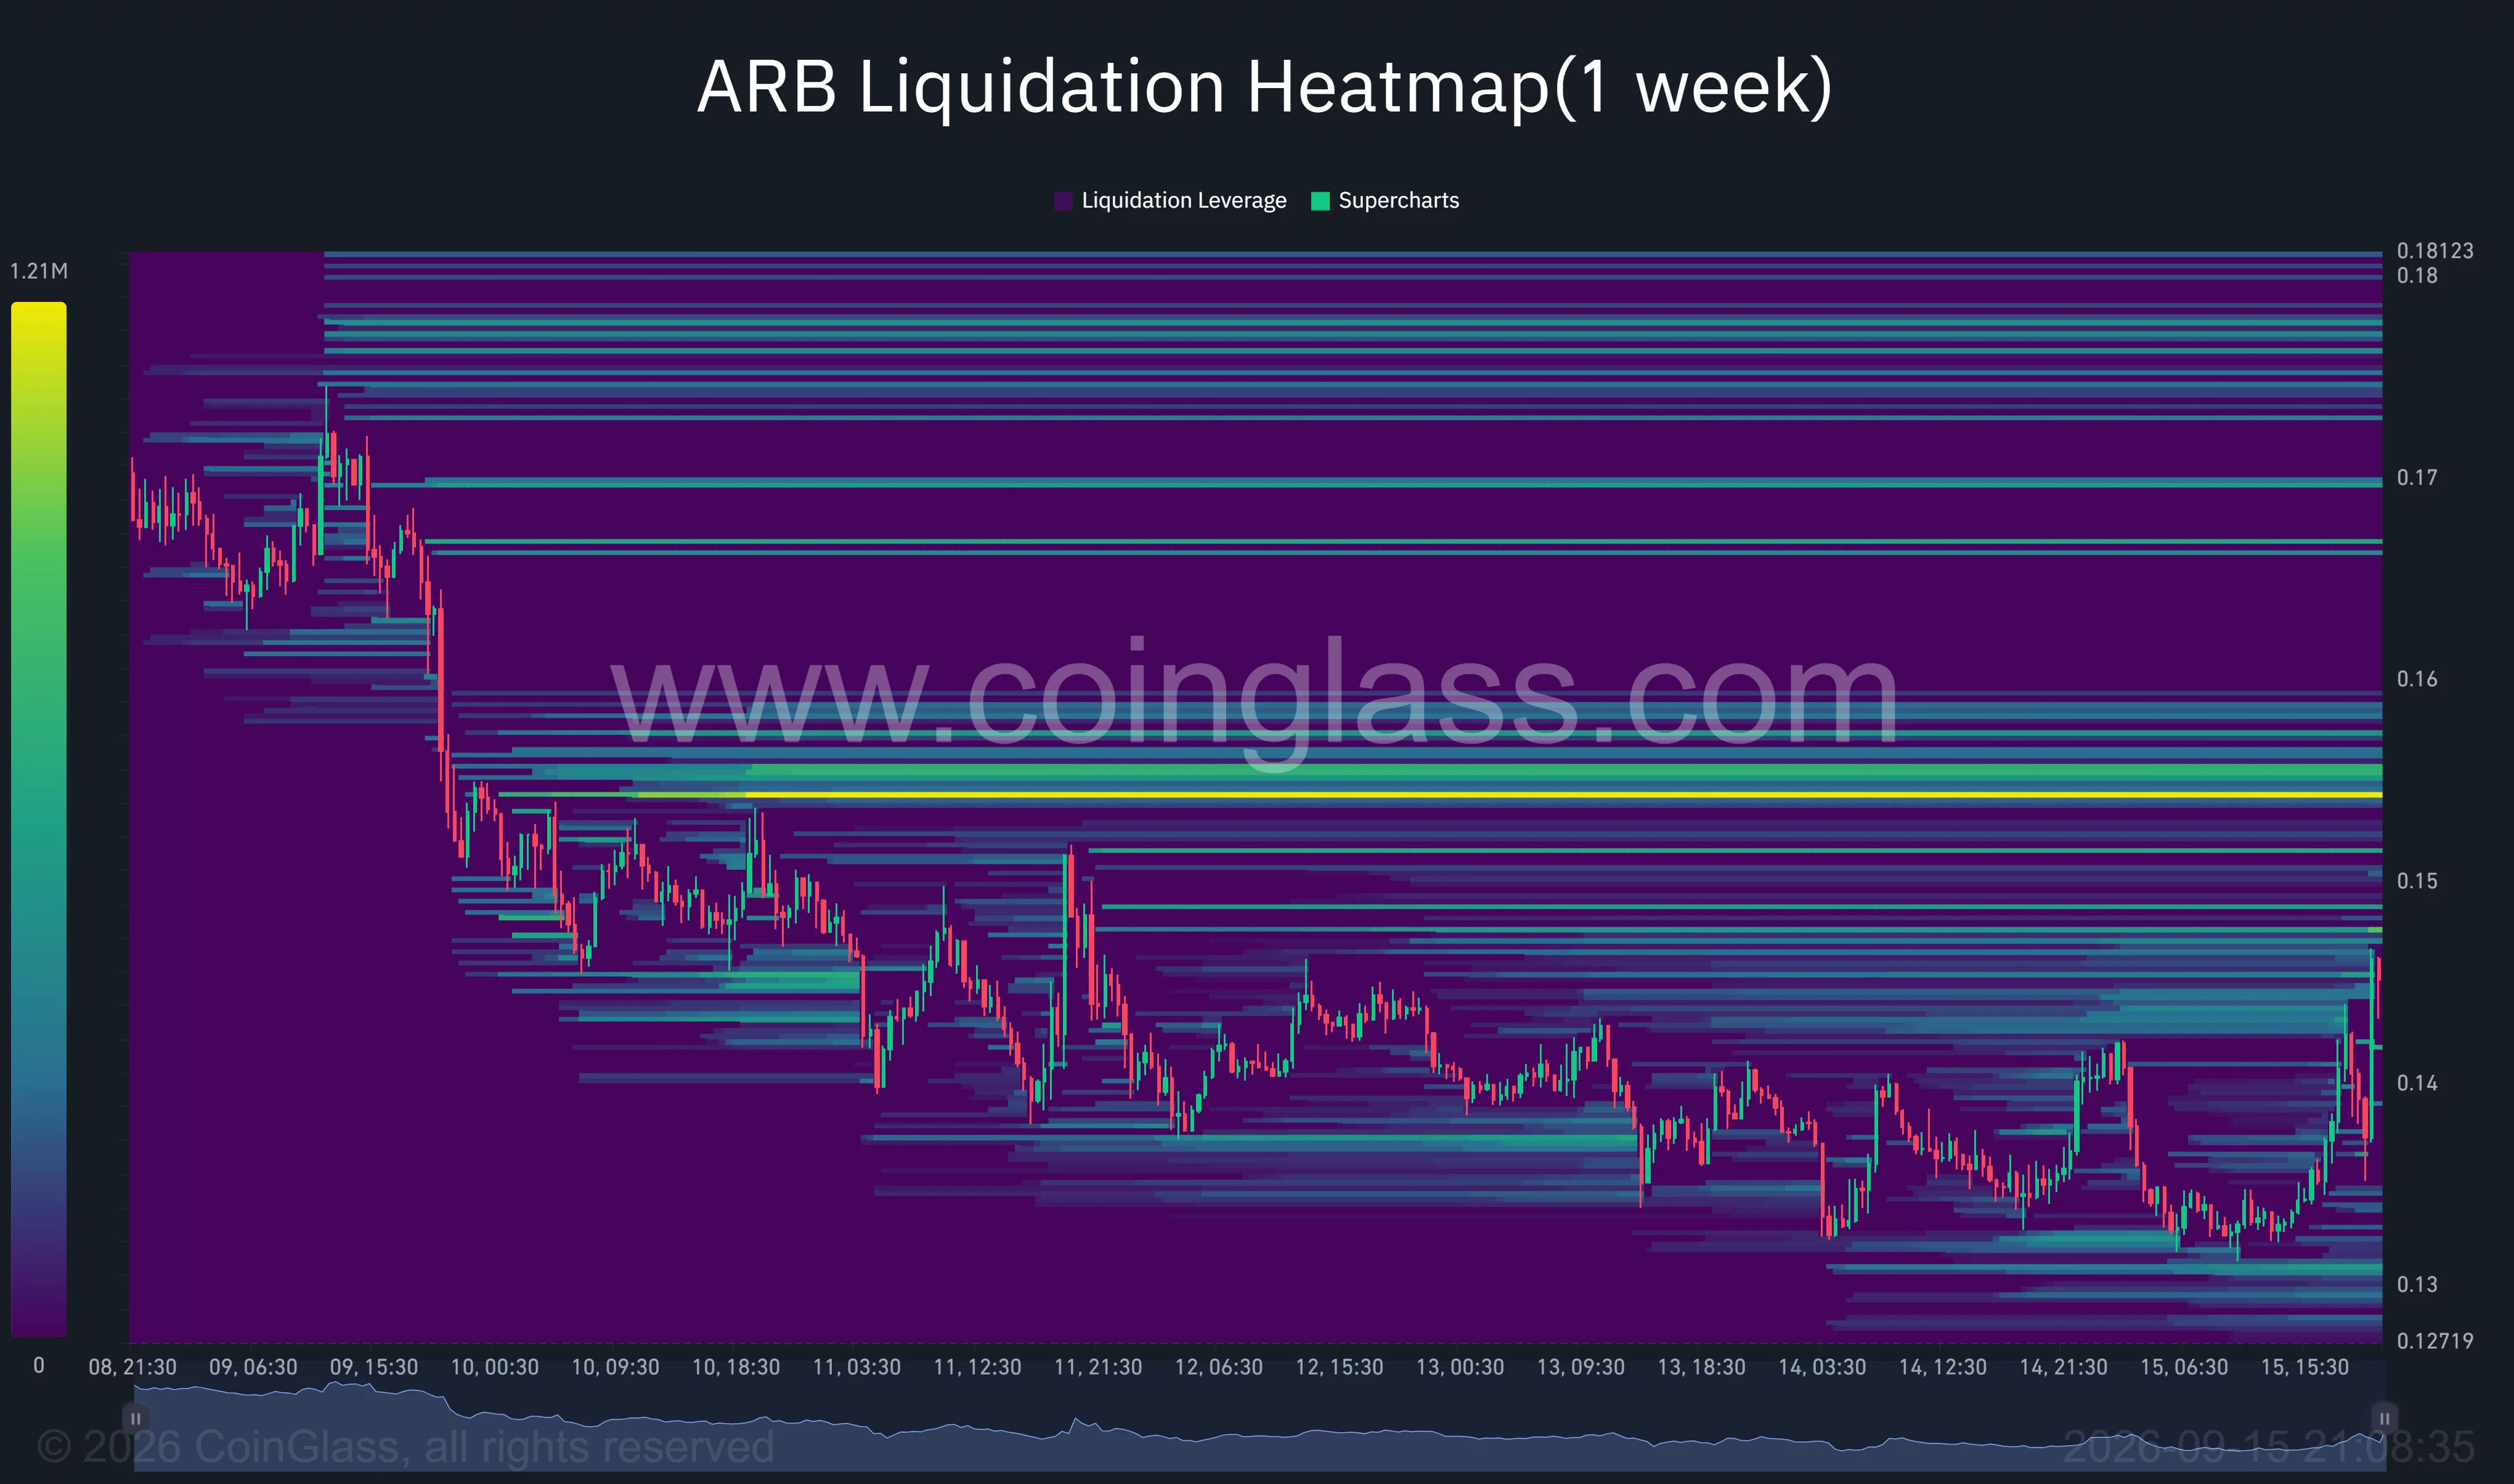
Further liquidity appeared between $0.158 and $0.160, followed by separate clusters near $0.166 and $0.170. A breakout through those zones could open a path toward the September peak between $0.19 and $0.20.
On the downside, $0.138 is the first short-term level to watch because it matches the 4-hour Bollinger midline. A loss of that level could return ARB to the $0.131–$0.133 support range, where the lower Bollinger Band and recent lows converge.
Analysts target $0.185 if support holds
Crypto analyst Michaël van de Poppe said ARB appeared to be holding its first support level and beginning to turn higher. He said the setup could lead to a sharp move toward $0.185 if the token breaks out.
The $0.185 target sits close to the upper part of ARB’s early-September trading range. Reaching it would require a gain of roughly 27% from $0.1454 and a break above the liquidation clusters near $0.155 and $0.170.
Altcoin Sherpa also identified the current area as support, attributing ARB’s recent strength partly to Robinhood-related activity. However, the analyst said the size of any continuation remained uncertain.
Both views depend on ARB holding its recent base. A daily close below $0.131 would weaken the recovery setup and place the breakout targets at risk.
Robinhood gives the rally a US market angle
Robinhood provides the clearest US connection to Standard Chartered’s thesis. CEO Vlad Tenev has described the company’s chain as being built for real-world assets, linking Arbitrum’s technology to a US brokerage seeking a larger role in tokenized finance.
The long-term effect on ARB will depend on network use, revenue generation, and the value captured by token holders. Standard Chartered’s forecast assumes that tokenization expands rapidly and that Arbitrum becomes a preferred infrastructure provider for financial firms.
For the immediate move, traders face a closer test at $0.154–$0.156. Holding above $0.138 keeps the short-term rebound intact, while a confirmed break through $0.156 would strengthen the case for an advance toward $0.17 and the analysts’ $0.185 target.
Disclosure: This article does not represent investment advice. The content and materials featured on this page are for educational purposes only.
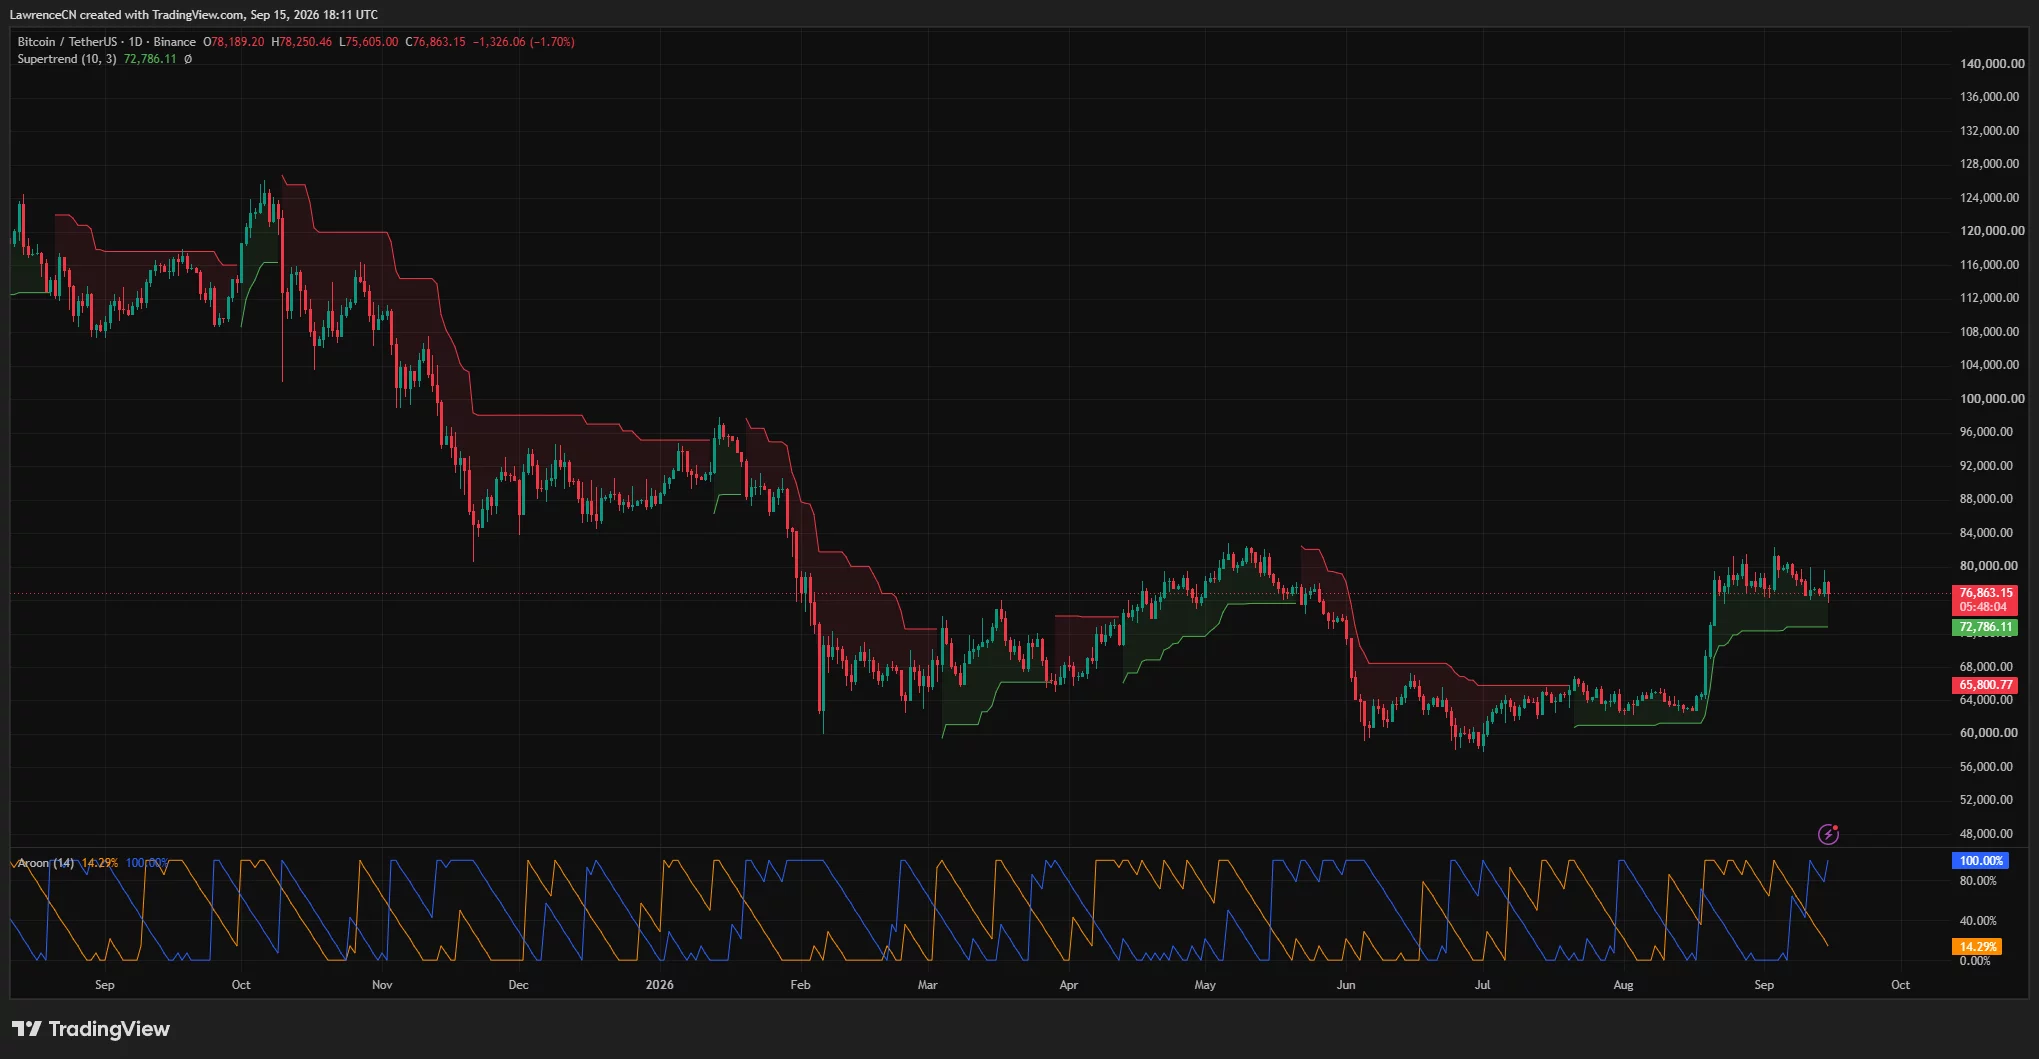
Bitcoin price slipped below $76,000 before recovering toward $76,900, with weak momentum and dense liquidation zones leaving the price vulnerable ahead of the CLARITY Act vote and Federal Reserve decision.
Summary
- Bitcoin price fell as low as $75,605 before recovering toward $76,900.
- The daily Supertrend remains bullish while 4-hour momentum lacks a clear direction.
- Liquidation clusters sit near $75,000 below and between $77,600 and $78,500 above.
- Analysts view $75,500–$76,000 as the key zone separating a rebound from a deeper fall.
Bitcoin price rebounds after falling below $76,000
According to data from crypto.news, Bitcoin (BTC) price traded near $76,863 at the time of writing after dropping 1.7% during the session. The cryptocurrency opened at $78,189, reached an intraday high of $78,250 and briefly fell to $75,605 before buyers pushed it back above $76,000.
The decline extended Bitcoin’s retreat from the $79,000–$80,000 region, where several recovery attempts have stalled since late August. Price action has since formed lower highs, showing that sellers remain active during rebounds.
Political uncertainty surrounding the Digital Asset Market Clarity Act contributed to the cautious mood. The U.S. Senate was preparing for a procedural vote requiring 60 votes to advance the legislation, while reports of disagreement between Democrats and Republicans reduced confidence in a deal.
Traders were also waiting for the Federal Reserve’s policy decision. The supplied market context showed that changing rate expectations, rising Treasury yields and elevated oil prices had reduced demand for risk assets, including cryptocurrencies.
Daily trend holds, but momentum sends a mixed signal
Bitcoin remains above the daily Supertrend level at $72,786, keeping the broader signal in bullish territory despite the latest decline. The indicator provides a wide cushion below the current market price, but it would offer little support if BTC loses the nearer $75,500–$76,000 demand area.
A sustained daily close below that zone would place the August breakout structure under pressure. The next visible support areas sit near $74,000 and the Supertrend level around $72,800.
The daily Aroon indicator presents a mixed reading. Aroon Up stands at 100%, showing that a recent high remains influential within the indicator’s lookback period. Aroon Down, however, has risen to 14.29% as the price moves closer to the lower end of its recent range.
The difference suggests that the wider trend has not fully reversed, although short-term weakness is building. Bitcoin must recover the $78,000–$80,000 area to restore a clearer upside structure.
A close above $80,000 would expose the recent highs near $81,000–$82,000. Failure to regain $78,000 would leave rallies vulnerable to renewed selling.
4-hour chart shows weak trend strength
The 4-hour chart confirms a less decisive short-term setup. Bitcoin traded near $76,869, below the Bollinger Bands’ middle line at $77,404 and close to the lower band at $76,180.
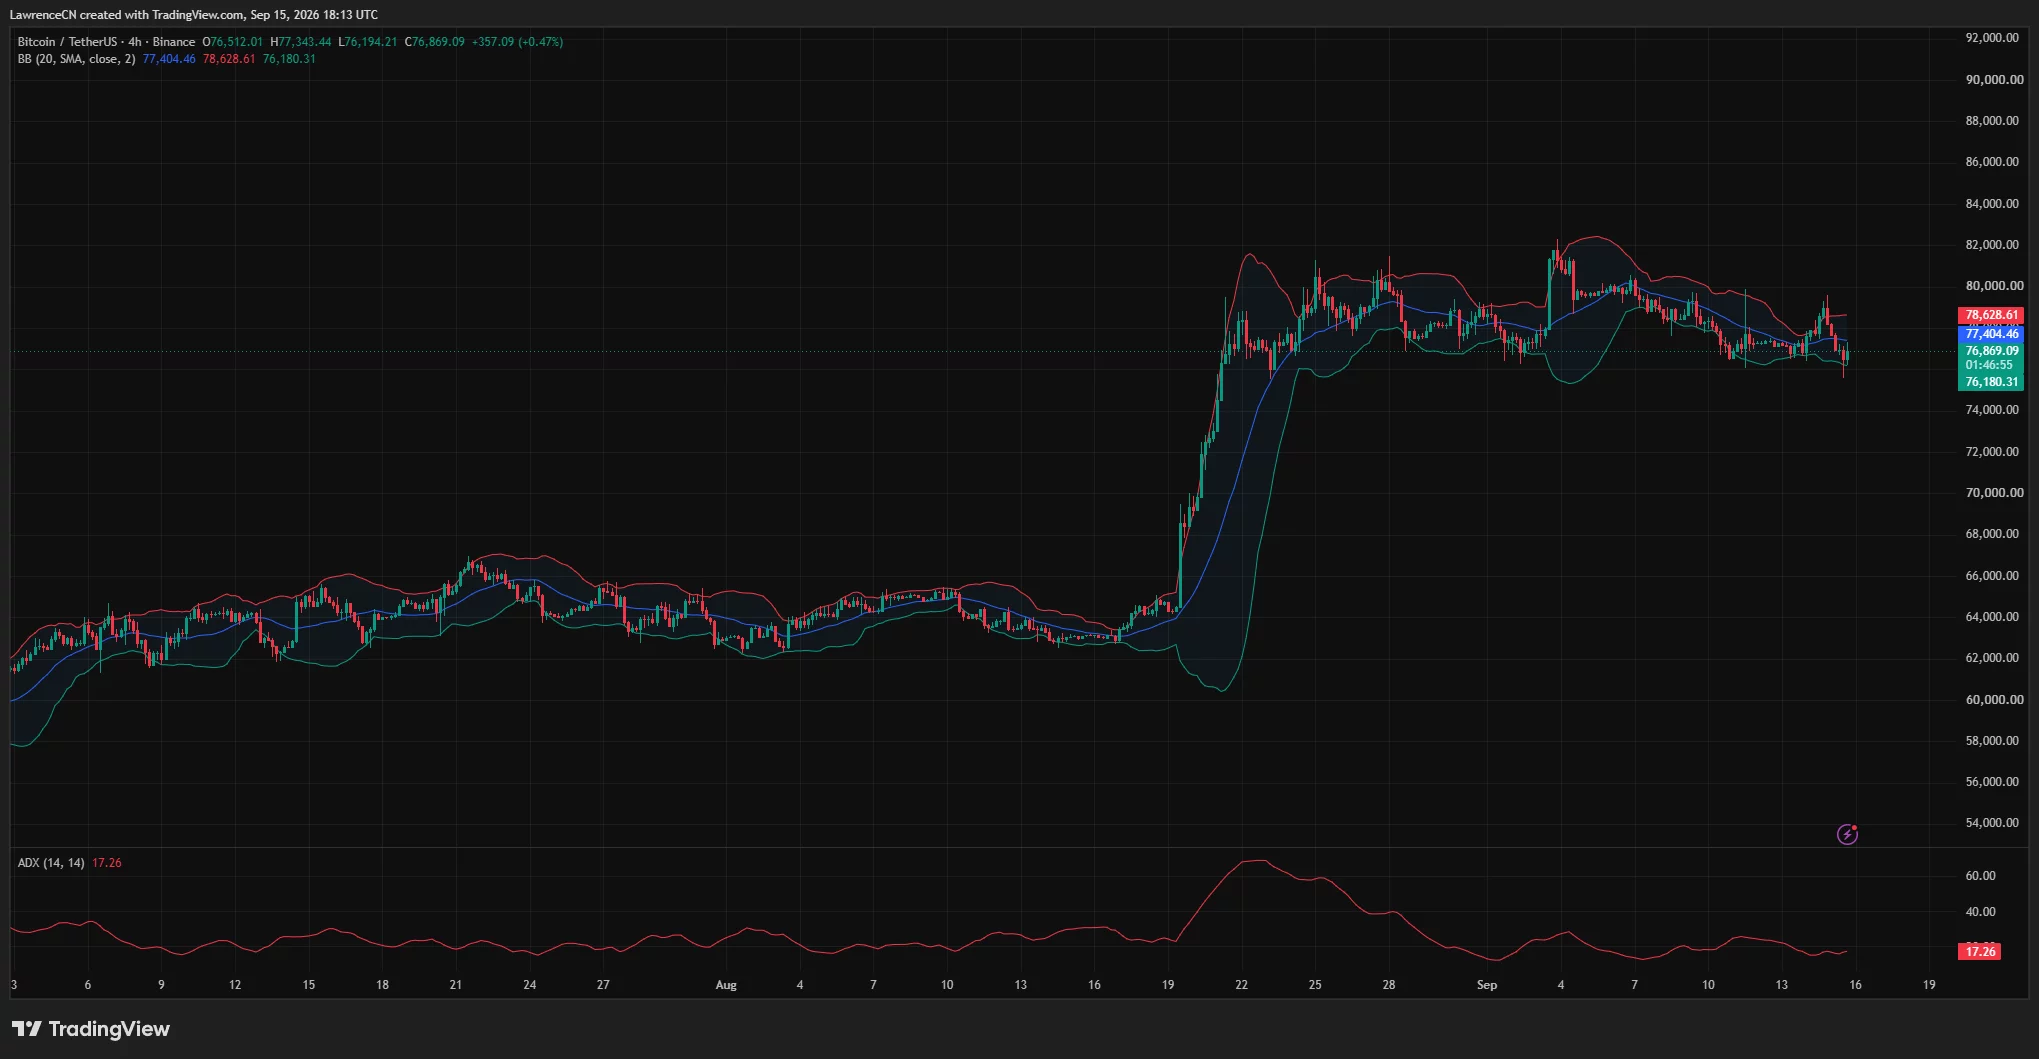
Trading near the lower band reflects persistent selling pressure, although it also leaves room for a short-term rebound if the lower boundary continues to hold. The upper Bollinger Band at $78,629 forms the next major resistance level above the midpoint.
Bitcoin’s 4-hour Average Directional Index stood at 17.26. An ADX reading below 20 typically points to weak trend strength, meaning neither buyers nor sellers have established firm control despite the sharp intraday swings.
The combination of a low ADX and price near the lower Bollinger Band favors continued consolidation unless BTC breaks decisively outside the range. A move above $77,400 would be the first sign of improving momentum, followed by resistance between $78,000 and $78,630.
On the downside, a 4-hour close below $76,180 would increase the risk of another test of $75,500. Losing the intraday low at $75,605 could then open the path toward $74,000.
Liquidation clusters could amplify the next Bitcoin move
The 24-hour CoinGlass liquidation heatmap shows concentrated leverage on both sides of the current price. The strongest nearby liquidity above Bitcoin appears around $77,600–$77,800, with another large cluster extending through approximately $78,200–$78,500.
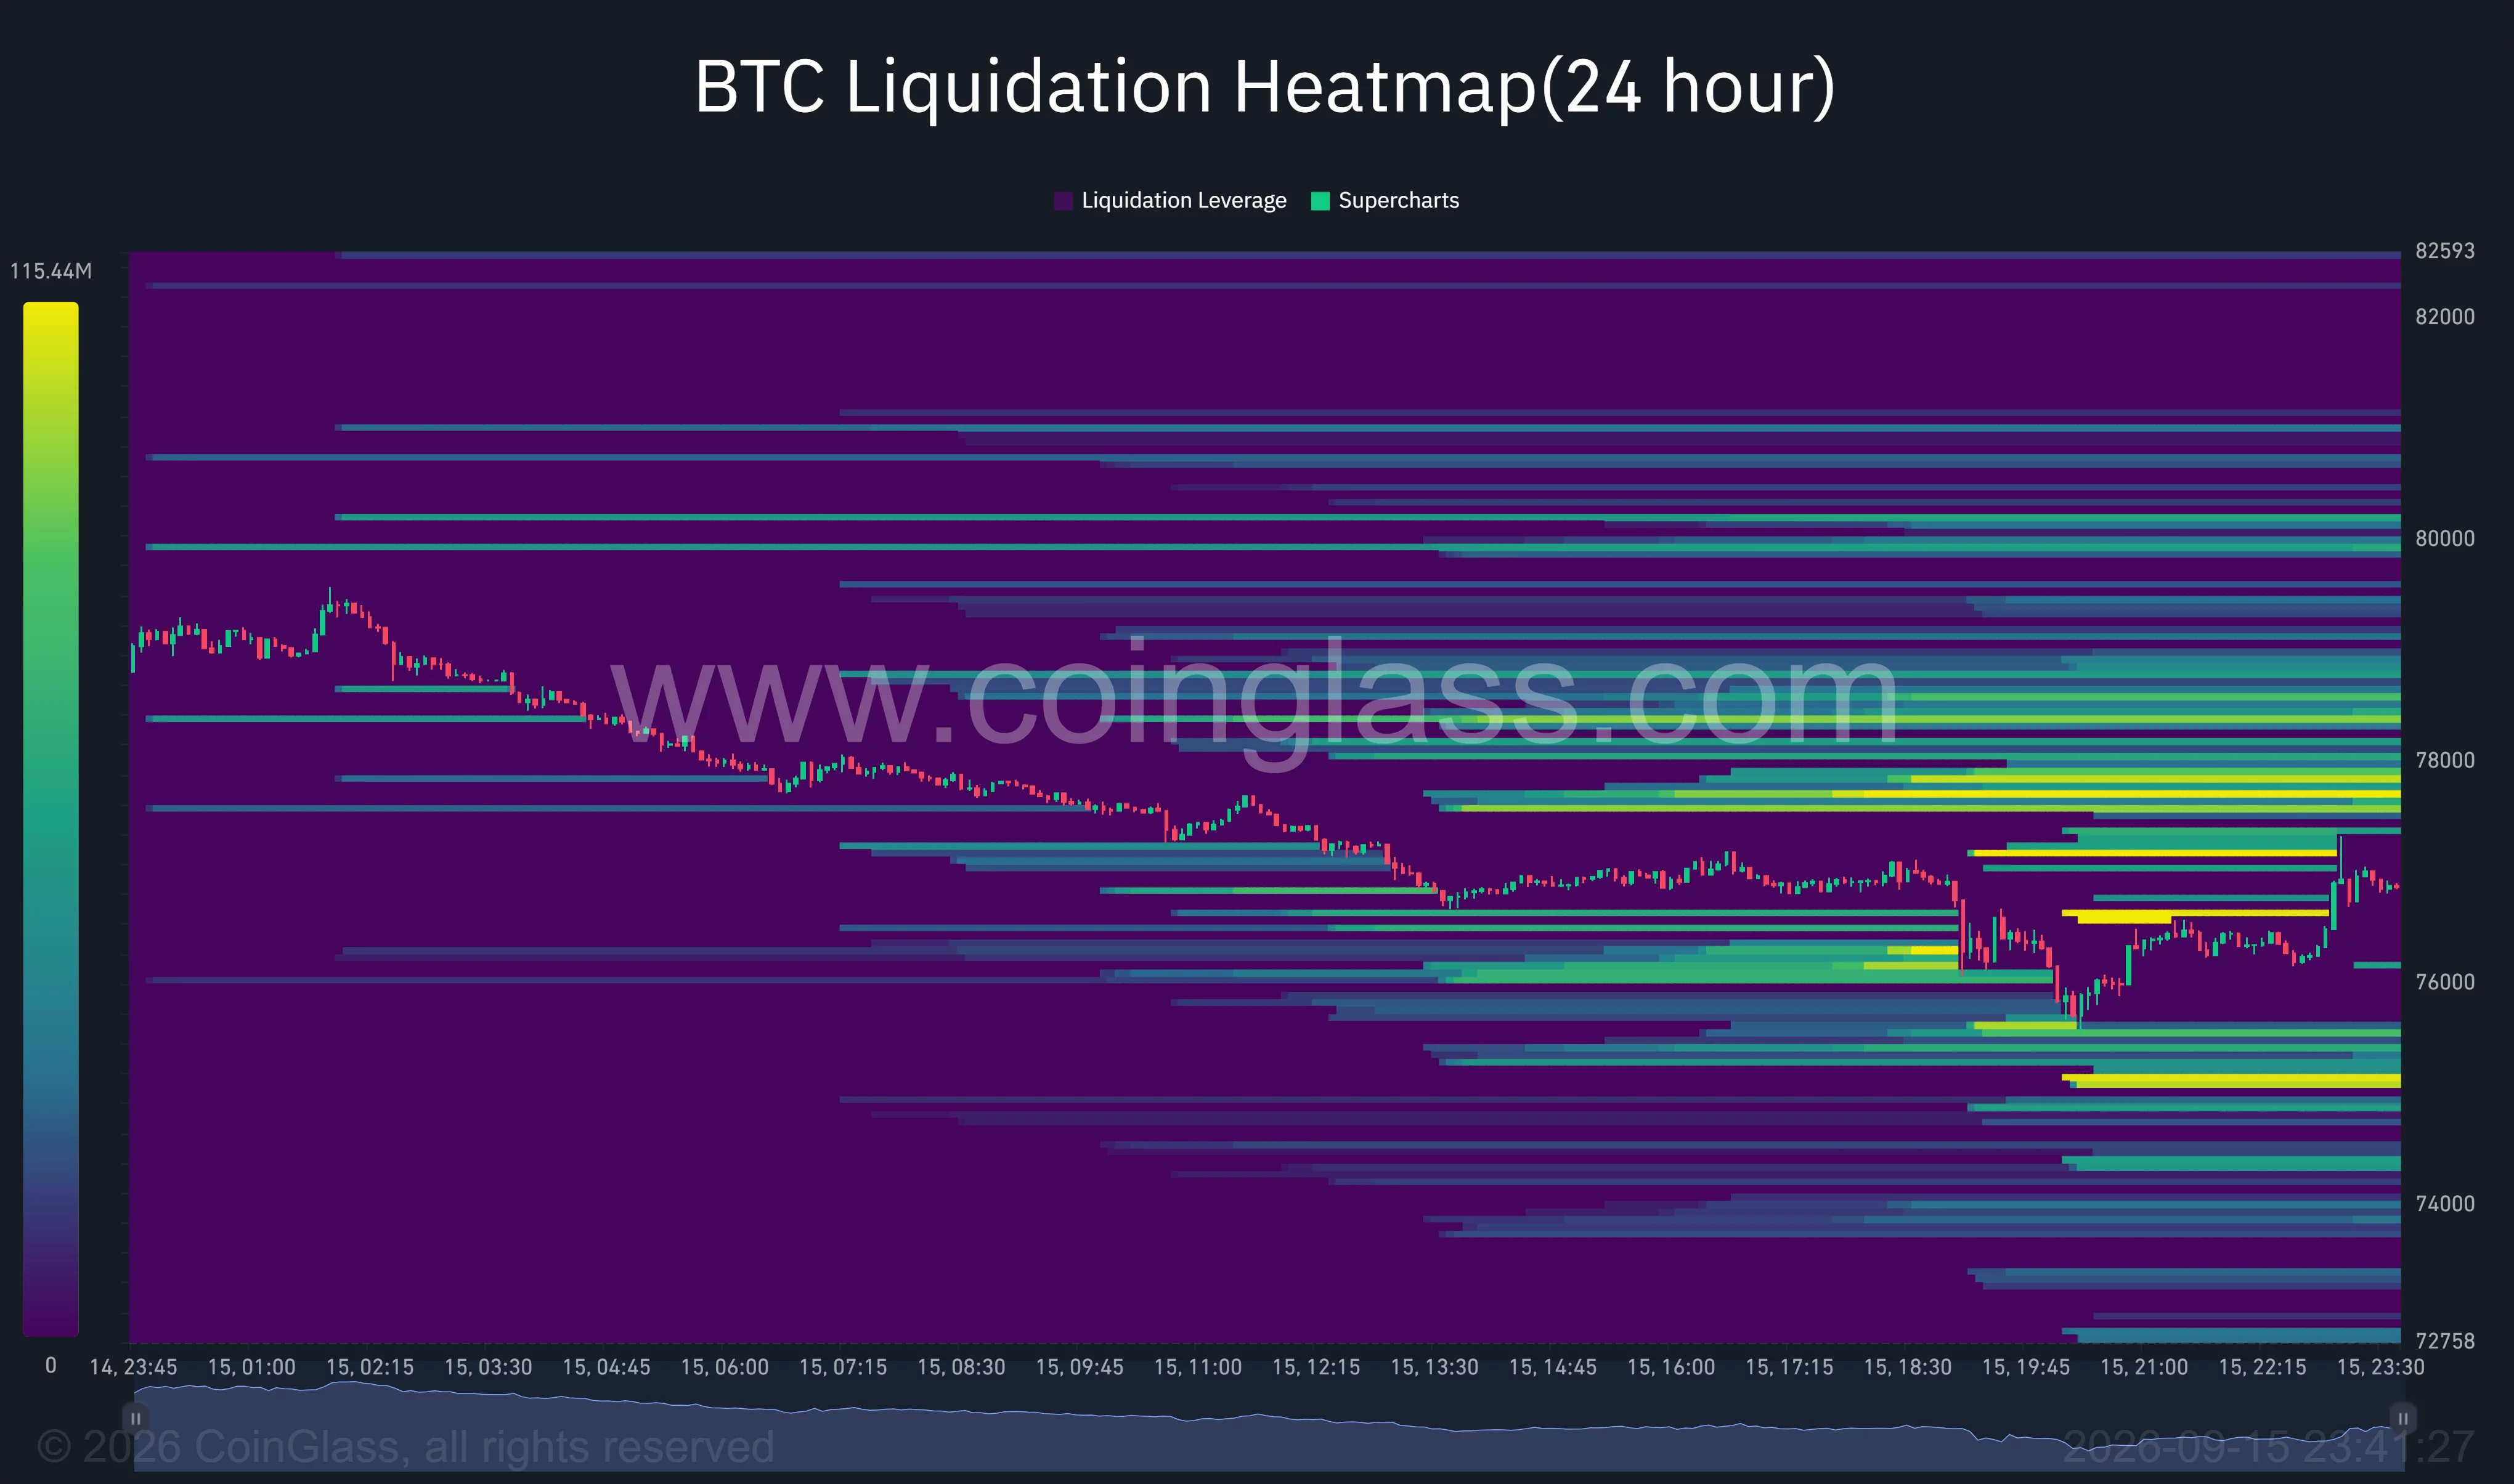
Additional liquidity is visible near $80,000. A rebound through $77,400 could draw the price toward these upper clusters as short positions face pressure.
Below the market, the clearest liquidation concentration sits close to $75,000, followed by smaller pools around $74,000 and $73,000. A break below $75,500 could therefore accelerate the decline as leveraged long positions are closed.
The two-sided concentration fits the weak ADX reading. Bitcoin remains inside a market where nearby leverage could pull the price sharply in either direction once the current range breaks.
Analysts identify $75,500 as Bitcoin’s key support
Pseudonymous trader Altcoin Sherpa called the current area a “do or die level” and said losing it could send Bitcoin toward $72,000. The analyst’s chart placed the main support band around $75,000–$76,000, broadly matching the daily and 4-hour technical levels.
Trader Lennaert Snyder said Bitcoin had swept the previous week’s low near $76,000 and reacted bearishly afterward. His preferred scenario involved a brief move below $75,500 followed by a rebound, rather than an extended breakdown.
Snyder’s chart mapped a wider demand zone around $75,000–$76,000 and identified overhead resistance near $78,000, $79,500, and $80,500. He tied the next major move to the CLARITY Act vote and the Federal Reserve decision.
The technical evidence leaves Bitcoin at a decision point. Holding $75,500–$76,000 could support a recovery toward $77,400 and $78,600, while a confirmed breakdown would bring $74,000 and the daily Supertrend near $72,800 into view.
Disclosure: This article does not represent investment advice. The content and materials featured on this page are for educational purposes only.

Christopher Phelan, chairman of the Council of Economic Advisers (CEA), said a Fed rate hike would be a mistake. The Federal Reserve is set to announce its rate decision today.
Phelan made the comments on CNBC’s Closing Bell Overtime, citing recent inflation data as the reason a hike is unnecessary. The Federal Open Market Committee (FOMC), the Fed’s rate-setting body, meets this week.
Inflation Data Undercuts the Case for a Hike
Phelan argued inflation has trended lower over the past three months. He pointed to every major gauge, including the Consumer Price Index (CPI) and the Personal Consumption Expenditures (PCE) index.
He noted the Fed held off on raising rates months ago when inflation ran hotter. That makes a hike now harder to justify, he said.
The debate comes as President Donald Trump has pushed the Fed to lower interest rates. A hike would move policy in the opposite direction Trump has publicly favored.
“No matter how you measure it, inflation is coming down. They didn’t choose to raise rates 3 months ago when inflation was higher. It doesn’t make sense to raise rates now in my view.”
Christopher Phelan, Chairman of the Council of Economic Advisers, via CNBC
What a Hike Would Mean for Markets
Phelan’s comments land as Bitcoin faces rising odds of a Fed hike this week. Traders have priced that scenario as a headwind for risk assets.
Higher rates tend to pressure Bitcoin (BTC) by making non-yielding assets less attractive next to bonds.
Fed Chairman Kevin Warsh has said the cheap-money era is ending. He has also signaled the Fed still has work to do on inflation, a stance Phelan pushed back against.
Fed watchers expect the committee to be closely divided again. A similar split emerged at the FOMC’s July meeting, when the panel held rates steady by a nine-to-three vote.
Whether Warsh sides with Phelan’s inflation reading, or with FOMC members favoring a hike, will shape borrowing costs. It will also shape risk appetite across markets in the sessions ahead.
Markets will watch Warsh’s press conference closely for signals on the final vote.
The post White House Adviser Phelan Warns Fed Rate Hike Today Would Be a Mistake appeared first on BeInCrypto.
Standard Chartered is making the case that Arbitrum could become one of the strongest performers in crypto through 2030, arguing that the network’s revenue mechanics may benefit as traditional finance ramps up onchain activity. In a note shared with Cointelegraph, Geoff Kendrick, the bank’s global head of digital assets research, pointed to Arbitrum’s economic design as a potential source of growth beyond crypto-native usage.
Kendrick said Arbitrum receives 10% of the net protocol revenue generated by businesses building on the network. He highlighted Robinhood Chain—an Ethereum layer-2 initiative tied to the online brokerage Robinhood—as an early test case for how tokenization-focused applications could shift Arbitrum’s financial profile. According to Kendrick, the impact has already been visible in the network’s revenue run rate.
Key takeaways
- Standard Chartered forecasts Arbitrum’s protocol revenue share could meaningfully grow as more traditional financial assets move onchain.
- Arbitrum’s design gives it 10% of net protocol revenue from companies building on the network.
- Standard Chartered credits Robinhood Chain with materially changing Arbitrum’s economics, projecting $5 million revenue in September.
- Kendrick expects those economics could support a multi-year rise in ARB, potentially reaching $10 by 2030.
- Key risks include tokenization adoption slowing and increased competition from other chains.
Why Standard Chartered thinks Arbitrum’s revenue can scale
At the center of Standard Chartered’s bullish outlook is the idea that Arbitrum’s growth is not just about user activity, but about the network’s share of protocol revenues. Kendrick framed the pathway as follows: as regulated institutions and financial firms bring more assets onto blockchain infrastructure—especially through tokenized real-world asset (RWA) products—layer-2 networks that support these deployments could capture recurring value.
Robinhood Chain is presented as a concrete example of that dynamic. In the note, Kendrick argued that its launch has already affected Arbitrum’s economics. He stated that, at the current run rate, Arbitrum is expected to generate $5 million in revenue in September, which he said is more than five times the level it was at before Robinhood Chain launched in July.
For investors and traders, this matters because it shifts the narrative from “layer-2 usage” alone to “layer-2 monetization.” If tokenized asset workflows generate sustained protocol revenue, the token incentives and long-term demand for the network’s native asset could plausibly benefit. Standard Chartered’s framing is essentially that the token’s value proposition is tied to business adoption and network economics rather than only retail activity.
From protocol economics to ARB price assumptions
On price, Kendrick’s view is aggressive but anchored to the bank’s revenue-based logic. He expects Arbitrum’s economics to support a steady increase in ARB through the rest of the decade, forecasting that the token could reach as high as $10 by 2030. The bank’s projection implies roughly a 70-fold increase from current levels.
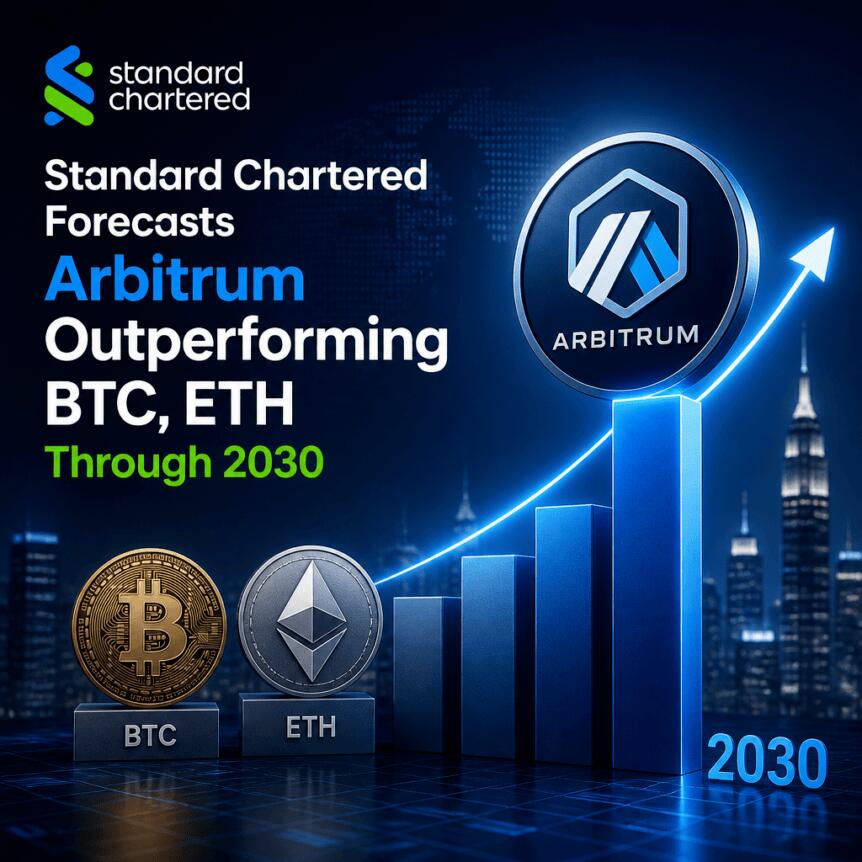
Standard Chartered also contrasted its outlook for Arbitrum with its expectations for Bitcoin and Ether over the same period, saying its projected returns for ARB would be far higher. While price forecasts are inherently uncertain, the bank’s stated method is noteworthy: the thesis is built around a growing revenue stream for the protocol rather than purely speculative momentum.
At the time of the note, ARB was valued at around $0.14, according to CoinGecko, after gaining 86% over the past month.
Tokenized real-world assets are the engine in the model
Standard Chartered’s argument is heavily influenced by the momentum in tokenization. Kendrick pointed to cumulative RWA tokenization nearing $39 billion, citing RWA.xyz data. The bank also reiterated its broader forecast that tokenized assets could reach $4 trillion by the end of 2028, as banks and asset managers bring more assets onchain.
In that scenario, layer-2 networks like Arbitrum are positioned as infrastructure providers. The bank’s logic is that when tokenization shifts from experiments to larger deployments, businesses building on these networks can generate net protocol revenue—part of which flows back to Arbitrum under the 10% share model.
Standard Chartered has previously tied its wider crypto views to tokenization growth, including a bullish stance toward Chainlink and the broader decentralized finance sector in the context of a growing onchain asset base. The Arbitrum note continues that through-line: as more “real-world” exposure is issued onchain, the infrastructure that supports issuance, settlement, and related services may capture more durable value.
Key uncertainties and competitive pressure
Despite its optimism, Kendrick highlighted risks that could derail the bank’s price framework. He identified two major uncertainties: a slower-than-expected pace of asset tokenization and more competition from alternate blockchains.
This is an important tension for readers to consider. Arbitrum’s potential upside depends not only on technical and adoption milestones, but also on whether tokenized assets concentrate on specific L2 ecosystems or diversify across multiple networks. If tokenization expands but spreads across competing platforms, Arbitrum’s revenue share—and therefore the earnings-to-token linkage Standard Chartered is leaning on—could be diluted.
There is also a timing element embedded in the forecast. Kendrick’s projected revenue run rate growth and the resulting ARB outlook assume that new deployments and monetization mechanisms ramp in a way that sustains protocol revenues over time. Any mismatch between “asset issuance growth” and “protocol monetization” would likely force the thesis to be recalibrated.
As the market digests this note, the next things to watch are whether tokenization activity on Ethereum layer-2s keeps accelerating and whether Robinhood Chain—or other tokenization-oriented deployments—continues to translate into measurable net protocol revenue for Arbitrum. The pace of tokenized asset adoption and the intensity of competition between alternative chains may determine how closely reality tracks Standard Chartered’s multi-year model.

Why there will be even more potholes on our roads this winter

5 Things to Know About the Leading Firms To Consider For Your Claims in 2026

China’s AI leaders keep quiet despite U.S. ‘publicity’ on tech risks



-

 Fashion4 days ago
Weekend Open Thread – Corporette.com
-

 Business6 days ago
Micron Stock Climbs Above $1,031 as AI Memory Crunch and a $50 Billion Outlook Fuel the Rally
-
 Tech3 days ago
The Latest Weird Thing to Play Doom Is the Mapped-Out Brain of a Fruit Fly
-

 Business6 days ago
AMD Stock Climbs After Management Lifts 2027 Data Center Outlook Toward $70 Billion in AI Sales
-

 Crypto World5 days ago
XAG/USD: Silver’s Short-Term Rally Meets Its Moment of Truth
-

 Business5 days ago
10 Most-Streamed Songs On Spotify In 2026 So Far, Led By Ella Langley’s Dominant Run On The Charts This Year
-
 Crypto World6 days ago
2 Chip Stocks Broke Out This Week. Neither Was Nvidia
-

 Crypto World6 days ago
Pi Network ships Protocol 27 on a network with 14 million users and zero DeFi
-

 Tech5 days ago
Battery life is the only iPhone 18 Pro and iPhone Duo upgrade I care about. Apple didn’t disappoint
-

 Crypto World5 days ago
Diesel Tops $6 a Gallon for the First Time as 28 States Set Records
-

 Crypto World5 days ago
OKX launches 10x OpenAI, Anthropic X-Perps in Europe
-

 Tech6 days ago
Apple Watch Ultra 4 vs Watch Ultra 3: Should you really spend another $799?
-

 News Videos5 days ago
Facing Financial Fears
-
 Tech7 days ago
Modders have already found two ways to make DLSS 5 playable, and neither one is Nvidia’s
-
 Crypto World6 days ago
Bitcoin price risks $70K if $78K neckline breaks
-
 Crypto World7 days ago
Bitcoin price holds near $79K as cycle drawdowns narrow
-

 Entertainment6 days ago
Case Sees Major Update As Jury Deliberations Begin
-

 Crypto World2 days ago
Elon Musk Drops a Bombshell: Grok 5 Could Be the AGI Breakthrough
-

 Business3 days ago
Rivals Sam Altman and Elon Musk Rally Behind Dario Amodei’s Call for a Slowdown in AI Development
-
Crypto World5 days ago
Ethereum Price Analysis: Consolidation at $2.5K Tests Momentum as On-Chain Activity Surges
You must be logged in to post a comment Login