
Crypto World
Flare Proposes FLR Overhaul with MEV Capture and Inflation Cut

TLDR
- Flare plans to reduce FLR inflation from 5% to 3% under a new governance proposal.
- The proposal introduces FIRE to manage revenue from protocol-level MEV capture.
- Flare aims to shift block building to a controlled model to retain network value.
- The network proposes raising gas fees to increase annual token burn levels.
- Governance voting will take place between April 17 and April 24.
Flare introduced a governance proposal to reshape FLR tokenomics and capture protocol-level MEV. The plan reduces inflation and redirects network value into ecosystem incentives. It also outlines a structured builder model to control block production and revenue flow.
Flare and FLR Plan Shifts Tokenomics Through MEV Capture
Flare proposes reducing annual FLR inflation from 5% to 3%, cutting issuance by 40%. The proposal also lowers the yearly cap from 5 billion to 3 billion FLR tokens.
The network introduced FIRE, or Flare Income Reinvestment Entity, to manage captured value. It aims to channel proceeds into buybacks, burns, and ecosystem funding.
Flare stated, “The model seeks to connect network usage directly to token value.” The framework focuses on aligning onchain activity with FLR demand.
The proposal shifts block building toward a protocol-controlled structure over time. This change targets value flows that typically move to external searchers.
The system plans to capture positive MEV, including arbitrage and liquidation events. It also includes liquidity provisioning within the builder framework.
Flare said the change supports long-term token sustainability through structured revenue capture. It also aims to reduce inefficiencies seen across many blockchain systems.
Network Activity Supports Proposal Timing and Economic Changes
Flare reported over $160 million in total value locked across its ecosystem. It also recorded more than 880,000 active addresses on the network.
The network confirmed around 150 million FXRP minted, with over 85% deployed in DeFi use. Dune data shows TVL near $165 million.
The proposal includes a gas fee increase from 60 gwei to 1,200 gwei. This adjustment aims to raise annual FLR burn from 7.5 million to 300 million tokens.
Flare said higher fees could strengthen burn mechanics under current transaction levels. It also expects a stronger linkage between usage and token supply reduction.
The plan shifts reward allocation toward P Chain staking participants. It also sets a minimum 20% fee share for infrastructure contributors.
Flare noted that this structure supports entities maintaining network services. It ensures a defined share of generated revenue flows to operators.
Governance Timeline Outlines Decision Window for Proposal
Flare scheduled the governance notice period from April 9 to April 16. The network then set voting between April 17 and April 24.
The proposal outlines immediate implementation for key economic changes upon approval. These include inflation cuts and fee structure adjustments.
Flare emphasized that the builder model will roll out gradually over time. The shift depends on governance approval and network readiness.
The proposal connects multiple network components, including FAssets and Smart Accounts. It also integrates Flare Data Connector and Confidential Compute.
Flare stated that the next phase links ecosystem activity directly to FLR economics. The network confirmed that voting will determine the proposal outcome.


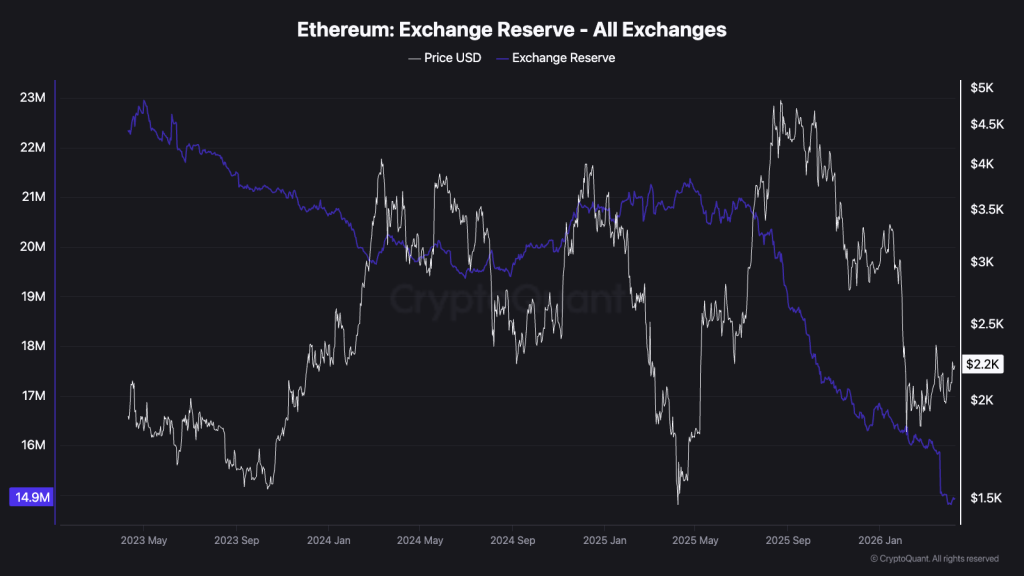
Autonomous AI agents have registered roughly 90,000 on-chain identities since January 2025, and the ETH they burn through every micro-transaction is not coming back.
Exchange reserves have collapsed to 16.2 million ETH – the lowest level since 2016 – while over 37 million ETH sits locked in staking contracts.
The EIP-1559 burn mechanism was designed for humans transacting at human speed. AI agents don’t sleep, don’t hesitate, and don’t wait for gas to drop on a Sunday morning.
The question is no longer whether AI activity is compressing ETH supply. The question is whether the compression is structural enough to constitute a genuine ETH supply shock – one that reprices the asset rather than just tightens a few metrics.
Discover: AI price predictions for Ethereum, Bitcoin, and XRP through end of 2026
How AI Agents Are Burning ETH Faster Than the Market Expects
Under EIP-1559, base fees are destroyed rather than paid to validators. That mechanic was calibrated around human-driven transaction demand – periodic spikes during NFT mints, DeFi yield chases, and token launches.
AI agents introduce a fundamentally different demand profile: continuous, high-frequency, and immune to price fatigue.
Projects built on frameworks like Etherealize, alongside autonomous trading systems powered by ASI ($FET) and RENDER, now dominate DEX activity during low-liquidity windows – particularly weekends – where their algorithmic execution faces minimal human competition.
Each interaction triggers a base fee burn. At scale, the aggregate effect on net ETH issuance is material.
Glassnode on-chain data confirms ETH’s annualized net issuance is currently running at approximately -0.5%, meaning burns are outpacing new validator rewards.
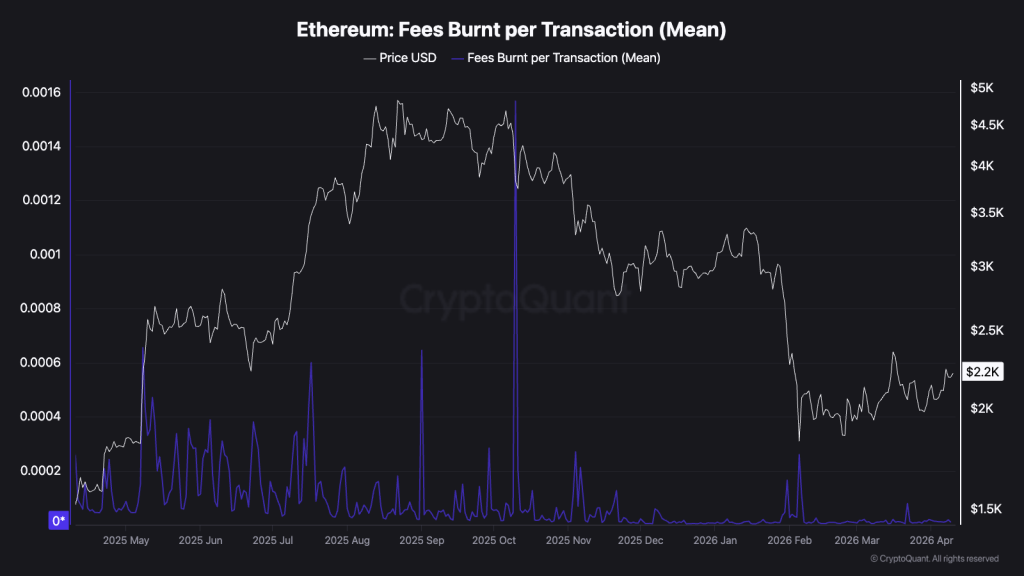
That deflationary state has now persisted across a 12-month high in burn rates, according to CryptoQuant metrics tracking exchange-level reserve depletion alongside network-wide fee destruction. The Etherealize-driven agent economy is not a speculative catalyst – it is already showing up in the supply figures.
What makes AI agent burn different from prior DeFi demand spikes is durability. A yield farming craze burns ETH for weeks; a machine economy running autonomous wallets on deflationary crypto rails burns ETH indefinitely.
The frequency is predictable, the volume scales with agent registrations, and there is no behavioral off-switch triggered by a price correction. That changes the supply calculus in ways that cycle-based models don’t fully capture.
Bitcoin Hyper Targets Early Mover Upside as Ethereum Tests Key Supply Levels
ETH at a $271 billion market cap limits the upside math even if the supply-shock thesis fully validates. A move from $2,400 to $3,000 represents roughly 25% – meaningful, but not the asymmetry that earlier-cycle positioning delivers. For traders who accept the AI-driven deflationary crypto thesis but want higher-beta exposure to the same infrastructure trend, the presale layer is worth examining.
Bitcoin Hyper is currently in presale at $0.0521787, with over $1.1 million raised and a staking APY currently sitting above 90%. The project is built around Bitcoin-native speed infrastructure – a direct architectural play on the machine-economy demand that is driving AI agent adoption across L1 networks. Its positioning assumes that the high-frequency, low-latency transaction environment that makes AI agents viable on Ethereum will expand to Bitcoin-adjacent rails as agent registrations scale.
The entry window at current presale pricing closes as each stage fills. For traders watching Ethereum consolidate below resistance while the supply metrics tighten, the asymmetry argument is straightforward. Research Bitcoin Hyper here before the presale window closes.
The post Etherealize Say AI Will Fuel Ethereum Supply Shock: Here’s Why and Next Coin to Pump appeared first on Cryptonews.
Senator Cynthia Lummis (R-WY) warns that the Digital Asset Market Clarity Act (CLARITY Act) faces a potential four-year legislative freeze if the Senate does not act before the 2026 midterm elections.
Her post arrives one day after Treasury Secretary Scott Bessent published an op-ed demanding the same urgency.
Why the Urgency Matters Now
Lummis has been the CLARITY Act’s most prominent Senate champion since its inception. She chairs the Senate Subcommittee on Digital Assets and has repeatedly framed the bill as essential to preventing regulatory uncertainty from pushing crypto firms overseas.
This is our last chance to pass the Clarity Act until at least 2030. We can’t afford to surrender America’s financial future,” Lummis said in a post.
The warning carries added weight given that Lummis announced in December 2025 that she will not seek a second term.
She cited the physical and mental demands of another six-year commitment.
Her current term ends in January 2027, making this legislative push a defining moment in her Senate career.
A Coordinated Washington Push and What Stands in the Way
Lummis is not alone. Her remarks came after US Treasury Secretary Scott Bessent and others from within President Donald Trump’s inner circle said action is needed now.
Bessent warned that regulatory ambiguity had already driven crypto development to jurisdictions with clearer rules, including Abu Dhabi and Singapore.
Despite broad executive branch support, several obstacles remain. The bill’s core stablecoin yield dispute has a framework in place following the Tillis-Alsobrooks compromise from March 20.
That deal bans passive yield on stablecoin balances but permits activity-based rewards.
However, the legislation still faces five sequential hurdles before reaching the president’s desk. Those include:
- A Banking Committee markup,
- A 60-vote Senate floor threshold, and
- Reconciliation with the House version passed in July 2025.
- Reconciliation with the Senate Agriculture Committee version (which advanced its own draft in January 2026)
- Presidential signature from Trump
Democratic senators continue to push for ethics language barring government officials from profiting off personal crypto ventures.
The White House has resisted those demands.
The Senate returns from Easter recess on April 13. Republican members of the Senate Banking Committee plan to initiate the markup process in late April.
If that window closes without action, analysts warn that the bill could effectively be dead until at least 2027, as midterm campaign pressures consume the remaining legislative calendar.
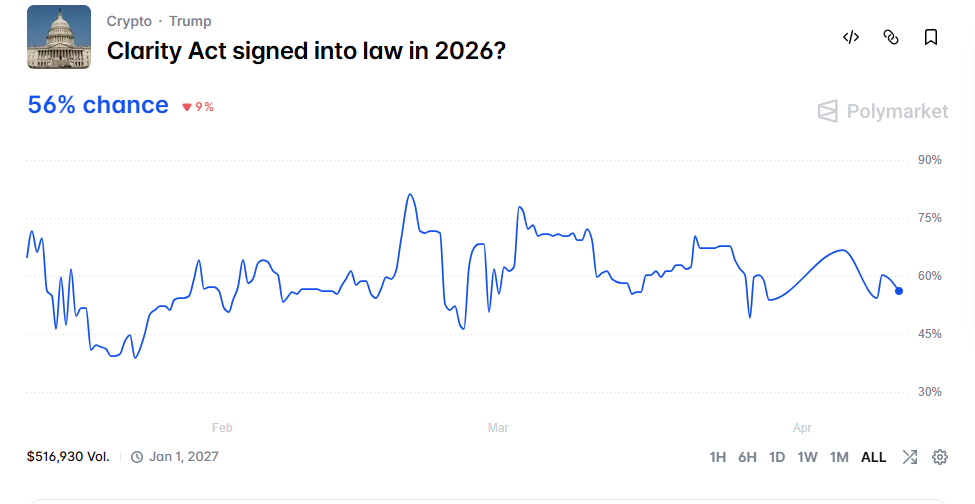
On prediction markets, traders currently assign a 56% probability that Trump will sign the CLARITY Act into law before the end of 2026.

The post Senator Cynthia Lummis Says the Clarity Act Risks a 4-Year Delay appeared first on BeInCrypto.
Key points:
-
Buyers are attempting to push Bitcoin toward the $76,000 level but are facing significant selling from the bears.
-
Several major altcoins are likely to pick up momentum if they break above their overhead resistance levels.
Buyers are attempting to sustain Bitcoin (BTC) above the $72,500 level but are expected to face significant resistance from the bears. US spot BTC exchange-traded funds have witnessed a mixed week, with two days of inflows and two days of outflows, according to Farside Investors data. However, a positive sign is that the inflows have been larger than the outflows, resulting in weekly net inflows of $576.5 million.
Although there are signs of recovery, Glassnode said in its latest Week Onchain newsletter that BTC will have to cross the True Market Mean at $78,000 and the Short-Term Holder Cost Basis at $81,600 to transition into a sustainable recovery regime. Until then, the “mid to long-term bias remains tilted to the downside” as any rally into the zone is expected to encounter selling pressure from recent buyers who may want to exit their positions at or near breakeven.

Along with BTC, Ether (ETH) may also be bottoming out. The Capriole Macro Index Oscillator recorded a reading of -2.42, signaling undervaluation. In 2022, ETH had bottomed out in the $1,000 to $1,200 range when the indicator fell to -2.2. That suggests limited downside risk and greater upside potential.
Could BTC and select major altcoins continue their relief rally? Let’s analyze the charts of the top 10 cryptocurrencies to find out.
Bitcoin price prediction
BTC rose above $73,000, but the bulls could not sustain the higher levels. That suggests the bears are attempting to retain the price below the $72,000 level.

A positive in favor of the bulls is that the 20-day exponential moving average ($69,587) has started to turn up, and the relative strength index (RSI) has risen into the positive territory. That increases the possibility of a rally to the $76,000 resistance.
Sellers are expected to defend the $76,000 level with all their might, as a close above it completes a bullish ascending triangle pattern. The BTC/USDT pair may then ascend to $84,000.
The bears will have to swiftly pull the BTC price below the support line to signal a comeback. If they do that, the pair risks dropping to the crucial $62,500 to $60,000 support zone.
Ether price prediction
ETH’s pullback is finding support at $2,200, signaling that the bulls are attempting to flip the level into support.

If the ETH price turns up from the current level and breaks above $2,274, it improves the prospects of a rally above the $2,400 resistance. If that happens, the ETH/USDT pair may surge to $2,800.
This bullish view will be invalidated in the near term if the price turns down and breaks below the moving averages. That suggests the higher levels are attracting sellers. The pair may then slump to the solid support at $1,916.
XRP price prediction
Buyers have failed to push XRP (XRP) above the 50-day simple moving average ($1.38), indicating that the bears are aggressively defending the level.

Both moving averages are flattening out, and the RSI is just below the midpoint, indicating a slight edge to the bears. A break and close below the $1.27 level signals the resumption of the downtrend to $1.11 and later to the support line of the descending channel pattern near $0.9.
On the other hand, a break above the 50-day SMA tilts the short-term advantage in favor of the buyers. The XRP/USDT pair may then rally to the downtrend line, where the bears are expected to pose a strong challenge.
BNB price prediction
BNB (BNB) has failed to rise above the 50-day SMA ($626), indicating that the bears are selling on minor rallies.

Sellers will attempt to strengthen their position by pulling the BNB price below the $570 level. If they succeed, the BNB/USDT pair may resume its downtrend to the next strong support at $500.
Conversely, a close above the moving averages signals that the pair may extend its stay within the range for some time. Buyers will be back in the driver’s seat on a close above the $687 level. That clears the path for a rally to $730 and subsequently to $790.
Solana price prediction
Solana (SOL) has been consolidating inside the $76 to $98 range, signaling buying on dips and selling on rallies.

If buyers drive the SOL price above the moving averages, the recovery may reach the $98 level. Sellers are expected to fiercely defend the $98 level, attempting to keep the SOL/USDT pair inside the range.
The next trending move is expected to begin above the $98 resistance or below the $76 support. If bulls propel the price above the $98 level, the pair may surge to $117. Alternatively, a break below the $76 level may sink the pair to $67.
Dogecoin price prediction
Dogecoin (DOGE) failed to rise above the downtrend line, indicating that the bears continue to exert pressure.

Sellers will have to quickly pull the DOGE price below the $0.09 support to complete the bearish descending triangle pattern. If they do that, the DOGE/USDT pair may plunge to $0.08 and later to the pattern target of $0.06.
Instead, if the price turns up and breaks above the downtrend line, it suggests that the bulls are aggressively defending the $0.09 level. The failure of a bearish setup is a positive sign as it is likely to attract buyers. The pair may then start its climb toward the $0.11 resistance.
Hyperliquid price prediction
Hyperliquid (HYPE) has been gradually moving higher toward the $41.59 to $43.76 resistance zone, signaling solid demand from the bulls.

The 20-day EMA ($37.91) has started to turn up, and the RSI is in the positive zone, indicating that the bulls are in command. A close above the overhead resistance zone opens the gates for a rally to $50.
Sellers will have to swiftly yank the HYPE price below the 50-day SMA ($35.27) to signal a comeback. If they do that, the HYPE/USDT pair may plummet to the $29.42 level.
Related: Bitcoin analysis sees $55K BTC price ‘iron bottom’ by December 2026
Cardano price prediction
Sellers are defending the 50-day SMA ($0.26) in Cardano (ADA), but the bulls have not allowed the price to dip back below the $0.25 support.

The first sign of strength will be a close above the 50-day SMA, as it opens the doors for a rally to the downtrend line. Sellers are expected to fiercely protect the downtrend line, as a close above it signals a potential short-term trend change.
On the contrary, a drop below the $0.23 level indicates that the bears have overpowered the bulls. That may sink the ADA/USDT pair to $0.22 and later to the support line near the $0.16 level.
Bitcoin Cash price prediction
Bitcoin Cash (BCH) is facing resistance at the 20-day EMA ($451), but the bulls have not given up much ground to the bears.

That increases the likelihood of a break above the 20-day EMA. If that happens, the BCH/USDT pair may climb to the 50-day SMA ($465) and subsequently to the $486 resistance. A close above the $486 level suggests that the market has rejected the break below the $443 support.
Sellers are likely to have other plans. They will attempt to defend the moving averages and pull the BCH price below the $420 level. If they do that, the pair may plummet to $375.
Chainlink price prediction
Chainlink (LINK) has been stuck between the $8 and $10 level for several days, indicating a balance between supply and demand.

The longer the price remains within a range, the stronger the eventual breakout. The flattish moving averages and the RSI near the midpoint do not give either bulls or bears a clear advantage.
If the LINK price turns up from its current level and breaks above the $10 resistance, it suggests the start of a new uptrend. The LINK/USDT pair may then reach $11.61. Conversely, a close below the $8 support may resume the downtrend toward the $6 level.
This article does not contain investment advice or recommendations. Every investment and trading move involves risk, and readers should conduct their own research when making a decision. While we strive to provide accurate and timely information, Cointelegraph does not guarantee the accuracy, completeness, or reliability of any information in this article. This article may contain forward-looking statements that are subject to risks and uncertainties. Cointelegraph will not be liable for any loss or damage arising from your reliance on this information.
TLDR
- Dom Kwok said XRP growth now extends beyond the SWIFT comparison narrative.
- Ripple focuses on institutional adoption and financial applications on XRP Ledger.
- RLUSD stablecoin supports real-world blockchain transactions and liquidity use.
- Developer activity increases through global hackathons and funding initiatives.
- Ripple executives confirmed plans to replace SWIFT, not partner with it.
Ripple’s long-standing comparison with SWIFT is losing focus as new XRP use cases expand across financial markets. EasyA co-founder Dom Kwok said the ecosystem now targets broader applications beyond cross-border payments. He stated that XRP growth now centers on institutional adoption, stablecoins, and blockchain-based financial systems.
Kwok said the early narrative helped XRP gain traction, but the market has evolved quickly. He explained that new developments now shape how participants evaluate XRP’s long-term role.
Ripple Focus Expands Beyond SWIFT Benchmark
Kwok said the SWIFT comparison once helped explain XRP’s utility to new users. However, he added that the benchmark now limits understanding of the ecosystem’s broader direction. He stated, “SWIFT is no longer the limiting factor for XRP’s growth.”
He explained that XRP Ledger now supports various financial applications beyond payments. These include liquidity management, tokenization, and enterprise financial tools. As a result, the ecosystem attracts attention from institutions exploring blockchain integration.
Kwok said XRP Ledger’s design supports both messaging and settlement within one system. This structure differs from SWIFT, which separates communication and transaction settlement processes. He noted that this technical advantage supports faster and more efficient transactions.
He also said enterprise adoption plays a central role in XRP’s expansion strategy. Companies entering the ecosystem bring existing clients and transaction flows. Even partial migration of operations to blockchain can increase on-chain activity.
Institutional Deals and RLUSD Drive XRP Ecosystem Growth
Kwok highlighted acquisitions involving firms like Hidden Road and GTreasury. He said these deals aim to integrate traditional finance operations with blockchain infrastructure. The approach focuses on gradually shifting financial processes onto XRP Ledger.
He explained that onboarding firms with active customer bases accelerates ecosystem growth. These companies already handle large transaction volumes across global markets. Moving even a small share of these transactions on-chain increases network usage.
Kwok also pointed to RLUSD as a driver of recent activity within the ecosystem. He described the stablecoin as a strong addition supporting real-world financial use cases. RLUSD enables easier access to digital payments and liquidity services.
He said developer participation is also rising through hackathons and educational programs. Events in Hong Kong and Singapore have attracted new builders to the network. Some developers have already secured funding for XRP Ledger-based projects.
Kwok stated that this growth in developer activity supports broader ecosystem expansion. More applications increase network utility and attract institutional interest. This trend also contributes to renewed attention from market participants.
XRP Strategy Targets On-Chain Financial Systems
Kwok said the XRP thesis now focuses on bringing financial systems onto blockchain networks. He explained that multiple blockchains will likely serve different financial roles. However, he maintained that XRP remains focused on enterprise adoption.
He added that XRP does not require integration with SWIFT to succeed. XRP Ledger validator Vet stated that blockchain systems combine messaging and settlement functions. This approach replaces traditional systems that separate these processes.
Ripple executive Eric van Miltenburg confirmed this direction. He said the company aims to replace SWIFT rather than collaborate with it. This position aligns with the broader shift toward blockchain-based financial infrastructure.
Recent developments show continued progress in institutional adoption and stablecoin use. These factors continue to shape XRP Ledger activity and ecosystem growth. Market participants continue monitoring updates related to RLUSD and enterprise integration.

The crypto yield pitch was simple: accept smart contract risk, earn more than with a bank. It doesn’t work like that anymore.
Nowadays, Aave, the largest DeFi lending protocol by deposit base, offers just 1.84% on the world’s largest stablecoin, USDT, and an equally dismal 2.61% APY on the Coinbase-Circle stablecoin USDC.
Lido, the largest Ethereum liquid staking service, returns just 2.53%.
By contrast, Interactive Brokers pays 3.14% on idle cash with no lockup and zero crypto exploit risk. Another basic high-yield savings account at Axos Bank pays 4.21%.
The risk premium that justified DeFi’s existence has inverted.
Many of DeFi’s flagship products now pay less than a federally insured deposit account. Trader James Christoph posted what the rest of the market has started to think: “DeFi — Earn 1% below Treasury bills and lose all of your money one time per year.”
The yield compression is structural
Ethereum staking yields have fallen from above 5% shortly after its Merge blockchain fork to just 2.7%, as over 38 million ether now competes for the same validator rewards.
Yield from Ethena, whose crypto dollar sUSDe once delivered above 50% APY in 2024, has compressed 93% to just 3.56% while its total value locked has more than halved.
The CoinDesk overnight rate which benchmarks to Aave’s daily borrowing costs — a crypto play on words to the actual overnight rate for Fed funds — has collapsed from rate peaks in the double-digit percentages before settling to approximately 3% today.
Depending on the day over the last month, CoinDesk’s overnight rate has actually and quite embarrassingly been less than the actual overnight rate for US banks.
Across the stablecoin lending landscape, the picture is uniformly grim. Compound pays just 2.55% on USDC deposits. Sky’s USDS savings rate sits at 3.75%, the highest among blue-chip protocols, but derives around 70% of its income from offchain sources including US Treasuries and Coinbase USDC rewards.
Bitcoin, which used to attract high interest rates from borrowers demanding BTC loans, now earns nearly nothing on platforms that formerly paid handsome premiums.
Many DeFi investors have to walk way out onto the risk curve toward insanity to outperform TradFi.
Read more: DeFi yields exceed 60% APY on bitcoin with insane risks
Tokenized TradFi displaces DeFi
While crypto-native yields collapse, tokenized versions of traditional fixed-income products are growing into a deca-billion dollar sector.
- BlackRock’s BUIDL fund holds over $2 billion in assets and delivers 3.47% APY.
- Ondo Finance’s USDY manages $1.8 billion yielding 3.55%.
- Franklin Templeton’s BENJI holds over $1 billion paying 3.54%.
- Superstate’s USTB, a tokenized US government securities fund, holds $646 million paying 3.47%.
The average seven-day APY across the tokenized treasury sector is roughly 3.38%. That TradFi yield, tokenized, beats Aave’s offer from crypto’s two largest DeFi stablecoin pools.
The inversion is complete. An investor choosing Aave’s USDC pool over a tokenized Treasury fund accepts smart contract risk, regulatory uncertainty, and the possibility of a protocol exploit for a lower yield.
The premium for accepting smart contract risk has not just compressed. For many average depositors in average liquidity pools, it’s flipped negative.
Got a tip? Send us an email securely via Protos Leaks. For more informed news, follow us on X, Bluesky, and Google News, or subscribe to our YouTube channel.


Aave price is trading around $91, slipping 3–4% in 24 hours as traders derisk DeFi blue chips to chase hotter themes, even though the protocol still anchors more than $20 billion in on‑chain lending.
Summary
- AAVE’s price hovers near $90–$92 with about $296m in 24h volume against a roughly $1.5b market cap, pointing to active de‑risking rather than a dead market.
- Token Terminal’s March report shows Aave overseeing around $23–$24b in TVL across 14–20 chains and holding roughly 50–62% of DeFi lending share.
- Technicals show a controlled downtrend: mid‑band RSI, neutral‑to‑bearish signals, and futures data that looks more like long unwinds than aggressive new shorts.
Aave (AAVE) price is trading around $91 on April 10, 2026, under pressure as traders derisk from DeFi blue chips to chase newer narratives, even as the protocol maintains one of the deepest lending books in crypto. Over the past 24 hours, AAVE has fallen roughly 3–4%, with daily volume near $296 million — a high figure for a token with a market capitalization of about $1.5 billion — suggesting active trimming in size rather than illiquid drift.
Aave March 2026 data compiled by CoinStats and Token Terminal shows the protocol operating with a market cap near $1.49 billion at a price of roughly $98.37, while supporting about $23.8 billion in total value locked across more than 20 blockchains and controlling an estimated 50–62% share of DeFi lending. That dominance is echoed in Token Terminal’s latest report, which notes Aave ended March with over $42 billion in deposits across 14 chain deployments, with Ethereum alone accounting for more than 80% of capital.
On TradingView, the AAVEUSDT chart places spot around $90–$92, down from recent local highs near the mid‑$90s but still well above the early‑cycle lows. The daily trend is lower but orderly, with most candles printing inside a gentle descending channel rather than a vertical collapse. Technical dashboards for AAVEUSDT label the setup as neutral‑to‑slightly bearish: RSI sits in the mid‑band rather than at capitulation levels, and aggregate signals tilt toward “sell” or “neutral” rather than “strong sell,” indicating a controlled cooldown rather than panic.
Perpetual futures data adds nuance. Binance‑linked summaries point to a small positive funding basis and soft open‑interest changes, a pattern more consistent with the slow unwinding of existing longs than with aggressive new shorting. In other words, traders appear to be trimming DeFi beta to free up capital for faster‑moving plays in areas such as meme coins, AI tokens or on‑chain perps, rather than specifically targeting AAVE for downside.
From a price‑prediction standpoint, that positioning argues for patience. CoinStats’ April outlook frames current levels in the context of three scenarios: a conservative market‑cap range of $2.2–$2.6 billion, implying $145–$165 per token; a base case of $3.6–$6.3 billion, implying $225–$395; and an optimistic band of $10–$14.5 billion, implying $625–$906, all hinging on Aave v4 execution, real‑world‑asset integration and sustained institutional flows. With the token currently near $91 and the trend pointing modestly lower, the market is not pricing in those upside paths yet.
In the near term, the more likely path is continued range‑trading and drift until either a volatility spike flushes out remaining longs or a clear catalyst — such as a major v4 launch, new L2 integrations or a headline RWA partnership — forces traders to reprice the token. Until then, Aave looks less like a broken protocol and more like a blue chip being sold to fund whatever the market’s next story happens to be.


Bitcoin’s largest holders are quietly tightening their grip on supply again, and derivatives markets are starting to price that shift in conviction with a clear upside bias toward $88,000.
Summary
After four days locked in a tight band between $70,000 and $72,000, Bitcoin punched to an intraday high of $73,255 on Friday, a move traders say echoes the Q2 2025 breakout that followed weeks of compression below key moving averages. Then, as now, price is pressing against a descending trend line; this time, the crucial trigger sits near $76,000, the upper boundary of the downtrend that began after Bitcoin’s slide from roughly $126,000. A clean break there, one desk notes, would “remove the psychological lid that has capped every rally for months.”
Under the surface, on‑chain data has flipped from distribution to accumulation. Crypto analyst Amr Taha highlights that 30‑day whale inflows to exchanges have dropped to $2.96 billion, falling below $3 billion for the first time since June 2025, versus about $8 billion as recently as February. At the same time, long‑term holders have booked a realized market value change of $49 billion, a shift Taha argues signals that “chips are moving from weak hands to strong hands,” with supply migrating toward investors willing to sit through volatility. CryptoQuant similarly frames the pattern as long‑duration capital “resuming accumulation to absorb available supply.”
Liquidity maps from CoinGlass show visible concentrations between $86,000 and $90,000, a zone now doubling as both magnet and battleground. “The chart shows a very pronounced liquidity structure,” one analysis notes, pointing to a thick cluster of orders that could accelerate a move once price enters that band. Market sentiment has turned bullish, with traders explicitly targeting $88,000 as the next waypoint if $76,000 gives way.
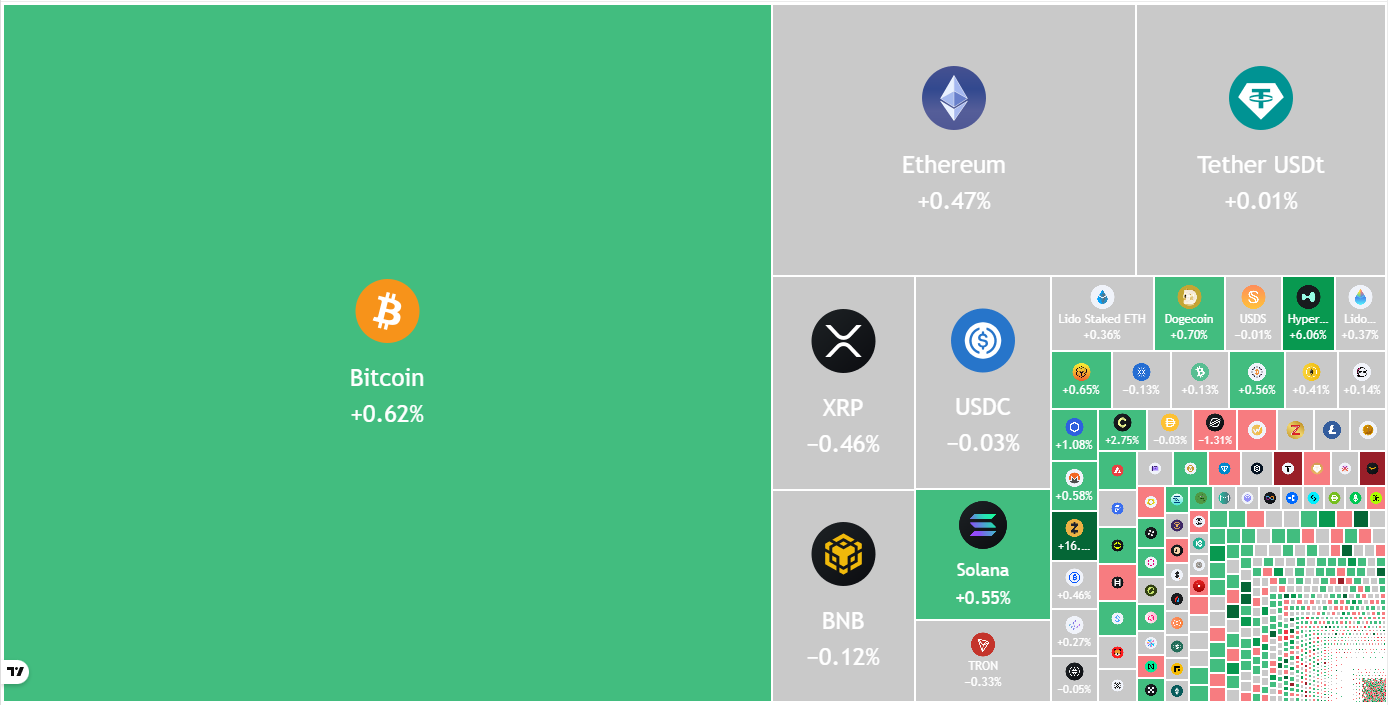
This parabolic move comes as digital assets continue to trade as the purest expression of macro risk appetite. Bitcoin (BTC) is hovering around $71,800, with a 24‑hour range roughly between $71,400 and $72,400 on close to $229.2B in combined spot and derivatives volume. Ethereum (ETH) changes hands near $2,214, up about 0.4% over the last day, with roughly $3.1B in spot volume and $54.2B in futures turnover. Solana (SOL) trades around $83, with about $0.55B in spot and $11.1B in futures volume over 24 hours.
Against that backdrop, broader crypto coverage has zeroed in on positioning and macro cross‑currents, from ETF flow whiplash to regime‑shift debates in volatility. For now, though, the tape is simple: whales have stepped back from the sell button, long‑term capital is quietly buying, and the market has a number in mind. It’s $88,000.
TLDR
- BitFuFu produced 214 BTC in March while selling 80 BTC from its treasury.
- The company’s Bitcoin holdings declined to 1,794 BTC valued at nearly $131 million.
- Previous holdings peaked at 1,959 BTC in October 2025 before decreasing.
- Hashrate dropped to 25.9 EH/s, and power capacity declined to 457 MW.
- Cloud mining contributed 171 BTC, supporting overall production stability.
A Nasdaq-listed Bitcoin miner reported lower holdings after selling part of its treasury while maintaining steady production. The firm produced 214 BTC in March and sold 80 BTC during the same period. Its total Bitcoin balance now stands at 1,794 BTC, valued near $131 million at current prices.
BitFuFu Trims Holdings While Maintaining Production
BitFuFu confirmed it produced 214 BTC in March while selling 80 BTC from reserves. The company stated that the sale aligns with its balance sheet management approach and liquidity planning.
The firm reported total holdings of 1,794 BTC after the sale, reflecting a decline from earlier levels. It had previously disclosed 1,664 BTC in late 2024 before reaching 1,959 BTC in October 2025.
Chief executive Leo Lu addressed the change and linked it to internal strategy decisions. He said the company continues to target long-term growth in Bitcoin reserves.
Lu stated, “The sale supports our balance sheet strategy while we maintain our long-term objective of increasing Bitcoin holdings.” The company emphasized that treasury adjustments follow routine financial planning.
Operations Show Stable Output Despite Lower Capacity
BitFuFu reported a slight drop in total hashrate to 25.9 EH/s during March operations. Power capacity also declined to 457 MW as older mining rigs were phased out.
The company stated that performance remained stable despite reduced capacity levels. It explained that equipment updates aim to improve long-term efficiency.
Cloud mining contributed 171 BTC to the total monthly production figure. This segment continues to form a large portion of the company’s output.
The firm said its platform adapts to changes in network difficulty and Bitcoin price movements. It added that system flexibility supports consistent production results.
Lu explained that hardware upgrades will occur over time to improve efficiency levels. He said new machines will replace older units in a phased manner.
He also stated that changes in hashrate from external partners remained within normal operating ranges. The company confirmed that these shifts did not disrupt overall output stability.

The integration marks the latest expansion of Visa’s stablecoin infrastructure, which now spans settlement, card spending, and direct on-ramp capabilities.
Nasdaq-listed fintech firm OwlTing Group (OWLS) has expanded its collaboration with Visa to integrate Visa Direct into its OwlPay payment infrastructure, creating a card-to-wallet on-ramp that lets eligible U.S. debit cardholders fund USDC transactions without needing a standalone exchange account.
The capability is now live inside OwlPay Harbor, the company’s enterprise-grade on/off-ramp layer, and is also accessible to consumers through OwlPay Wallet Pro, a self-custody digital wallet. A subsequent phase will bring the on-ramp to OwlPay Cash, the firm’s consumer remittance app.
Once funded, users can spend USDC at U.S. retailers via gift cards, transfer assets to third-party platforms, or send funds globally through settlement channels including pushes to eligible Visa debit cards, local bank accounts via the Circle Payments Network, and cash pickup through MoneyGram.
OwlTing CEO Darren Wang framed the integration as an effort to close the gap between existing card infrastructure and digital dollar rails. The company holds money transmission licenses or equivalents in 41 U.S. states as of March 2026, according to the announcement.
Visa’s Expanding Stablecoin Footprint
The partnership adds another layer to Visa’s rapidly growing stablecoin strategy.
The payments giant launched USDC settlement in the U.S. in December 2025 with Cross River Bank and Lead Bank on Solana, and in March expanded its collaboration with Stripe-owned Bridge to bring stablecoin-linked Visa cards to more than 100 countries. Visa’s stablecoin-linked card spending alone hit a $3.5 billion annualized run rate in late 2025, growing roughly 460% year over year, according to an Artemis report.
This article was written with the assistance of AI workflows. All our stories are curated, edited and fact-checked by a human.
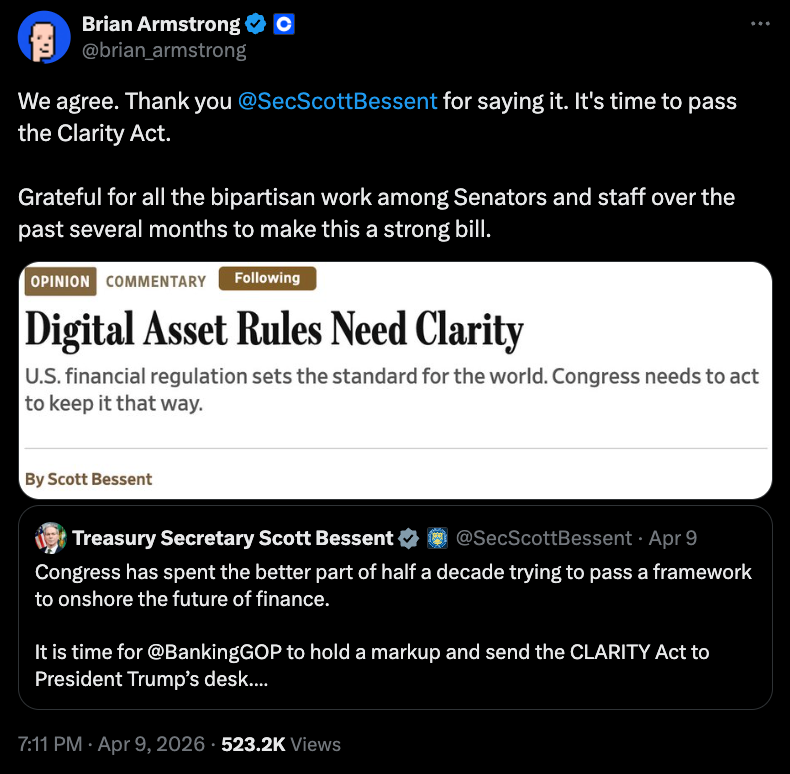
Brian Armstrong, the Coinbase CEO who withdrew the crypto exchange’s support for the Digital Asset Market Clarity Act in January, said “it’s time” for the legislation to pass after months of delays.
In a Thursday X post, Armstrong said that Coinbase agreed with comments from US Treasury Secretary Scott Bessent in a recent Wall Street Journal op-ed, in which he urged Congress to act on the crypto bill soon. According to the CEO, the current version of the legislation, after months of negotiations between lawmakers and representatives from the crypto and banking industries, was a “strong bill.”
“It’s time to pass the Clarity Act,” said Armstrong.

Armstrong’s endorsement of the bill came about three months after the CEO said that the company could not support the legislation “as written,” leading to lawmakers in the Senate Banking Committee postponing a markup on CLARITY necessary for its approval.
At the time, Armstrong said that he expected the bill to pass “in a few weeks,” but concerns over ethics, tokenized equities, stablecoin yield and other crypto-related issues have stalled progress since January.
Related: Coinbase CEO denies White House clash, says negotiations are ongoing
The expected markup for the bill in the banking committee, not scheduled as of Friday, will follow approval from the Senate Agriculture Committee in January. Both committees need to address different aspects of securities and commodities regulations before a potential vote for the CLARITY Act in the full chamber.
Coinbase legal chief Paul Grewal said last week that lawmakers were “very close to a deal” on the bill.
Is the crypto industry’s influence growing in Washington?
Since before the inauguration of US President Donald Trump, many experts have questioned the influence of the crypto industry on elections, lawmakers’ decisions and White House policies.
Executives at Coinbase and Ripple Labs have been parties to the discussions with administration officials on the CLARITY Act, and Armstrong reportedly met with the president before Trump posted a social media message calling for immediate action on crypto market structure.
The relationships may have benefited Coinbase and other companies seeking crypto-friendly laws and regulations under Trump. Last week, the Office of the Comptroller of the Currency approved Coinbase’s application for a national bank trust charter, following December approvals for Paxos, Ripple Labs, BitGo, Circle and Fidelity Digital Assets.
Magazine: Should users be allowed to bet on war and death in prediction markets?

Report: Aces finalizing 3-year deal with G Jewell Loyd

Nearly 4,000 US industrial devices exposed to Iranian cyberattacks

Charles Schwab Just Released The Crypto Bulls!!


-

 Business5 days ago
Three Gulf funds agree to back Paramount’s $81 billion takeover of Warner, WSJ reports
-

 Sports6 days ago
India men’s 4x400m and mixed 4x100m relay teams register big progress | Other Sports News
-

 Business7 days ago
Expert Picks for Every Need
-

 Tech3 days ago
How Long Can You Drive With Expired Registration? What Florida Law Says
-

 Business5 days ago
No Jackpot Winner, Prize to Climb to $231 Million
-

 Politics1 hour ago
US brings back mandatory military draft registration
-

 Fashion4 days ago
Massimo Dutti Offers Inspiration for Your Summer Mood Board
-
 Sports2 hours ago
Man United discover Nico Schlotterbeck transfer fee as defender reaches Dortmund agreement
-

 Fashion3 days ago
Let’s Discuss: DEI in 2026
-

 Crypto World2 days ago
Bitcoin recovers as US and Iran Agree a Ceasefire Deal
-

 Business6 days ago
Akebia Therapeutics, Inc. (AKBA) Discusses Pipeline Progress and Strategic Focus on Kidney Disease Treatments at R&D Day – Slideshow
-

 Crypto World1 day ago
Canary Capital Files SEC Registration for PEPE ETF
-

 Politics7 days ago
The UK should not pay a penny in slavery reparations
-

 Business8 hours ago
OpenAI Halts Stargate UK Data Centre Project Over Energy Costs and Copyright Row
-

 NewsBeat7 days ago
Kemi Badenoch talks ‘spring cleaning’ Reform defections
-

 Tech4 days ago
Samsung just gave up on its own Messages app
-

 Tech4 days ago
Haier is betting big that your next TV purchase will be one of these
-
Sports7 days ago
A Kevin O’Connell Theory Can Now Be Retired
-

 Tech4 days ago
The Xiaomi 17 Ultra has some impressive add-ons that make snapping photos really fun
-

 Tech4 days ago
Gamer Restores the Original PlayStation Portal From Two Decades Ago
You must be logged in to post a comment Login