

Crypto World
Four charts point to BTC slipping toward $50K
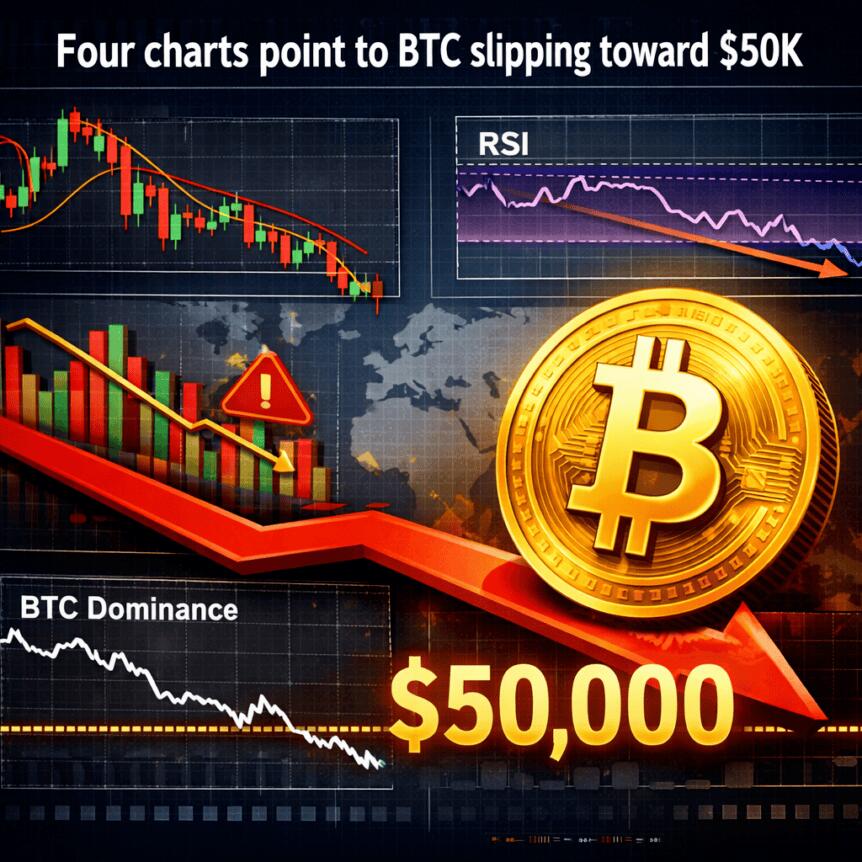
Bitcoin (BTC) bulls managed to defend the $60,000 level after a roughly 13% pullback last week, but a bundle of on-chain indicators and technical signals still points to meaningful downside risk in the weeks ahead. Traders are watching whether BTC can sustain the rebound or slide toward the lower end of its recent range as macro headwinds and market dynamics weigh on risk assets.
Key price and on-chain reference points are centering around miners’ costs, realized price, and valuation bands. If BTC fails to hold above crucial support, analysts say a test of the $50,000 area remains plausible, with several metrics suggesting a potential deeper retest before a durable bottom forms.
Notably, the framework used by several researchers combines production-cost estimates, the average cost basis of current holders, and long-run valuation bands to gauge where BTC might gravitate during periods of stress. In the current setup, those signals converge near the mid-$50,000s to low-$50,000s, with a clear risk of a sub-$50,000 print if selling pressure intensifies.
Key takeaways
- Mining-cost dynamics place BTC near its estimated production cost of about $62,650, with a lower boundary near $50,120. A sustained break below the production-cost band would open a path toward the next major floor near $50,000.
- Bitcoin’s realized price sits around $53,600, a level that has historically coincided with the formation of major cycle bottoms when prices move below it. Past bear markets saw substantial drawdowns relative to realized price, underscoring the risk of a deeper capitulation if BTC fails to reclaim higher ground.
- Glassnode’s MVRV bands show BTC trading below the lower valuation zone, with the next deep-value magnet near $50,000 and a nearby cluster around the $53,600 realized price.
- Technical setup remains fragile: BTC is testing the 200-week moving average near $62,000, and a weekly close below that level would bolster a bear-case scenario with a path toward sub-$50,000 levels. RSI readings around oversold territory further corroborate near-term selling pressure.
Mining-cost dynamics outline a fragile near-term floor
One of the most closely watched signals comes from the Bitcoin production-cost model, which compares the market price to the estimated average cost to mine a bitcoin. The framework, shared by Capriole Investments founder Charles Edwards, places Bitcoin current price near the production cost of roughly $62,650. In this zone, miners are broadly near break-even on average, a circumstance markets have historically treated as a long-term value area.
The model also highlights a lower boundary around $50,120, corresponding to an estimate of the electrical-cost floor. In practical terms, BTC is flirting with the upper edge of a major miner-cost support band, and a decisive move below this zone could bring the magnet of the electrical-cost floor into focus around the $50,000 mark.
For readers tracking the data, the reference to Edwards’ production-cost visualization appears on social media as part of the ongoing discussion about mining economics and price floors. Capriole’s cost framework remains a frequent touchstone for framing near-term risk versus longer-term demand.
Realized price as a potential bottom indicator
The realized price—the average cost basis of all BTC holders—stands near $53,600, according to the chart shared by analyst Follis. Historically, major cycle bottoms in Bitcoin have followed periods when price briefly dips below this metric. In previous bear markets, BTC has fallen a meaningful percentage below realized price: about 58% in 2011, 49% in 2015, 47% in 2018, and 34% in 2022.
That pattern has tempered expectations for a swift bottom. While the cycle this time has shown shallower drawdowns relative to realized price, a move back above or below that line will shape traders’ views on the path to a sustained bottom. If BTC were to break decisively below $60,000, the next target could align with realized price near $53,600, potentially opening the door to a deeper capitulation toward $50,000 and beyond, depending on macro dynamics and liquidity conditions.
Some observers suggest that a bottom could still form later in the cycle, with discussions anchored around the idea that the broad market tends to materialize meaningful basing patterns after price action interacts with realized-price dynamics. For context, references to these cycles and the realized-price framework have been explored in related analyses and charts, including discussions on the timing of potential bottoms in subsequent quarters.
Valuation bands point toward a deep-value magnet near $50k
Bitcoin’s valuation bands, as tracked by on-chain analytics, showBTC trading below the lower band of the long-run framework, with the next magnet around the deep-value zone near $50,000. The current price level, near $63,000, sits below the upper bands that were known to cap tops during prior bull markets, and well above the deep-value threshold that has historically absorbed sharp downturns.
In this framework, the proximity of price to the lower band reinforces the potential for a test of the $50,000 region if weakness persists. The cluster around $53,600—the realized price—contributes to a confluence area that may act as a keen reference point for traders seeking to gauge whether a longer-term bottom is forming or a renewed drawdown could unfold.
Analysts frequently cite these bands to explain why bear-market episodes retrace toward the lower valuation ranges before a durable bottom forms, a pattern seen in prior cycles and echoed in the recent correction. The interplay between the realized-price line and the lower MVRV band is especially watched for potential confirmation of a deeper retest before any sustained recovery.
Bearish technical setup reinforces downside risk below $60k
From a purely chart-driven perspective, Bitcoin’s weekly view hints at a bear-flag continuation scenario. After failing to reclaim the 50-week simple moving average near $91,700, BTC has moved into a corrective flow and is testing the 200-week moving average around $62,000. A decisive weekly close below that level would reinforce the bearish setup and could target the $50,000 area as a measured move from the flag pattern.
Momentum signals add to the caution, with RSI readings hovering near oversold territory around 30, underscoring the presence of selling pressure that could persist if btc fails to reclaim the flag support promptly.
In practice, this means the market may need a clear reclamation of the $60,000 level or a decisive hold above the 200-week EMA to shift the bias. Until that happens, the risk-reward remains skewed toward additional downside, particularly if macro conditions deteriorate or liquidity tightens further.
What to watch next: a sustained move above the $62,000–$63,000 zone would reframe the setup, while a break under $60,000 could push BTC into the $50,000s as on-chain and macro dynamics intersect. As always, readers should monitor how miners respond to price pressure, how realized-price dynamics evolve, and how valuation bands respond to price action in the near term.

Zcash is expected to activate its NU6.3 “Ironwood” network upgrade at block height 3,428,143 on July 28.
Summary
- Ironwood activates at block 3,428,143, replacing Orchard with a separately tracked shielded transaction pool system.
- The turnstile blocks more ZEC leaving Orchard than entered, strengthening public supply verification after migration.
- Quantum-recoverable notes support future recovery, but Ironwood does not make Zcash quantum-secure today by itself.
The Zcash Foundation’s Zebra 6.0.0 release places the estimated activation near 13:00 UTC and tells every node operator to upgrade before the fork.
The upgrade introduces a new shielded pool and a v6 transaction format. It follows the disclosure of a flaw in the older Orchard pool that could have allowed an attacker to create counterfeit ZEC without an obvious public record.
Developers patched the flaw through emergency upgrades in June. They said they found “no evidence” of exploitation, but Zcash’s privacy design prevents them from proving that hidden inflation never occurred.
Ironwood creates a separately tracked shielded pool
According to the Zebra 6.0.0 release notes, Ironwood reuses Orchard’s Action structure and Halo2 proof system. However, it adds a separate note commitment tree, nullifier set, chain value pool and chain-history data. These records let nodes track the new pool independently from Orchard after activation.
Zebra also updates several node commands so operators can inspect the pool’s value and commitment-tree state. The Zcash Foundation’s GitHub release labels the upgrade critical for operators because older software will not follow the correct chain after the activation height.
Turnstile limits value leaving Orchard
Ironwood’s main supply safeguard is a turnstile between Orchard and the new pool. After activation, Orchard will stop accepting new outputs and internal transactions. Funds can move out, but the accounting rule prevents more ZEC from leaving Orchard than the amount that legitimately entered it.
The Ironwood design explanation says the mechanism gives users a public check on circulating supply without exposing private balances or transaction details. Instead, it would leave any excess hidden value trapped inside Orchard once the pool becomes exit-only.
As crypto.news previously reported, Zcash scheduled the July 28 hard fork after developers concluded that the patched bug still left a supply question they could not answer with certainty. Zcash founder Zooko Wilcox said the flaw was “unlikely to have been exploited,” while also stating that users should not need to rely on that assessment.
Notes gain a future quantum-recovery path
Ironwood also changes how shielded notes are created so they may be recovered through a future post-quantum protocol. The official ZIP 2005 specification calls the feature quantum recoverability. It binds more note data into the note construction, allowing a later recovery system to verify ownership without relying only on cryptography that a powerful quantum computer could break.
The change does not make current Zcash transactions quantum-secure. The specification says a separate recovery protocol must still be designed and activated later. Funds that remain in Sprout, Sapling or Orchard would not gain this recovery option. Wallets must move them into Ironwood notes to receive the new protection.
The same specification says existing Orchard addresses can receive Ironwood notes, reducing changes for users. Wallet developers must still add migration support. Users whose wallets do not update may face delays when moving Orchard funds, while exchanges may briefly pause deposits or withdrawals around the fork.
Zebra becomes mandatory as zcashd support ends
The upgrade also completes Zcash’s move away from the older zcashd node software. The network set zcashd’s end-of-support halt at block 3,417,100, before Ironwood activation. The official deprecation schedule says zcashd will not support NU6.3, leaving Zebra as the required node implementation for the new rules.
Zebra 6.0.0 includes a separate mempool security fix. The issue allowed peers to send expensive-to-check, non-standard transactions that could reduce node responsiveness while the traffic continued. The fix rejects those inputs before the costly verification step. The Foundation said the flaw affected availability only and did not allow invalid blocks, lost funds or consensus failure.
Related crypto.news coverage detailed Zcash’s two-step response to the Orchard vulnerability. Developers first disabled Orchard activity, then activated the NU6.2 hard fork with corrected code before restoring the pool. Ironwood now adds a separate accounting boundary rather than another patch inside the same pool.
The upgrade remains tied to block production, so its exact clock time may shift. If the chain reaches block 3,428,143 as expected, Ironwood will activate on July 28 and begin the Orchard-to-Ironwood transition.
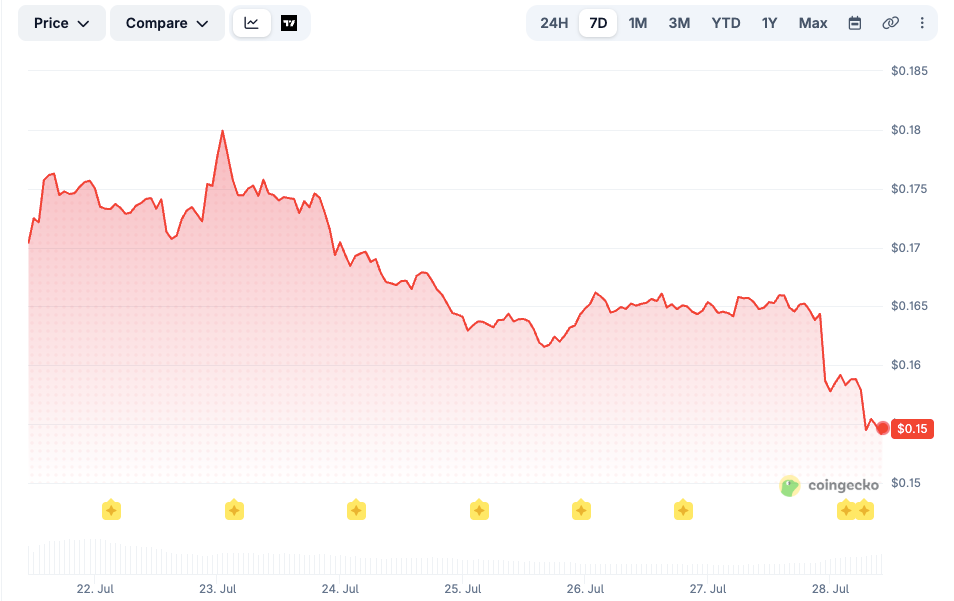
Charles Hoskinson says Cardano’s “best days are ahead,” even as its native token, ADA, trades 95% below its all-time high.
The Cardano founder made the remark during a recent X AMA. He was responding to ADA’s prolonged slump and the criticism that has followed it.
Why Cardano is Feeling the Pressure
ADA trades near $0.16 today. The token hit its all-time high of $3.09 in September 2021 and has fallen 53% so far this year alone.

Governance disputes, builder shutdowns, and Cardano’s canceled 2026 summit have deepened the pressure. Hoskinson has also faced mounting criticism from the community over the slide. He stepped back from social media at one point, then returned to address the backlash directly.
“I still do believe our best days are ahead of us, and I still do believe that we can succeed despite the demons we’ve let in. We just have to change the approach, and we just have to change the strategy.”
— Charles Hoskinson, on X
Hoskinson Has a Plan
The comment echoes Hoskinson’s recent push for a funding overhaul. He wants to clear a backlog of more than 600 million ADA in treasury requests. He argues that the network’s security and utility drive ADA’s price, not short-term speculation.
The bottleneck comes down to a hard cap. Cardano’s treasury allows only 350 million ADA in net funding changes at a time, well short of what builders are requesting. Hoskinson has proposed spreading development across more independent companies instead of leaning on Input Output Global, the firm he leads, to carry the load alone.
Whether a strategy shift can turn Cardano’s price trend around remains an open question. ADA still trades far below its 2021 peak, leaving Hoskinson’s optimism as the main counter to a bearish market narrative.
The post Cardano’s Hoskinson Says ‘Best Days Are Ahead’: ADA Price Down 95% From Top appeared first on BeInCrypto.

Disclosure: This article does not represent investment advice. The content and materials featured on this page are for educational purposes only.
The guide examines crypto and multi-asset proprietary trading firms, comparing funding, supported markets, and features to help traders choose the right platform.
Crypto traders, like any other retail traders, often want to grow the positions they take in the market, especially after they feel they have enough experience to handle the responsibilities. This desire would have been a pipe dream just a decade ago because retail traders cannot easily raise the kind of capital required to take meaningful positions in the market. But now, traders can actualize that desire, thanks to proprietary trading firms.
Estimates show that active prop firms number in above 2,000 as of this writing. Nearly 70% of these firms offer some kind of access to crypto as a tradable asset, and about 50 of them offer only crypto. This wide range of options is great, except that, in a way, it complicates the decision of picking the right firm. For instance, should someone go for a multi-asset firm or opt for one that is dedicated to crypto alone?
In that light, this article is an effort to simplify the decision. It explains the difference between multi-asset and crypto-focused prop firms, and then ranks the different kinds of firms. The goal is to give users sufficient information to know what option suits their crypto trading activities.
Prop firms can be multi-asset or crypto-only; how do they differ?
Once someone decides that a funded account is the route they want to take, the next fork in the road is choosing what kind of firm to sign up with. Here, users will have to choose between a multi-asset firm and a crypto-native, or crypto-only, one.
What are multi-asset firms?
These ones offer tradable assets from several markets. They are the most familiar kind of prop firms mainly because they came first.
A typical multi-asset prop firm offers CFDs and futures instruments, and it operates mostly as a broker. The assets such a firm offers include foreign exchange, or forex, commodities, metals, stocks, indices, and crypto. So, in this setup, crypto is simply bolted on as another instrument to select from a dropdown menu.
Methodology
All the firms in our selection had to satisfy at least one of the six criteria we developed for our research. That means the firm at the top ticked most of the boxes. The table below shows each criterion and its description:
- Payout speed and reliability — how long it takes to get paid once a user earned it, and how consistent that timeline is
- Drawdown consistency across plans — whether the same drawdown model applies to every evaluation path, or whether it switches between static and trailing depending on which plan a trader buys
- Rule transparency and consistency — whether the rules stay the same across plans, and whether restrictions are disclosed before payment
- Jurisdictional clarity — whether the firm discloses where it’s registered and where trading services are delivered
- Plan flexibility — whether the firm offers paths that fit different trader profiles without forcing everyone into one rule set
- Crypto-native payout rails — whether traders can withdraw in USDT or USDC at any account size, or are locked into slower bank transfers
Multi-asset firms
For those who prefer firms through which they can trade forex and other instruments in addition to crypto, then focus on this section. This research identified five firms in this category, which are as follows:
1. OneFunded

OneFunded leads on every criterion above more cleanly than any other firm on this list and was named Fastest Growing Prop Firm, Global, at UF Awards 2026. It processes crypto payouts in roughly an hour, applies a consistent rule framework across four evaluation paths, and pays out in USDT from the smallest account size.
The firm operates under Brynex Tech Limited, registered in the United Kingdom, with trading services delivered through a Saint Lucia-registered unit, OneFunded Capital Ltd. It has built its brand directly against the industry’s “failure factory” reputation, positioning transparency and rule consistency as its core differentiators rather than marketing claims layered on top of the same rules everyone else uses.
What does OneFunded offer?
- Payouts are processed within one hour of approval, the fastest turnaround among the multi-asset firms in this guide
- Four funding paths: Value, Core, Flash, and Instant Funding, each with its own risk profile and price point
- Entry from $29 on the Value plan
- Account sizes from $5,000 to $200,000
- 100% refundable evaluation fee on Value, Core, and Flash after a successful pass
- No time limit on any evaluation phase
- Low spreads and low commissions across supported instruments
- Overnight trading permitted, though swap or rollover fees may apply
- 200+ tradable instruments across forex, crypto, global indices, metals, and US/EU stocks
- 1:2 leverage on crypto
- Trading available via MT5, cTrader, and TradeLocker
- A scaling plan that can grow a funded account up to $1,000,000
Challenge types compared
| Parameter | Value | Core | Flash | Instant |
|---|---|---|---|---|
| Evaluation steps | 2-Step | 2-Step | 1-Step | No evaluation |
| Positioning | Lowest price, strict discipline | Most popular, classic rules | Fast funding | Immediate access |
| Min price | $29 | $35 | $56 | $79 |
| Account sizes | $5k–$100k | $5k–$200k | $5k–$200k | $5k–$25k |
| Profit target | 8% / 6% | 8% / 5% | 10% | None |
| Minimum trading days | 4 days | 3 days | 1 day | None |
| Daily loss limit | 4% | 5% | 4% | 3% |
| Overall loss limit | 8% | 10% | 6% | 6% |
| Consistency rule | Off | Off | 50% | 20% |
| Trading period | Unlimited | Unlimited | Unlimited | Unlimited |
| Crypto leverage | 1:2 | 1:2 | 1:2 | 1:2 |
| Profit split | Up to 90% | Up to 90% | Up to 90% | 80% |
| Refundable fee | Yes | Yes | Yes | No |
| Best for | Disciplined traders | Most traders | Confident, fast traders | Experienced traders |
How does it pay?
OneFunded pays up to a 90% profit split to the trader, with 10% retained by the firm. The first payout unlocks 14 days after opening the first position on a funded account, once the account holds at least $100 in profit, and processes within 1 hour. Recurring payouts follow every 14 days after that, and can be shortened to every 7 days with the Weekly Payout Add-on. Payouts go out via crypto (USDT, TRC20), bank transfer, or Rise, with the same $100 minimum payout threshold and 1-hour processing time across all three methods.
Where does it fall short?
OneFunded imposes a consistency rule of 50% on Flash and 20% on Instant programs.
Verdict
OneFunded best suits patient and disciplined multi-asset traders who value an unlimited evaluation period, clear drawdown parameters, and a choice of MT5, cTrader, or TradeLocker over high-leverage crypto exposure.
2. BrightFunded

BrightFunded is a Dubai-based prop firm operated by BrightFunded Co LLC and Bright Global FZCO, launched in 2023. It positions itself around simple rules, fast payouts, and a loyalty-driven scaling structure.
What does BrightFunded offer?
- Three evaluation tracks: 1-step, 2-step Bright, and 2-step Classic
- Account sizes from $5,000 to $200,000
- Over 48 crypto pairs, including BTC/USD, ETH/USD, XRP/USD, and SOL/USD
- 1:5 leverage on crypto
- A 15% profit reward paid during the evaluation phase
- Scaling Plan that can push profit split up to 100% and capital to $400,000
- No minimum reward threshold; even $0.01 profit qualifies for a payout request
- Evaluation fee refunded after first payout or first scaling milestone
Challenge types compared
| Parameter | Bright 2-Step | Dark 2-Step | 1-Step |
| Profit target P1 | 8% | 10% | 10% |
| Profit target P2 | 5% | 5% | – |
| Daily loss limit | 5% | 5% | 4% |
| Max overall loss | 10% static | 10% static | 6% static |
| Min trading days | 5 / 5 | 5 / 5 | 5 |
| Time limit | Unlimited | Unlimited | Unlimited |
| Drawdown type | Static (balance) | Static | Static |
| Crypto leverage | 1:5 | 1:5 | 1:5 |
| Account sizes | $5K–$200K | $5K–$200K | $5K–$200K |
| Starting fee | from €47 | from ~€55 | from ~€89 |
| Profit split | 80% → 100% via scaling | Same | Same |
| Payout cycle | Bi-weekly (weekly add-on) | Same | Same |
| 1st payout | 30 days after 1st funded trade | Same | Same |
| Trade2Earn | Yes | Yes | Yes |
How does it pay?
The default profit split is 80%, and the firm’s scaling program can raise this to as much as 100% for consistently profitable traders. Once they have something in their account, traders can request the first payout 30 days after the first trade, then bi-weekly (or weekly with an add-on). BrightFunded processes the payouts within 24 hours of approval, and the firm supports both cryptocurrency and bank transfer as withdrawal methods.
Where does it fall short?
BrightFunded only offers evaluation paths, which leaves out traders who may prefer instant funding.
Verdict
BrightFunded suits news-driven and event-based traders, since its offer of No Consistency Rules paired with only a brief 5-minute news trading restriction lets traders capitalize on high-volatility events.
3. Goat Funded Trader

Goat Funded Trader (GFT) is a trade name of Hong Kong-registered Wishes Tower International Limited. The firm has built a large user base of over 250,000 traders on the promise of near-total profit splits and a heavily gamified, points-based loyalty structure.
What does GFT offer?
- Four challenge types: 1-Step (GOAT), 2-Step (GOAT and Standard), 3-Step (GOAT), and Instant (GOAT, Pro, and Premium).
- Account sizes range from $5000 up to $400,000, which can reach $2 million via the scaling plan.
- Lowest entry fee of $17, which is an offer on the $5k 2-step track (both GOAT and Standard).
- A promise to process payouts within 2 business days, and failure will see GFT pay an extra $1000.
- 1:2 on crypto
- More than 500 crypto assets; this depends on the trading platform to choose
- A $3,000 daily profit cap on step-based funded accounts, with excess profit deducted rather than triggering a breach.
- Trading via MetaTrader 5, MatchTrader, TradeLocker, cTrader, and Volumetrica FX
Challenge types compared
| Parameter | 1-Step GOAT | 2-Step Standard | 2-Step GOAT | Instant GOAT |
|---|---|---|---|---|
| Profit target | 10% | 8% / 5% | 9% / 6% | — |
| Daily loss limit | 4% | 5% | 5% | 3% |
| Overall loss limit | 6% | 10% | 10% | 6% |
| Drawdown model | Trailing | Static | Static | Trailing |
| Starting fee | from ~$45 | from $17 | from $17 | from ~$199 |
| Fee refund | 100% | 100% | 100% | — |
| Profit split | 80% → 100% | 80% → 100% | 80% → 100% | 80% → 100% |
How does it pay?
The default profit split is 80%, which can rise to 100% through the firm’s scaling and loyalty points system. For those who opt for the GOAT Model’s first “On-Demand Reward,” the firm reduces that specific payout to a 40% split, even if the 100% add-on is purchased. After the first on-demand reward, subsequent payouts revert to the full standard split (80% or 100% if upgraded).
Payout cycles run bi-weekly on the GOAT and Pro models, and every 10 days on the Standard model. GFT caps the first two payouts on funded accounts at 6% of the initial account size or $10,000, whichever is lower, and this cap lifts after the second successful withdrawal. Withdrawals go out via Rise, Skrill, or crypto, and the firm promises to process payouts within two business days.
Where does it fall short?
For the first two reward requests only, GFT caps withdrawals at 6% of the initial account balance or $10,000 (whichever is lower). This restricts how much users can cash out early on.
Verdict
GFT is best suited for high-capital, disciplined traders who can maintain steady daily gains within the firm’s limits. This is because the $3,000 daily profit cap, consistency rule, and 5-minute news-trading profit cap all reward slow, controlled scaling.
4. FundedNext
FundedNext is operated by FundedNext Ltd, registered under the laws of the Comoros Islands. The firm markets itself as officially based in Ajman, the United Arab Emirates, and has built its brand around one of the fastest payout promises in the industry. It offers a $1,000 bonus if it fails to process a reward within 24 hours.
What does FundedNext offer?
- CFDs where users can trade crypto, currencies, and more, and Futures where they can trade CME-listed active contracts.
- CFDs plan includes Stellar 2-Step, Stellar 1-step, Stellar Lite, and Stellar Instant.
- Account sizes range from $2,000 to $200,000
- 9 cryptocurrency pairs in total, traded as CFDs, including BTCUSD, ETHUSD, LNKUSD, LTCUSD, and XMRUSD.
- 1:1 crypto leverage
- Crypto trading runs 24/5, meaning it is closed weekends
- A 3x swap charge on crypto positions held open on Fridays, to account for weekend rollover.
- Reward share of up to 95%
- Trading via MT4, MT5, cTrader, and Match-Trader
Challenge types compared
| Parameter | Stellar 2-Step | Stellar 1-Step | Stellar Lite 2-Step | Evaluation 2-Step |
| Profit target P1 | 8% | 10% | 10% | 10% |
| Profit target P2 | 5% | – | 5% | 5% |
| Daily loss limit | 5% | 3% | 5% | 5% |
| Max overall loss | 10% static | 6% static | 10% | 10% static |
| Time limit | Unlimited | Unlimited | Unlimited | 4 wks P1 / 8 wks P2 |
| Drawdown type | Static (balance) | Static | Static | Static |
| 15% challenge reward | Yes (add-on) | Yes | No | No |
| Account sizes | $6K–$200K | $5K–$200K | $5K–$200K | – |
| Starting fee | from $59.99 | from $59.99 | from $32.99 | from $32 |
| Profit split | 80% → 90% via scaling | 80% → 90% | 80% → 90% | 80% → 90% |
| 1st payout | Day 21 | Day 21 | Day 21 | – |
How does it pay?
FundedNext pays traders through a Reward Share that starts at 80% for Stellar 2-Step, Stellar 1-Step, and Stellar Lite accounts opened from January 12, 2026, onward, and this share can climb to 90% through the firm’s Scale-Up plan and up to 95% with paid addons. Splits for Express Accounts start at 60% on the first withdrawal before rising to 75% and then 90% on subsequent payouts. The firm also offers a 15% reward on Challenge profits once the trader meets Scale-Up eligibility criteria.
FundedNext’s payouts start 21 days after the funded account starts, then every 14 days after that. The subsequent cycle can be five business days for Stellar 1-Step traders, and on-demand for Stellar Instant Account holders. The firm supports payouts via USDT (ERC20, TRC20), USDC (ERC20), Confirmo, RiseWorks, Bank Transfer, and direct deposit to FNmarkets.
Where does it fall short?
Crypto positions incur a triple swap charge specifically on Fridays to account for weekend rollover.
Verdict
FundedNext suits patient traders who can wait out 21-day funding cycles and 14-day payout intervals while scaling toward higher reward shares.
Crypto-native firms
We know that this category of prop firms only offers digital assets as the tradable instruments. This means the options suit traders who have no interest in forex, indices, or stocks.
5. Breakout
Breakout started operating in November 2023 and was acquired by Kraken, one of the world’s largest cryptocurrency exchanges, in late 2025. That means Breakout is the only firm in this list directly owned by an exchange. The firm runs its own trading platform backed by Kraken’s liquidity.
What does Breakout offer?
- 1-Step Classic and 1-Step Pro evaluation paths
- Account sizes from $5,000 to $200,000
- Entry fees from $33 on the smallest 1-Step Pro account
- 62 tradeable crypto pairs
- Leverage up to 1:5 on BTC and ETH and 1:2 on altcoins
- No news trading restrictions of any kind
- Positions can be held overnight, over weekends, and over holidays
- On-demand payouts as long as the account has at least $50
- Trading fees of 0.04% per side, or 8 basis points per round trip
Challenge types compared
| Parameter | Classic 1-Step | Classic 2-Step | Pro 1-Step | Turbo 1-Step |
| Profit target P1 | 10% | 5% | 12–24% | Lower than Pro |
| Profit target P2 | – | 10% | – | – |
| Daily loss limit | – | 4% | 5% | 3% |
| Max overall loss | 6% static | 6% trailing | 5% static | 3% static |
| Drawdown type | Static | Trailing | Static | Static |
| Time limit | Unlimited | Unlimited | Unlimited | Unlimited |
| News trading | Fully permitted | Fully permitted | Fully permitted | Fully permitted |
| BTC/ETH leverage | 1:5 (alt 1:2) | Same | Same | Same |
| Max account size | $100K | – | $200K | $200K |
| Starting fee | from $45 | from $250 ($25K) | from ~$399 | from $45 |
| Profit split | 80% → 90% (add-on) → 95% after 3 mo | Same | Same | Same |
| Payout | On-demand 24/7 · USDC ERC-20 · 12–24 hrs · min $50 | Same | Same | Same |
How does it pay?
The default profit split is 80% to the trader, and which is upgradable to 90% at checkout at a fee. Breakout allows traders to request withdrawals anytime as long as the account has at least $50. The firm also promises “no approval queue and no minimum waiting period”, meaning a trader’s first payout can arrive the same day they get funded. Perhaps this is because the only payout method the firm supports is USDC on the ERC-20 network.
Where does it fall short?
The firm supports only one payout method.
Verdict
Breakout suits strictly crypto-focused traders who prefer on-demand payouts.
How the firms compare
| Firm | Type | Crypto Assets Offered | Payout Speed | Drawdown Type | Payout Cycle | Is Crypto Payout Method Available? |
| OneFunded | Multi-Asset | 15+ pairs | Within 1 hour of approval | Static | Weekly and Bi-Weekly | Yes |
| BrightFunded | Multi-Asset | 48+ pairs | Within 24 hours of approval | Static (1-Step);Trailing to high-water mark (2-Step) | 30 days, then bi-weekly | Yes |
| Goat Funded Trader | Multi-Asset | 500+ pairs (platform-dependent) | Within 2 business days | Static (GOAT evaluation models);Trailing (Instant models) | Bi-weekly (GOAT/Pro), every 10 days (Standard) | Yes |
| FundedNext | Multi-Asset | 9 pairs | Within 24 hours of approval | Static (Stellar plans); Trailing (Stellar Instant) | 21 days first cycle, then every 14 days | Yes |
| Breakout | Crypto-Native | 62 pairs | Same day, on-demand | Static (1-Step); Trailing to high-water mark (2-Step) | On-demand | Yes |
Matching a trading style to a firm
The chosen firm ultimately comes down to what the user is looking for beyond the advertised features. And a great approach to use is to do a self-evaluation and fit demands into a profile, such as the ones we will discuss below. Once a profile is known, they can easily tell which option suits them.
The multi-asset trader
This trader wants crypto in the same account as forex, indices, or metals, and has no interest in juggling separate platforms for each. If a trader fits into this profile, they will likely select OneFunded because it pairs a broad instrument list with a refundable evaluation fee and no deadline pressure during the challenge phase.
The altcoin specialist
This trader’s edge lives outside Bitcoin and Ethereum. HyroTrader is the strongest fit here, since its direct Bybit API connection unlocks more than 700 tradable pairs. Crypto Fund Trader is a close second because of its 550-plus pairs through the same Bybit connection, plus 556 additional pairs through MetaTrader 5 and Match-Trader.
Final word
It is much easier for crypto traders today to grow their careers because of the funding opportunities prop firms offer. The challenge is that lots of options are available, and the nature of prop firms itself is also fluid, which complicates decision-making.
However, one only needs to be clear on what they want, which will help them know whether a multi-asset firm suits them or they would be better off choosing a crypto-native one. Oftentimes, multi-asset options like OneFunded are ideal because they consolidate everything into one account.
Be that as it may, a funded account only works in someone’s favor if they approach it with a few non-negotiables in place. For instance, they must:
- Confirm the firm’s registration details independently
- Read the drawdown rules closely enough to know whether they are working against a static floor or a trailing one.
- Test the payout process with a small withdrawal request before scaling up their trading activity on the account.
- Treat the evaluation fee as the maximum amount they are willing to lose
- Revisit leverage caps on crypto specifically, since they are almost always lower than what the same firm offers on forex or indices.
It is also worth going in with realistic expectations about the odds. That means not being too certain that a user will easily get the funded account, because not everyone passes the evaluation. The most important thing is to have a solid strategy, one that will carry them through evaluation and at the funded stage.
Disclosure: This content is provided by a third party. Neither crypto.news nor the author of this article endorses any product mentioned on this page. Users should conduct their own research before taking any action related to the company.
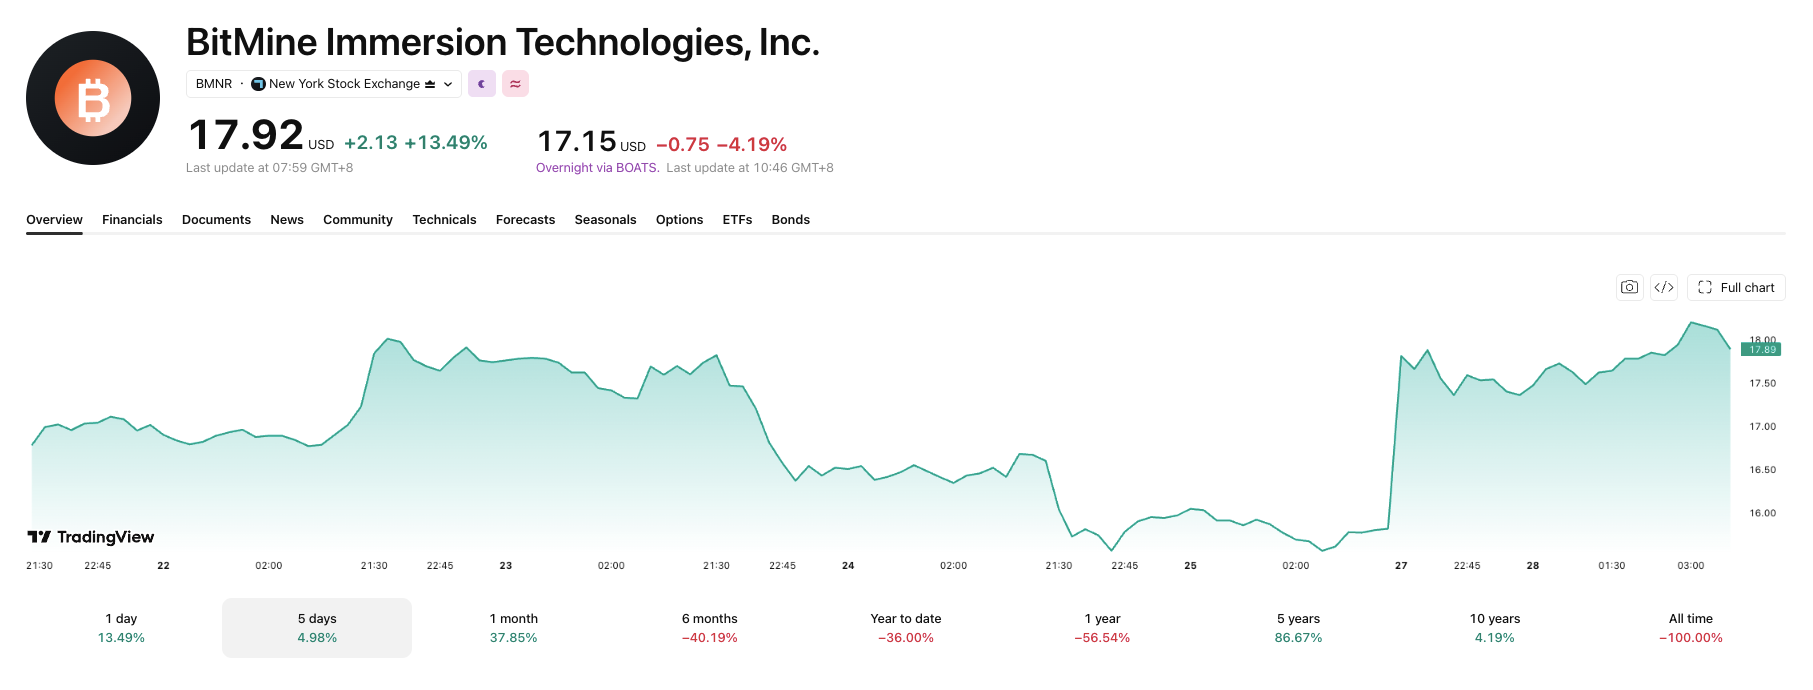
Bitmine Immersion Technologies (BMNR) shares popped 13% Monday after a fresh treasury update. It was the best-performing stock of the day on Wall Street. The Ethereum (ETH) firm’s $11.8 billion in crypto, cash, and equity stakes reassured Wall Street investors.
The company now holds 5.79 million ETH tokens, equal to 4.8% of Ethereum’s 120.7 million circulating supply. That puts Bitmine very close to its 5% accumulation target it set 13 months ago.
BitMine Buybacks Signal Confidence
Bitmine repurchased 6.1 million shares last week, up from 5.5 million the week before. That brought total repurchases to 11.6 million shares since July 1, under a $4 billion buyback program. Bitmine unveiled that program at its April NYSE main-board debut.

Chairman Tom Lee framed the accumulation as a long-term commitment rather than opportunistic trading.
“Bitmine has bought ETH every week since the inception of the ETH Treasury Strategy on June 30, 2025.”
— Lee
The firm also runs MAVAN, its own Ethereum staking network, which now holds 4.9 million staked ETH. Bitmine currently projects $254 million in annualized staking revenue. That could reach $299 million once its entire ETH position is staked.
A Wider Institutional Bet
Backers including Cathie Wood’s ARK Invest, Pantera Capital, and Galaxy Digital have supported Bitmine’s strategy. That reflects institutional appetite for Ethereum treasury companies well beyond retail traders.
BMNR now ranks among the most actively traded US stocks by dollar volume, Fundstrat data show.
The rally comes as other Ethereum treasury firms, including SharpLink, keep building ETH positions despite a choppy year. Whether Bitmine’s buyback pace and staking revenue hold up may determine if Wall Street’s patience with crypto treasuries continues.
The post Bitmine Stock Pops 13% as ETH Treasury Bet Pays Off on Wall Street appeared first on BeInCrypto.
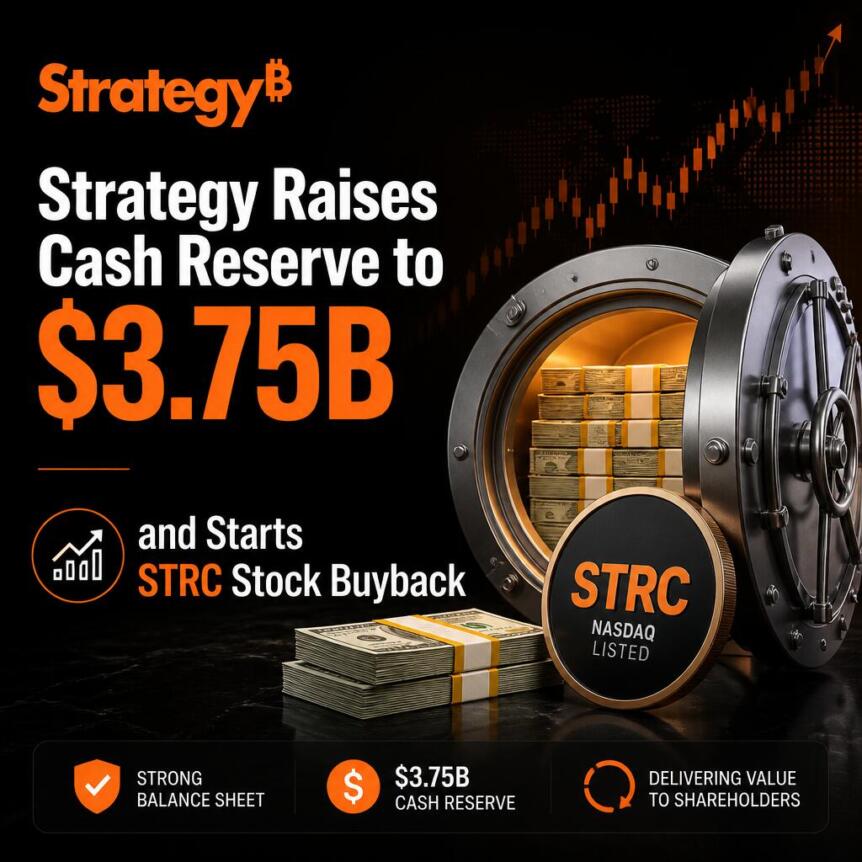
Strategy expanded its cash reserve to a record $3.75 billion after selling additional MSTR shares last week. The company also completed its first STRC preferred stock buyback under its repurchase program. Meanwhile, Strategy kept its Bitcoin holdings unchanged as MSTR shares gained during premarket trading and Bitcoin remained above $65,000.
Strategy Expands Cash Reserve and Completes First STRC Buyback
Strategy increased its USD reserve by $525 million after raising about $544.5 million through MSTR stock sales. The latest filing with the U.S. Securities and Exchange Commission confirmed the updated reserve position. As a result, the company now holds $3.75 billion in cash reserves.
The larger reserve gives Strategy about 2.1 years of dividend coverage under current estimates. At the same time, the company executed its first STRC preferred stock repurchase. Strategy bought back 288,930 STRC preferred shares for approximately $25 million.
The repurchase formed part of the Digital Credit Securities Repurchase Program announced last month. After the transaction, Strategy retained $975 million for additional preferred stock repurchases. Meanwhile, the MSTR share repurchase program still has about $1 million available for future purchases.
Bitcoin Holdings Stay Unchanged as Capital Strategy Continues
Strategy did not purchase additional Bitcoin during the latest reporting period. Instead, the company continued raising capital through MSTR share sales. The company still holds 843,775 BTC valued at approximately $58.47 billion.
Strategy acquired those Bitcoin holdings for about $63.68 billion over several years. Consequently, the company currently carries more than $5.21 billion in unrealized losses. However, the company has maintained its long-term Bitcoin treasury approach despite recent market fluctuations.
Strategy remains the largest corporate holder of Bitcoin among publicly traded companies. The company has regularly financed Bitcoin acquisitions through equity offerings and preferred stock issuance. However, the latest filing focused on strengthening liquidity instead of expanding Bitcoin holdings.
MSTR Shares Rise as Bitcoin Holds Above $65,000
MSTR shares closed 2.09% lower at $91.67 during Friday’s regular trading session. The stock traded between $89.76 and $93.68 before finishing below the previous close. Trading volume also remained below the stock’s 20 million share average.
Premarket trading showed renewed buying activity after the latest corporate filing became public. MSTR gained 2.21% and traded near $93.70 before the opening bell. Even so, the stock remains down about 10% over the past month and nearly 50% this year.
Meanwhile, STRC shares advanced 1.66% to $88.33 but remained below the preferred stock’s $100 target price. Several brokerage firms have maintained buy ratings on MSTR with an average 12-month target of $275. At the same time, Bitcoin traded above $65,000 after developments in Iran-Oman discussions supported broader market sentiment, while trading volume increased 86% during the past 24 hours.


The Hong Kong Monetary Authority (HKMA) has launched a framework to assess banks’ preparedness for quantum-computing threats as the city expands its use of tokenized deposits, digital assets and blockchain settlement.
On Monday, the HKMA introduced a white paper on quantum preparedness and the sector’s first Quantum Preparedness Index (QPI). The index gave the sector an overall readiness score of 2.3 out of 10, while the white paper found that around half of surveyed institutions had no formal post-quantum planning in place. The HKMA said it aims to achieve full sector readiness, represented by a QPI score of 10, by 2030.
The development comes as Hong Kong moves more traditional financial activity onto distributed ledgers. Government figures show that Hong Kong has issued three batches of tokenized green bonds totaling about HK$16.8 billion (about $2.1 billion) since 2023, while the HKMA is advancing tokenized deposits and digital-asset settlement through Project Ensemble.
The HKMA white paper said distributed ledger applications and payment networks depend on cryptography for core functions and could face severe disruption if those protections were compromised.
It also said one surveyed institution completed a proof of concept applying post-quantum cryptography to distributed-ledger connectivity and cited HSBC’s 2024 use of quantum-safe technology to move tokenized gold across distributed ledgers.
Hong Kong’s tokenization push raises quantum stakes
The quantum initiative follows the launch of the HKMA’s Fintech 2030 strategy in 2025, which made tokenization one of four strategic pillars in a plan comprising more than 40 initiatives.
The regulator said it would accelerate real-world asset (RWA) tokenization, regularize tokenized government bond issuance and explore tokenized Exchange Fund papers, with blockchain settlement supported by e-HKD, tokenized deposits and regulated stablecoins.
Related: Hong Kong launches initiative to help banks with DLT adoption
In a Feb. 11, 2026, speech, Hong Kong Financial Secretary Paul Chan said banks in Hong Kong held more than HK$14 billion (about $1.785 billion) in digital assets under custody at the end of 2025, up about 180% year over year, while tokenized deposits had reached HK$29 billion ($3.7 billion).
According to the HKMA white paper, quantum computers capable of running Shor’s algorithm at scale could eventually break widely used RSA and elliptic-curve cryptography. This could allow attackers to decrypt protected data or forge the digital signatures used to authorize transactions, verify identities and establish trust in financial systems.
Because replacing embedded cryptographic systems can take years, the HKMA urged banks to begin inventories, risk assessments and migration planning before such machines become available.
Magazine: Ethereum’s EEZ could pull other blockchains into its orbit

Tether’s gold-backed token XAUt has secured Shariah certification from Amanah Advisors, positioning the product for wider use among Islamic financial institutions and investors seeking Shariah-compliant exposure to physical bullion. The move focuses on whether the token’s underlying design aligns with Islamic finance principles, particularly around how value is held and whether income-generation features introduce interest-related concerns.
According to Tether, the certification concluded that XAUt’s structure complies with key Shariah requirements, including full backing by physical gold, the absence of interest and leverage, and transparent reserves. Tether says each XAUt token corresponds to one troy ounce of physical gold held in Swiss vaults.
Key takeaways
- XAUt received Shariah certification from Amanah Advisors, strengthening its suitability for Islamic financial institutions and investors.
- Tether says the token is fully backed by physical gold, with reserves designed to be transparent and structured without interest or leverage.
- As of March 31, Tether reported XAUt reserves exceeding 707,000 troy ounces worth more than $3.3 billion.
- Onchain data cited by RWA.xyz indicates XAUt’s asset value has risen from about $700 million in July 2025 to roughly $2.5 billion.
Why Shariah certification matters for tokenized gold
For many investors, the question is not simply whether an asset is pegged to a real-world commodity, but whether the product’s mechanics fit within Shariah guidelines. Islamic finance frameworks generally restrict practices considered to involve excessive uncertainty, speculative dynamics, or interest. Those constraints have historically created a barrier for broader adoption of mainstream crypto and tokenized offerings.
By obtaining certification, Tether has effectively reduced one of the main due-diligence hurdles for compliance-focused stakeholders. Tether said the certification gives it a clearer path to distribute XAUt to Islamic banks and institutions, as well as individual investors across regions where Islamic finance is widely practiced, including the Gulf Cooperation Council, South Asia, and parts of Africa.
In addition, Tether highlighted reserve transparency and physical custody as central to the compliance narrative. Tether’s position is that each token represents one troy ounce of gold stored in Swiss vaults, and that the token is not engineered with leverage or interest-bearing features.
Reserve coverage and growth in tokenized gold exposure
XAUt is described by Tether as one of the largest tokenized gold products in the crypto market. The company’s latest reserves reporting (available via Tether’s gold reserve reports page) showed that the token was backed by more than 707,000 troy ounces of physical gold as of March 31, representing a value above $3.3 billion.
Beyond reserve size, demand signals also matter. Data cited by RWA.xyz suggests XAUt’s onchain asset value has expanded significantly over the past year. The article notes that the figure rose from approximately $700 million in July 2025 to around $2.5 billion, indicating growing interest in gold exposure delivered through token infrastructure.
While tokenized commodities are often discussed through the lens of liquidity and accessibility, the key point for investors is how Shariah certification and physical backing can intersect with market demand. If institutions in Shariah-compliant finance ecosystems can evaluate the product with fewer structural objections, it may help unlock new distribution channels—particularly where regulators and compliance departments scrutinize whether a product’s income or risk characteristics violate established principles.
Broader trend: more Shariah-compliant crypto products
Debate over cryptocurrency’s compatibility with Islamic finance has been ongoing. As discussed in earlier coverage referenced by the source, scholars have differed on whether digital assets meet Shariah expectations due to concerns such as speculation and uncertainty. Over time, however, efforts to design compliant products have started to gain traction.
One example highlighted in the source dates back to 2025, when a Bahrain-based group, AlAbraaj Restaurants Group, said it adopted a Bitcoin treasury strategy and intended to develop Shariah-compliant financial instruments to broaden access to Bitcoin within the Islamic world.
More recently, the source points to developments in stablecoin infrastructure. In April, Palm Azgar Finance expanded its Shariah-compliant PUSD stablecoin to ADI Chain, positioning it around the scale of the global Islamic finance market. The source notes that PUSD became the second stablecoin available on that network, enabling institutions to settle transactions using either a dollar-linked asset or a dirham-denominated token on the same infrastructure.
Taken together, these examples frame a shift from theoretical compliance debate toward product engineering—attempts to structure crypto exposure in a way that can pass institutional review. Tether’s XAUt certification fits that broader pattern by targeting a concrete barrier: certification by a recognized advisor that can assess whether a tokenized gold product is consistent with Shariah guidelines.
Middle East momentum and the regulatory backdrop
Distribution is not just about product design; it also depends on how regional regulators handle digital asset services. The source describes Dubai as an increasingly prominent crypto hub and notes that the emirate’s Virtual Assets Regulatory Authority (VARA) issued its 50th virtual asset service provider license earlier this month. The article adds that this puts Dubai ahead of Hong Kong and Singapore in the number of licensed crypto firms, underscoring the pace of regulated market development in the region.
For tokenized assets like XAUt, regulatory clarity can influence whether institutions consider adoption—especially when they need to align token distribution, custody, and settlement practices with local compliance requirements. Shariah certification addresses a religious/contractual suitability question, while licensing and regulatory frameworks address operational and legal concerns. Together, the two can determine how quickly eligible products can move from niche demand to broader institutional access.
Looking ahead, the key variable will be how fast Shariah-compliant finance players incorporate XAUt into their offerings after certification. Investors and institutions should watch for indications of new partnerships, clearer market access strategies by Tether, and evidence that demand growth continues in step with the asset’s reserve reporting and onchain uptake.

The Hong Kong Monetary Authority (HKMA) has moved to harden the city’s financial system against the long-term risks posed by quantum computing. In a newly released white paper, the regulator unveiled a first-of-its-kind Quantum Preparedness Index (QPI) designed to measure how ready banks are for potential threats to the cryptography that underpins digital payments, tokenized deposits and blockchain-based settlement.
According to the HKMA, the sector’s overall QPI score stands at 2.3 out of 10. The white paper also found that around half of surveyed institutions have not put formal post-quantum planning in place. HKMA said it is targeting full sector readiness—defined as a QPI score of 10—by 2030.
Key takeaways
- The HKMA’s inaugural Quantum Preparedness Index scored the banking sector at 2.3/10, signalling limited maturity in post-quantum planning.
- About half of surveyed institutions reportedly lack formal post-quantum cryptography migration plans.
- The regulator links quantum risk directly to the cryptography used in distributed ledgers and payment networks, warning of potentially severe disruption if protections fail.
- HKMA aims for banks to reach “full readiness” by 2030, with early actions such as inventories and migration planning flagged as urgent.
Why Hong Kong’s tokenization agenda raises quantum stakes
HKMA’s quantum initiative arrives as Hong Kong deepens the integration of traditional finance with distributed ledger technology. The regulator’s broader push includes work to tokenize assets and expand digital settlement rails—areas that rely heavily on cryptographic security for confidentiality, authentication and transaction integrity.
Government figures highlighted in related reporting show that Hong Kong has issued three batches of tokenized green bonds totaling about HK$16.8 billion (roughly $2.1 billion) since 2023. At the same time, HKMA continues to advance tokenized deposits and digital-asset settlement efforts through Project Ensemble, a programme designed to explore how tokenized forms of money and assets can move and settle on distributed ledgers.
In practice, the more value that is represented, transferred, and authorized on cryptographically protected networks, the more consequential it becomes if the underlying encryption or signature schemes are eventually weakened by quantum capabilities.
The HKMA’s quantum preparedness framework
In Monday’s announcement, the HKMA introduced both a white paper on quantum preparedness and the sector’s first QPI. The regulator’s central point is that modern distributed ledger applications and payment networks depend on cryptography for core functions, meaning a compromise could translate into operational and trust failures across financial services.
The HKMA’s white paper states that quantum computers capable of running Shor’s algorithm at scale could break widely used public-key cryptography such as RSA and elliptic-curve cryptography. The regulator warns that this could enable attackers to decrypt protected data or forge the digital signatures used to authorize transactions, verify identities and underpin trust in financial systems.
Because cryptographic systems can be embedded deeply in hardware, software and operational processes—and replacement can take years—the HKMA is effectively pushing banks to treat post-quantum migration as a multi-year programme rather than a last-minute upgrade. The regulator urged institutions to begin inventories, conduct risk assessments and develop migration planning well before quantum capabilities become a practical threat.
What the QPI score suggests—and what banks must address next
The gap between the intended endpoint and the current readiness level is stark. With an overall score of 2.3 out of 10, the QPI results imply that many institutions may not yet have translated quantum risk into concrete governance, technical roadmaps, and replacement strategies for cryptography used across their systems.
HKMA’s findings also highlight a planning shortfall: around half of the surveyed institutions reportedly had no formal post-quantum planning. That matters because preparedness is not only about choosing replacement cryptographic algorithms. Banks also need to map where current cryptographic methods are used across their infrastructure, assess dependency chains in distributed-ledger connectivity and settlement workflows, and ensure that upgrades do not disrupt operational continuity.
While the overall picture is cautious, HKMA noted that at least one surveyed institution completed a proof of concept applying post-quantum cryptography to distributed-ledger connectivity. The white paper also referenced HSBC’s 2024 use of quantum-safe technology to move tokenized gold across distributed ledgers—an example that illustrates how quantum-resilience work can show up in real settlement experiments rather than remaining purely theoretical.
Still, the HKMA’s score indicates that these efforts are not yet broad-based enough to lift the sector average. For investors and market participants, the practical takeaway is that compliance, systems readiness and operational risk management around cryptography are likely to become increasingly important as Hong Kong scales tokenized products and distributed settlement services.
Hong Kong’s wider timetable: tokenization now, cryptography upgrades later
HKMA framed the quantum preparedness push within its broader strategy to expand fintech and tokenized finance. The regulator had previously outlined a Fintech 2030 strategy in 2025, where tokenization was identified as a strategic pillar in a plan covering more than 40 initiatives. The approach includes accelerating real-world asset (RWA) tokenization, regularizing tokenized government bond issuance, and exploring tokenized Exchange Fund papers, alongside blockchain settlement supported by mechanisms such as e-HKD, tokenized deposits and regulated stablecoins.
Supporting context also came from a speech by Hong Kong Financial Secretary Paul Chan, who said banks held more than HK$14 billion in digital assets under custody at the end of 2025—up about 180% year over year—while tokenized deposits had reached HK$29 billion. Those figures underscore the speed at which tokenization-linked activity is growing, even as cryptographic migration planning remains at an early stage.
That combination—rapid adoption of tokenized rails alongside an acknowledged lack of post-quantum preparation—helps explain why HKMA’s framework is structured as a measurable readiness programme with a target by 2030.
For readers watching this space, the key question is how HKMA will turn the QPI into action: whether institutions will formalize post-quantum migration plans at scale, and how quickly banks move from proof-of-concept work to system-wide inventories and upgrade roadmaps as tokenized settlement continues to expand.


A contract that pays one dollar if something happens and nothing if it does not is the simplest instrument in finance and the most legally contested. Here is how event contracts work, where the price comes from, who is allowed to list them, and why regulators still cannot agree whether they are derivatives or bets.
Summary
- An event contract is a binary derivative that settles at $1 if a stated outcome occurs and $0 if it does not, so its price between one cent and ninety-nine cents reads directly as the market’s implied probability.
- The buyer never owns an underlying asset: the contract references a real-world outcome, an election result, a rate decision, a match, a data release, and settles in cash against a named resolution source.
- Maximum loss is the purchase price, which makes the risk profile closer to a bought option than to a leveraged futures position, with no margin call and no liquidation.
- In the United States they trade on exchanges licensed by the Commodity Futures Trading Commission as designated contract markets, including Kalshi, Polymarket’s domestic venue, Crypto.com’s derivatives arm, ForecastEx, and Robinhood-affiliated Rothera.
- The unresolved question is categorical: federal derivatives law treats them as contracts, a dozen state gaming regulators treat them as wagers, and a bipartisan bill would ban the sports versions outright.
The instrument at the center of the fastest-growing market in American finance can be described in one sentence: a contract that pays one dollar if a stated thing happens and nothing if it does not. That simplicity is the reason event contracts spread from an academic curiosity to tens of billions of dollars in monthly volume, and it is also the reason they have generated more legal argument per dollar traded than any product in modern derivatives. A yes-or-no claim on a future outcome is, depending on which statute you read, a binary option, a futures contract, an information instrument, or a bet. This guide explains the mechanics from the ground up: what the contract is, where its price comes from and what that price means, how the venues are licensed, what the legal fight is actually about, and what a careful participant checks before putting money into one.
The instrument, precisely
Start with the payout structure, because every other property follows from it.
An event contract has two possible settlement values: $1 if the specified outcome occurs, $0 if it does not. Because the payoffs are fixed, the only variable is the price you pay to acquire the claim, which trades between one cent and ninety-nine cents. Buy a Yes contract at 60 cents and you risk 60 cents to make 40, an implied 40-cent profit on a 60-cent stake if you are right. Buy a No contract on the same market and the two prices sum to roughly a dollar, since one of the two must be true, and the small gap between them is the spread the venue and its market makers earn.
Three consequences of that structure matter more than any strategy discussion. First, maximum loss is the amount paid, always. There is no margin call, no liquidation price, no possibility of owing more than you staked, which distinguishes event contracts sharply from the perpetual futures that dominate crypto derivatives and gives them a risk profile closer to buying an option. Second, no underlying asset is ever owned or delivered. The contract references an outcome, and settlement is cash, which is why participants can hold a position on a Federal Reserve decision without touching a bond, or on an election without owning anything at all. Third, the outcome must be defined precisely enough to be adjudicated, which is why every serious contract specifies its resolution source in the rules, the official release, the certified result, the named data provider, and why a market can appear obviously settled in the world while remaining unresolved on the venue.
That third property is where most surprises live. The contract does not pay on what happened; it pays on what the named source says happened, according to the criteria written before trading began. Reading the resolution language is the single most valuable habit a new participant can build.
Where the price comes from
Event contract markets are order books, not bookmakers, and the distinction changes what the price means.
A sportsbook sets odds and takes the other side, earning a margin built into the line. An event contract exchange matches buyers with sellers, charging a fee, and takes no position: for every Yes contract someone holds, someone else holds the corresponding No. Price therefore emerges from participants disagreeing with each other at the margin, which is the mechanism that gives these markets their information reputation. When a contract on a Fed rate cut trades at 72 cents, it means the marginal dollar of capital in that market is willing to pay 72 cents for a claim worth a dollar if the cut happens, which is a probability estimate backed by money instead of opinion.
Liquidity comes from a mix of retail participants, professional market makers quoting both sides, and increasingly institutional flow. Deeper books produce tighter spreads and more reliable prices; thin books produce the opposite, which is why the same nominal price carries very different information content on a heavily traded macroeconomic market than on an obscure cultural one. Volume concentrates: political and macroeconomic contracts have accounted for a majority of trading on the largest regulated venue, and those are the markets where the price-as-probability reading is most defensible.
The reading is defensible, though, and not exact. Academic work on hundreds of thousands of settled contracts finds prediction market prices well calibrated overall while showing systematic distortions at the extremes, together with effects from fees, capital lock-up, and thin liquidity. Those distortions deserve their own treatment, and this publication covers them separately; for the purposes of this guide, the practical summary is that a price of 72 cents is a good estimate of a 72% chance and a bad substitute for one. That is what the price actually means.
Hedging, speculating, and the third use
Participants come to these markets for three distinct reasons, and the legal argument turns partly on which one dominates.
Hedging is the use that justifies the instrument in derivatives law. A farmer hedges weather, an importer hedges a tariff decision, a business exposed to a regulatory outcome buys the contract that pays if the unfavorable result lands. This is the classic economic purpose of any derivative: transferring a risk from a party who does not want it to one willing to price it, and event contracts extend it to categories no traditional futures market covers, since there has never been a way to hedge an election or a rate decision as directly.
Speculation is the use that dominates volume, as it does in every derivatives market ever created, and it is not a defect: speculators supply the liquidity that makes hedging possible. The distinguishing question, which the legal fight keeps returning to, is whether speculation in outcomes that participants have no economic exposure to is meaningfully different from wagering, and there is no settled answer.
The third use is the one the industry markets hardest: information. Prices aggregate dispersed knowledge into a continuously updated public number, and institutions increasingly consume that number as data, with exchange operators building distribution products around it. That informational role is what separates the strongest case for these markets from the gambling comparison, and it is why the sector’s largest investors have been buying data rights, not only trading fees.
Where they trade, and under whose license
In the United States, event contracts are federally regulated derivatives, and the venue matters as much as the contract.
Trading happens on designated contract markets, exchanges licensed by the Commodity Futures Trading Commission under the Commodity Exchange Act, which must clear their contracts through a registered clearinghouse. That is the license that lists them. Kalshi became the first purpose-built prediction market to hold that license in 2021. Polymarket, historically an offshore blockchain venue, acquired a licensed exchange to operate domestically. Crypto.com’s derivatives arm, Interactive Brokers’ ForecastEx, Gemini’s newly certified entity, and Rothera, the exchange affiliated with Robinhood and Susquehanna, all operate on the same regulatory footing. Outside the United States, blockchain-based venues settle in stablecoins with outcomes determined by decentralized oracle processes, a materially different resolution architecture that this publication covers separately.
The license is what separates an event contract from an offshore bet in legal terms, and it carries real consequences for participants: segregated customer funds, clearinghouse guarantees, exchange surveillance obligations, and a federal regulator with examination authority. It does not, however, settle the categorical question, which is the subject of the next section and of an unusual amount of current litigation.
The unsettled question: derivative or wager
Every element described so far is technically uncontroversial. What remains contested is what these instruments are, and the disagreement runs along the federal-state seam of American law.
Federal derivatives law treats event contracts as products a licensed exchange may list, subject to a special provision added by the Dodd-Frank Act that lets the CFTC prohibit contracts involving certain enumerated activities, including gaming and activity unlawful under state law, when they are contrary to the public interest. The Commission has used that authority against political contracts before, and it proposed a rulemaking this June to define the terms more clearly, a process this publication tracks in its coverage of contract listing procedures. That is how a market appears in days. Meanwhile a dozen-plus state gaming regulators argue that sports event contracts are wagers requiring state licenses regardless of federal registration, producing cease-and-desist orders and litigation across multiple jurisdictions. And in Congress, a bipartisan bill would ban CFTC-regulated exchanges from listing sports contracts outright, alongside separate legislation targeting contracts where a participant can influence or foreknow the outcome.
The honest framing for a reader is that the instrument’s mechanics are settled and its legal category is not. That uncertainty is not academic: it determines which contracts exist, which states residents can trade from, and whether the sports markets that generate the majority of retail volume survive the next Congress. Anyone participating should treat product availability as subject to change on a timescale of months.
The family tree
Event contracts are often described as a brand-new instrument, and understanding what they are related to clarifies both their appeal and the regulatory suspicion around them.
Their closest financial relative is the binary option, a derivative paying a fixed amount if a condition is met and nothing otherwise. That lineage carries baggage: offshore binary option platforms became one of the most prolific consumer fraud categories of the 2010s, marketed as simple trading and operating in many cases as unlicensed bucket shops with manipulated pricing, prompting bans on retail binary options in several jurisdictions and years of enforcement. The structural resemblance is real, and it is one reason regulators approach yes-or-no products with a caution that their simplicity does not obviously warrant. The material difference is venue: a contract listed on a licensed exchange, matched against other participants, cleared through a registered clearinghouse and surveilled under statutory core principles is a fundamentally different arrangement from an offshore platform quoting its own prices against its own customers. The instrument is similar; the market structure is not.
Their closest structural relative in traditional markets is the futures contract, which is why they sit under derivatives law at all. A futures contract obliges settlement against a reference price at a future date; an event contract settles against a reference outcome. Both transfer risk, both are standardized and exchange-traded, both clear centrally. The difference is that a futures contract’s underlying is usually something a participant can own, which supports the classic hedging story, while an event contract’s underlying is a fact about the world, which is why the hedging story requires more explanation and why the gaming comparison has traction.
And their closest relative outside finance is the parimutuel pool used in racing and lotteries, where all wagers form a pot and payouts derive from the distribution of bets. The distinction is important and often missed: parimutuel odds are determined entirely by how money is distributed among outcomes, so they measure sentiment among participants. Event contract prices are set by continuous two-sided trading against a fixed payout, which means arbitrage and informed capital can push the price toward an accurate estimate, and it is the reason these markets have a forecasting record that a betting pool does not. When the industry defends itself as information infrastructure, this is the distinction it is invoking, and it is a legitimate one.
The family tree explains the regulatory posture better than any argument about intent. Event contracts inherit the fraud history of binary options, the legal framework of futures, and the public perception of betting pools, and the sector’s entire legal project is to be treated as the second while shaking off the first and third.
What to check before trading one
Five things, in order of how often they cause avoidable losses.The resolution criteria. Read the rules, not the headline. The contract pays on what the named source reports under the stated criteria, and ambiguity in the wording is the raw material of every settlement dispute. That is how contracts finally settle, especially on blockchain-based markets with oracle processes.
The liquidity. Check the spread and the depth, not just the last price. A two-cent spread on a busy macroeconomic market is a different instrument from a fifteen-cent spread on a thin cultural one, and the wider the spread the more of your expected value the round trip consumes.
The fees. Venue fee structures differ, and on a contract priced in cents, fees are a large percentage of the potential return. Maker and taker treatment differs too, and the difference is measurable in the academic return data.
The capital lock-up. Money in a contract that settles in six months is money unavailable elsewhere for six months, with no interest. That opportunity cost is real and systematically ignored, and it is one reason long-dated contracts trade below their apparent fair probability.
The venue’s legal footing. Licensed domestic exchange, offshore book, or something in between changes your protections completely, and in a category under active legislative threat, it also changes the odds that your market still exists next quarter. This is the legal fight over the category.
One further practical note on position sizing, since the instrument’s simplicity invites a specific error. Because maximum loss equals the price paid, event contracts feel safer than leveraged products, and in one narrow sense they are: nothing can liquidate you. But the fixed-payout structure hides a different risk profile, which is that the loss rate is high by design. A strategy of buying contracts at 20 cents will, if the market is well calibrated, lose the entire stake four times out of five, and the profitable fifth outcome has to cover all of it. That distribution is psychologically punishing in a way a slowly bleeding leveraged position is not, and it is the reason experienced participants size these positions as a portfolio of small independent bets, never as conviction trades. The comparison worth holding is to buying options rather than to buying stock: defined risk, high probability of total loss on any single position, and profitability that depends entirely on the pricing being wrong in your favor often enough to pay for the losses. Anyone approaching event contracts with the mental model of a savings account with a yes-or-no switch has misunderstood the instrument in a way the interface will not correct for them.
Frequently asked questions
What is an event contract in simple terms?
A binary derivative that pays $1 if a specified real-world outcome occurs and $0 if it does not. It trades between one and ninety-nine cents, so a price of 65 cents implies the market sees roughly a 65% chance of the event. The buyer never owns any underlying asset, settlement is in cash, and the maximum loss is the price paid.
How is an event contract different from a bet with a bookmaker?
Structurally, in who takes the other side. A bookmaker sets odds and is your counterparty, earning a margin built into the line. An event contract exchange matches you with another participant and charges a fee, holding no position itself, so the price is set by traders disagreeing rather than by a house. In the United States, these venues are also federally licensed derivatives exchanges with clearinghouses and segregated customer funds.
Does the price really mean the probability?
Approximately, and with known distortions. Studies of hundreds of thousands of settled contracts find prices well calibrated overall, while showing systematic bias at the extremes, cheap contracts winning less often than their prices imply, plus effects from fees, thin liquidity, and the cost of capital locked until settlement. A price is a good estimate of probability and a poor substitute for one.
Can I lose more than I put in?
No. Because settlement values are fixed at $1 and $0, the maximum loss is the purchase price of the contract. There is no margin call and no liquidation mechanism, which makes the risk profile closer to buying an option than to trading leveraged futures, and it is one of the instrument’s genuine advantages for inexperienced participants.
Where can event contracts be traded legally in the US?
On CFTC-licensed designated contract markets that clear through registered clearinghouses. Kalshi holds the longest-standing prediction-market license, and other venues include Polymarket’s domestic exchange, Crypto.com’s derivatives arm, Interactive Brokers’ ForecastEx, a newly certified Gemini entity, and Rothera, the exchange affiliated with Robinhood and Susquehanna. Availability of specific contract types varies by venue and by state.
Why are sports event contracts controversial?
Because they sit exactly on the federal-state seam. Federal law permits licensed exchanges to list them subject to a public-interest review provision, while a dozen or more state gaming regulators argue they are wagers requiring state licensing, producing orders and litigation. A bipartisan bill in Congress would ban sports contracts on CFTC-regulated venues outright, and sports generates a large share of the category’s retail volume.
What are event contracts actually used for?
Three purposes. Hedging real exposure to outcomes no traditional futures market covers, such as a regulatory decision or an election result. Speculation, which supplies most volume and most liquidity. And information, since aggregated prices function as continuously updated public probability estimates, a product exchange operators are now packaging and distributing to institutional clients.
What is the most common mistake new participants make?
Trading the headline rather than the rules. Contracts resolve according to a named source and pre-written criteria, so a market can look obviously decided in the real world while resolving differently, or slowly, on the venue. Reading resolution language, checking spreads before sizing, and accounting for fees on cent-denominated contracts prevent most avoidable losses. This is educational information, not investment advice.
Disclaimer: This article is for information and educational purposes only and does not constitute financial, investment, or legal advice. Event contracts carry risk of total loss of the amount invested, product availability varies by venue and jurisdiction, and the legal treatment of these instruments is subject to active litigation and pending legislation. Always do your own research. Information is accurate as of July 27, 2026.


A mobile spyware campaign known as SparkKitty has returned to attention after reports warned that infected iOS and Android apps can expose crypto wallet recovery phrases stored in phone galleries.
Summary
- SparkKitty steals gallery images, seeking wallet seed phrases, passwords and other sensitive information stored digitally.
- Malicious iOS and Android apps reached official stores, while sideloaded versions expanded the campaign further.
- Researchers advise offline seed storage, limited photo permissions and immediate wallet migration after suspected exposure.
The malware gains photo access, collects images and sends them to attacker-controlled servers.
However, this is not a newly discovered July 2026 threat. Kaspersky published a technical report on June 23, 2025, after finding SparkKitty in Apple’s App Store, Google Play and unofficial channels. A recent Cyberint article has renewed attention around the same malware family.
SparkKitty campaign dates back to 2024
Kaspersky linked SparkKitty to SparkCat, an earlier mobile stealer that used optical character recognition to search screenshots for wallet seed phrases. SparkKitty used related delivery methods, but many samples uploaded gallery images rather than selecting only files containing recovery words.
Researchers also found a related cluster that used OCR to choose particular images. The malware may therefore expose passwords, identity documents and QR codes. Kaspersky said it “believe[s]” the main goal involved crypto assets, while noting that some samples lacked direct proof.
The campaign had operated since at least February 2024 and mainly targeted Southeast Asia and China. As crypto.news reported in June 2025, it spread through fake crypto tools, modified social apps, gambling products and other applications.
In April 2026, Kaspersky reported a new SparkCat variant in two App Store apps and one Google Play app. That finding showed continued use of OCR-based gallery theft, but it did not confirm that SparkKitty itself had returned.
Malware uses photo permissions to steal data
On iOS, researchers found malicious code inside modified frameworks that imitated common development libraries, including AFNetworking and Alamofire. Other versions hid the payload in an obfuscated file named libswiftDarwin.dylib or placed it directly inside an application.
After launch, the malware contacted remote infrastructure and requested access to the photo gallery. Once a user approved the request, it monitored photos and uploaded files that it had not previously sent. It could also collect newly added images.
On Android, SparkKitty appeared in Java and Kotlin versions. Some samples operated as Xposed modules on rooted devices. They contacted command servers and transferred images with information about the infected device and application.
This approach differs from malware that records keystrokes or replaces copied wallet addresses. As crypto.news reported in June 2026, Microsoft tracked separate clipper malware that watched the clipboard, stole wallet credentials and supported backdoor commands.
Infected apps reached official stores
Kaspersky found an Android messaging app with crypto exchange functions on Google Play. The app, named SOEX, recorded more than 10,000 installations before Google removed it after receiving the researcher’s report.
The team also found an iOS crypto app called 币coin in Apple’s App Store. Kaspersky alerted Apple and updated its report on June 25, 2025, to say that Apple had removed the app. Researchers did not determine whether developers knowingly added the malware.
Other versions spread through fake websites, modified TikTok apps, gambling products and directly installed Android packages. Some iPhone campaigns abused enterprise provisioning tools, which let organisations distribute internal apps outside the public App Store.
The latest reporting does not establish that the named applications returned to official stores in July 2026. It also provides no confirmed victim count or total crypto losses. The original listings were removed, while sideloaded copies may still circulate.
Offline seed storage remains the main defence
A seed phrase usually contains 12 or 24 words that can restore every private key linked to a self-custody wallet. Anyone who obtains those words can recreate the wallet and transfer its assets. Changing an app password cannot secure an exposed recovery phrase.
Users should not keep seed phrases in screenshots, cloud albums, email drafts or notes apps. The crypto.news 2026 wallet guide recommends writing the phrase on paper or recording it on metal, then storing it offline securely.
Users should review photo permissions and remove access from apps that do not need it. They should avoid unofficial stores, modified apps and unknown download links. An official listing lowers some risks but does not remove the need to check the developer and requested permissions.
Anyone who believes SparkKitty exposed a seed phrase should create a new wallet on a clean device and move remaining assets immediately. The user should then remove the suspected app, update the device and rotate credentials stored in gallery images.
Current reports have renewed the warning around SparkKitty, but the public technical record traces the campaign to Kaspersky’s 2025 disclosure rather than a new July 2026 discovery.
‘Take a tough call’: Ex-India captain wants Abhishek Sharma axed, backs Sanju Samson’s return | Cricket News

A Missing Underscore Sent Innocent Man To Prison For 18 Months

The Airport Baggage Mistake That’s Costing You Money


-

 Fashion3 days ago
Weekend Open Thread: Brooks Brothers
-

 Crypto World7 days ago
Grayscale Files For Worldcoin ETF, WLD Registers Sharp Rise
-

 NewsBeat6 days ago
How a former Blue Peter presenter stunned America’s Got Talent judges
-

 Tech1 day ago
Intel is reversing course and bringing hyper-threading back to its server chips
-
 Business6 days ago
New Jersey voter registration controversy explained: How 6,600 noncitizens got on the rolls, and what happens next
-
 Entertainment6 days ago
Johnny Depp’s R-Rated Gothic Cult Classic Gets New Release Ahead of Sydney Sweeney Remake
-

 Crypto World5 days ago
Ethics, other provisions in crypto Clarity Act to be further discussed
-

 Politics17 hours ago
Luke Littler dismantles Gerwyn Price to retain title in Blackpool
-

 Sports4 days ago
2026 3M Open leaderboard: Scottie Scheffler finds putter in Round 1, sits three back
-
 Sports1 day ago
Commonwealth Games boxing: Jadumani Singh seals dominant 5-0 win over Pakistan’s Sumama Rehman to enter quarter-finals | Commonwealth Games News
-

 Fashion4 days ago
16 Dresses for the High Summer Event
-

 News Videos4 days ago
The Peugeot Family: How 200 Years of an “Old Money” Dynasty Died in A Boardroom
-

 Politics2 days ago
Spain sweeps the board at 2026 World Cup with individual awards
-
 Entertainment4 days ago
A New Post-Apocalyptic Gundam Anime Series Blasts Into SDCC
-

 News Videos1 day ago
BITCOIN JUST ENTERED THIS CRITICAL ZONE…
-

 Crypto World2 days ago
XRP Ledger adds $2.6B as RWA inflows rank second
-
 NewsBeat7 days ago
NADINE DORRIES: I have witnessed first-hand what happens to new Prime Ministers when they enter No 10… and this is why Andy Burnham will be out by May
-

 Crypto World5 days ago
Uniswap (UNI) pushes deeper into tokenized RWAs with permissioned trading pools
-
 Crypto World6 days ago
Sablier Labs Enters Maintenance Mode, Halts Development
-
Crypto World5 days ago
SEC Agrees to Overhaul Recordkeeping After Settling Coinbase Lawsuit Over Gensler’s Lost Texts
You must be logged in to post a comment Login