
Crypto World
Growth, Challenges, and What’s Ahead


Despite notable advancements, PI has collapsed by almost 95% from its ATH.
The controversial cryptocurrency project Pi Network has been around since 2019, but users had to wait until February 2025 before they could finally trade the native token PI.
Over the past 12 months, the Core Team has rolled out multiple upgrades as the ecosystem has continued to develop. Yet, PI’s price has suffered a steep decline, the project is still grappling with several challenges, and some Pioneers have voiced growing criticism. The key question now is whether the upcoming advancements can trigger a decisive comeback for PI or whether the bears will remain in charge.
Happy First Birthday, PI
Exactly one year ago, Pi Network launched its Open Network. The initiative made PI publicly accessible and enabled exchanges to list it as the first to hop on the bandwagon were Bitget, OKX, and MEXC.
On the debut day, the asset’s valuation varied across platforms, ranging from $1.68 to $1.72. Interest from traders and investors was high over the following days, and PI reached a historical peak of approximately $3 by the end of February last year. Meanwhile, its market capitalization exploded above $18 billion, placing the coin among the 15 largest cryptocurrencies.
However, the peak was short-lived, and PI headed straight south in the following months. Some reasons potentially suppressing the price include ongoing token unlocks, fading interest from market participants, accusations that the project could be a scam, and Binance’s inaction.
The world’s largest crypto exchange was rumored to follow Bitget, OKX, and MEX in listing PI: a move that could lift the token’s value by increasing its liquidity, visibility, and overall legitimacy. It even held a community vote to ask its clients whether they wanted the asset available on the platform. While more than 86% of the participants selected the “yes” option, Binance has yet to honor their wish.
PI has seen sporadic price revivals over the last several months, driven by upgrades announced by Pi Network’s team, but currently trades at around $0.17, representing a staggering 94% decline from the all-time high.
You may also like:
Some of the updates targeted the verification process, which has long been a source of frustration for many users. In September 2025, for instance, the team unveiled Fast Track KYC – a feature that allows Pioneers to participate in the Mainnet ecosystem “earlier than ever before.”
In October, it was revealed that more than 3.36 million additional users had successfully completed the required verification procedures following the release of a system process that conducts vital checks on Tentative KYC cases. Just a few weeks ago, the team unveiled a technical upgrade that should allow multiple Pioneers to pass the Miannet migration. Specifically, they claimed the roughly 2.5 million users who were previously unable to migrate will be unblocked.
Other standout developments over the past 12 months include the launch of Pi Network Ventures (a Pi-related fund targeting $100 millin in investments in innovative startups), the project’s entry into the AI space through Pi App Studio, the introduction of the first Hackathon, and a partnership with CiDi Games to accelerate Web3 gaming engagement.
Most recently, the Core Team disclosed that migration to Protocol v19.6 was successfully completed. “Next up is v19.9 – the final step before v20. Node operators should make sure they’re upgraded and stay tuned for further instructions,” the X post read.
What Lies Ahead?
Many members of Pi Network’s community believe that 2026 could be successful, claiming that something “big” is on the horizon. Some have pointed out March 12 as a key date, as a major upgrade related to the Pi DEX activation is expected to go live then. If confirmed, the launch could play an important role in strengthening user trust and increasing real-world use of PI.
Meanwhile, rumors have circulated that leading exchanges, such as Kraken, may soon offer trading services for the token.
Pioneers are also closely watching March 14 – a date, known across the community as Pi Day due to its symbolic resemblance to the mathematical constant π (3.14). Pi Network expanded its ecosystem on that day in 2025, and it remains to be seen whether a similar move will occur this year.
SECRET PARTNERSHIP BONUS for CryptoPotato readers: Use this link to register and unlock $1,500 in exclusive BingX Exchange rewards (limited time offer).
Disclaimer: Information found on CryptoPotato is those of writers quoted. It does not represent the opinions of CryptoPotato on whether to buy, sell, or hold any investments. You are advised to conduct your own research before making any investment decisions. Use provided information at your own risk. See Disclaimer for more information.


TLDR:
- Ethereum is nearing a multi-year support zone, where demand has historically driven strong price reversals.
- Monthly chart structure shows ETH moving within a defined range between $1,500 and $5,000 levels.
- Tightening volatility suggests a breakout may occur soon as price compresses near key support.
- Traders monitor for bullish confirmation signals before positioning within the current range setup.
Ethereum is approaching a critical support range on higher timeframes, as recent market structure points to a prolonged consolidation phase.
Analysts are closely watching price behavior near key levels, where risk-to-reward setups tend to favor strategic positioning within established boundaries.
Ethereum Tests Range Extremes on Higher Timeframes
Recent analysis shared by market participant Lennaert Snyder points to Ethereum revisiting a key monthly support zone.
His observations focus on a “sell-to-buy” candle that initiated the move toward the all-time high. That area now acts as a technical reference for long-term traders.
According to the tweet, price is testing the lower boundary of a multi-year range. This zone aligns with previous demand and remains a focal point for potential accumulation.
The presence of a long wick in that candle suggests liquidity remains in that region. Markets often revisit such wicks before establishing a directional move.
The broader monthly structure presents a clear cycle. Ethereum surged during 2020 and 2021, followed by a sharp decline in 2022.
Since then, price has moved sideways, forming a wide horizontal range. This structure indicates a market without a strong directional trend.
The range is defined by resistance near $4,800 to $5,000 and support between $1,500 and $1,700. These levels have repeatedly acted as turning points. Buyers tend to step in near the lower boundary, while sellers dominate near the upper limit.
Snyder’s commentary suggests that testing this lower range extreme could offer favorable setups. Traders often seek entries in such zones due to tighter risk control. However, confirmation through price action remains essential before any directional bias is established.
Consolidation Phase Signals Potential Expansion
On lower timeframes, Ethereum reflects a similar pattern of compression. After a sharp decline earlier this year, price stabilized and moved within a narrower range. This aligns with the broader monthly structure, reinforcing the idea of consolidation.
Technical indicators show reduced volatility, as Bollinger Bands have tightened. This typically precedes larger price movements, although direction remains uncertain. At the same time, momentum indicators indicate weakening bullish pressure in the short term.
Price currently trades near the middle to lower portion of its recent range. Resistance remains firm around $2,200 to $2,300, while support sits near $1,900. These levels act as immediate barriers within the broader structure.
The projected path shared in the analysis suggests a possible dip into deeper support. This move could sweep liquidity before a potential reversal. Such behavior is common in range-bound markets, where stop levels attract price action.
Two scenarios remain in focus. If Ethereum holds the lower support zone, a gradual move toward mid-range levels near $3,000 could follow. Continued strength may then push price toward the upper boundary of the range.
On the other hand, a breakdown below $1,500 on a monthly close would shift the structure. This would indicate a loss of support and open the door for further downside. Market participants continue to monitor these levels closely as price approaches a decision point.
As Ethereum trades near range extremes, attention remains on confirmation signals. The coming months are expected to provide clearer direction within this established structure.


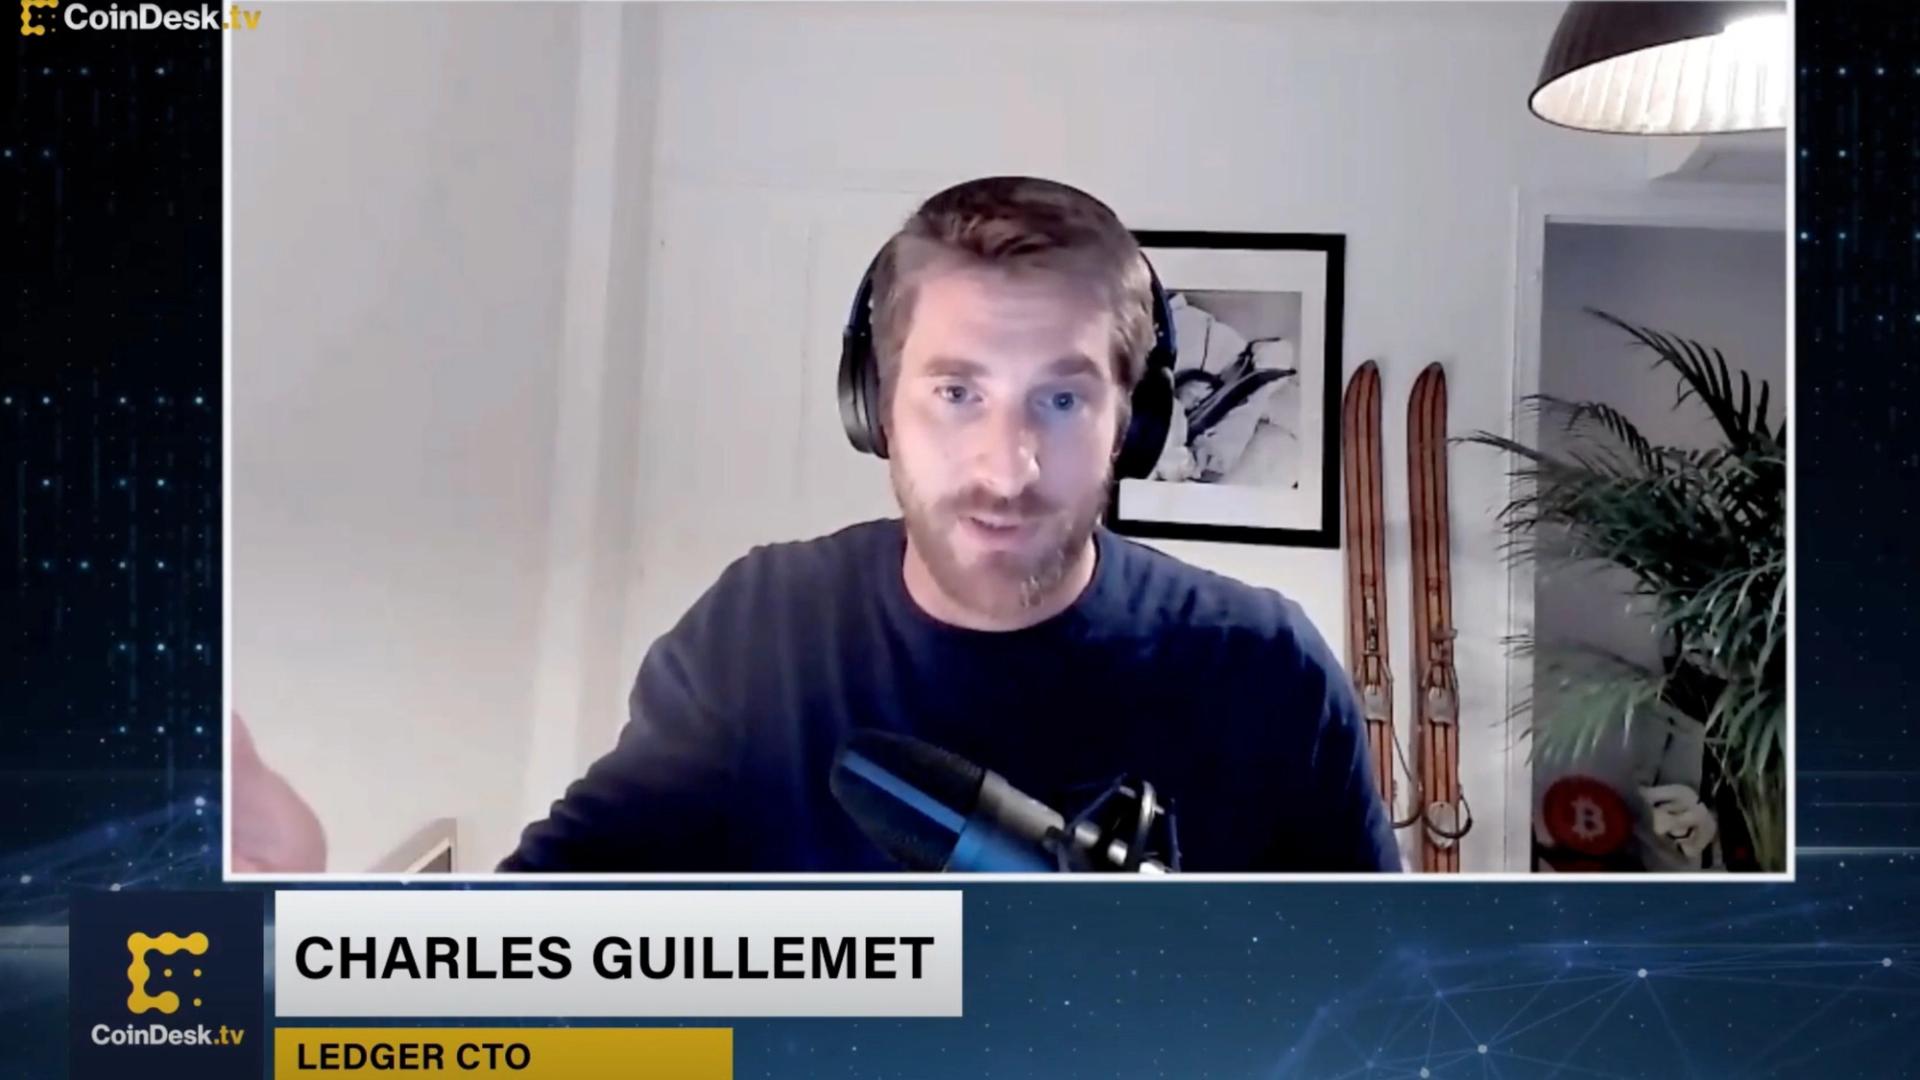
Crypto platforms — and investors — have long suffered from hacker attacks and exploits. Now, artificial intelligence (AI) is making that threat even worse.
That’s the view of Charles Guillemet, chief technology officer at crypto wallet provider Ledger, who said the economics of cybersecurity are breaking down as AI tools make it faster and cheaper to attack systems.
“Finding vulnerabilities and exploiting them becomes really, really easy,” Guillemet told CoinDesk in an interview. “The cost is going down to zero.”
His remarks come as crypto heists are in the headlines again. Just this week, Solana-based decentralized finance protocol Drift was exploited, with attackers draining $285 million worth of digital assets. It is one of the most severe exploits of the year so far. A week before that, an attack on yield protocol Resolv led to $25 million in losses.
Altogether, over $1.4 billion in assets were stolen or lost in crypto attacks over the course of the past year, according to data by DefiLlama.
From asymmetry to arms race
Security has long relied on an imbalance: it should be harder and more expensive to hack a system than the potential reward.
But AI is eroding that advantage. Tasks that once took skilled researchers months, like reverse engineering software or chaining exploits, can now be done in seconds with the right prompts.
For crypto, where code often controls large pools of funds, that shift raises the stakes.
“You need to be perfect,” Guillemet warned teams developing blockchain protocols.
The problem is compounded by AI-generated code. As more developers rely on AI tools, vulnerabilities could spread faster.
“There is no ‘make it secure’ button,” he said. “We are going to produce a lot of code that will be insecure by design.”
Raising the security bar
For crypto protocols, that means rethinking security from the ground up.
Guillemet pointed to formal verification — using mathematical proofs to validate code — as a stronger approach than traditional audits, which may miss bugs.
Hardware-based security is another layer, he said. Devices like hardware wallets isolate private keys from internet-connected systems, reducing exposure.
“When you have a dedicated device not exposed to the internet, it is more secure by design,” he said.
That approach is becoming more relevant as malware grows more advanced. Guillemet described attacks that scan compromised phones for wallet seed phrases, allowing hackers to drain funds without user interaction.
For average crypto users, Guillemet’s message is blunt: assume systems can and will fail.
“You can’t trust most of the systems that you use,” Guillemet said.
That could push more users toward cold storage, stronger operational security and keeping sensitive data offline. Even then, risks extend beyond software, including physical attacks targeting crypto holders.
Guillemet expects a divide ahead. Critical systems like wallets and protocols will invest heavily in security and adapt. But much of the broader software ecosystem may struggle to keep up.
“It’s really easier to hack everything,” he said.
TLDR:
- The Cayman Islands officially holds $427 billion in U.S. Treasuries, but Fed research puts the true figure far higher.
- Fed researchers identified a $1.4 trillion undercount, making the Cayman Islands the largest foreign Treasury holder.
- Hedge funds domiciled in the Cayman Islands absorbed 37% of all net Treasury issuance between 2022 and 2024.
- Unlike central banks, hedge funds can exit Treasury positions rapidly, posing a risk to U.S. debt market stability.
The Cayman Islands, a Caribbean territory with just 90,000 residents, holds more U.S. Treasuries than Japan or China.
Federal Reserve researchers have found that official data undercounts the island’s actual holdings by $1.4 trillion. This discovery reshapes long-held assumptions about who finances American debt.
For decades, analysts pointed to Asian economic giants as the backbone of Treasury demand. The real picture, however, tells a different story entirely.
Hedge Funds Drive Cayman Islands’ Treasury Holdings Beyond Official Figures
Official records place Cayman Islands holdings at $427 billion, ranking it sixth among foreign holders. Japan leads on paper at $1.22 trillion, followed closely by China.
However, Fed researchers determined the official count misses over $1.4 trillion in actual Cayman-linked purchases.
The reason behind this gap is structural. The Cayman Islands serves as the legal domicile for roughly three-quarters of the world’s offshore hedge funds.
When those funds buy Treasuries, the purchases register under the Cayman Islands, regardless of where the fund managers actually operate.
Between 2022 and 2024, hedge funds domiciled there purchased $1.2 trillion in Treasury securities. That figure absorbed 37% of all net issuance during that period. As @BullTheoryio noted, that is nearly equal to what all other foreign investors combined purchased.
After the Fed’s adjustment, the Cayman Islands surpasses Japan, China, and the United Kingdom combined. This makes a nine-square-mile island the single largest foreign financier of U.S. government debt today.
Treasury Market Stability Faces Questions as Hedge Fund Exposure Grows
Central banks and sovereign wealth funds tend to hold Treasuries as long-term reserve assets. They rarely exit positions abruptly, even during periods of market stress. Hedge funds operate under an entirely different framework.
These funds carry leveraged positions and answer to performance mandates, not policy goals. They have no obligation to remain invested when market conditions shift against them. That difference matters greatly when the largest buyer controls such a large share of demand.
In April 2025, a sudden tariff announcement triggered simultaneous unwinding across multiple funds. That coordinated exit added pressure across the entire Treasury market at once. The event exposed just how quickly this pool of demand can reverse.
The Fed’s own paper concluded with a direct warning directed at analysts and policymakers. Researchers wrote that “data users should be aware that this major gap exists.” That single line carries weight given the scale of the miscounting involved.
The Cayman Islands’ GDP stands at $7 billion, yet funds registered there finance positions worth many times that figure overnight.
The concentration of leveraged, short-term capital in one jurisdiction now sits at the center of U.S. debt market dynamics.
Large Bitcoin investors are absorbing significant realized losses as the flagship cryptocurrency remains trapped in a prolonged sideways slump below $70,000.
According to on-chain data from Glassnode, wallets holding between 100 and 10,000 BTC are currently realizing daily losses of over $200 million based on a 7-day moving average. These large investors are often referred to as “whales” and “sharks.”
Bitcoin Slump Forces Major Holders Into Deep Losses
Notably, this pain is particularly acute among “Long-Term Holders.” This represents investors who acquired their coins more than six months ago near the peak of the previous rally.
The 30-day simple moving average of Long-Term Holder Realized Losses has climbed steadily since November 2025. This upward trend confirms that veteran investors are increasingly capitulating and selling at a loss.
While this flush-out of underwater buyers is a standard feature of bear-market resolutions, Glassnode analysts note it is not yet sufficient to call a bottom.
To signal the structural exhaustion that typically precedes a new bull cycle, selling pressure will likely need to decelerate to below $25 million in daily realized losses.
However, the chances of reaching that exhaustion point quickly seem slim, as the market is currently gripped by its most bearish sentiment in months.
Blockchain analytics firm Santiment reports that fear, uncertainty, and doubt (FUD) have crept back into the community.
Citing data across social media platforms, including X, Reddit, and Telegram, Santiment noted that Bitcoin is seeing its highest bearish discussion ratio since late February.
The firm noted that BTC is showing a ratio of just 0.81 bullish comments per bearish one amid this extended period of stagnation.
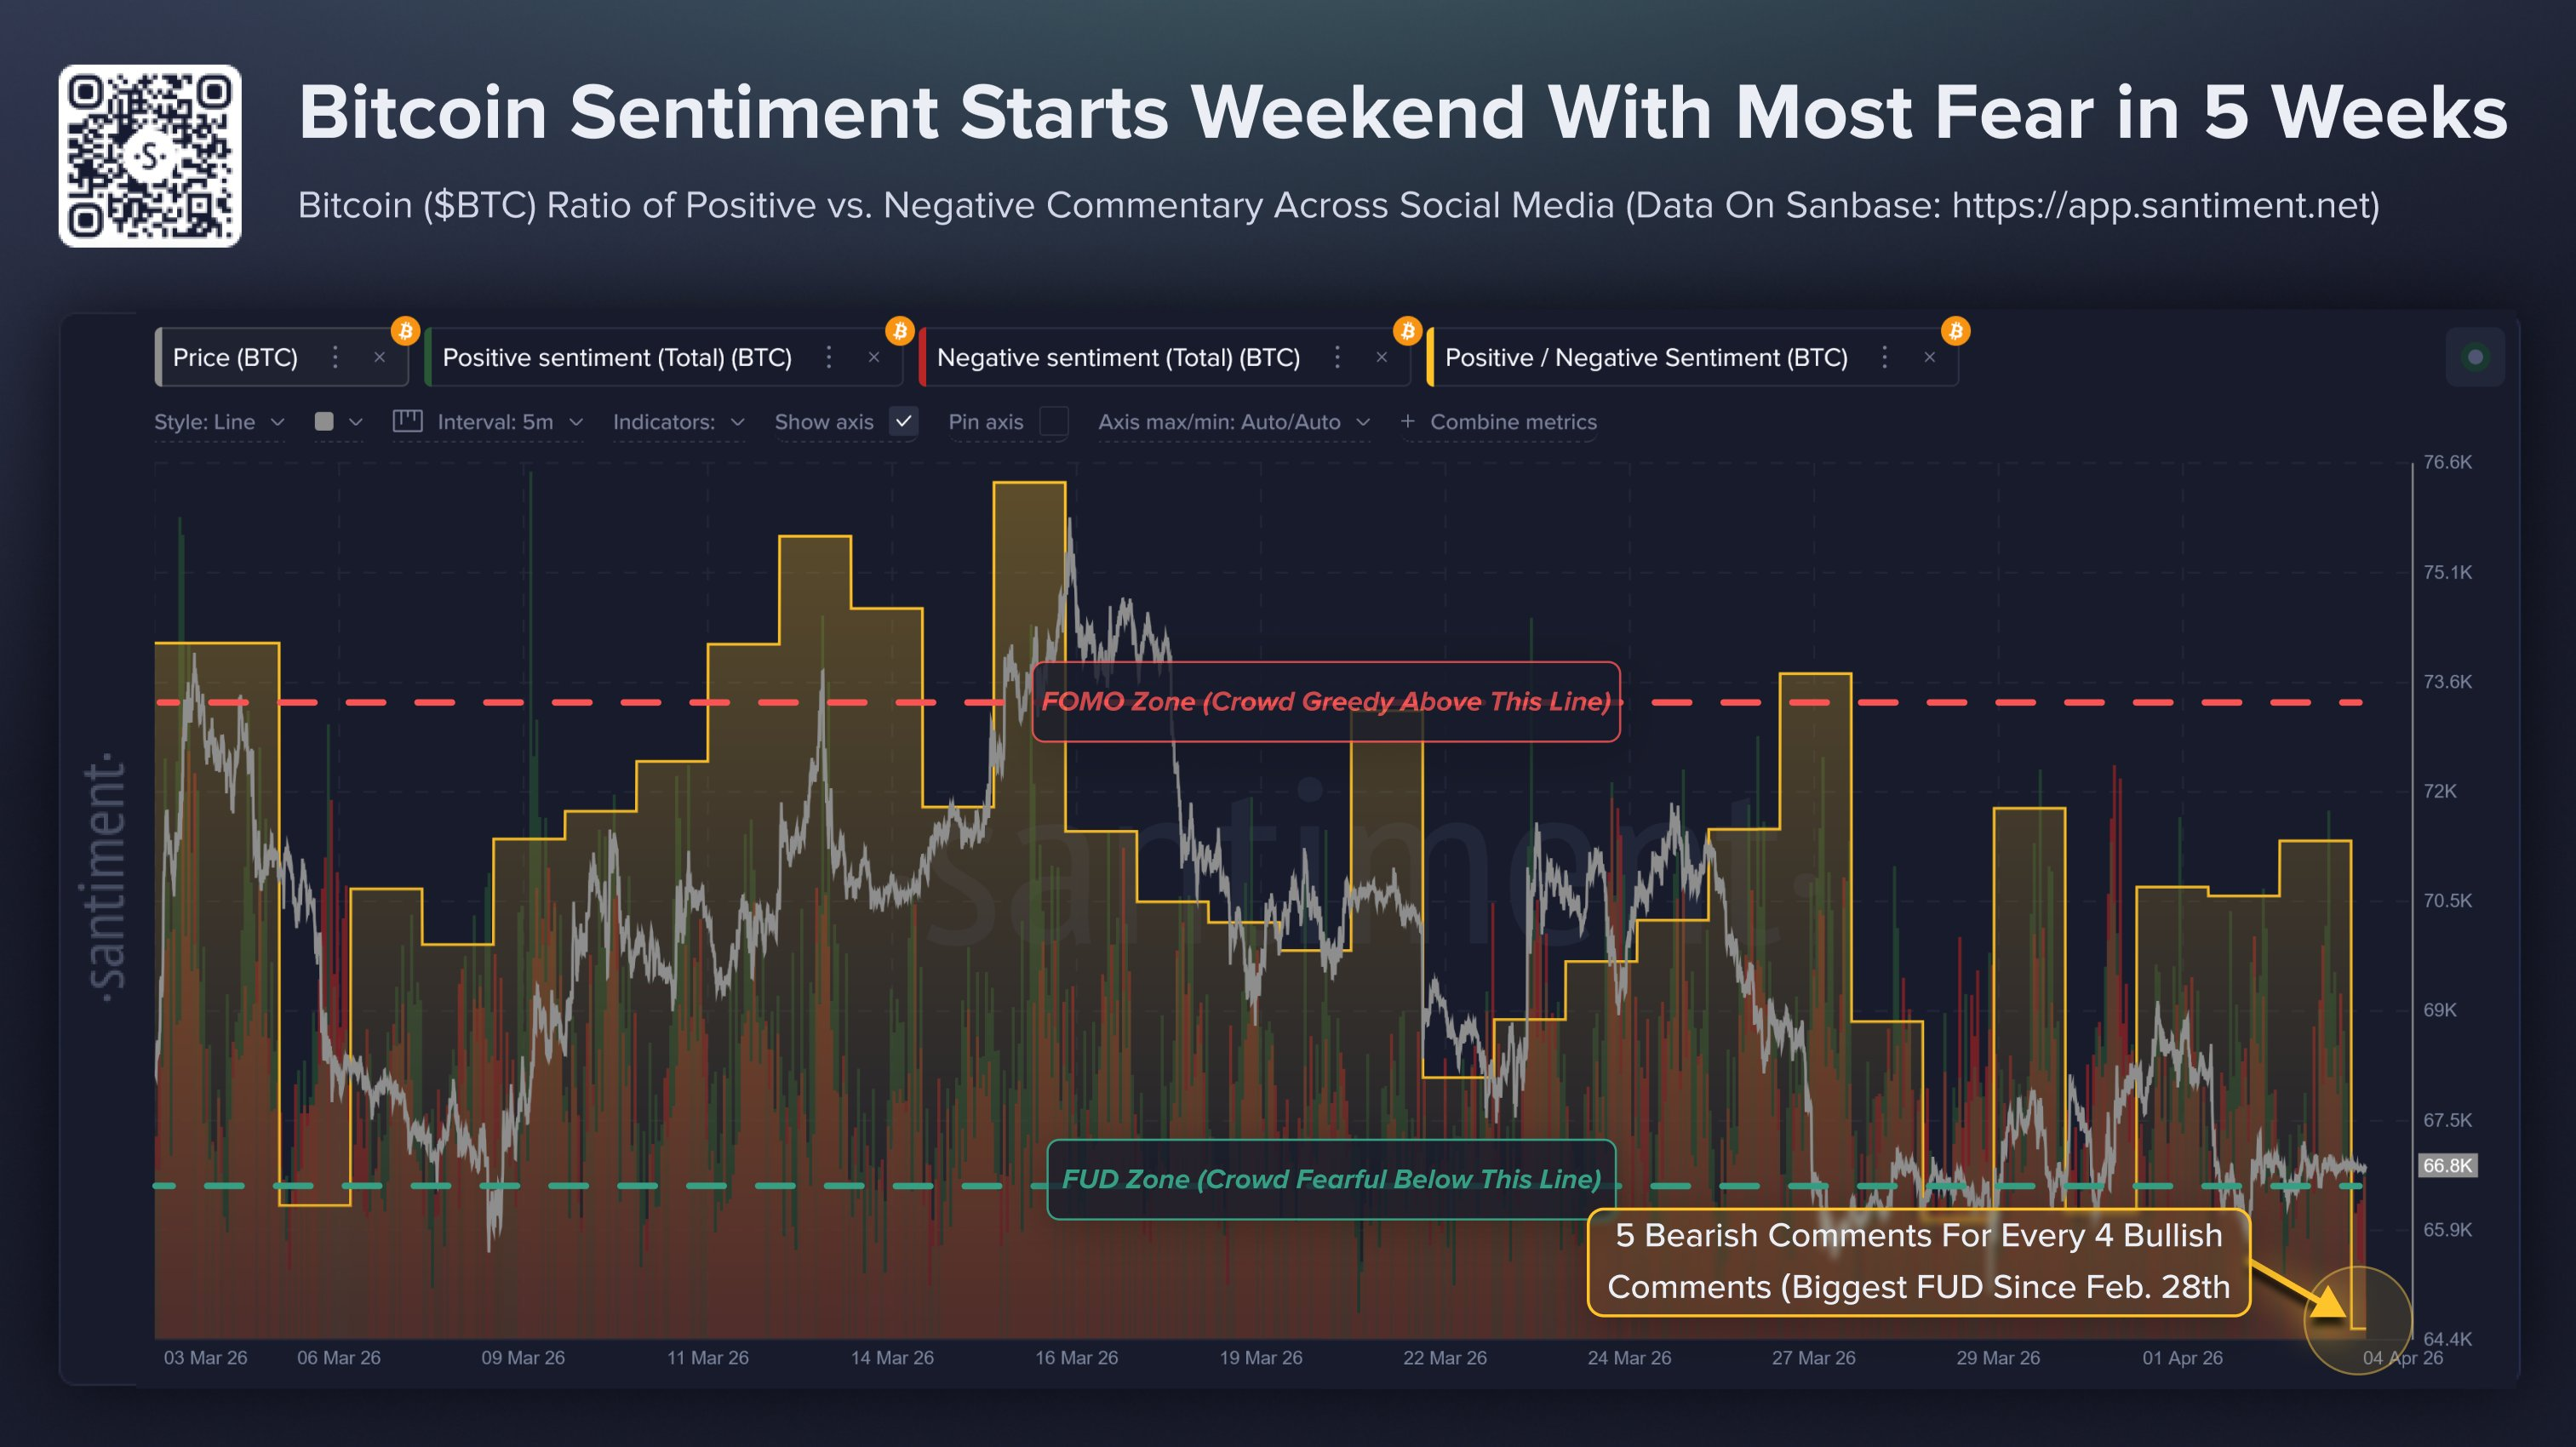
With Bitcoin’s price hovering around $66,800, ongoing geopolitical tensions and domestic regulatory debates are fueling widespread pessimism.
Yet, Santiment pointed out that there is a silver lining for contrarian traders as markets typically move in the opposite direction of the crowd’s expectations.
Historically, this heightened fear has fueled price rebounds. This suggests the current market conditions could turn positive sooner than the broader community anticipates.
The post Bitcoin Whales Are Losing $200 Million Daily As Market Fear Rises appeared first on BeInCrypto.


Robert Kiyosaki said current economic pressure reflects changes that began in the 1970s.
Summary
- Kiyosaki said 1974 policy shifts still shape debt, inflation, retirement pressure, and demand for Bitcoin.
- He warned baby boomers may face retirement income gaps as pensions gave way to market-based accounts.
- Santiment data showed Bitcoin bearish sentiment rose, while contrarian traders watched fear levels for reversal signs.
Robert Kiyosaki said 1974 marked a major shift in how money and retirement worked in the United States. In a post on X, he wrote that “the future created in 1974 has arrived” and tied today’s financial stress to policy changes from that period.
He connected that year to the petrodollar system and to changes in retirement planning. Kiyosaki said those changes helped shape the debt and inflation concerns now facing households and investors.
Kiyosaki also referred to the Employee Retirement Income Security Act and the wider move away from pension structures that paid workers for life. He said many workers now depend on market-based retirement accounts instead of guaranteed income after leaving work.
He warned that this shift placed more responsibility on individuals. In the same post, he wrote that “millions of baby-boomers will soon find out they have no income once they stop working,” linking that concern to long-term pressure on retirement security.
In addition, Kiyosaki repeated his long-running support for gold, silver, and Bitcoin. He described those assets as “real money” and said people should focus on financial education while looking at alternative stores of value.
His latest remarks follow similar warnings from recent months. Last month, he said a major financial “bubble burst” could send capital into scarce assets and push Bitcoin much higher. He also said Bitcoin could reach $750,000 within a year after such a crash.
Bitcoin sentiment turns more negative
At press time, Bitcoin traded near $66,826. Kiyosaki’s latest comments arrived as market sentiment around the asset weakened. Data from Santiment showed bearish discussion on social platforms rose to its highest level since late February.
The platform said the bullish-to-bearish comment ratio fell to 0.81, showing weaker confidence among traders. Santiment also said that extreme fear can sometimes act as a contrarian signal, with markets often moving against the crowd when negative sentiment grows too strong.
Crypto World
How Japan’s Surging Government Bond Yields Are Triggering a Global Liquidity Drain on Bitcoin
TLDR:
- Japan holds ¥390 trillion in JGBs — a 1% yield rise could trigger tens of trillions in unrealized losses.
- Japanese institutions are liquidating foreign risk assets, pulling global liquidity as capital returns home.
- Early 2026 saw $9.6 billion exit Bitcoin, with capital rotating into stablecoins amid rising rate pressure.
- Stablecoin supply near all-time highs signals sidelined capital that has yet to re-enter risk markets.
Rising Japanese government bond yields are quietly reshaping the global liquidity landscape in 2026. As yields climb, Japan’s largest domestic institutions face mounting pressure on their balance sheets.
This pressure triggers a chain of asset liquidations and capital repatriation that extends far beyond Japan’s borders.
Bitcoin, as a globally sensitive risk asset, is absorbing the consequences of this contraction. Understanding this dynamic is now essential for anyone tracking crypto market behavior.
How Rising JGB Yields Are Draining Global Liquidity
Japanese government bond yields have been rising steadily due to several converging macro forces. Policy normalization expectations from the Bank of Japan are a primary factor.
Persistent inflation and mounting fiscal expansion concerns are adding further upward pressure. Together, these forces are pulling bond prices lower across the curve.
Japan’s domestic institutions hold approximately ¥390 trillion in government bonds. Even a 1% rise in yields can produce tens of trillions of yen in unrealized losses.
Banks, insurers, and pension funds carry the heaviest exposure among domestic holders. These institutions are now being forced into difficult balance sheet decisions.
To manage growing losses, many institutions are liquidating risk assets abroad. Capital is being repatriated back to Japan at an accelerating pace.
Japan ranks among the world’s largest external investors, so these moves carry global weight. Each wave of repatriation effectively removes liquidity from international financial markets.
Data is already confirming this trend. Yen-denominated external credit has declined noticeably in recent months. This decline reflects the active withdrawal of Japanese capital from global markets. The essence of liquidity contraction is visible in these numbers, and Bitcoin is not immune to it.
Bitcoin Absorbs the Pressure as Deployed Liquidity Shrinks
Bitcoin’s sensitivity to global liquidity conditions makes it particularly vulnerable during this period. Historically, low-rate environments provided the fuel for Bitcoin’s price expansion cycles.
Rising rates reduce leverage across markets and suppress new demand from institutional participants. Japan’s climbing yields are directly contributing to this tightening dynamic.
Early 2026 data recorded approximately $9.6 billion flowing out of Bitcoin. Much of this capital rotated into stablecoins rather than leaving crypto markets entirely.
This rotation points to investors reducing risk exposure while staying positioned for re-entry. Higher rates appear to be the primary force behind this cautious capital movement.
Stablecoin supply data adds another layer to this picture. The “All Stablecoins (ERC20): Total Supply” chart has returned to near all-time highs.
This level shows that substantial capital remains parked and waiting on the sidelines. Yet this liquidity is not actively entering risk markets, reflecting a “liquidity exists but is not deployed” condition.
Analysts now argue that Bitcoin can no longer be tracked through on-chain metrics alone. Rates, foreign exchange movements, and global credit flows must be part of the analysis framework.
Japan’s rising JGB yields have become a central variable in understanding Bitcoin’s macro environment. Liquidity contraction originating in Tokyo is now a force felt across global crypto markets.
The crypto industry is confronting a paradox: an explosion in the number of tokens, paired with stagnating overall value. Industry observers say the surge in supply is outpacing the demand and usefulness of the assets, raising what one founder calls an existential challenge for the sector.
In a stream of posts on X, Michael Ippolito, co-founder of Blockworks, highlighted a stark divergence between the proliferation of tokens and the value they generate. “The average coin is only slightly higher than where it was in 2020 and down about 50% since 2021,” he wrote, underscoring how a larger token universe has not translated into commensurate gains for holders. He also noted that median token returns have fallen sharply, with most assets down roughly 80% from their peaks, suggesting gains have become concentrated in a narrow group of large-cap tokens while the broader market lags.
Ippolito argues the root cause is supply: a rapid expansion in token issuance has minted a vast number of assets even as total market capitalization remains mostly flat. “We created a ton of new assets and still total market cap is flat,” he said, warning that value dilution across a growing token pool undermines the industry’s fundamentals.
Key takeaways
- Token inflation is projected to outpace value generation, diluting investor returns as the number of assets multiplies against a relatively flat market cap.
- Prices and on-chain fundamentals have diverged since 2021, with on-chain revenue lifting only modestly while token prices fail to follow.
- Public commentary from prominent investors echoes concern that token issuance dynamics threaten broader ecosystem credibility and long-term relevance.
- Capital allocation appears to be shifting away from newly issued tokens toward publicly listed crypto firms, with the majority of token launches trading below their generation event prices.
Token prices break from fundamentals
Beyond the expansion of assets, observers note a weakening link between on-chain activity and market prices. In 2021, token valuations tended to track protocol revenues and usage. More recently, even as some networks have reported renewed revenue generation, prices have not mirrored that momentum. This decoupling, according to Ippolito, signals waning investor confidence in tokens as reliable vehicles for capturing value.
Arthur Cheong, founder and CEO of DeFiance Capital, echoed the sentiment, urging the industry to address the token conundrum. In a post on X, Cheong argued that if the market remains concentrated around a small handful of assets like Bitcoin and Ether, the broader ecosystem risks losing relevance. The sense of urgency around realigning token economics with price remains a recurring theme among influential investors.
Capital shifts from tokens to stocks
New research adds a practical dimension to the conversation: capital is rotating away from fresh token launches and toward publicly listed crypto companies. A February report from DWF Labs found that over 80% of token projects traded below their token generation event (TGE) price, with typical losses ranging from 50% to 70% within roughly three months. The study details a pattern where peaks occur within the first month after launch, followed by sustained selling pressure and overhang from airdrops and early investor unlocks that depress subsequent price action.
Andrei Grachev of DWF Labs framed the finding as structural rather than cyclical, suggesting that the dynamics of token issuance—especially post-launch unlocks—continue to weigh on price trajectories even for projects with active products or protocols.
Broader implications for the market
Taken together, the observations point to a market that must reconcile a rapidly expanding asset universe with a comparatively stable or shrinking value base. If the industry cannot restore alignment between token fundamentals and price, the appeal of tokens as value-bearing instruments could wane, risking broader adoption and investment interest. The conversation is reframing token issuance practices, with voices in the ecosystem calling for tighter economics, improved utility, and more disciplined distribution models to prevent perpetual dilution.
As the debate unfolds, market participants will be watching several key developments: whether new tokens adopt more conservative supply schedules or unique value accrual mechanisms, how regulators and auditors respond to proliferation and complex unlock patterns, and whether investors increasingly favor tokenized representations tied to real-world use cases or established crypto firms over speculative launches.
For readers seeking direction, the coming quarters will reveal whether the industry can re-anchor token prices to tangible fundamentals or whether concentration in a few dominant assets will persist, leaving many projects competing for marginal gains in a crowded field.
Watch next for how token issuers adapt to this critique, whether capital rotates further toward crypto-listed equities or continues to seek merit across the broader asset class, and what, if any, policy or market-driven reforms emerge to restore alignment between innovation and value.
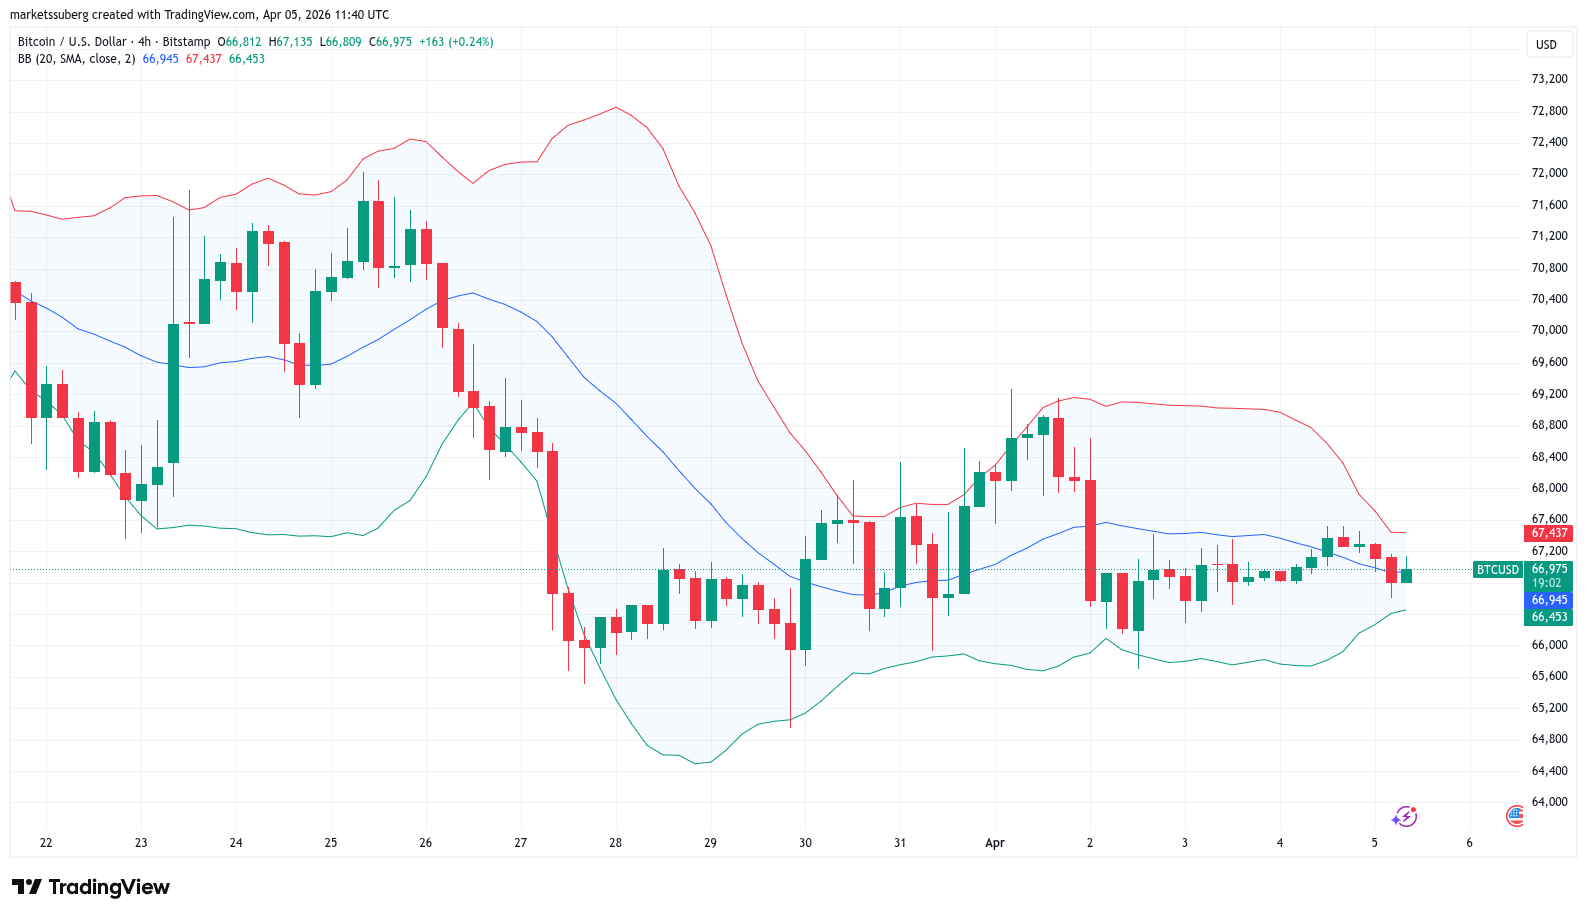
Bitcoin added downside BTC price warnings as Binance order-book data showed multiple investor classes selling coins into the weekend.
Bitcoin (BTC) circled $67,000 on Sunday as traders warned of hidden BTC price weakness.
Key points:
-
Bitcoin Bollinger Bands demand a volatile BTC price breakout after a slow weekend.
-
A trader predicts a move lower thanks to weak support and exposed downside wicks.
-
Sideways price action comes as sellers step up into the end of the week.
Bitcoin trader waits for sweep of sub-$60,000 lows
Data from TradingView showed volatility cooling over the weekend, with BTC/USD acting within an increasingly narrow range.
On four-hour time frames, the Bollinger Bands volatility indicator constricted — a classic signal that a sharp move up or down was due.

In their latest analysis, pseudonymous trader LP bet on bears winning the battle.
“Looking back at previous cycles, bottoms were formed after multiple sweeps of the lows, forcing capitulation before a reversal,” a post on X read.
“In contrast, this cycle has been doing the opposite, consistently sweeping the highs, making it difficult to enter short positions while leaving the lows exposed and building liquidity below.”

LP said that sweeping local lows, including February’s wick below $60,000, was “likely just a matter of time.”
“When that breakdown eventually happens, watch the behavior closely. If price starts repeatedly sweeping the lows, making it psychologically difficult to enter longs, that’s when a true bottom is more likely forming,” they concluded.
Whales “buying dips and selling rips” on BTC
Continuing, Keith Alan, cofounder of trading resource Material Indicators, flagged unusual selling activity despite flat BTC price action.
Related: Bitcoin ‘done’ with 85% crashes, says Cathie Wood amid new $34K target
Uploading a chart of Binance order-book liquidity and volume by investor class, Alan highlighted a bot using time-weighted average price (TWAP) to distribute BTC on Friday.
“The vertical orange line represents the smallest order class with a TWAP bot selling $18M in an hour,” he explained.
“That’s exponentially more than their normal $3M-$5M daily volume in 1 hr. That ain’t retail!”

Whales, Alan added, were “buying dips and selling rips” with Bitcoin still trapped in a range.
Earlier, Cointelegraph reported on further threats to Bitcoin bulls, including resurgent US dollar strength.
This article is produced in accordance with Cointelegraph’s Editorial Policy and is intended for informational purposes only. It does not constitute investment advice or recommendations. All investments and trades carry risk; readers are encouraged to conduct independent research before making any decisions. Cointelegraph makes no guarantees regarding the accuracy or completeness of the information presented, including forward-looking statements, and will not be liable for any loss or damage arising from reliance on this content.

Bitcoin (BTC) traded near $66,749 at press time, while market activity stayed muted across major digital assets.
Summary
- Bitcoin traded near $66,749 as low volatility and weak liquidity kept traders watching for moves.
- Analyst Michaël van de Poppe said Bitcoin may sweep liquidity before a fast recovery upward.
- EGRAG CRYPTO said past Bitcoin cycle bottoms often reached the 1.618 Fibonacci zone before rebounding.
The asset was down slightly in the past 24 hours, while seven-day gains stood at 0.81%. Daily trading volume reached $19.67 billion.
That price action came during a period of weak movement in the market. Analysts tracked a narrow range in Bitcoin and pointed to low activity across the wider crypto sector. Altcoins also showed soft volume and thinner liquidity during the same period.
Analysts track a possible end to the squeeze
Crypto analyst Michaël van de Poppe said volatility on Bitcoin’s four-hour chart had dropped to its lowest level since the broader breakdown. He said the market was nearing the end of a volatility squeeze that usually does not last much longer under similar conditions.
Van de Poppe also said altcoins showed the same pattern, with low volatility, low volume, and low liquidity. Despite the geopolitical backdrop, he wrote that he would not expect a much deeper move lower and instead saw a possible liquidity sweep followed by a quick recovery, “most likely during next week already.”
Crypto market commentator EGRAG CRYPTO pointed to longer-term chart structure. He said past Bitcoin cycle bottoms repeatedly reached the 1.618 Fibonacci level before the market formed a base.
He described that level as an area where fear often peaks and accumulation starts. The post framed that view as a structure-based reading rather than a reaction to short-term headlines. The account also urged traders to focus on charts and numbers instead of outside narratives.
At the same time, traders watched new posts from The Kobeissi Letter about comments attributed to Donald Trump on Iran and the Strait of Hormuz.

The account also said Trump planned a news conference with the US military at 1 PM ET on Monday. Those headlines added another layer of caution for crypto traders.
Rich Dad Poor Dad author Robert Kiyosaki has argued that the economic shifts set in motion more than five decades ago are now unfolding, advocating for Bitcoin and gold while warning against rising debt, inflation and retirement risks.
In a Saturday post on X, Kiyosaki pointed to 1974 as a turning point that reshaped both money and retirement systems. He argued that the United States’ move toward a petrodollar framework, alongside policy changes affecting pensions, laid the foundation for today’s financial pressures.
“The future created in 1974 has arrived,” Kiyosaki wrote, linking current inflation and geopolitical tensions around energy to the dollar’s evolution after the end of the gold standard era. He also mentioned the passage of the Employee Retirement Income Security Act, which introduced new rules for pension plans and coincided with a broader shift toward market-based retirement savings.
According to Kiyosaki, that transition replaced guaranteed lifetime income for many workers with systems such as 401(k)s and similar accounts, placing more risk on individuals. “Millions of baby-boomers will soon find out they have no income once they stop working,” he warned.
Related: Rich Bitcoin traders lost $337M daily in first quarter of 2026
Kiyosaki supports Bitcoin, gold as “real money”
Kiyosaki reiterated his long-standing view that individuals should focus on financial education and consider alternative stores of value. He said he continues to favor assets such as gold, silver and Bitcoin, which he describes as “real money.”

Last month, Kiyosaki warned that a major financial “bubble burst” could be approaching, arguing that such a crisis may trigger a sharp rally in scarce assets like Bitcoin (BTC). He suggested Bitcoin could reach $750,000 within a year of the crash.
His view is tied to the expansion of global money supply, which historically has driven demand for limited assets. During the 2020–2021 period, rising liquidity coincided with strong gains in stocks and real estate. Kiyosaki expects a similar dynamic after a downturn, also forecasting that gold could surge significantly.
Related: ‘Rich Dad, Poor Dad’ author says ‘pin is near’ on TradFi ‘bubble burst:’ Predicts $750K Bitcoin
Bitcoin bearish sentiment spikes
Meanwhile, bearish sentiment around Bitcoin has climbed to its highest level since late February, according to data from crypto analytics platform Santiment. The ratio of bullish to bearish comments across major social platforms has dropped to 0.81, reflecting a noticeable lack of optimism among market participants.
Despite the negative tone, Santiment suggested this could be a contrarian signal. Historically, markets tend to move against crowd expectations, meaning elevated fear and uncertainty may precede a price recovery.
Magazine: Bitcoin 85% crashes ‘done,’ CLARITY Act speculation mounts: Hodler’s Digest, Mar. 29 – April 4

5 dead games I still can’t stop thinking about

What Is ‘Sudoku Packing’? The Best Packing Hack For Overpackers.

VICI Properties: Strong Buy With Rich Yields & Promising Upside Story (NYSE:VICI)


-

 NewsBeat3 days ago
Steven Gerrard disagrees with Gary Neville over ‘shock’ Chelsea and Arsenal claim | Football
-

 Business3 days ago
No Jackpot Winner and $194 Million Prize Rolls Over
-

 Fashion2 days ago
Weekend Open Thread: Spanx – Corporette.com
-
Entertainment6 days ago
Fans slam 'heartbreaking' Barbie Dream Fest convention debacle with 'cardboard cutout' experience
-

 Crypto World4 days ago
Gold Price Prediction: Worst Month in 17 Years fo Save Haven Rock
-

 Tech6 days ago
The Pixel 10a doesn’t have a camera bump, and it’s great
-
Crypto World5 days ago
Dems press CFTC, ethics board on prediction-market insider trades
-

 Tech6 days ago
Avatar Legends: The Fighting Game comes out in July and it looks pretty slick
-

 Business3 days ago
Login and Checkout Issues Spark Merchant Frustration
-

 Sports17 hours ago
India men’s 4x400m and mixed 4x100m relay teams register big progress | Other Sports News
-

 Tech6 days ago
Apple will hide your email address from apps and websites, but not cops
-

 Sports5 days ago
Tallest college basketball player ever, standing at 7-foot-9, entering transfer portal
-

 Tech5 days ago
EE TV is using AI to help you find something to watch
-

 Politics6 days ago
Should Trump Be Scared Strait?
-

 Tech5 days ago
Flipsnack and the shift toward motion-first business content with living visuals
-

 Fashion6 days ago
The Best Spring Trends of 2026
-

 Tech5 days ago
How to back up your iPhone & iPad to your Mac before something goes wrong
-

 Sports6 days ago
Women’s hockey camp eyes fitness boost, tactics ahead of WC 2026 campaign | Other Sports News
-
Crypto World7 days ago
Bitcoin’s Six-Month Losing Streak: What On-Chain Data Says About the Market’s Next Move
-

 Politics6 days ago
BBC slammed for ignoring author of The Fraud
You must be logged in to post a comment Login