
Crypto World
HBAR Price Recovery Stalls Below $0.10: What’s Holding It Back?
Hedera’s native token, HBAR, is attempting to regain lost ground after weeks of constrained trading. The price recently approached the $0.10 threshold but failed to secure a decisive breakout. Since the beginning of the month, resistance near this level has limited upward progress.
While HBAR briefly reclaimed $0.10, momentum stalled just below a key technical barrier. Traders have adjusted their positioning, though not decisively in favor of sustained upside.
HBAR Holders Are Buying
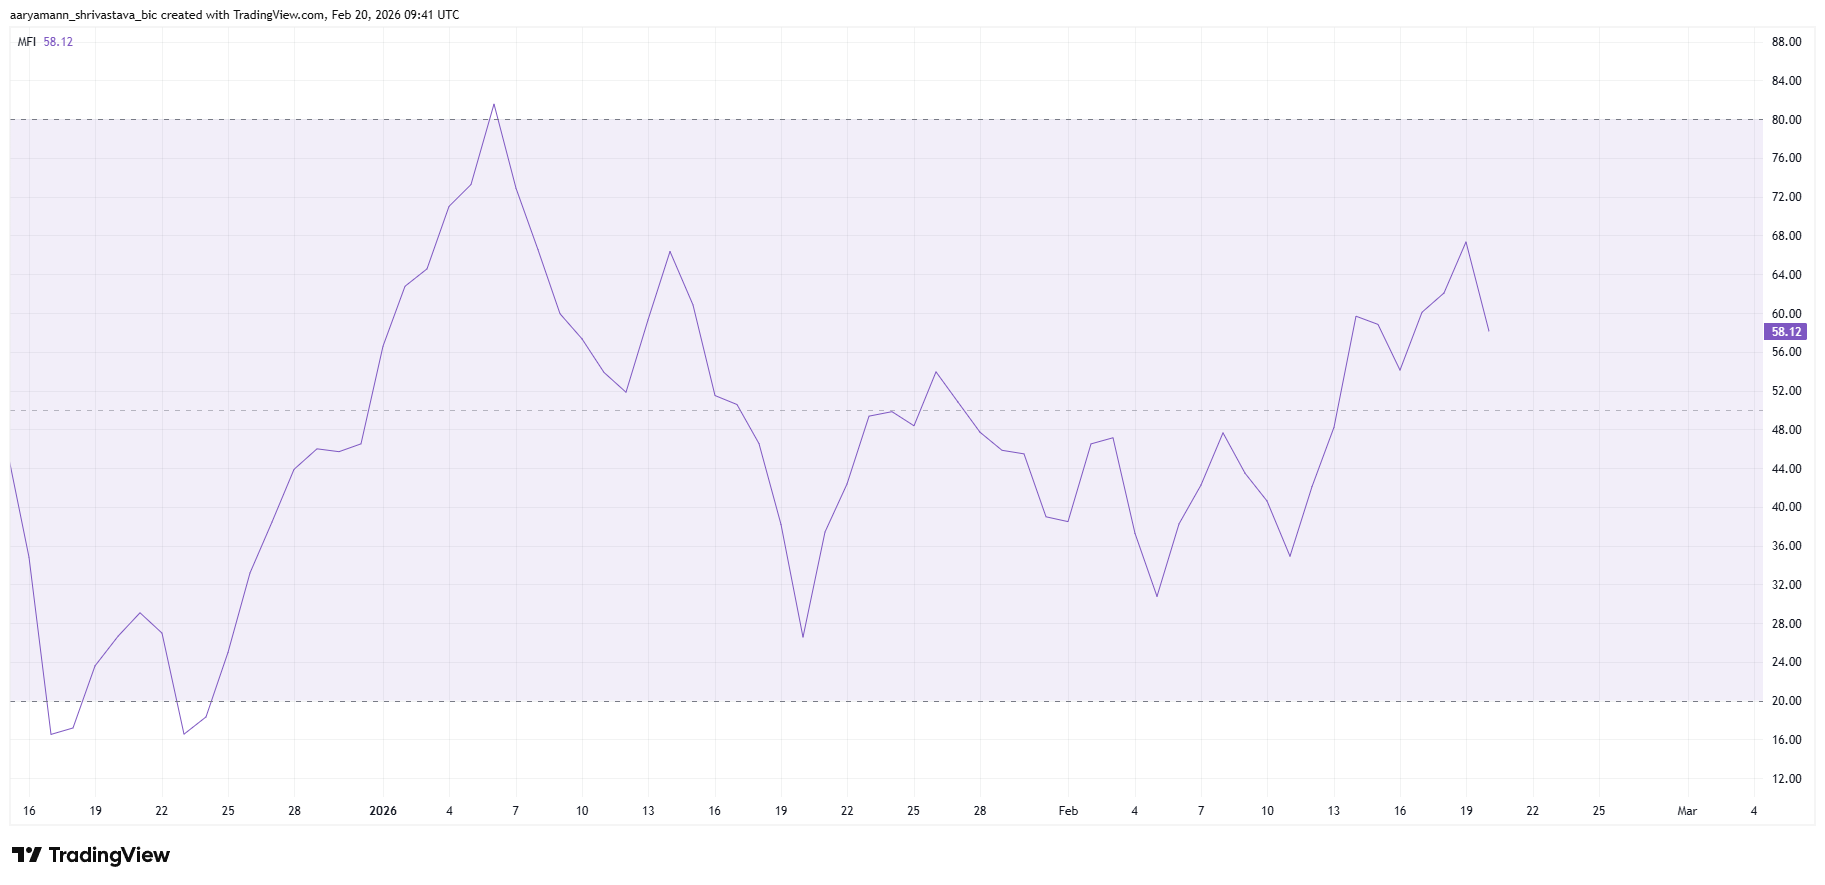
The Money Flow Index, or MFI, indicates that buying pressure is gradually building on HBAR. This volume-weighted momentum indicator measures capital inflows and outflows based on both price and trading volume. Currently, the MFI is positioned above the neutral 50 mark, signaling that buyers are regaining influence.
An MFI reading in positive territory suggests accumulation may be underway. Rising inflows often precede price appreciation, especially when supported by higher trading activity. If this trend continues, HBAR could benefit from sustained accumulation, strengthening the case for a recovery attempt above immediate resistance levels.
Want more token insights like this? Sign up for Editor Harsh Notariya’s Daily Crypto Newsletter here.

Hedera Traders Remain Skeptical
Broader derivatives data offer a mixed but slightly constructive outlook. HBAR’s funding rate is currently skewed toward long positions, indicating that traders are willing to pay a premium to hold bullish contracts. Positive funding rates typically reflect expectations of upward price movement.
However, volatility in the funding rate over the past two weeks highlights lingering uncertainty. Between February 6 and February 11, short contracts dominated open interest, placing downward pressure on HBAR. This dominance quickly reversed, turned positive, and then shifted negative again.
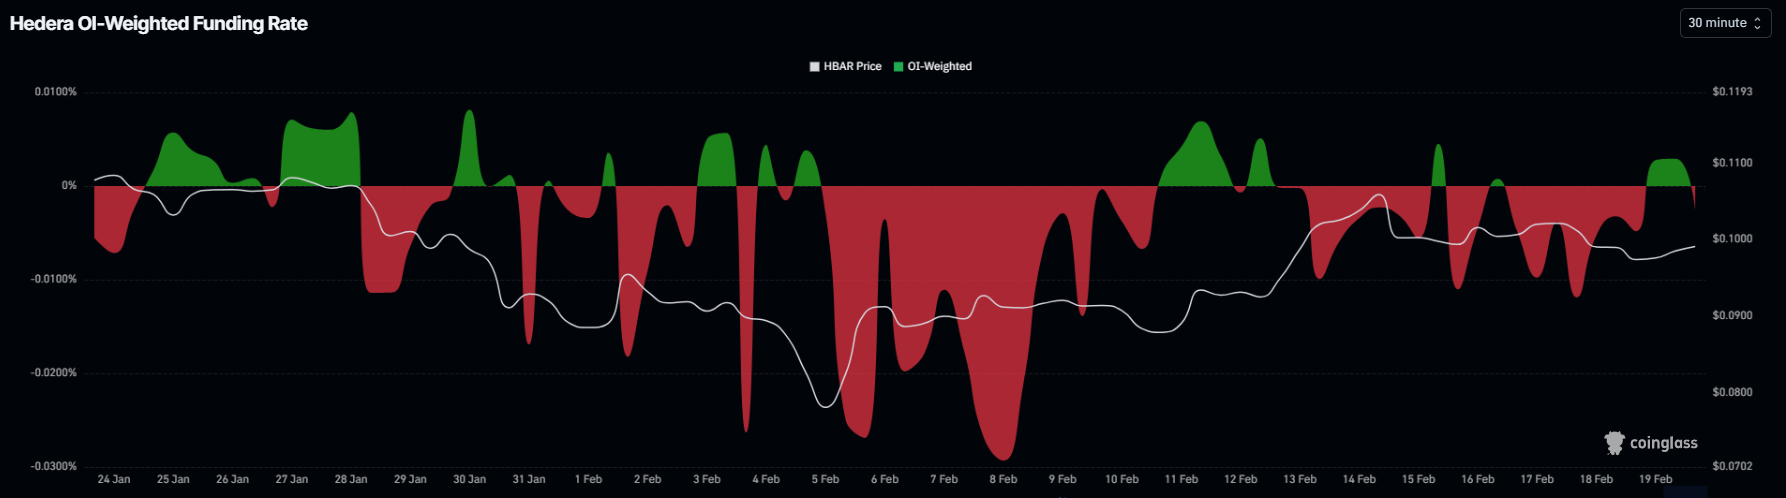
Such fluctuations reveal hesitation among leveraged traders. Although short dominance has declined recently, conviction remains fragile. Stable positive funding would strengthen the bullish thesis, but current data suggests sentiment is still reactive to short-term price swings rather than anchored in long-term confidence.
HBAR Price Aims High
HBAR is trading at $0.0992 at the time of writing. The token remains above the $0.0961 support level, which aligns with the 38.2% Fibonacci retracement. Holding this level is technically significant, as it represents a key inflection point for trend continuation.
However, resistance at $0.1035, at the 50% Fibonacci retracement, is capping upward movement and limiting breakout attempts.
A decisive move above $0.1035 would signal a short-term structural shift. Turning this resistance into support could attract fresh demand, particularly if buying pressure continues to rise.
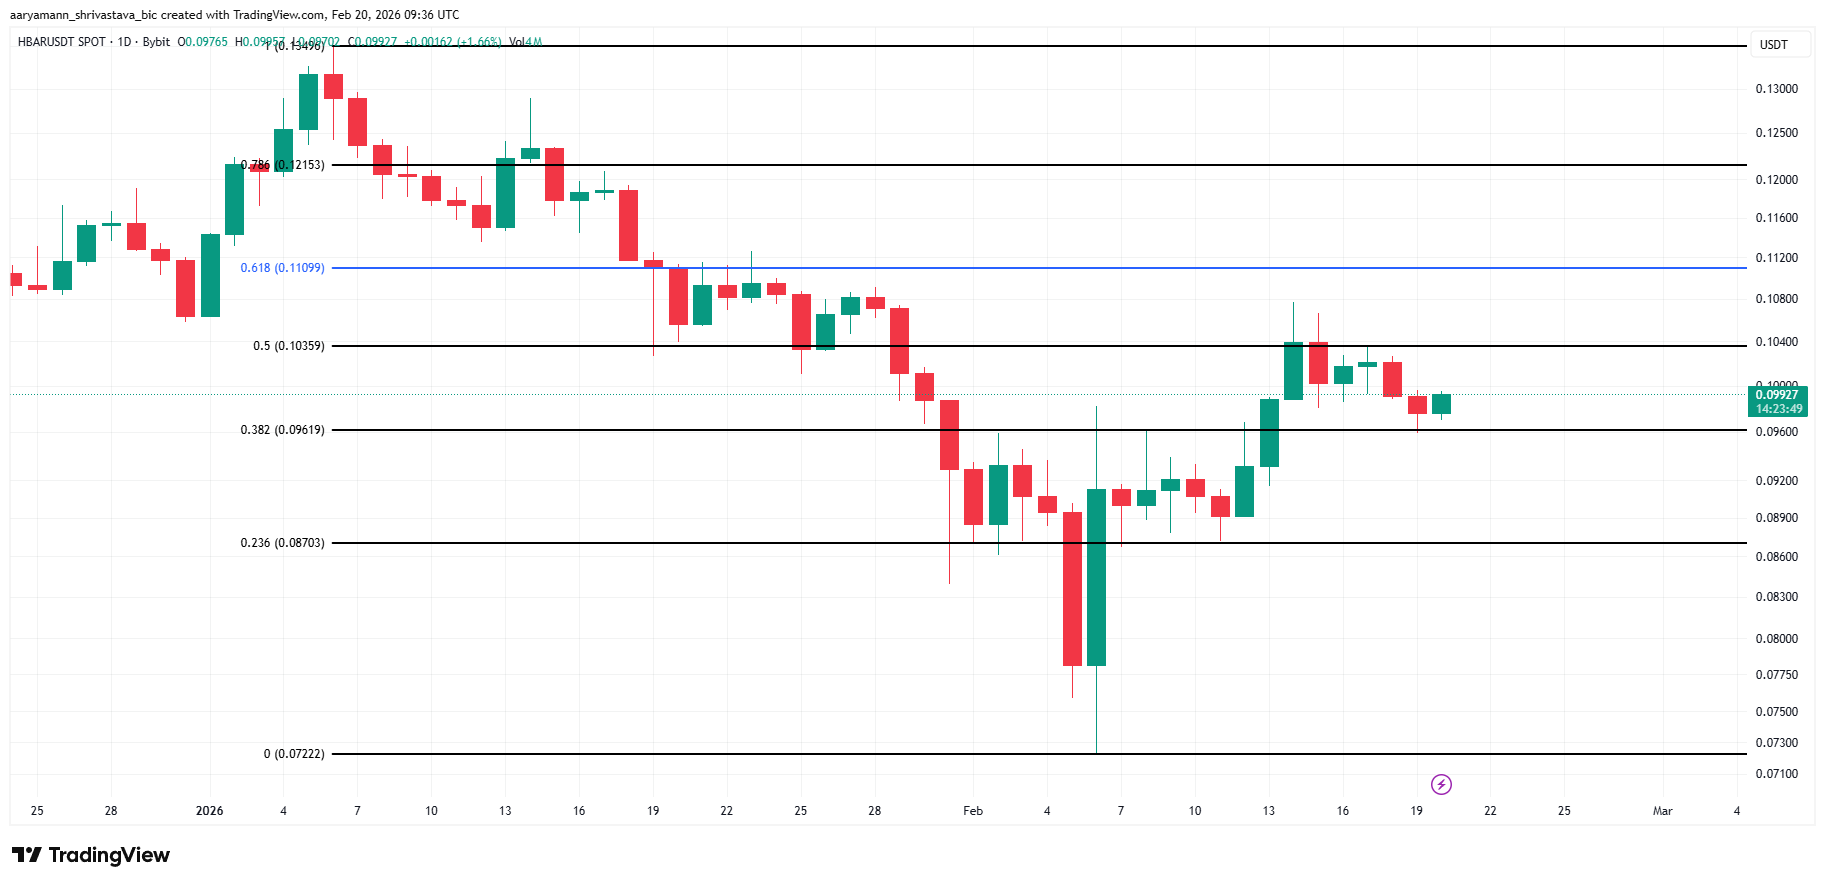
The next target would stand at $0.1109, corresponding to the 61.8% Fibonacci retracement. This level is widely monitored by traders and often acts as a strong support zone once reclaimed.
However, if bullish indicators fail to strengthen, consolidation may persist near current levels. Continued outflows would weaken breakout attempts and reinforce resistance at $0.1035.
A breakdown below the $0.0961 support would shift the short-term structure bearish. In that scenario, HBAR could decline toward $0.0870, invalidating the immediate recovery outlook and restoring stronger control to sellers.


AI launchpad Clanker’s new ecosystem fund will recycle most protocol fees on Base into CLANKER buybacks, grants, and infra for Farcaster’s creator community.
Summary
- AI launchpad Clanker, now owned by Neynar via its acquisition of Farcaster, has launched the Clanker Ecosystem Fund to recycle protocol fees back into builders.
- The fund has already deployed $8 million to buy 14% of the CLANKER supply, with future fees earmarked for infrastructure and community initiatives across Clanker and Farcaster.
- Clanker has generated over $50 million in cumulative protocol fees on Base since late 2024, cementing it as one of the highest‑earning SocialFi primitives.
AI‑driven token launchpad Clanker has unveiled the Clanker Ecosystem Fund (CEF), committing to redirect a significant share of protocol fees to creators, infrastructure teams and communities building on Clanker and Farcaster. Neynar, which is acquiring decentralized social protocol Farcaster and its associated assets, now controls Clanker’s contracts and treasury, with Farcaster co‑founder Dan Romero saying the package “adds even stronger commercial returns” thanks to Clanker’s fee machine on Base. Operated as an autonomous AI launchpad on Coinbase’s Base network, Clanker has already generated more than $50 million in cumulative protocol fees since its late‑2024 launch, according to KuCoin and BingX research.
In its latest update, Farcaster disclosed that “$8 million has already been used to purchase 14% of CLANKER,” effectively converting a chunk of past protocol fees into long‑term exposure to the launchpad’s native asset and its community. That build on earlier commitments laid out when Farcaster first acquired Clanker in October 2025, where the team pledged that “two‑thirds (2/3) of the current and future fees in the Clanker ecosystem will be allocated to purchase and redeem tokens $CLANKER,” while around 7% of supply was locked in one‑sided liquidity to deepen markets.
Farcaster summarized the model on X by noting that Clanker had already used “two‑thirds of the protocol fees generated in the previous day to purchase approximately $65,000 worth of CLANKER tokens,” with the remaining third held in USDC for tax obligations, and said the buyback process would be automated over time. According to KuCoin’s coverage of the protocol, Clanker’s fee engine is powered by a 1% transaction fee on tokens it deploys, with 40% of that going to token creators and 60% to the protocol—funds that CEF will now recycle into grants, infrastructure and additional buybacks.
Clanker runs as an AI agent embedded in the Farcaster social graph, allowing users to mint and list ERC‑20 tokens on Uniswap V3 simply by tagging the bot in a cast, which then handles minting, WETH pairing and LP token locking until 2100. KuCoin and BingX both highlight that this model has turned Clanker into a “yield‑generating machine for the Base network,” with weekly protocol fees recently surpassing $8 million on record weeks and daily token launches pushing toward 13,000.
As Neynar absorbs Farcaster’s infrastructure and Clanker’s revenue stream, analysts at outlets such as Bankless argue the deal effectively makes Neynar a core economic node for Base‑native SocialFi, even as Merkle Manufactory returns roughly $180 million in raised capital to investors. Within that context, CEF’s decision to route tens of millions of dollars in protocol cash flow back into creators and infra looks less like a marketing stunt and more like an attempt to hard‑wire “real yield” and long‑term loyalty into one of Base’s most profitable—and most copy‑pasted—AI launchpad designs.
President Trump’s April 1 address on the Iran war promised two to three more weeks of intense military strikes, reversing a two-day stock market relief rally and sending oil above $110 per barrel.
The speech divided US stocks into clear winners and losers. BeInCrypto analysts identified three stocks where the impact was most visible. The list includes one energy name riding the war premium higher.
The list also has two oil-dependent companies whose recoveries were cut short within hours. The selection is based on price reaction, chart structure, and the degree to which each business model directly connects to sustained oil prices.
APA Corporation (NASDAQ: APA)
APA Corporation (APA) is among the US stocks that have benefited most directly from the Iran conflict. As a pure-play oil and gas exploration and production (E&P) company, every dollar increase in crude flows almost directly to APA’s bottom line.
Trump’s pledge to continue strikes and his threat to target Iran’s energy infrastructure signal sustained supply disruption, which supports elevated crude prices for the foreseeable future.
The daily chart shows that APA has rallied approximately 96% since early January, forming a clear pole-and-bull-flag pattern. Since March 30, prices have consolidated inside a flag.
Chaikin Money Flow (CMF), a proxy for institutional buying and selling pressure, has been consistently making higher highs throughout the rally, currently reading 0.18.
That persistent institutional inflow confirms that big money is backing the move rather than fading it.

On April 2, APA’s share price peaked at $43.93 but failed to break the upper trendline of the flag. A clean close above $43.98 would confirm the breakout and target $49.80 initially, followed by $55.63 and $65.06 on the extended projection.
However, a break below $40.38 would end the flag prematurely, though a full invalidation of the bullish structure would require a move below $31.56.
Carnival Corporation (NYSE: CCL)
Carnival Corporation (CCL) sits on the opposite end of the oil price chain. As the world’s largest cruise operator, fuel represents one of its highest variable costs.
Rising oil compresses margins directly, while sustained geopolitical uncertainty dampens consumer willingness to book voyages, creating a double headwind that few sectors absorb as severely.
Since peaking at $34.05 on February 6, Carnival stock has been trading inside a bearish descending channel on the daily chart. It fell approximately 10% over the past month as oil prices climbed.
A bullish divergence had been forming from mid-November to late March, in which the price made a lower low while the Relative Strength Index (RSI), a momentum oscillator, made a higher low.
That divergence suggested weakening sell-side momentum and triggered a bounce as de-escalation hopes lifted markets earlier in the week.
Trump’s speech reversed the setup. The bounce stalled, and prices fell 3.54% on April 2 as the two-to-three-week war extension reignited fears of prolonged $110 oil.
The bullish divergence technically remains intact, meaning a recovery is still possible if de-escalation resurfaces. However, the path of least resistance points lower as long as oil stays elevated.
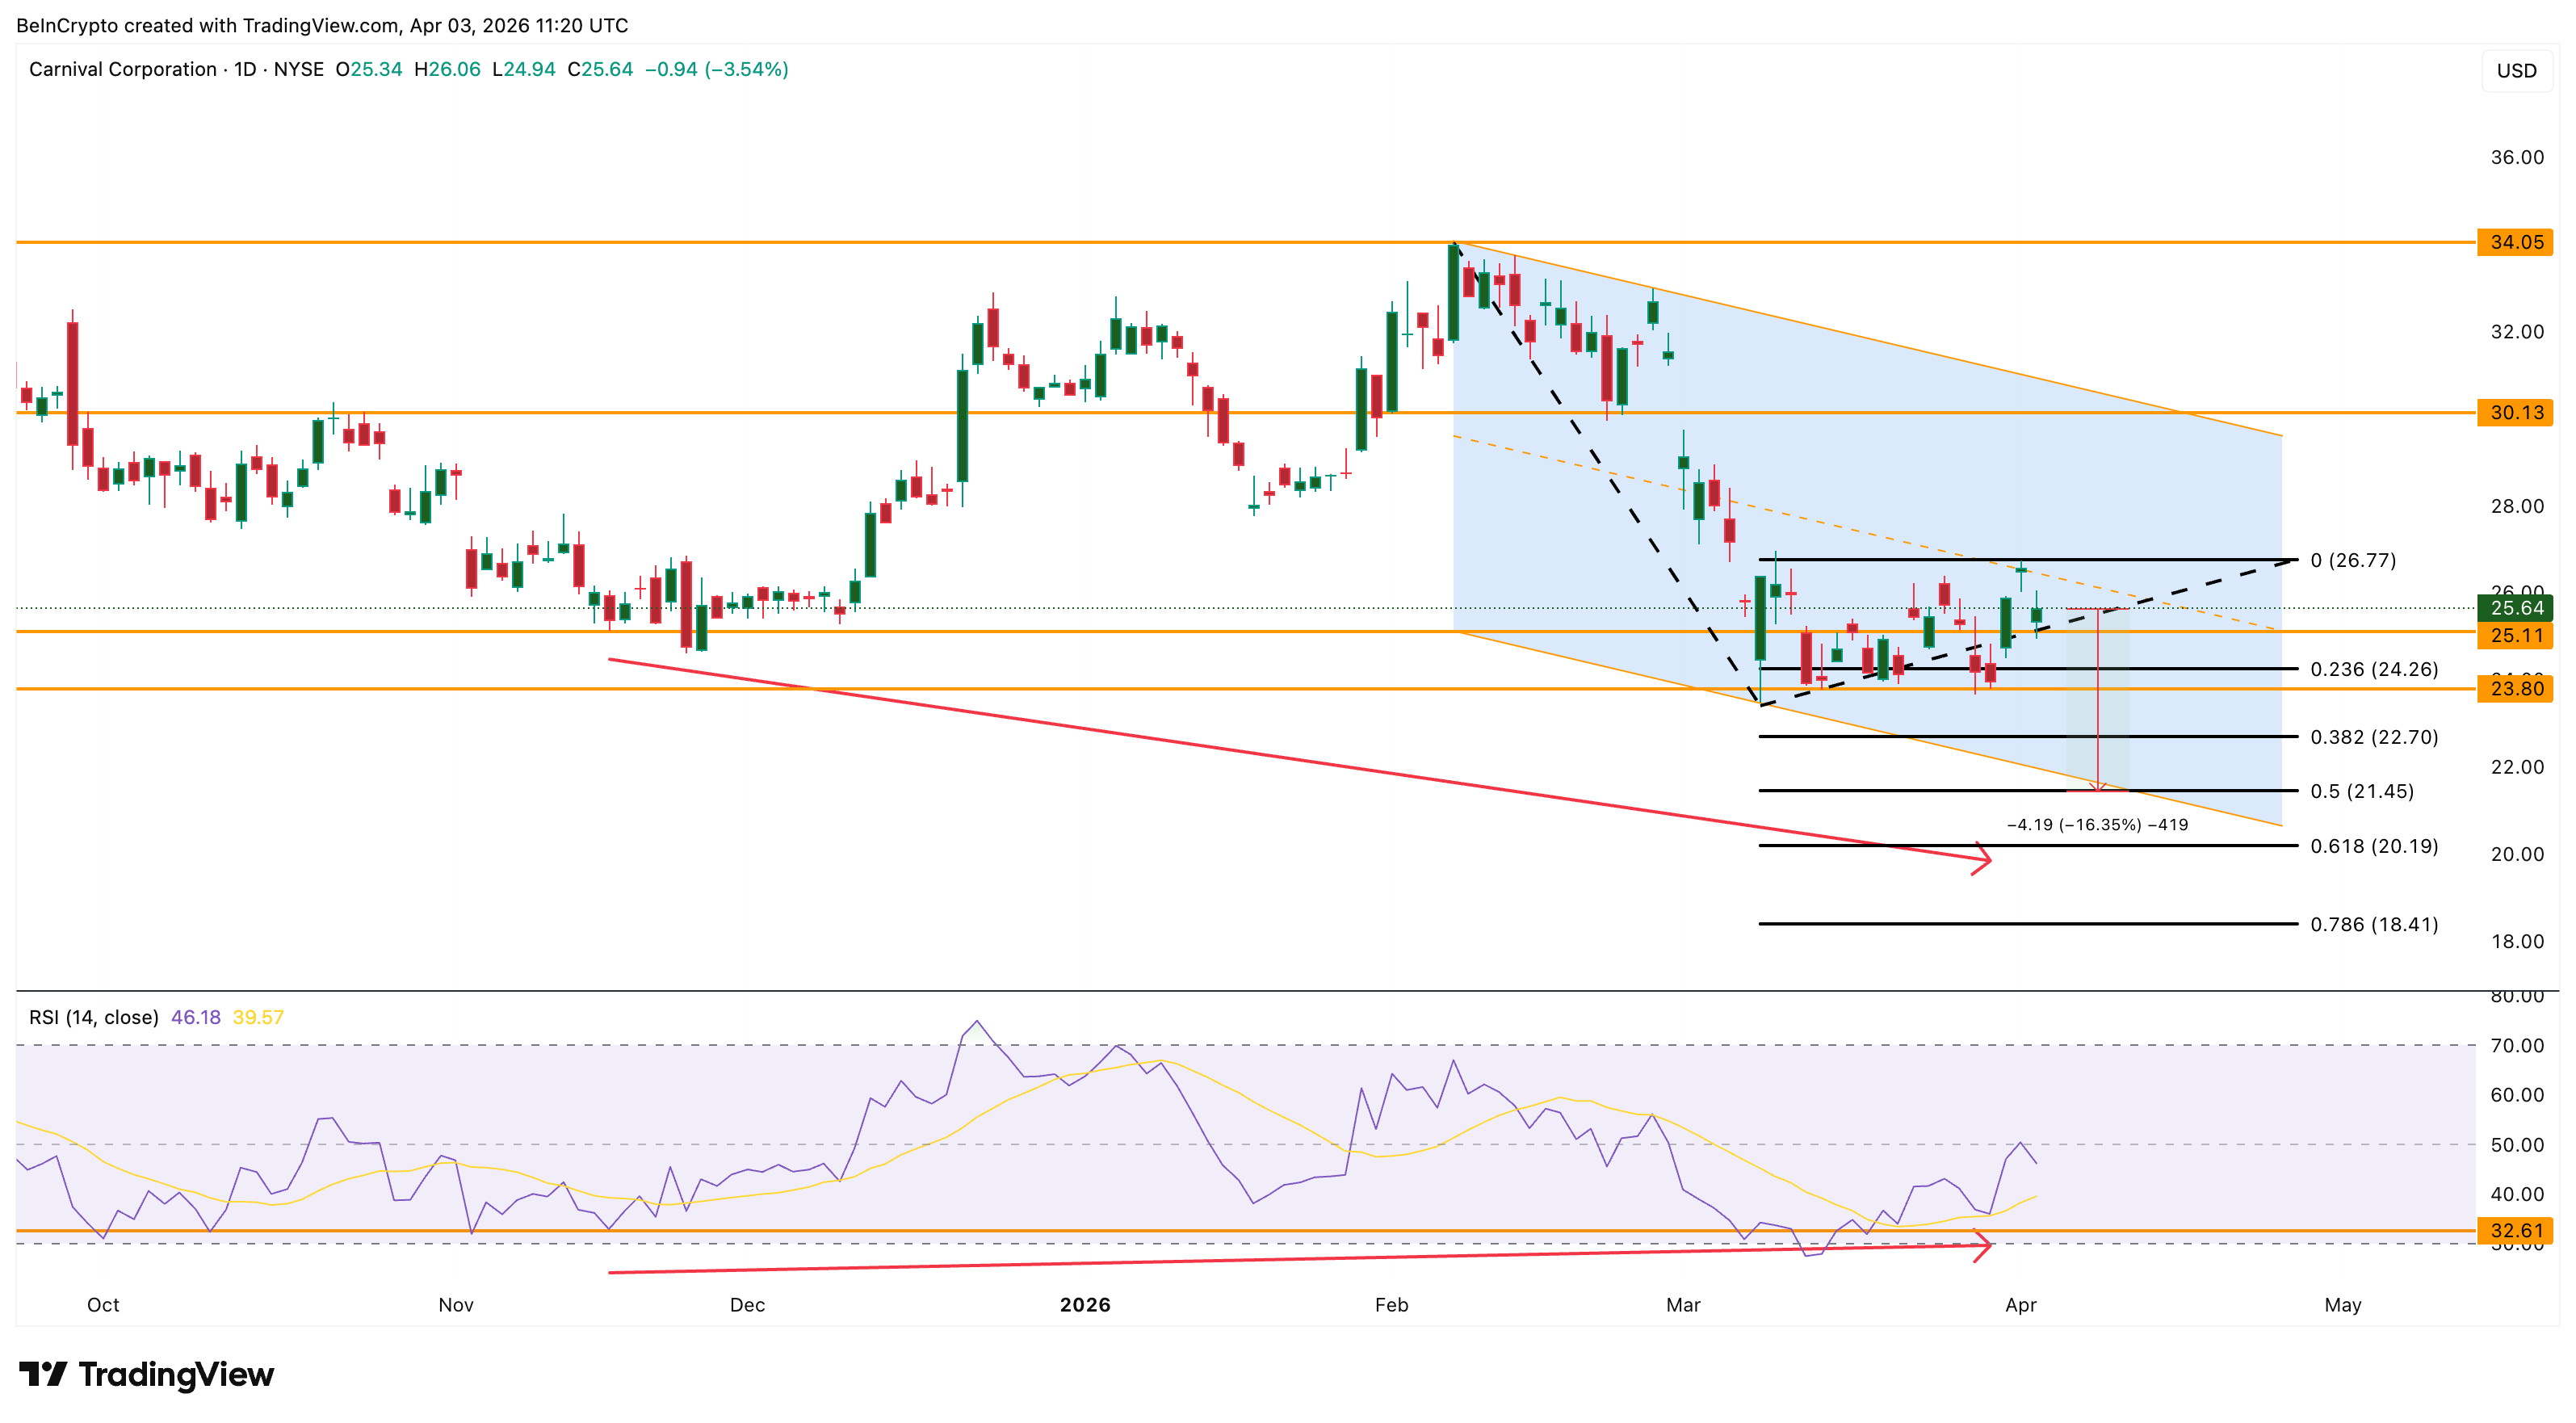
A move above $26.77 would begin to shift momentum, with $30.13 as the level that turns the structure neutral. On the downside, $23.80 acts as immediate support.
A break below $21.45 would confirm a pattern breakdown and open the path toward $20.19 and $18.41.
United Airlines Holdings (NASDAQ: UAL)
United Airlines Holdings (UAL) experienced perhaps the most dramatic whiplash among US stocks this week. Jet fuel typically accounts for 25-35% of an airline’s operating expenses, making airline stocks among the most oil-sensitive equities in the market.
When oil rises, margins compress immediately because airlines cannot pass fuel costs to passengers fast enough through surcharges.
Between March 27 and April 1, UAL’s share price surged 14%. De-escalation hopes pushed oil lower and lifted the entire travel sector. That rally brought the price back above the 20-day Exponential Moving Average (EMA), a short-term trend indicator that gives greater weight to recent price action, at $93.71.
Trump’s speech erased the recovery. UAL fell approximately 8% from its April 1 high, closing at $92.21 on April 2, a 3% daily loss. The drop pushed the stock back below the 20-day EMA, which matters because the last time UAL reclaimed it on February 3, it preceded a 9% rally. Losing it now removes that short-term floor.
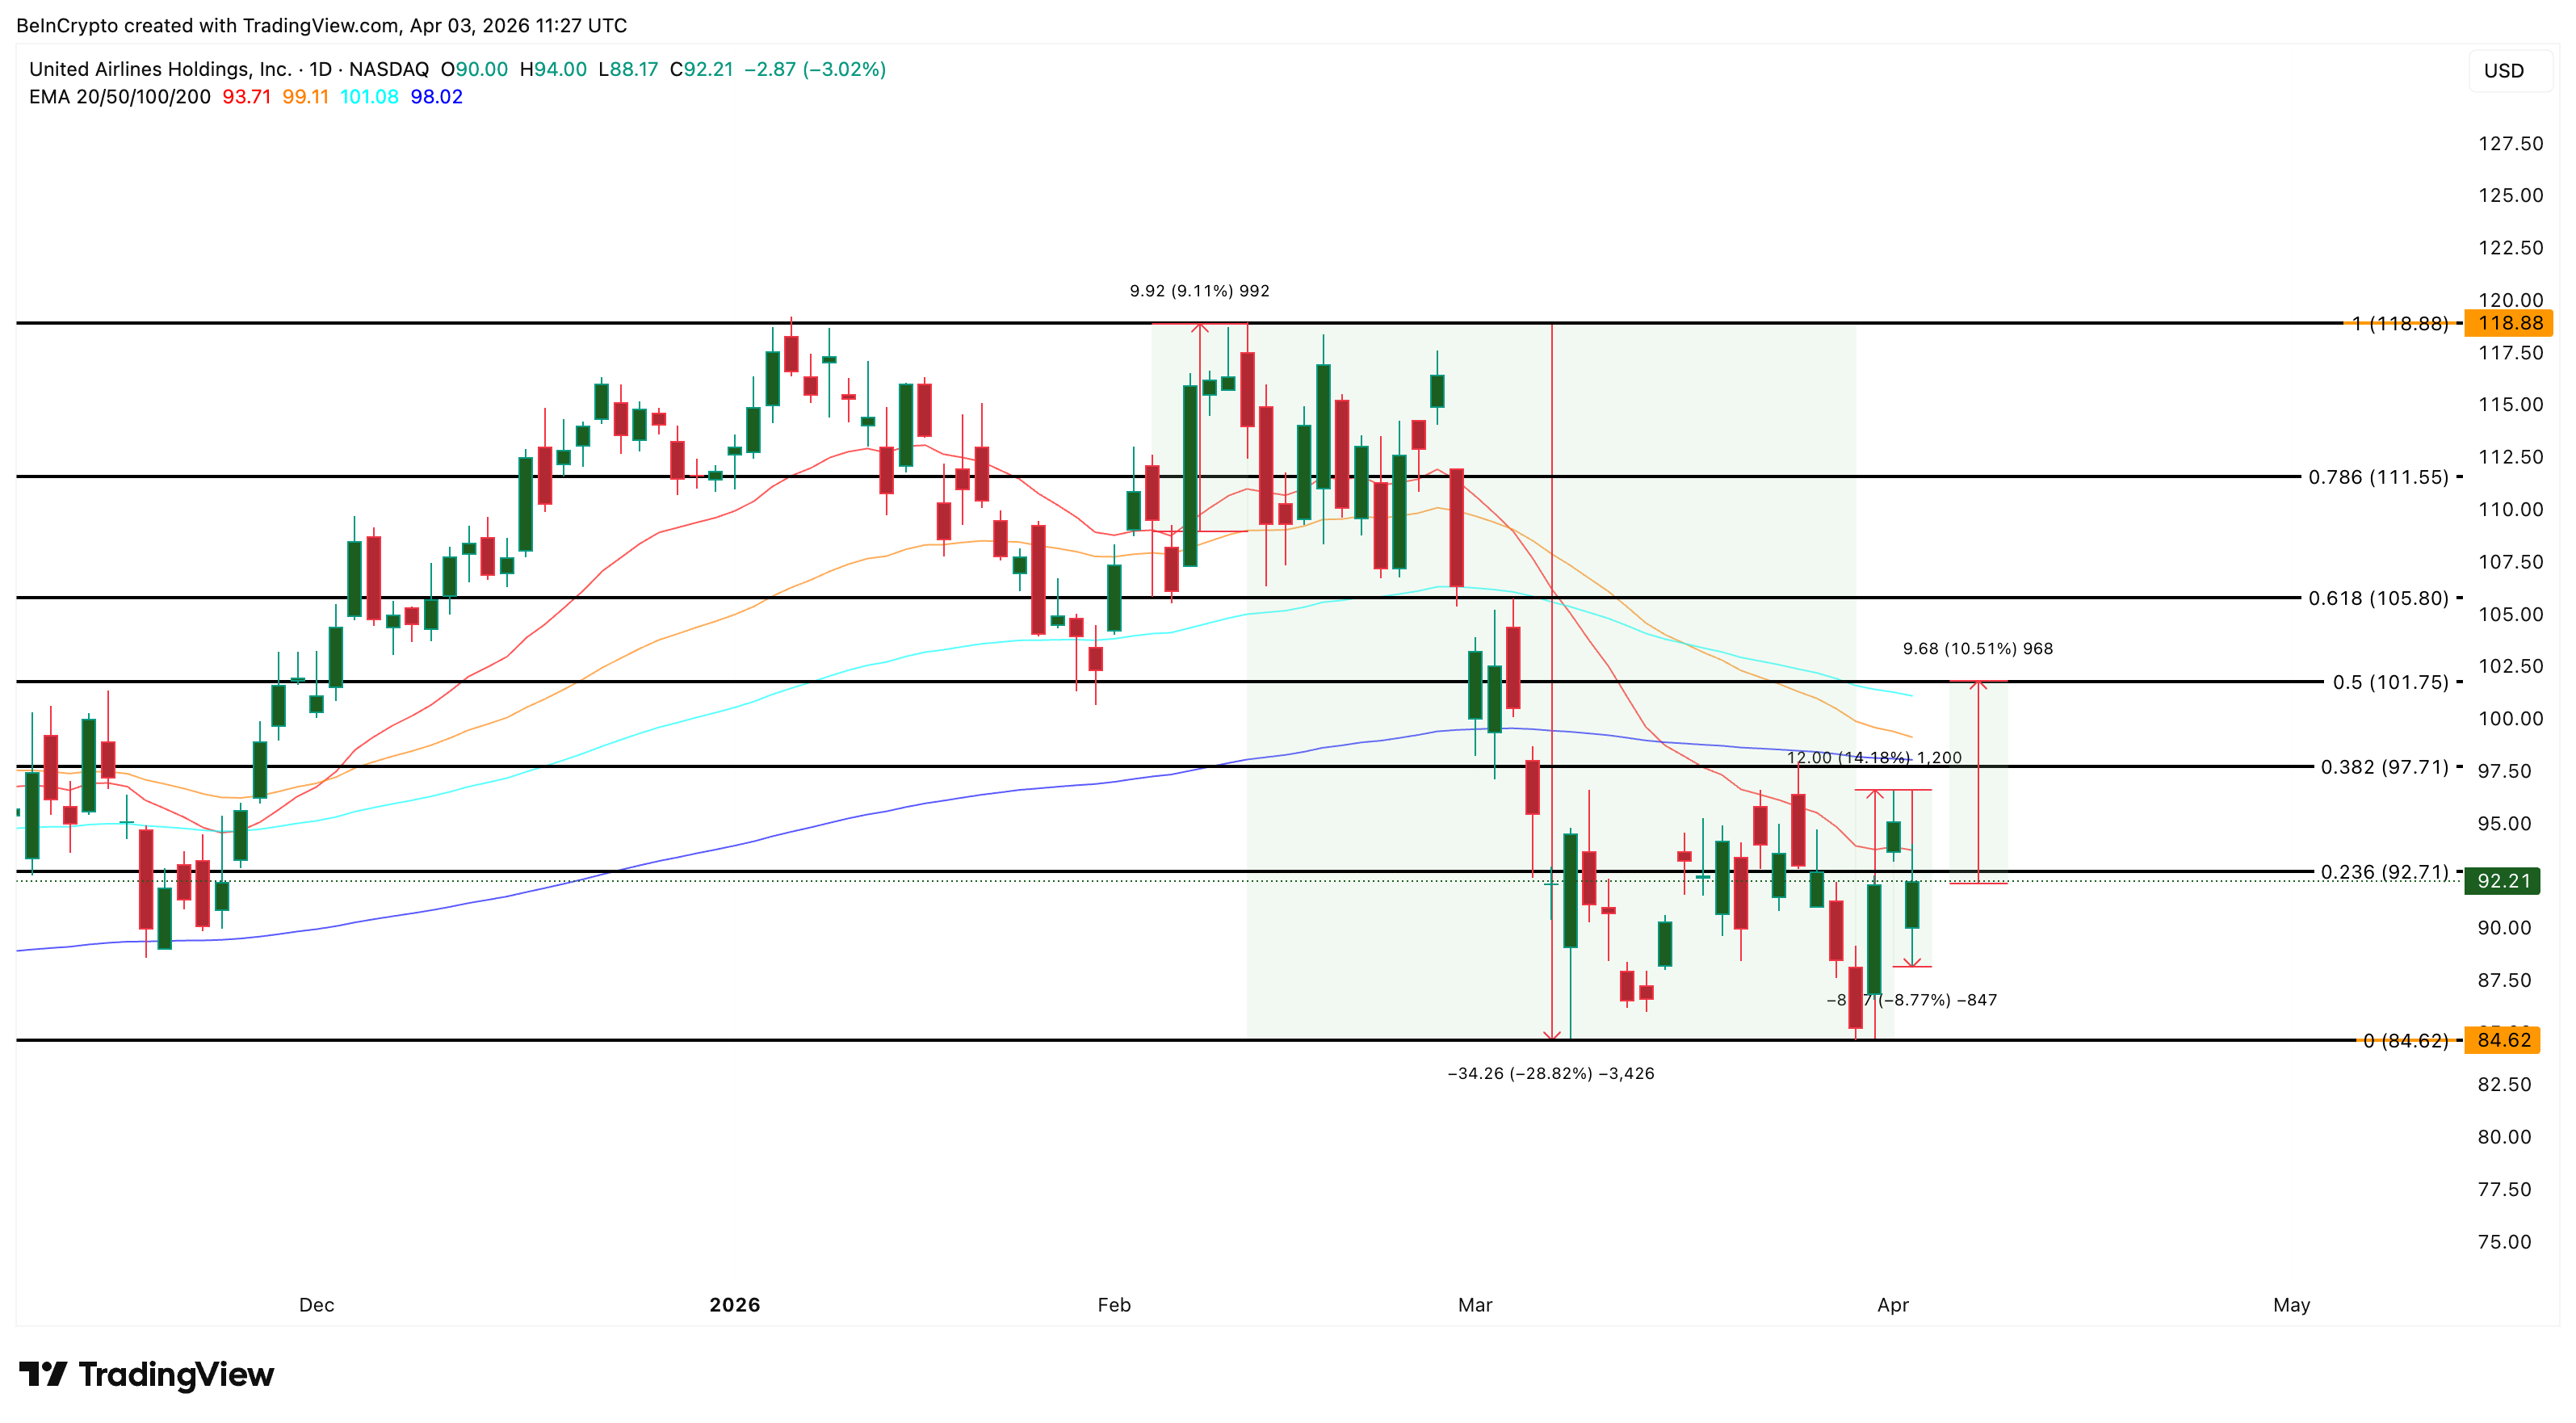
The broader damage is substantial. Since early February, UAL has fallen 28%. Right from $118.88 to its March 30 low of $84.62. The dip was driven entirely by oil-related margin fears.
If markets reopen on Monday with positive developments, reclaiming $93.71 would restore the 20-day EMA floor.
Above that, $97.71 and $101 become the next targets, with $101.75 aligning closely with the 50-day and 100-day EMAs. A move above $101.75 would place UAL above every major moving average for the first time since early February.
However, if oil stays above $110 and the war timeline extends, $84.62 remains the floor. A break below that level exposes deeper downside.
The post 3 US Stocks Heavily Affected by Trump’s Iran Speech This Week appeared first on BeInCrypto.
Decentralized email platform Dmail Network has announced it will shut down after five years of operation, citing escalating infrastructure costs, weak monetization, failed fundraising efforts, and limited token utility. The company said it will gradually cease all services starting May 15, and urged users to export their data before then, as all nodes will be shut down afterward, rendering emails and accounts inaccessible.
Positioning itself as a Web3 communication tool built around wallet-based email, encrypted messaging, and on-chain notifications, Dmail had aimed to demonstrate that decentralized infrastructure could scale with user demand. In January 2025, Dmail’s profile among AI DApps surged; DappRadar ranked the project second in that category for the month, reporting 4.9 million unique active wallets. Despite the early momentum, Dmail’s founders say expanding operational costs outpaced monetization and investment, ultimately undermining the project’s sustainability.
Key takeaways
- In its shutdown notice, Dmail Network says it will begin winding down services on May 15, with all nodes going offline thereafter, effectively ending access to emails and accounts on the platform.
- Infrastructure costs—covering bandwidth, storage, and compute—consumed a growing share of the budget as the user base expanded, while the project failed to identify a scalable paid model or monetization path.
- Funding rounds failed to materialize, acquisitions fell through, and staff departures left the team unable to maintain critical infrastructure or push a viable economic model.
- The project’s token never achieved a clear, scalable use case, and its economic design did not establish a self-sustaining loop; the token price subsequently hit an all-time low.
- Tonight’s news sits within a broader pattern of Web3 project closures, reflecting a challenging environment for infrastructure-heavy, user-reliant services.
Escalating costs vs. decentralized promises
At the heart of Dmail’s exit lie the economics of running a decentralized communication platform at scale. The shutdown notice emphasizes that bandwidth, storage, and computing resources form the majority of operating expenses, costs that grow as more users come online. While decentralization can reduce reliance on centralized servers, it does not eliminate the physical requirements of delivering reliable, globally accessible services. The company notes that despite exploring various monetization avenues, it could not secure a business model that users were willing to support at scale.
The experience underscores a recurring tension in the space: the ambition to offer censorship-resistant, privacy-preserving communications often collides with the costs of maintaining robust infrastructure and a sustainable economic engine. Even with strong early user engagement, especially for crypto-native applications that rely on on-chain primitives or specialized services, the path to profitability remains uncertain without durable monetization or external capital cycles.
Funding headwinds and the token narrative
Dmail’s leadership pinpoints financing challenges as a critical contributor to the shutdown. Multiple fundraising rounds did not close, and strategic acquisitions that might have bolstered the platform’s capital runway did not come to fruition. When coupled with ongoing staff churn and the resulting strain on maintenance capabilities, the project’s ability to keep its infrastructure online deteriorated over time.
Compounding the financial strain was the token’s performance, which failed to translate into a compelling, large-scale use case. The project’s native token did not establish a durable economic design that could support a self-sustaining ecosystem, according to the shutdown note. After the announcement, the token price retraced to all-time lows, with data from CoinGecko showing a slide to about $0.0002067 per token. This dynamic mirrors a broader market pattern where tokenomics and real utility struggle to align with high operational costs and user expectations.
Context within a challenging Web3 landscape
Dmail’s exit comes amid a wave of closures that illustrates the current fragility of some Web3 native services, particularly those that depend on sustained infrastructure beyond simple software deployments. Earlier in March, DAO tooling platform Tally announced a wind-down, citing a lack of a viable market for its products. A week later, Balancer Labs reported shutting down parts of its protocol four months after a major exploit drained more than $100 million. While each case has its own specifics, the trend underscores a critical point for builders in this space: without a durable path to revenue and resilience against funding cycles and security incidents, even technically innovative projects can struggle to endure.
For users, developers, and investors, Dmail’s experience reinforces the importance of aligning decentralization promises with practical, scalable economics. It also highlights the need for clear exit strategies and data portability when services decide to wind down, ensuring users can preserve important communications and records before shutdowns take effect.
In sharing its decision, Dmail urged users to export data ahead of May 15, and suggested that anyone relying on the service prepare for discontinuation of access as the network’s nodes go offline. For observers, the episode serves as a reminder that the most ambitious technical visions must be matched by disciplined business models and sustainable funding paths if they are to endure in a competitive crypto ecosystem.
Looking ahead, readers will want to monitor how remaining Web3 communication projects address the dual pressures of infrastructure costs and monetization. Will new models emerge that better balance decentralization with long-term sustainability? And how will the broader market’s appetite for funding, partnerships, and user growth shape the next generation of crypto-enabled communication tools?
Crypto World
Taiwan Semiconductor (TSM) Stock: March Revenue Report Set to Test AI Supply Chain Limits

Key Takeaways
- March 2026 revenue data from TSMC drops April 10, offering critical insight into whether supply can match AI chip demand
- Revenue surged 37% year-over-year in January; February posted 22% YoY growth but fell 21% month-over-month due to seasonal patterns
- Broadcom has publicly identified TSMC’s production capacity as a constraint limiting AI hardware rollouts
- Taiwan’s energy dependence—importing roughly 95% of its supply—faces new threats from Middle East instability affecting the Strait of Hormuz
- The chipmaker is scaling its U.S. presence with a massive $165 billion Arizona buildout featuring 12 fabrication and packaging facilities
Taiwan Semiconductor Manufacturing (TSM) stands at a critical juncture. The company’s March 2026 monthly sales figures, scheduled for release on April 10, will provide investors with crucial visibility into the health of AI semiconductor demand.
Taiwan Semiconductor Manufacturing Company Limited, TSM
This upcoming data release carries extra weight because it will reveal whether TSMC can translate explosive AI chip orders into actual production output. That question has grown increasingly complex in recent weeks.
For the better part of a year, the investment thesis around chip stocks has been straightforward: AI demand climbs, revenues climb with it. But that clean narrative is starting to fracture. Manufacturing bottlenecks and international tensions are now sharing the spotlight with order books.
TSMC commands approximately 72% of the worldwide contract chipmaking market, positioning it as the indispensable partner in the AI semiconductor ecosystem. Nvidia, Apple, and numerous other tech giants rely on TSMC’s cutting-edge manufacturing capabilities.
Recent financial performance has been robust. January 2026 sales climbed 37% compared to the prior year. February showed a 22% year-over-year increase, though monthly revenue declined 21% from January—a predictable seasonal dip rather than a warning sign.
Taken together, the first two months of 2026 demonstrated nearly 30% year-over-year revenue expansion. That momentum sets high expectations for the March figures.
Production Constraints Emerge as Primary Challenge
Broadcom hasn’t minced words: TSMC’s manufacturing capacity is creating a genuine constraint. As cloud providers and major corporations shift from AI pilots to production-scale implementations, the flood of chip orders is bumping against the physical limits of TSMC’s fabrication facilities.
This capacity squeeze is now intersecting with heightened international instability. Tensions involving Iran have interrupted energy shipments through the Strait of Hormuz—a vital passage responsible for roughly 20% of worldwide petroleum and liquefied natural gas transport.
Taiwan relies on imports for approximately 95% of its energy needs, with natural gas accounting for about 48% of the island’s power generation mix. Any interruption to fuel deliveries creates immediate production risk for semiconductor manufacturing operations.
Compounding these challenges, a global helium shortage continues to intensify. Helium plays a critical role in chip production processes, and reduced supplies create another headwind for output volumes.
Massive U.S. Expansion Gains Momentum
On the capital investment front, TSMC is accelerating its American footprint. The company has expanded its Arizona commitment to $165 billion, outlining plans for a dozen wafer fabrication and chip packaging plants.
Capital spending for 2026 is forecast between $52 billion and $56 billion, fueled primarily by the expensive transition to advanced N2 process technology and the company’s worldwide facility expansion strategy.
Production costs in the United States run two to three times higher than comparable operations in Taiwan. Nevertheless, Taiwanese equipment and material suppliers are pressing forward—processing work visas, building local teams, and committing to long-term contracts despite compressed profit margins in the short term.
Supply chain partners who moved early are offering premium compensation packages to secure skilled workers, wagering that future production volumes will justify today’s elevated investment.
The April 10 revenue announcement will serve as the first significant indicator of whether TSMC’s manufacturing infrastructure can maintain pace with order flow—and whether the substantial Arizona investment is beginning to generate returns.


Binance told the Senate its transaction volume with four major Iranian exchanges did not exceed $110,000 last year. Reporting from Fortune and the New York Times traced $1.7 billion in flows from Binance-linked accounts to Iran-linked entities.
Senator Richard Blumenthal now is concerned that the exchange might have misled Congress about that.
In a follow-up letter to Binance co-chief executive (CEO) Richard Teng, Blumenthal expressed his concern that the exchange might have provided “misrepresentations or misleading information to the Subcommittee and to the public.”
Read more: Binance probed by DOJ files lawsuit against WSJ
The senator, the ranking Democrat on the Senate Permanent Subcommittee on Investigations, demands Binance produce documents justifying its prior March 6th response and its $110,000 claim.
The escalation follows weeks of reporting by Fortune’s Leo Schwartz and Ben Weiss, as well as the New York Times. Their investigations traced hundreds of millions in tether (USDT) from Binance accounts to wallets tied to Iran’s Islamic Revolutionary Guard Corps (IRGC) and the Houthis of Yemen.
Separately, Blumenthal’s original February 24 letter also inquired about payments to crew members of Russia’s sanctions-evading oil fleet.
The $110,000 claim versus $1.7 billion in flows
Binance dismissed the allegations on March 6 as “demonstrably false, unsupported by credible evidence, and defamatory in several material respects.”
The exchange said its direct transactions with four Iranian exchanges had fallen to no more than $110,000 across the year. Binance highlighted its proactive work against two intermediaries, Hexa Whale and Blessed Trust, to limit “indirect exposure to wallet addresses with potential ties to Iran.”
Blumenthal’s new letter questions that corporate framing.
He asks about Fortune’s reporting of a VIP account registered to a 79-year-old Chinese resident moving $439 million in USDT from Binance to an outside wallet. That wallet forwarded most of those funds to Entity A, an intermediary cluster that Fortune identified as Iran-linked. Entity A allegedly has a financial connection with Nobitex, for example, Iran’s largest crypto exchange, as well as IRGC and Houthi wallets.
A second Chinese VIP, an ostensibly 38-year-old woman, allegedly moved nearly $200 million through the same pipeline. Reporters also flagged the possibility that both accounts could have been accessed from the same device.
Worse, Blumenthal’s letter notes that the New York Times reported that Binance labeled some of these accounts with manual instructions, “Don’t block. Internal accounts.”
One Iranian national who sent crypto fees directly to Entity A had appeared in a United Nations Security Council report on smuggling for Iran and North Korea.
Senator gives Binance two weeks to respond
Blumenthal’s letter lays out a timeline of allegations. Binance, the senator says, took two months to respond to law enforcement on Hexa Whale, then took another two months to remove the entity. Blessed Trust, even worse, allegedly lasted at least five months as a Binance vendor despite warnings about its alleged terrorist financing.
The senator now demands exact dates. When did these entities open Binance accounts, start transfers, receive flags from Binance staff, and become subjects of suspicious activity reports to US law enforcement? The senator also asks whether Binance has “removed, weakened, or relaxed any compliance policies” since January 2025.
The letter marks the third major escalation about Binance this year. Blumenthal’s February 24 inquiry called Binance a “repeat offender.” Previously, 11 Senate Democrats urged the Treasury and DOJ to investigate. The Wall Street Journal reported that the DOJ opened a probe into Iran’s use of Binance to evade sanctions.
Binance, meanwhile, has sued the Wall Street Journal for defamation.
The political backdrop makes the compliance issues conspicuous.
President Trump pardoned Binance founder Changpeng Zhao (CZ) in October 2025 after his guilty plea to Bank Secrecy Act violations. The SEC also voluntarily dismissed its Binance lawsuit in 2025.
Binance then became what Blumenthal called a “vital engine” for World Liberty Financial, the Trump family’s crypto venture. Blumenthal’s February letter noted that the vast majority of WLFI’s USD1 stablecoin sat within Binance accounts.
Abu Dhabi’s MGX settled a $2 billion Binance investment through that USD1 stablecoin.
The price of BNB, the token that Binance issued, is down 31% year to date. Binance equity is not publicly traded.
Blumenthal gave Binance CEO Teng until April 14 to respond.
Got a tip? Send us an email securely via Protos Leaks. For more informed news, follow us on X, Bluesky, and Google News, or subscribe to our YouTube channel.


South Korea’s FSS orders Dunamu to correct omissions in its Naver Financial stock swap filing as new digital asset rules threaten the merger’s structure and timeline.
Summary
- South Korea’s Financial Supervisory Service ordered Dunamu to correct “significant omissions” in filings on its stock swap with Naver Financial.
- The deal would make Upbit operator Dunamu a wholly owned Naver Financial subsidiary but now faces regulatory, competition, and legislative uncertainty.
- Ongoing debate around South Korea’s Digital Asset Basic Act threatens to reshape exchange ownership rules and the merger’s underlying logic.
South Korea’s Financial Supervisory Service (FSS) has issued a corrective order to Dunamu, the operator of leading crypto exchange Upbit, over “significant omissions or false statements” in a disclosure about its planned comprehensive stock swap with Naver Financial, according to local outlet Money Today as cited by Coinness. The FSS said problems were concentrated in sections on “future corporate restructuring plans” and “other important matters related to investment decisions,” effectively accusing Dunamu of under‑disclosing key risks to shareholders as it moves toward becoming a wholly owned subsidiary of Naver Financial.
Under the deal structure first approved in November 2024, Naver Financial aims to acquire 100% of Dunamu through a share exchange that would convert existing Dunamu investors into Naver Financial shareholders and fold the Upbit operator under Naver’s fintech umbrella. According to a correction report filed by Naver Financial, external valuers set the corporate value ratio between the two at 1 to 3.064569, with earlier crypto.news coverage putting Dunamu’s implied valuation in the $10 billion range and the broader merger around $14.5 billion. As previously reported in a crypto.news story, the tie‑up is pitched as a super‑app play that marries Naver Pay’s payments rail with Upbit’s trading engine, giving the combined group control over more than 70% of South Korea’s crypto volumes.
Naver Financial has already pushed back the timetable for the stock swap by roughly three months, with a shareholder vote now slated for August 18 and closing expected on September 30, according to a recent regulatory filing highlighted by crypto.news. Naver said it adjusted the schedule to reflect “approval procedures and improvement of laws,” as antitrust reviews at the Korea Fair Trade Commission (KFTC), major shareholder change declarations and evolving digital asset rules all converge on the transaction.finance.
Industry commentary in Chosun Ilbo warned that proposed limits on major shareholders in virtual asset exchanges—floated in connection with South Korea’s Digital Asset Basic Act—could make Naver’s 100% control of Dunamu “unfeasible” if thresholds are set as low as 15–20%. Dunamu CEO Oh Kyoung‑suk told shareholders that if caps are fixed at “20% for individuals and 34% for corporations, it will affect both Naver Financial’s 100% control structure and major shareholders,” but added that the company would “proceed as originally planned regardless.”
The corrective order lands amid a broader regulatory reset as Seoul finalizes its Digital Asset Basic Act, a framework meant to anchor South Korea’s crypto rules from 2026. As detailed in a separate crypto.news story, the draft introduces no‑fault liability for digital asset operators, forces stablecoin issuers to hold more than 100% reserves at segregated institutions, and hands new enforcement and oversight powers to agencies including the Financial Services Commission and the Bank of Korea.
For Dunamu and Naver, that means the economics and governance of the merger sit in the crosshairs of rules still being negotiated, with ownership caps, reserve mandates, and stricter disclosure standards all capable of derailing or re‑pricing the deal. In that sense, the FSS’s move to force a more detailed explanation of “future corporate restructuring plans” reads less as a technical compliance issue and more as a stress test of how Korea’s new digital‑asset order will treat a dominant domestic exchange trying to plug itself directly into a tech‑payments giant.


Circle has launched cirBTC, a wrapped Bitcoin token backed 1:1 with native on-chain BTC reserves, deploying first on Ethereum mainnet and its own Arc blockchain.
The move is direct: Bitcoin holds over $1.7 trillion in market cap but generates almost no DeFi activity, and Circle is positioning itself as the infrastructure layer that changes that.
The institutional implication is immediate. With Bitcoin ETFs reversing months of outflows and fresh capital flowing into BTC exposure, the demand for yield-bearing Bitcoin products is structurally rising – and Circle is moving to own that pipeline before a competitor does.
- Circle has unveiled cirBTC, a wrapped Bitcoin token backed 1:1 with native on-chain Bitcoin reserves.
- The token launches initially on Ethereum mainnet and Circle’s Arc blockchain, with real-time reserve verification and no third-party custodians.
- cirBTC targets an estimated $1.7 trillion Bitcoin liquidity gap, integrating with USDC, Circle Mint, and major DeFi lending and derivatives protocols.
- This is Circle’s first major non-stablecoin product since its NYSE listing as CRCL in 2025, signaling a deliberate expansion beyond fiat-pegged assets.
Discover: The best crypto to diversify your portfolio during market turbulence
cirBTC: What It Actually Changes for Bitcoin Liquidity
The existing wrapped Bitcoin market is not small, WBTC launched in January 2019 and at its peak represented billions in DeFi TVL, but it has been defined by custodian opacity.
The 2022 FTX collapse accelerated distrust in centralized wrappers, and renBTC, which once held over $1 billion in TVL, faded as audit credibility eroded. Circle is betting that its track record with USDC, now above $30 billion in circulation, gives it the institutional credibility those products never had.
Rachel Mayer, VP of product at Circle and the Arc blockchain, put the thesis plainly in a post on X: “Bitcoin is sitting on the sidelines of DeFi. Not because people don’t want yield or liquidity – it’s because they don’t trust the wrapper.”
She followed directly: “cirBTC is Circle’s answer: 1:1 backed, on-chain-verifiable, and built on infrastructure the market already trusts.”
That distinction matters. WBTC routes through BitGo as custodian – a model that requires trusting an intermediary’s audit. cirBTC uses real-time onchain reserve verification with no third-party custodian sitting between holder and backing BTC.
For institutional desks and DeFi protocols that learned hard lessons from opaque collateral structures, verifiability isn’t a feature – it’s the threshold requirement. If Circle can demonstrate reserve proof holds under stress, the institutional case becomes difficult to argue against.
The mechanism integrates directly with Circle Mint for OTC desks and connects ready-made to USDC liquidity pools, creating a cross-collateral environment that no prior wrapped BTC product has had at launch.
The caveat: Circle’s infrastructure is centralized by nature, and IMF warnings around cross-chain tokenization risks apply here as they do across the RWA sector. The bear case accelerates if a bridge exploit or smart contract failure forces Circle to respond – and the firm’s 2023 inaction during $230 million in USDC bridge thefts on Multichain remains an open scar on its credibility.
What to Watch as Circle Bitcoin Moves Toward Full Rollout
Full rollout is targeted for Q2 2026, with DeFi protocol integrations and Circle Mint connectivity expected by May.
Expansions to Solana and additional L2s are on the roadmap but unconfirmed. The immediate variable to watch is DeFi TVL migration – specifically whether lending protocols route BTC collateral toward cirBTC or remain with WBTC given its deeper existing liquidity moats.
Regulatory backdrop matters here too. The 2025 U.S. stablecoin legislation created a clearer framework for fiat-pegged digital assets, but tokenized BTC products sit in a grayer zone.
Broader institutional regulatory clarity from the SEC and CFTC on tokenized assets could accelerate or stall adoption depending on how cirBTC is classified. Circle’s NYSE listing as CRCL adds public accountability that custodian-model competitors do not carry – a pressure point that cuts both ways.
If cirBTC captures even a fractional share of BTC held in ETF structures and redirects it toward DeFi yield, the liquidity impact on Ethereum and Arc protocols would be structural, not marginal. If adoption stalls at the institutional access layer due to regulatory friction or a trust event, it validates every skeptic who argued Circle’s credibility is stablecoin-specific and doesn’t transfer to Bitcoin infrastructure.
Explore: The best pre-launch token sales with asymmetric upside potential
The post Circle Unveils New Token Aimed at Expanding Bitcoin Utility appeared first on Cryptonews.
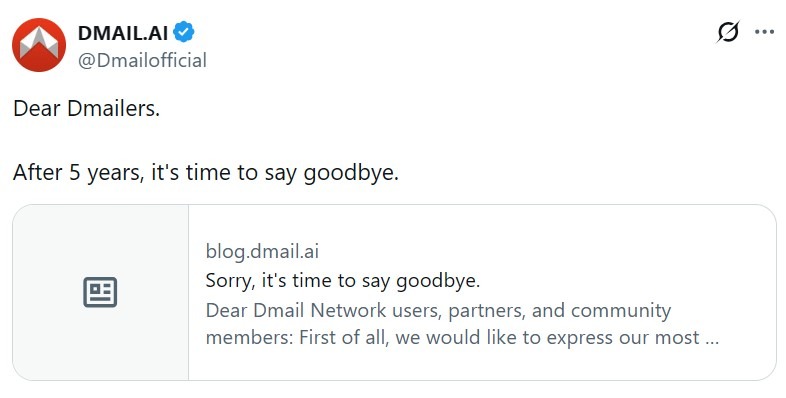
Decentralized email platform Dmail Network is shutting down after five years of operations, citing high infrastructure costs, weak monetization, failed funding efforts and limited token utility.
The platform said it will gradually cease all services starting May 15, and urged users to export their data before then. It said all nodes will shut down after that date, making emails and accounts inaccessible.
Dmail Network positioned itself as a Web3 communication platform focused on decentralized, wallet-based email, encrypted messaging and onchain notifications. In January 2025, DappRadar ranked Dmail second among AI DApps, with 4.9 million unique active wallets for the month.
Dmail’s closure suggests that user activity alone was not enough to sustain an infrastructure-heavy Web3 product once high operating costs, weak monetization and failed fundraising converged.

Dmail points to costs, failed fundraising and weak token use
Dmail said the economics of running a decentralized communication platform had become increasingly difficult to sustain. In its shutdown note, the company said bandwidth, storage and computing costs consumed a large share of its budget, with the expenses rising as users grew.
The company said it explored different paid models and monetization paths but failed to find a business model users were willing to support at scale.
Related: Big Tech firms back new x402 Foundation to advance agentic AI adoption
Dmail said that worsening market conditions added to the pressure. The team said multiple financing rounds failed, acquisition efforts fell through and funding was nearing exhaustion. It said departures among core staff left the team unable to keep maintaining its infrastructure.
It added that the project’s token never developed a clear, large-scale use case and that its economic design failed to create a self-sustaining loop. Following the announcement, Dmail Network’s token dropped to an all-time low of $0.0002067, according to CoinGecko.
Dmail joins growing list of Web3 closures
Dmail’s shutdown comes amid a recent wave of closures across Web3, as projects struggle with weak demand and funding pressures.
On March 18, DAO tooling platform Tally said it was winding down after concluding that there was no viable market for its products. On March 24, development company Balancer Labs said it was shutting down four months after an exploit that drained over $100 million.
Magazine: AI agents will kill the web as we know it: Animoca’s Yat Siu

Quick Overview
- Shares of SBAC rallied as high as 18.93%, reaching approximately $194.53, following disclosure that the firm is considering a possible acquisition.
- The telecommunications tower operator acknowledged engaging financial advisers to assess preliminary acquisition proposals from major infrastructure investment funds.
- Prior to this development, multiple Wall Street firms had reduced their price objectives, including Wells Fargo, JPMorgan, Scotiabank, and Morgan Stanley — the Street’s average rating stands at Hold with a $230.11 price objective.
- During its most recent quarterly report, SBA exceeded earnings per share projections ($3.47 versus $3.25 anticipated), although sales of $719.58 million fell marginally short of the $725.80 million forecast.
- The company also increased its quarterly cash distribution to $1.25 (annualized $5.00), compared to the previous $1.11, representing approximately 2.6% yield.
SBA Communications (SBAC) is presently changing hands near $194.53, representing a significant advance from its previous closing level of $171.56.
SBA Communications Corporation, SBAC
Shares of SBA Communications (SBAC) experienced substantial upward movement on Wednesday following media reports indicating the wireless infrastructure provider is investigating a potential transaction, with acquisition interest coming from prominent infrastructure investment entities.
The equity climbed as high as 18.93% during intraday trading. Most recently, it was hovering around $194.53, marking a considerable increase from the prior session’s close of $171.56. Trading activity registered below typical levels, with approximately 524,666 shares traded — about 44% beneath standard session turnover.
The company acknowledged retaining financial advisers to examine the preliminary interest being expressed. This official confirmation suggests legitimate potential acquirers may be involved, which propelled optimistic market sentiment throughout the trading day.
Market participants view any transaction supported by infrastructure investment vehicles as likely commanding a premium price, contributing additional momentum to the stock’s advance.
Prior to this development, the security had been experiencing downward pressure. For the year through yesterday, SBAC had declined approximately 10.7%.
Wall Street Had Been Lowering Expectations
Various equity analysts had been reducing their valuation targets for SBAC throughout recent months. Wells Fargo decreased its objective from $205 down to $195, maintaining an “equal weight” stance. JPMorgan reduced its target from $245 to $240 while keeping a “neutral” designation. Scotiabank adjusted downward from $233 to $223 with a “sector perform” rating, and Morgan Stanley moved from $225 down to $215 at “equal weight.”
Most recently, Truist launched research coverage assigning a “hold” recommendation with a $193 valuation target. The Wall Street consensus currently reflects a Hold assessment with an average price objective of $230.11.
The equity’s 50-day moving average was positioned at $187.32 and its 200-day at $190.97, both technical levels that today’s surge has now exceeded.
SBA’s latest quarterly financial results, disclosed February 26, delivered $3.47 in earnings per share — surpassing the $3.25 Street estimate by $0.22. Quarterly sales of $719.58 million registered slightly below the $725.80 million projection. Top-line growth increased 3.7% on a year-over-year basis.
Cash Distribution Increased Recently
The company also announced an enhancement to its quarterly shareholder distribution not long ago, raising it from $1.11 to $1.25 each quarter. This translates to an annualized rate of $5.00, establishing the yield at roughly 2.6%. The payment was distributed on March 27, with shareholders of record as of March 13 qualifying.
The firm’s current payout ratio registers at 52.47%.
Institutional ownership accounts for 97.35% of SBAC’s shares outstanding. In recent portfolio activity, Geneos Wealth Management expanded its position by 105% during Q1, purchasing 84 additional shares to reach a total holding of 164 shares.
SBA maintains a market capitalization approaching $20.72 billion with a price-to-earnings multiple of 20.59.
Wall Street analysts are currently projecting the company will deliver $12.57 in full-year earnings per share.

Key Takeaways
- Wall Street analysts anticipate TER will deliver Q1 2026 EPS of $2.08, representing a 177.3% surge from the prior year’s $0.75.
- The company exceeded earnings projections by 32.4% in Q4 2025, posting $1.80 per share against the $1.36 forecast.
- Shares have skyrocketed 271.3% during the past year, dramatically outperforming the S&P 500’s 16.7% gain.
- A 6.5% single-day decline occurred on March 30 as Iran-related geopolitical risks sparked semiconductor supply chain worries.
- Coverage from 17 Wall Street analysts yields a “Moderate Buy” consensus with an average price objective of $311.20.
Teradyne’s performance has been nothing short of exceptional. Shares have climbed approximately 61% since the start of the year and more than 271% over the trailing twelve months, propelled primarily by robust appetite for AI-driven semiconductor testing systems.
The semiconductor equipment maker has consistently surpassed analyst earnings forecasts across its last four quarterly reports. In the most recent period, Q4 2025, the company delivered $1.80 in earnings per share—32.4% higher than the $1.36 Wall Street consensus. Quarterly revenue reached $1.08 billion, significantly exceeding the $970 million projection and marking a 43.9% year-over-year increase.
As the Q1 2026 earnings announcement draws near, expectations are running high. Analysts project earnings of $2.08 per share, which would mark a substantial 177.3% improvement over the $0.75 reported during the same quarter last year. While this represents an ambitious forecast, Teradyne has demonstrated a consistent ability to exceed elevated benchmarks.
For the complete 2026 fiscal year, Wall Street consensus calls for EPS of $5.91—a 49.2% jump from the $3.96 achieved in fiscal 2025. Extended projections point to earnings of $7.62 per share in fiscal 2027, reflecting 28.9% year-over-year expansion.
The stock currently commands a price-to-earnings ratio near 89, which sits well above historical norms. The twelve-month trading range spans from $65.77 to $344.92, illustrating the dramatic shift in investor sentiment as AI infrastructure expenditures accelerated.
Institutional ownership remains exceptionally strong, with approximately 99.77% of outstanding shares held by institutions and hedge funds. Recent filings show several prominent investors expanding their positions, including Integrated Wealth Concepts, which increased its holdings by 12.8% during Q1.
Wall Street Sentiment and Price Objectives
The analyst community maintains a predominantly positive outlook. Of the 17 analysts tracking the stock, 11 rate it “Strong Buy,” one assigns “Moderate Buy,” and five recommend “Hold.” The consensus twelve-month price target stands at $311.20, implying roughly 1.4% potential appreciation from present trading levels.
Multiple major financial institutions have revised their targets upward in recent months. Morgan Stanley established a $306 price objective. Goldman Sachs upgraded its target from $230 to $300 while maintaining a “Buy” recommendation. Evercore increased its forecast from $200 to $280 alongside an “Outperform” rating. Cantor Fitzgerald adjusted its target higher from $240 to $270.
Robert W. Baird has additionally identified TER as a compelling appreciation opportunity, contributing to the optimistic analyst sentiment surrounding the upcoming earnings release.
Challenges on the Horizon
The upward trajectory hasn’t been without interruptions. On March 30, shares tumbled 6.5% during a single trading session. The decline stemmed from escalating geopolitical concerns related to the Iran conflict, which triggered widespread anxiety across semiconductor equities.
A particular concern emerged regarding possible disruptions to helium supplies—a critical gas utilized in chip manufacturing processes. Such supply chain uncertainties typically impact test equipment manufacturers significantly, given their direct exposure to semiconductor production rhythms.
Teradyne recently commemorated its 25th anniversary of Chinese operations at SEMICON China 2026, where it unveiled four innovative AI infrastructure and semiconductor testing solutions. This underscores ongoing commitment to a market that presents its own geopolitical complexities.
With a beta coefficient of 1.79, the stock exhibits considerable volatility characteristics. As the Q1 earnings release approaches, investors are keenly evaluating whether AI-fueled demand can substantiate what many consider an elevated valuation multiple.
Vanessa Trump posts message to boyfriend Tiger Woods after his DUI arrest

1928 penny buried in County Durham discovered by pupils

ADM expands stevia portfolio

Smart energy pays enters the US market, targeting scalable financial infrastructure

Why Israel is blocking foreign journalists from entering

Bitcoin: We’re Entering The Most Dangerous Phase

Ripple XRP News – DAVID SCHWARTZ JUST CONFIRMED WHAT NOBODY WAS SUPPOSED TO KNOW!!!

“Bitcoin Is Following A Pattern Nobody Wants To Admit” | Anthony Scaramucci

Banking & Financial Current Affairs MARCH 2026 | Monthly Current Affairs Series By Sheetal Mam
-

 NewsBeat7 days ago
The Story hosts event on Durham’s historic registers
-

 NewsBeat20 hours ago
Steven Gerrard disagrees with Gary Neville over ‘shock’ Chelsea and Arsenal claim | Football
-

 Sports7 days ago
Sweet Sixteen Game Thread: Tide vs Michigan
-
Entertainment4 days ago
Fans slam 'heartbreaking' Barbie Dream Fest convention debacle with 'cardboard cutout' experience
-

 Crypto World2 days ago
Gold Price Prediction: Worst Month in 17 Years fo Save Haven Rock
-

 Business15 hours ago
No Jackpot Winner and $194 Million Prize Rolls Over
-
 Entertainment6 days ago
Lana Del Rey Celebrates Her Husband’s 51st Birthday In New Post
-

 Tech5 days ago
The Pixel 10a doesn’t have a camera bump, and it’s great
-
Crypto World3 days ago
Dems press CFTC, ethics board on prediction-market insider trades
-

 Sports3 days ago
Tallest college basketball player ever, standing at 7-foot-9, entering transfer portal
-

 Tech4 days ago
Avatar Legends: The Fighting Game comes out in July and it looks pretty slick
-

 Tech3 days ago
EE TV is using AI to help you find something to watch
-

 Fashion5 days ago
Amazon Sundays: Soft Spring Layers
-

 Business2 days ago
Login and Checkout Issues Spark Merchant Frustration
-

 Fashion7 days ago
When Evening Dressing Gets Colorful for Spring
-

 Tech3 days ago
How to back up your iPhone & iPad to your Mac before something goes wrong
-

 Tech4 days ago
Apple will hide your email address from apps and websites, but not cops
-

 Tech5 days ago
Elon Musk’s last co-founder reportedly leaves xAI
-

 Crypto World4 days ago
U.S. rule change may open trillions in 401(k) funds to crypto
-

 Politics4 days ago
Should Trump Be Scared Strait?
You must be logged in to post a comment Login