

Crypto World
How El Mencho’s CJNG Cartel Used Crypto to Support Operations

One of the world’s most wanted drug lords is dead. Nemesio Rubén Oseguera Cervantes, known as “El Mencho,” was killed on Sunday. His death triggered a wave of violence across several Mexican states.
Beyond the security impact, attention is also turning to the cartel’s financial operations. In recent years, regulators and researchers have documented how Mexican criminal networks have incorporated cryptocurrency into their operations.
Who was El Mencho?
El Mencho was among Mexico’s most wanted fugitives and the leader of the Jalisco New Generation (CJNG) cartel. According to the US Department of State, the CJNG was formed in 2009. It has since evolved into one of the most violent drug cartels in Mexico.
“It has been assessed to have the highest cocaine, heroin, and methamphetamine trafficking capacity in Mexico, and over the past few years, includes the trafficking of fentanyl into the United States,” the text reads.
On February 20, 2025, the United States officially designated the cartel as a Foreign Terrorist Organization pursuant to Section 219 of the Immigration and Nationality Act.
In addition, the US State Department had offered a $15 million reward for information leading to the capture or conviction of El Mencho. He was killed on Sunday during a military operation.

Following his death, unrest spread across parts of the country. According to the BBC, at least 20 states experienced disturbances as cartel members blocked roads and torched vehicles and businesses.
While the immediate fallout played out in the streets, past data shows that CJNG’s impact has extended beyond territorial control.
Over the past years, investigators have tracked the cartel’s increasingly sophisticated financial infrastructure. This includes its use of digital assets to move and launder funds across borders.
Crypto and Cartel Finance
Cryptocurrencies such as Bitcoin (BTC) and Tether (USDT) are not inherently illicit. They are widely used for legitimate investment, payments, and financial innovation.
However, regulatory and law enforcement agencies have identified instances in which these digital assets were used in transactions linked to illegal activities.
As early as 2020, Reuters reported that US and Mexican authorities observed an increasing use of Bitcoin among major drug trafficking groups, including the CJNG and the Sinaloa Cartel, for laundering money.
In 2024, the US Treasury’s Financial Crimes Enforcement Network (FinCEN) stated that Mexico-based transnational criminal organizations were using virtual currencies, including Bitcoin, Ethereum, Monero, and Tether, to purchase fentanyl precursor chemicals and equipment from suppliers in China.
A March 2025 report by Chainalysis found that suspected China-based chemical traders received more than $37.8 million in cryptocurrency between 2018 and 2023. Major Mexican cartels, including the CJNG, were identified as buyers of these precursors used to manufacture synthetic opioids.
“Blockchain analysis reveals that precursor chemical suppliers advertise directly on darknet markets and messaging apps, accepting digital assets in exchange for chemicals shipped to Mexico. Once paid, crypto funds are laundered through complex transaction patterns including peel chains, layering, and cross-chain swaps, and often cashed out through Chinese exchanges or international mules,” TRM Labs revealed.
In August 2025, FinCEN also highlighted that the CJNG, the Sinaloa Cartel, the Gulf Cartel, and other Mexico-based transnational criminal organizations were using Chinese money laundering networks (CMLNs) to launder illicit proceeds.
Notably, Chainalysis reported that CMLNs now play a dominant role in cryptocurrency-related money laundering. In 2025, these networks accounted for approximately 20% of known cryptocurrency money laundering activity.
While the activity has scaled, regulatory focus has also intensified. According to the US Attorney’s Office for the Southern District of New York, Paul Campo, a former DEA official, and Robert Sensi were indicted for conspiring to provide material support to CJNG.
“As part of the scheme, CAMPO and SENSI agreed to launder approximately $12,000,000 of CJNG narcotics proceeds; laundered approximately $750,000 by converting cash into cryptocurrency; and provided a payment for approximately 220 kilograms of cocaine on the understanding that the payment would trigger the distribution and sale of the narcotics worth approximately $5,000,000, for which CAMPO and SENSI would (i) receive directly a portion of the narcotics proceeds as profit; and (ii) receive a further commission upon the laundering of the balance of the narcotics proceeds,” the press release said.
Thus, El Mencho’s death marks a significant moment in Mexico’s fight against organized crime. Yet the financial systems supporting major cartels remain complex, cross-border, and technologically adaptive, extending far beyond any single individual.


The U.S. Attorney’s Office for the Eastern District of North Carolina seized more than $61 million in Tether (USDT) linked to money laundering from crypto “pig butchering” investment scams.
Why it matters:
- Victims of pig butchering scams lose funds to fraudulent platforms showing fake returns, then face demands for “taxes” or “fees” to withdraw. This is a cycle designed to repeatedly extract money.
- The $61 million seizure ranks among the largest single USDT confiscations tied to romance-based crypto fraud in U.S. history.
- The case signals direct DOJ and Homeland Security Investigations (HSI) coordination with Tether to freeze and transfer illicit stablecoin holdings.
The details:
- The U.S. Attorney’s Office for the Eastern District of North Carolina announced the seizure, with the DOJ and HSI leading the operation.
- Investigators traced the USDT to wallet addresses linked to money laundering tied to crypto investment fraud.
- Pig butchering scams involve criminals building fake romantic relationships online before steering victims toward fraudulent trading platforms.
- Tether assisted the DOJ and HSI in facilitating the transfer of the $61 million in seized assets.
The big picture:
- Pig butchering scams generated billions in global losses in recent years, with U.S. authorities accelerating seizures as stablecoins become the preferred settlement layer for organized fraud networks.
- The case adds to the DOJ’s growing track record of recovering crypto assets linked to transnational fraud.
The post North Carolina DOJ Seizes $61 Million in USDT Tied to Pig Butchering Scam appeared first on BeInCrypto.

The euro has moved into a phase of correction and consolidation ahead of key macroeconomic releases. In EUR/USD, a technical pullback is unfolding following the previous decline, while EUR/CAD continues a more extended corrective move within its medium-term structure. Market activity is easing as traders await important data from the euro area, the United States and Canada, which could determine the next directional move.
In the euro area, the focus is on Germany’s GDP figures, the GfK consumer climate index and business activity indicators. These releases will help assess the resilience of the region’s largest economy amid a slowdown in the manufacturing sector. Weak data would increase pressure on the euro, while more solid readings could support attempts at stabilisation.
In the United States, investors are monitoring developments in the mortgage market, upcoming comments from Federal Reserve officials and oil inventory data. Trade policy also remains a source of uncertainty. President Donald Trump announced the introduction of a temporary global tariff of 10% for 150 days, with the administration not ruling out a further increase to 15%. The postponement of harsher measures has slightly eased tensions, yet ongoing trade risks continue to influence currency markets, including the euro and commodity-linked currencies.
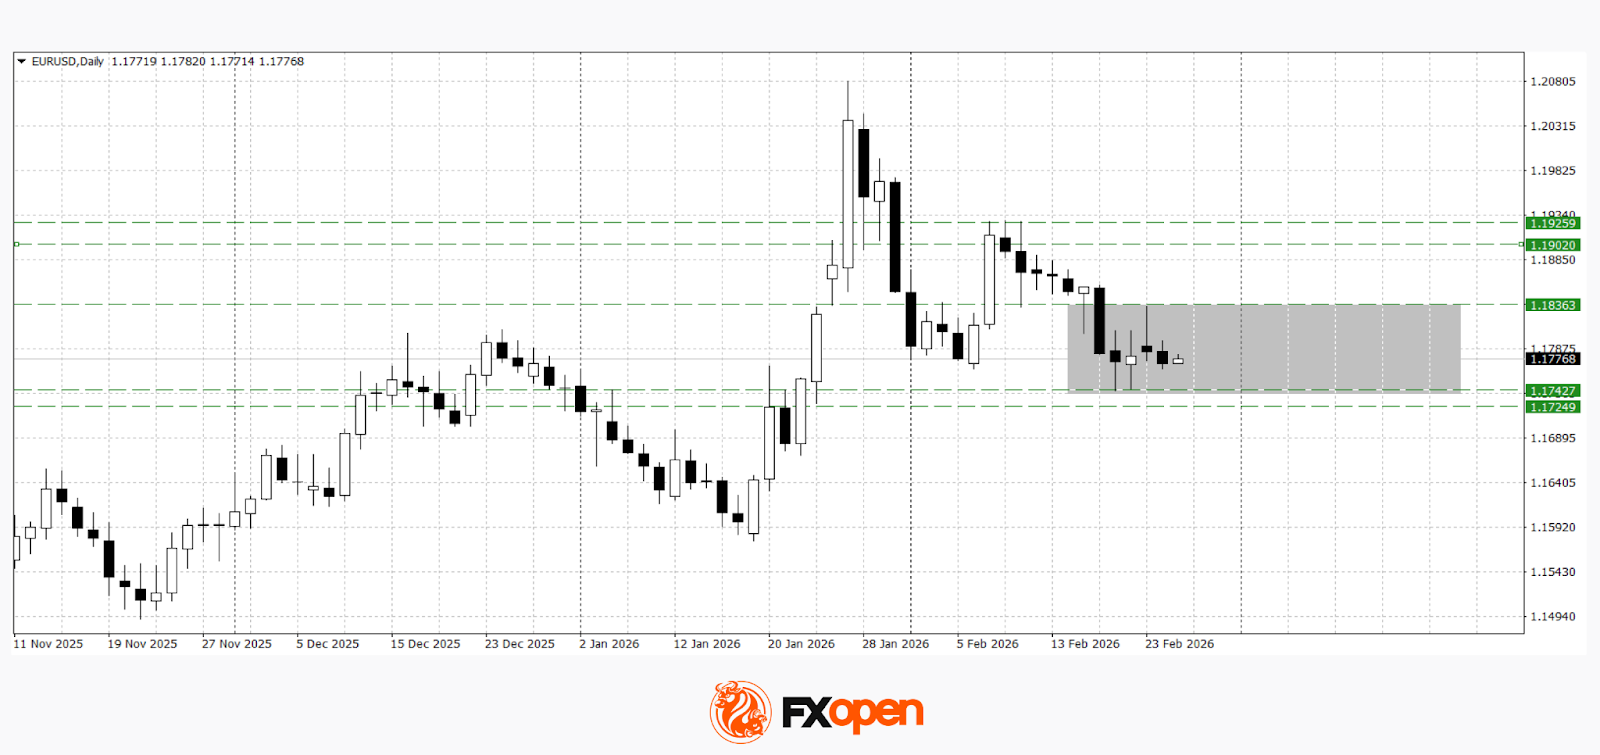
EUR/USD
After the resumption of the downward move in EUR/USD last week, buyers managed to find support near 1.1740. A retest of this level and a rebound towards 1.1840 helped establish the boundaries of the current sideways range. Technical analysis points to consolidative trading conditions. A sustained move above 1.1840 could pave the way for gains towards 1.1900–1.1920. A break below 1.1740 may trigger a fresh bearish impulse.
Key events for EUR/USD:
– today at 09:00 (GMT+2): Germany GDP;
– today at 09:00 (GMT+2): Germany GfK Consumer Climate Index;
– today at 16:30 (GMT+2): speech by FOMC member Thomas Barkin.
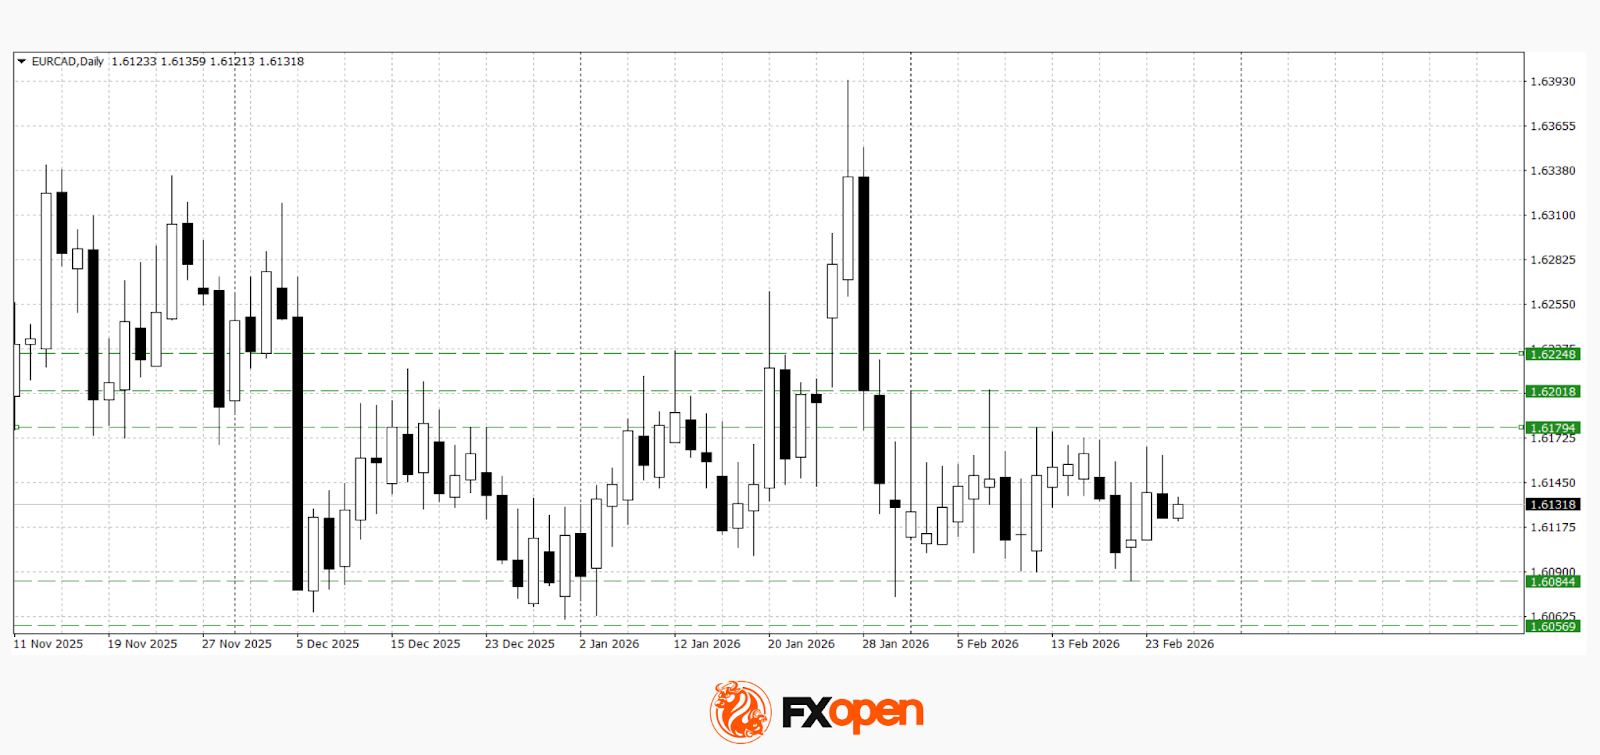
EUR/CAD
EUR/CAD has been trading sideways for more than a month. The pair is testing 1.6180 as resistance and 1.6080 as support. A break above the upper boundary could lead to further gains towards 1.6200–1.6230. Conversely, a move below 1.6080 may open the way for a retest of the psychological 1.6000 level.
Key events for EUR/CAD:
– today at 15:30 (GMT+2): Canadian corporate profits;
– today at 17:30 (GMT+2): US crude oil inventories;
– tomorrow at 15:30 (GMT+2): Canadian wholesale sales.
Trade over 50 forex markets 24 hours a day with FXOpen. Take advantage of low commissions, deep liquidity, and spreads from 0.0 pips (additional fees may apply). Open your FXOpen account now or learn more about trading forex with FXOpen.
This article represents the opinion of the Companies operating under the FXOpen brand only. It is not to be construed as an offer, solicitation, or recommendation with respect to products and services provided by the Companies operating under the FXOpen brand, nor is it to be considered financial advice.

Shiba Inu is back in focus after on-chain data showed a large holder moving hundreds of billions of tokens to a centralized exchange, raising fresh concerns about potential sell pressure.
Summary
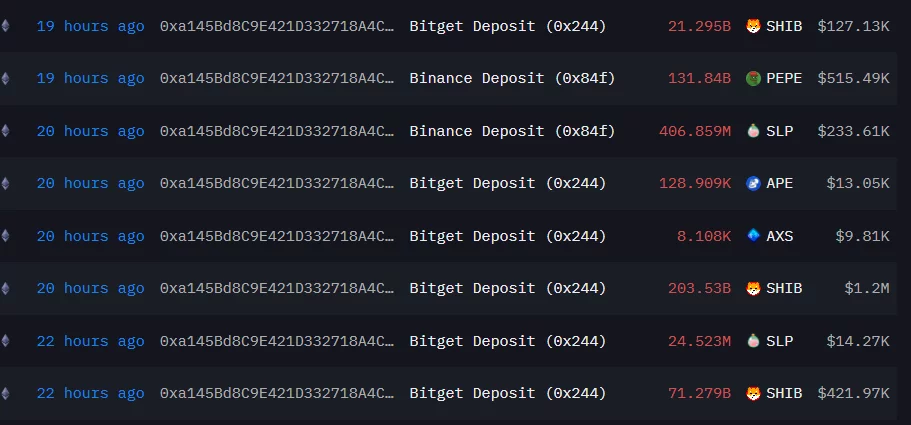
- On-chain data from Arkham shows a whale transferred roughly 370 billion SHIB to Binance and Bitget deposit addresses, raising concerns about potential sell pressure.
- SHIB is trading near $0.00000601, holding short-term support at $0.00000580–$0.00000590, with resistance at $0.00000640 and $0.00000700.
- Indicators remain cautious: the Awesome Oscillator is still negative but weakening, while the MFI around 44 signals limited buying momentum.
According to data from Arkham Intelligence, a whale address deposited roughly 370 billion SHIB to exchange wallets in a series of transactions over the past 24 hours. The transfers, routed to both Binance and Bitget deposit addresses, totaled several million dollars in value.
Large exchange inflows are often interpreted as a sign that a holder may be preparing to sell, as tokens moved off self-custody and onto trading platforms increase immediate circulating supply.
While it is not yet confirmed whether the whale intends to liquidate, the timing comes as SHIB continues to trade in a broader downtrend, adding weight to bearish sentiment.
Shiba Inu price action and key levels
On the daily chart, SHIB is currently trading near $0.00000601, consolidating after a prolonged slide from January highs near the $0.00000900 region.
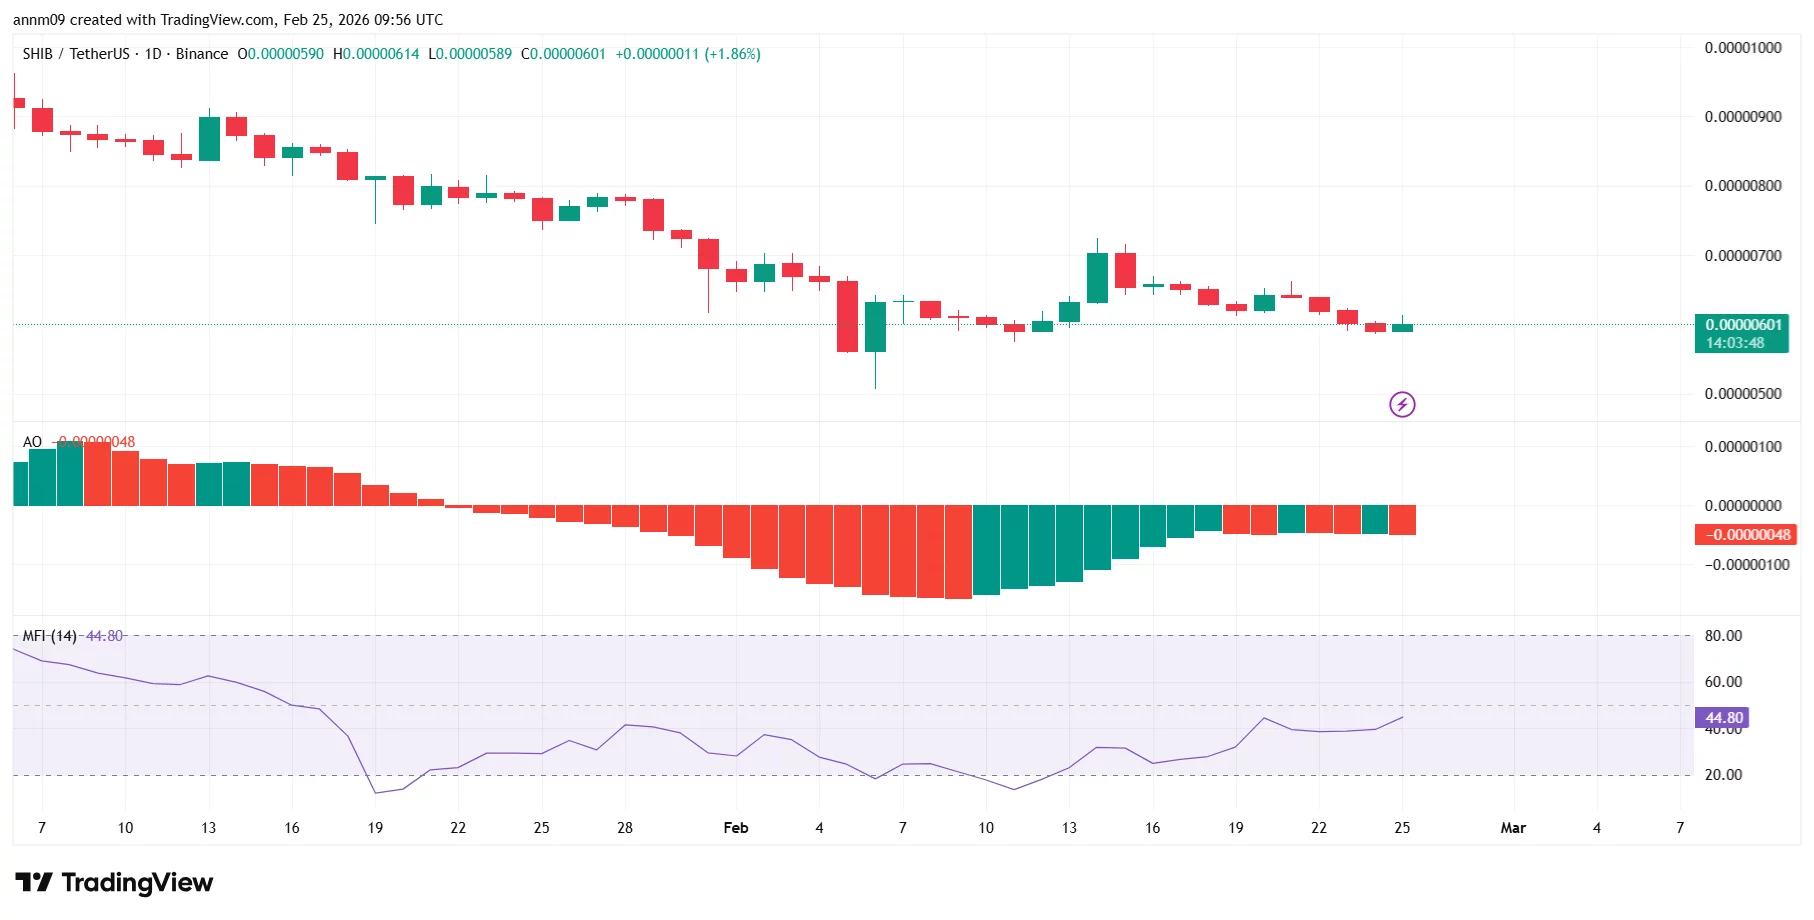
Price recently bounced from the $0.00000580–$0.00000590 support zone, which has acted as a short-term floor. A decisive breakdown below this region could expose the next psychological support around $0.00000550, followed by deeper support near $0.00000500.
On the upside, immediate resistance sits near $0.00000640, where recent daily highs were rejected. Above that, stronger resistance is clustered around $0.00000700, a level that capped the mid-February rebound.
Bulls would need a sustained move above $0.00000700 to shift short-term structure back in their favor.
Momentum indicators show tentative stabilization but no strong bullish reversal yet. The Awesome Oscillator (AO) remains slightly negative, though red histogram bars are shrinking, suggesting bearish momentum is weakening but not fully reversed.
The Money Flow Index (MFI 14) sits around 44, below the neutral 50 mark, indicating modest capital outflows and a lack of strong buying pressure.
Together, the indicators point to consolidation rather than immediate breakdown but they also fail to confirm a bullish shift.
If the 370B SHIB deposit translates into aggressive selling, pressure on the $0.00000580 support zone could intensify. A breakdown would likely accelerate downside momentum. However, if support holds and exchange inflows do not materialize into sustained sell volume, SHIB could remain range-bound between $0.00000580 and $0.00000640 in the near term.
For now, whale activity adds uncertainty but the chart suggests bears still hold the broader structural advantage unless key resistance levels are reclaimed.
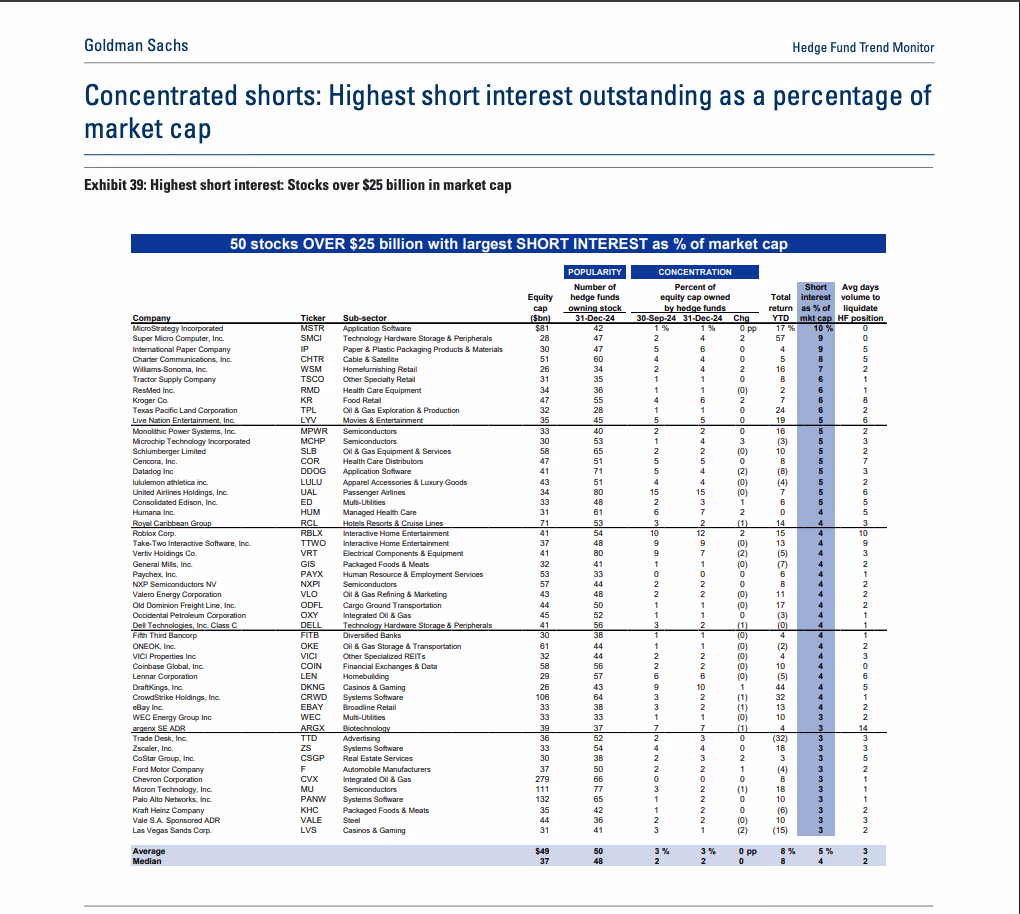
The market for Bitcoin-holder Strategy (MSTR) shares is among the most “heavily shorted,” a market slang term for dominance of bearish plays, according to FactSet and Goldman Sachs data. Yet the positioning may not reflect investor bias toward a continued price crash, per some observers.
According to the report released last week, bearish short bets on Strategy (MSTR) equaled 14% of its market capitalization of $34 billion at the time, making it the most shorted stock by that measure. Cryptocurrency exchange Coinbase (COIN) ranked fourth at 11% of its market cap. The report tracked positioning in stocks with market capitalization of over $25 billion.
This comes as Strategy is sitting on roughly a $7 billion unrealized loss on its bitcoin holdings. That figure, however, has no impact on the stock in the near term. Strategy began adding BTC to its balance sheet in 2020 and has since gobbled up 717,722 BTC, worth $47 billion. As of writing, its market cap stood closer at $42 billion, despite the stock falling 20% year-to-date.
One explanation for the elevated short interest offered by analysts is the basis trade – a strategy that seeks to profit from the price difference between two related markets. In this context, traders may bought bitcoin spot ETFs, like BlackRock’s IBIT, while simultaneously shorting the MSTR stock. to profit from a narrowing of MSTR’s premium to its BTC holdings narrows, plus any funding from paired futures if layered on, while staying market neutral.
“I suspect a lot of this short interest is still MSTR / BTC basis trade. Jane Street, in particular, has recently acquired a conspicuously large IBIT position,” Brian Brookshire, specialist in bitcoin treasury companies, said.
According to recent 13F filings, Jane Street purchased more than 7 million shares of BlackRock’s iShares Bitcoin Trust. It also held a large position in MSTR.
If Brookshire’s instincts hold, Jane Street’s purchases of IBIT could be a part of the carry/basis trade, paired with short positions in MSTR.
So far this year, that trade would have not worked. The MSTR-to-IBIT ratio is up about 12%, meaning MSTR has outperformed IBIT on the downside. MSTR is down 20% year to date, while IBIT has fallen 27%.

Solana exchange-traded funds (ETFs) are diverging from broader crypto ETF trends this month. While demand for Bitcoin and Ethereum products has shown signs of cooling, Solana-linked funds have maintained steady inflows.
The shift comes amid heightened volatility in digital asset markets. With macro uncertainty weighing on investor sentiment, ETF flows may be offering a signal of where institutional capital is positioning in the short term.
Solana ETF Streak Stands Out in Volatile Crypto Market
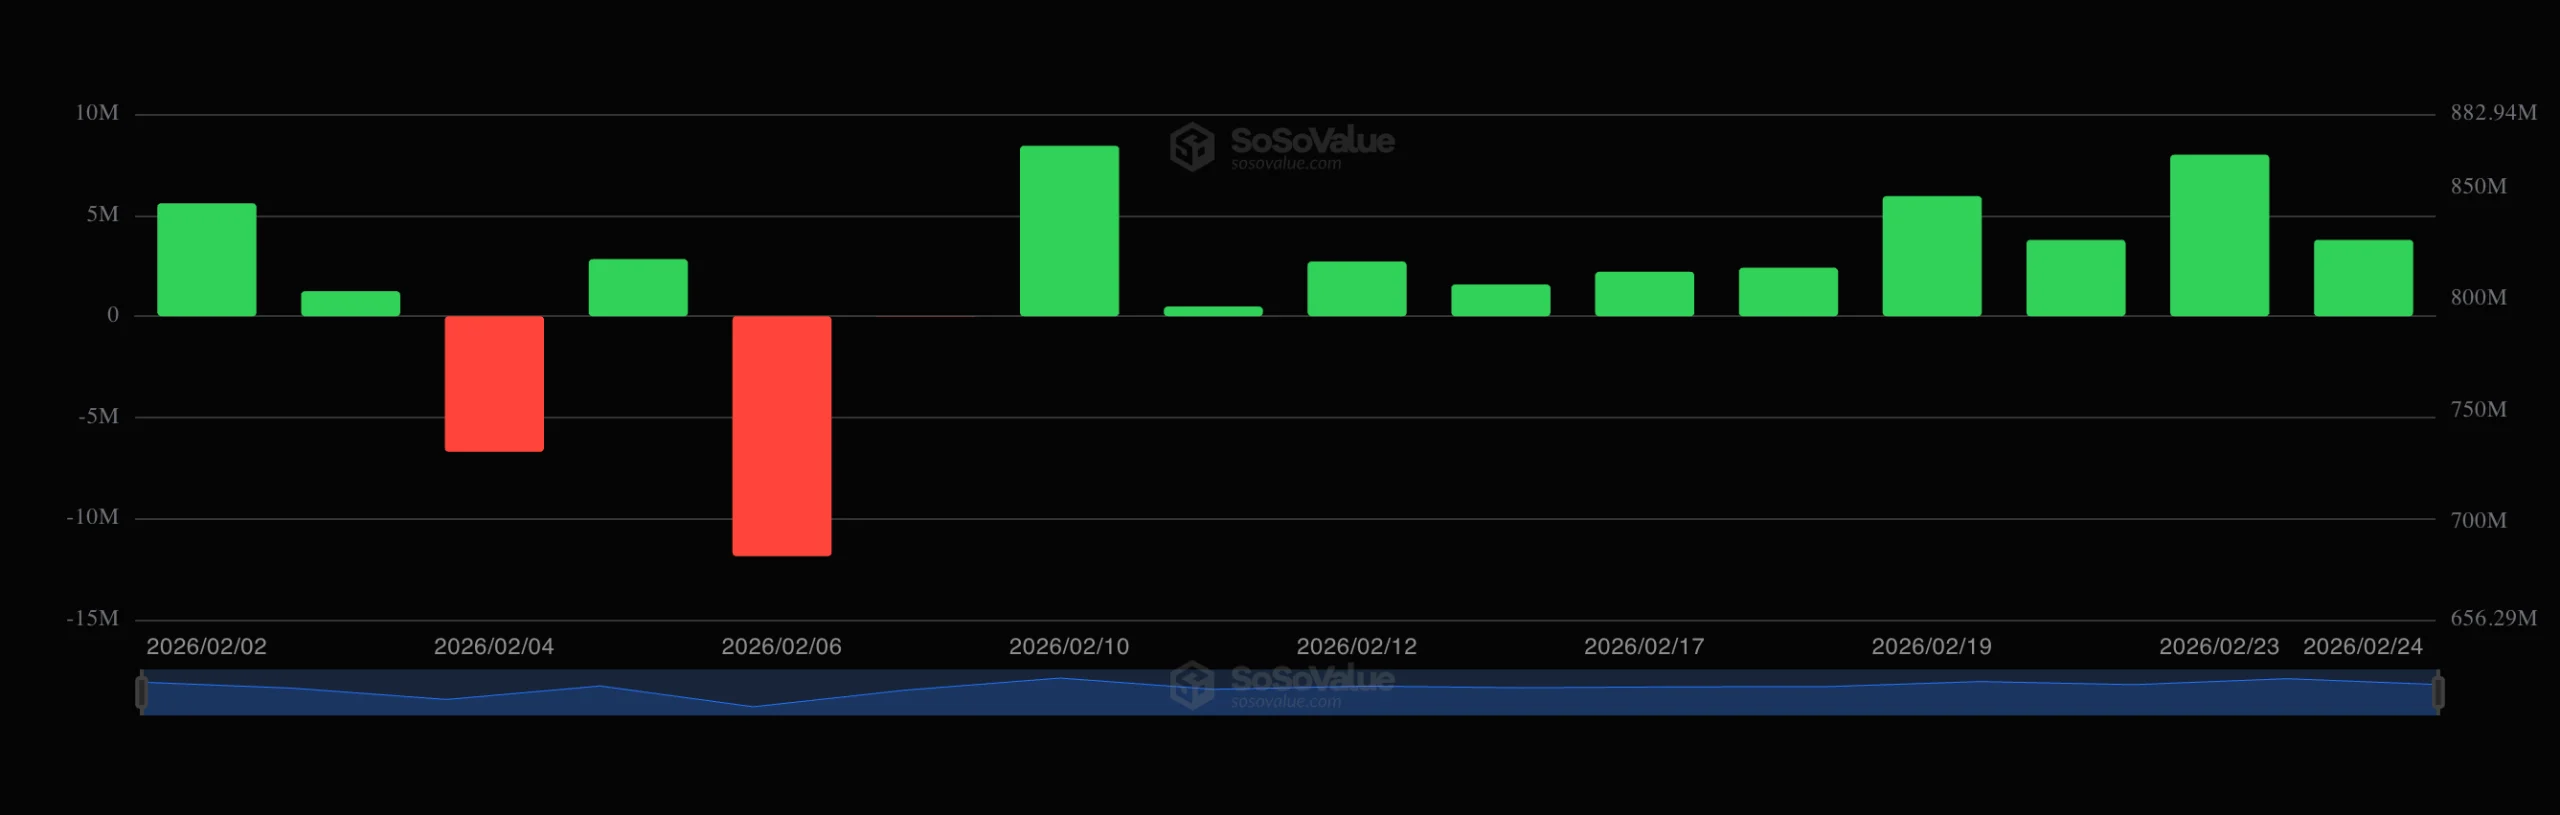
According to data from SoSoValue, Solana ETFs have recorded consecutive inflows since February 10. As of February 24, the products have logged only three red days this month. Overall, the ETFs have pulled in $30.33 million.
The streak stands out against the more uneven performance seen in larger crypto ETFs during the same period.
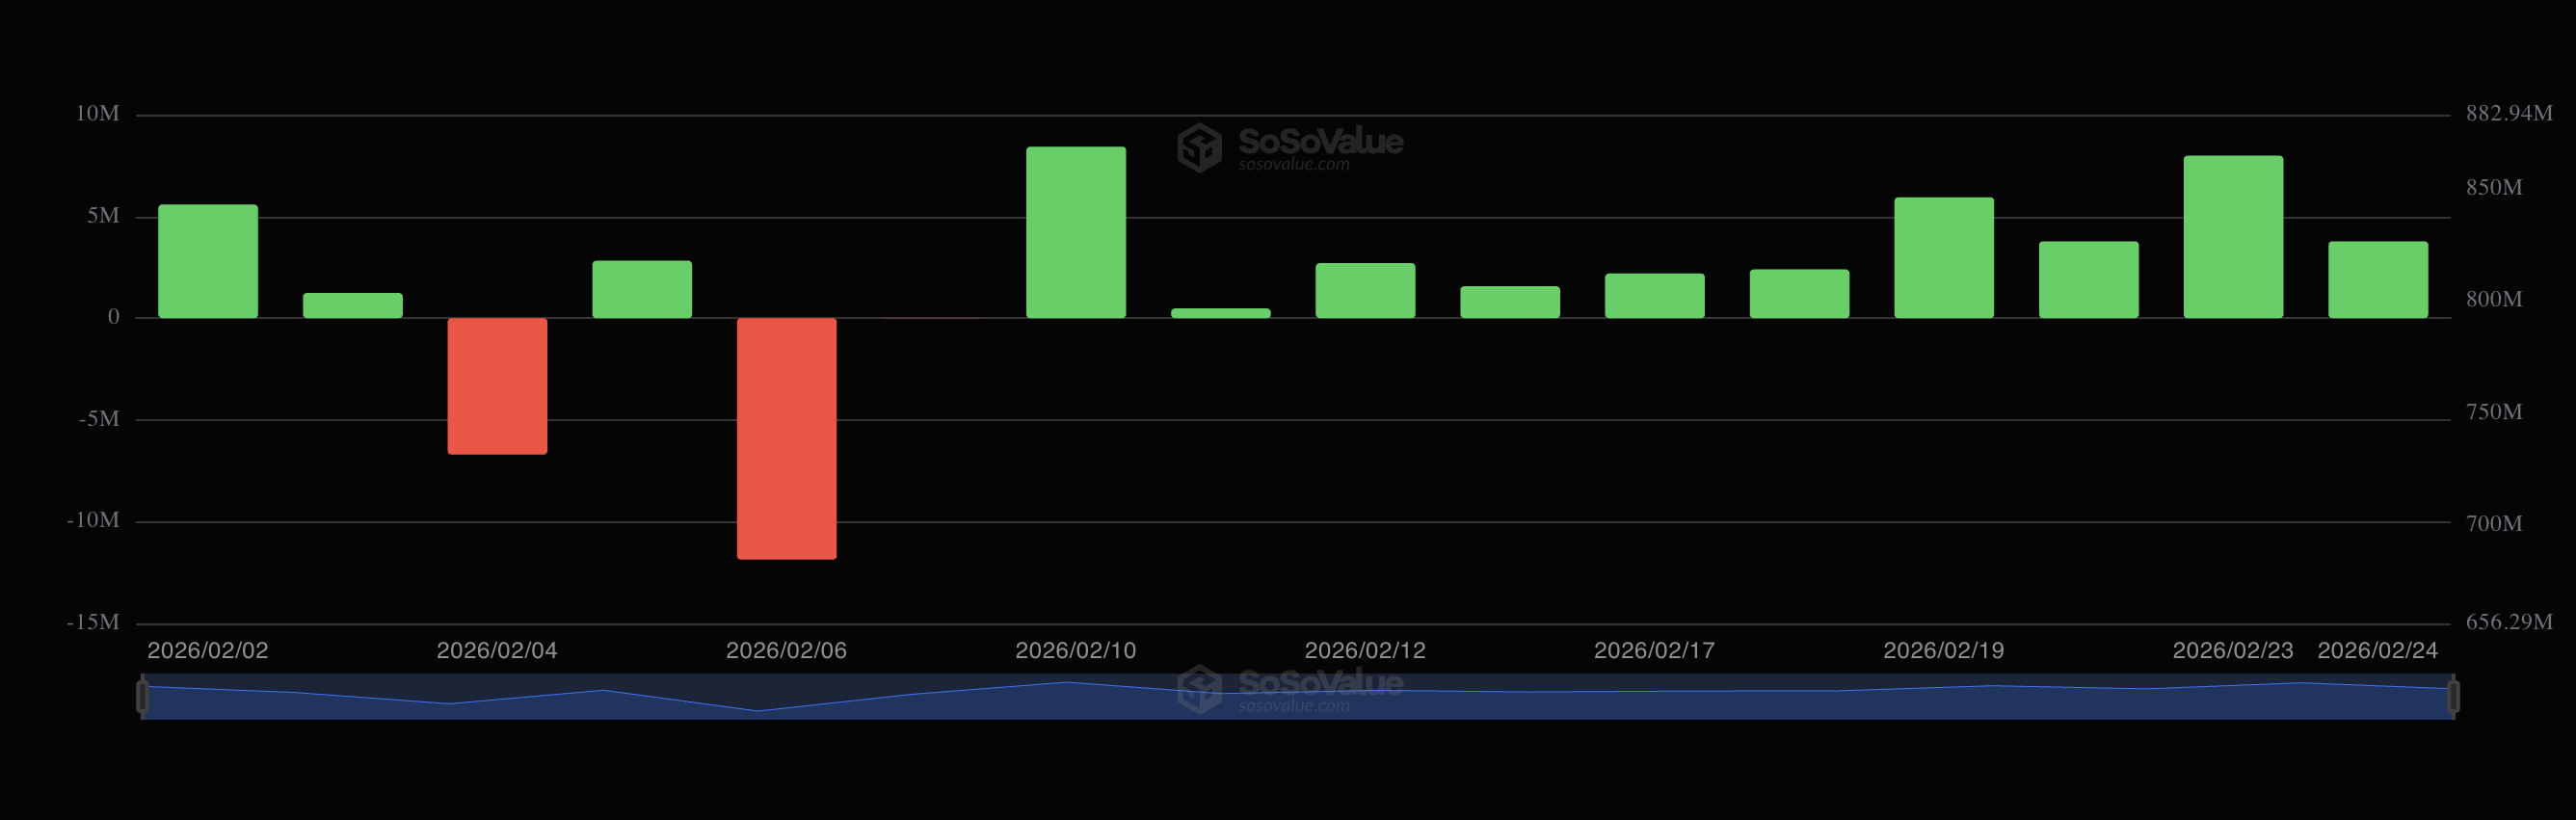
Bitcoin ETFs have posted mixed results in February. Inflows were recorded on seven trading days this month. Ethereum ETFs have followed a similar pattern, reflecting inconsistent demand rather than sustained accumulation.
Despite those positive sessions, cumulative flows remain deeply negative. So far this month, Bitcoin ETFs’ net outflows stand at $939.94 million. In addition, Ethereum ETFs recorded outflows of $490.58 million.
When compared to other altcoin products, Solana’s performance also appears relatively stronger. XRP-linked ETFs have experienced outflows on three trading sessions this month while recording zero flows on four days.
Although the number of positive sessions is comparable, the consistency of Solana’s streak since mid-February remains notable.
Nonetheless, it is important to contextualize the data. In absolute dollar terms, inflows into Solana ETFs remain smaller than those seen in Bitcoin products.
Bitcoin and Ethereum ETFs continue to command the majority of institutional crypto exposure and overall capital allocation. However, consistency in flows can indicate relative resilience in demand during periods of broader uncertainty.
The steady inflows into Solana products suggest that some investors are maintaining or selectively increasing exposure to higher-beta assets, even as flagship crypto ETFs experience uneven demand. Still, the divergence may reflect short-term capital rotation rather than a structural shift in institutional positioning.
SOL Price Remains Under Pressure
Despite the ETF inflows, Solana’s price performance has continued to reflect broader market weakness. Like most major digital assets, SOL has trended downward over the past month, declining 32.8%.
The altcoin saw a modest recovery today, rising more than 7% as total crypto market capitalization expanded by approximately $32 billion. At press time, SOL was trading at $82.15.
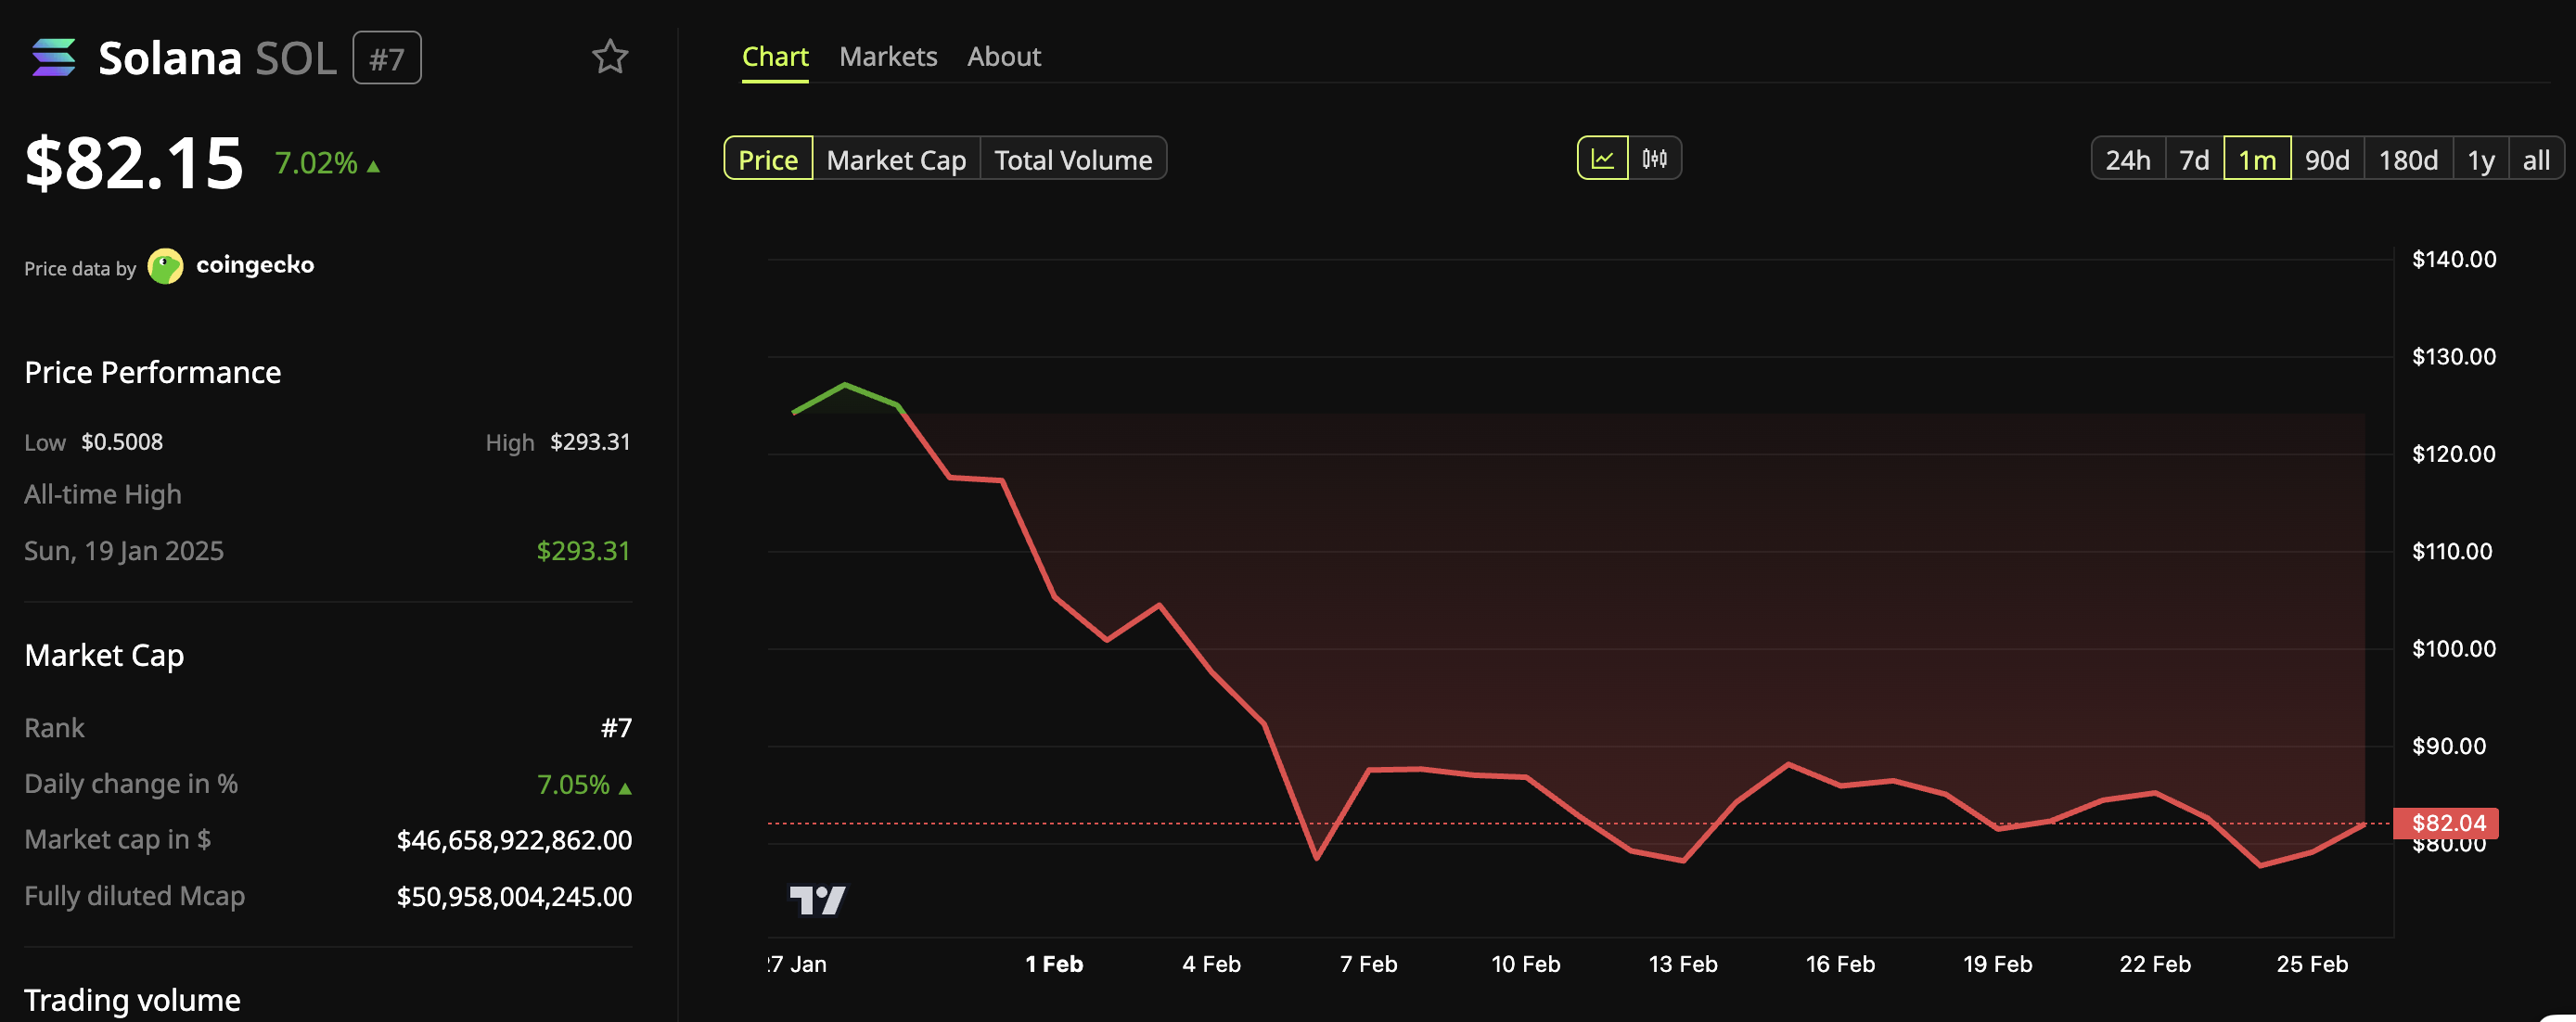
However, technical analysts remain cautious on the asset’s near-term outlook. Market commentator Alejandro suggested that Solana’s next downside target could be $45.
Whale Factor described the token as entering a high-probability “make or break” zone on the 4-hour chart. According to the analysis, SOL’s wedge formation is “reaching maximum exhaustion,” signaling a potential volatility squeeze at a critical inflection point.
The analyst outlined two possible scenarios:
“Bull Case: Clean break and retest of $82 targets the $97-100 macro resistance. Bear Case: Failure to hold the $78 support level opens the door for a retest of $68.”
Whether Solana will extend its recovery or face renewed downside pressure remains to be seen.
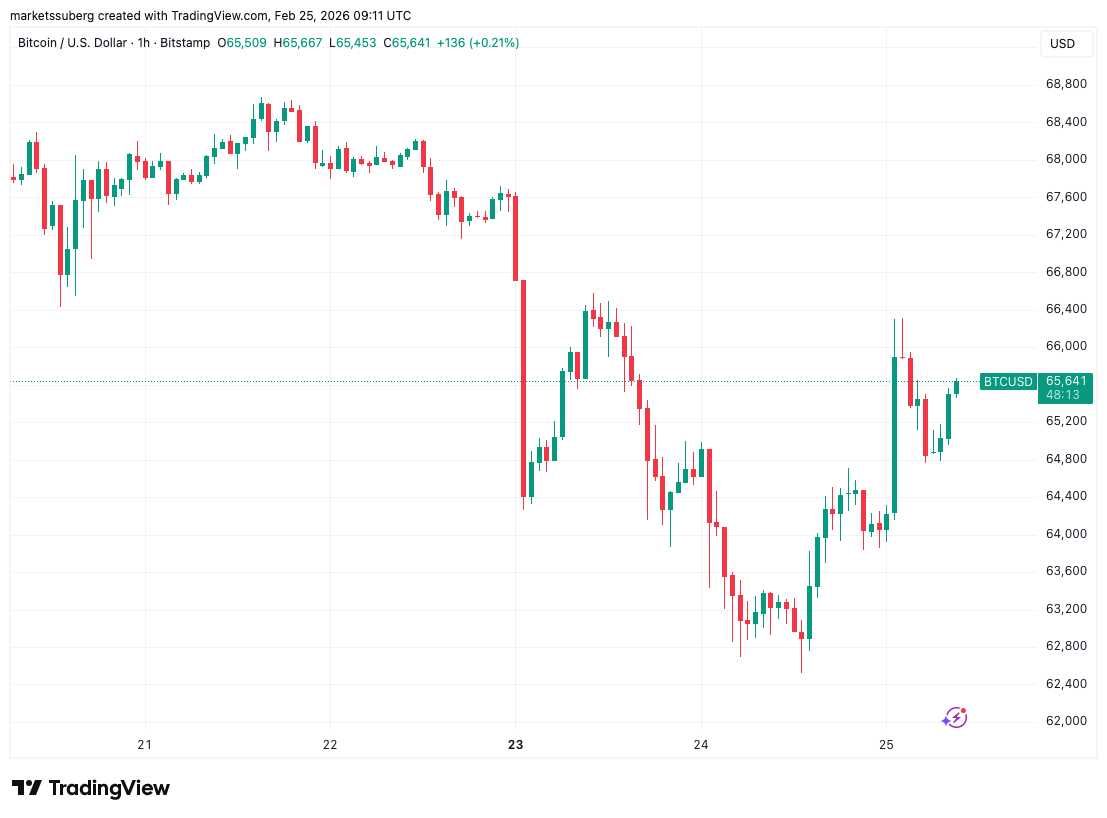
Bitcoin (BTC) sought to reclaim $65,000 as support into Wednesday’s Wall Street open as rumors swirled around US institutional pressure.
Key points:
-
Bitcoin bounces 2.5% as talk turns to alleged selling pressure from Wall Street trading company Jane Street.
-
Jane Street rebuts claims of crypto market manipulation during the 2022 bear market.
-
“Razor thin” order books boost BTC price volatility.
Bitcoiners debate Jane Street “10am price slam”
Data from TradingView tracked a BTC price rebound, taking BTC/USD to $66,300 on Bitstamp before the pair consolidated.

Daily price gains remained at more than 2% at the time of writing, while crypto market participants became increasingly interested in potential deliberate BTC price suppression.
A theory circulating on social media revolved around secretive quantitative investment firm Jane Street, now subject to legal action by defunct crypto company Terraform Labs.
Coordinated algorithmic selling of Bitcoin at 10am Eastern time daily, it alleged, provided the main impetus for months of BTC price downside beginning in October 2025.
What Happened Today:
>Jane Street was exposed for massive manipulation of the crypto market and for being behind the TerraLuna collapse.
>An insider leaked that they were forced to shut down their trading algos.
> no 10am price slam for the first time.
>8pm, Bitcoin…
— AMCrypto (@AMCryptoAlex) February 25, 2026
Amid the ongoing legal proceedings, Jane Street may have been forced to suspend its trading strategy, leaving the market to adjust higher.
The Terraform Labs complaint makes specific reference to “market manipulation” that impacted crypto throughout 2022, the year in which Bitcoin put in its last bear market bottom of $15,600 in Q4.
Jane Street told Cointelegraph that the accusations were “baseless, opportunistic claims.”
The 10am argument, meanwhile, failed to convince many. Crypto YouTuber Wise Advice was among them, suggesting that the theory was too simplistic to be valid.
🚨 Everyone on CT right now:
“Jane Street got sued.”
“10AM manipulation stopped.”
“ $BTC finally free.”Do you really think they’re that stupid?
You’re talking about Jane Street.
A top quant firm.
And they supposedly:• Ran a visible daily pattern
• Let everyone track it…— Wise Advice (@wiseadvicesumit) February 25, 2026
BTC price versus “razor thin” liquidity
Commenting on the latest BTC price move, traders remained cautious.
Related: Bitcoin ETF sell-off is ‘purification’ of bull case, investor says
“$BTC is facing major resistance at $66k – from both the local range lows and the 4h trend,” trader Jelle wrote in his latest analysis on X.
“Flipping that could spark short-term relief, but until that happens, the trend is clear. Don’t fight it.”

Keith Alan, cofounder of trading resource Material Indicators, said that a “razor thin order book” on exchanges had contributed to the price rebound.
Overhead sell liquidity, he told X followers, had been pulled in advance of US President Donald Trump’s State of the Union address.
Looks like we got a roof pull just before Trump’s State of the Union Address, and $BTC price ripped through a razor thin order book. pic.twitter.com/bgBtwg6aaZ
— Keith Alan (@KAProductions) February 25, 2026
The 24-hour crypto liquidations totaled $333 million at the time of writing, per data from CoinGlass, with shorts accounting for $213 million of that figure.

This article does not contain investment advice or recommendations. Every investment and trading move involves risk, and readers should conduct their own research when making a decision. While we strive to provide accurate and timely information, Cointelegraph does not guarantee the accuracy, completeness, or reliability of any information in this article. This article may contain forward-looking statements that are subject to risks and uncertainties. Cointelegraph will not be liable for any loss or damage arising from your reliance on this information.
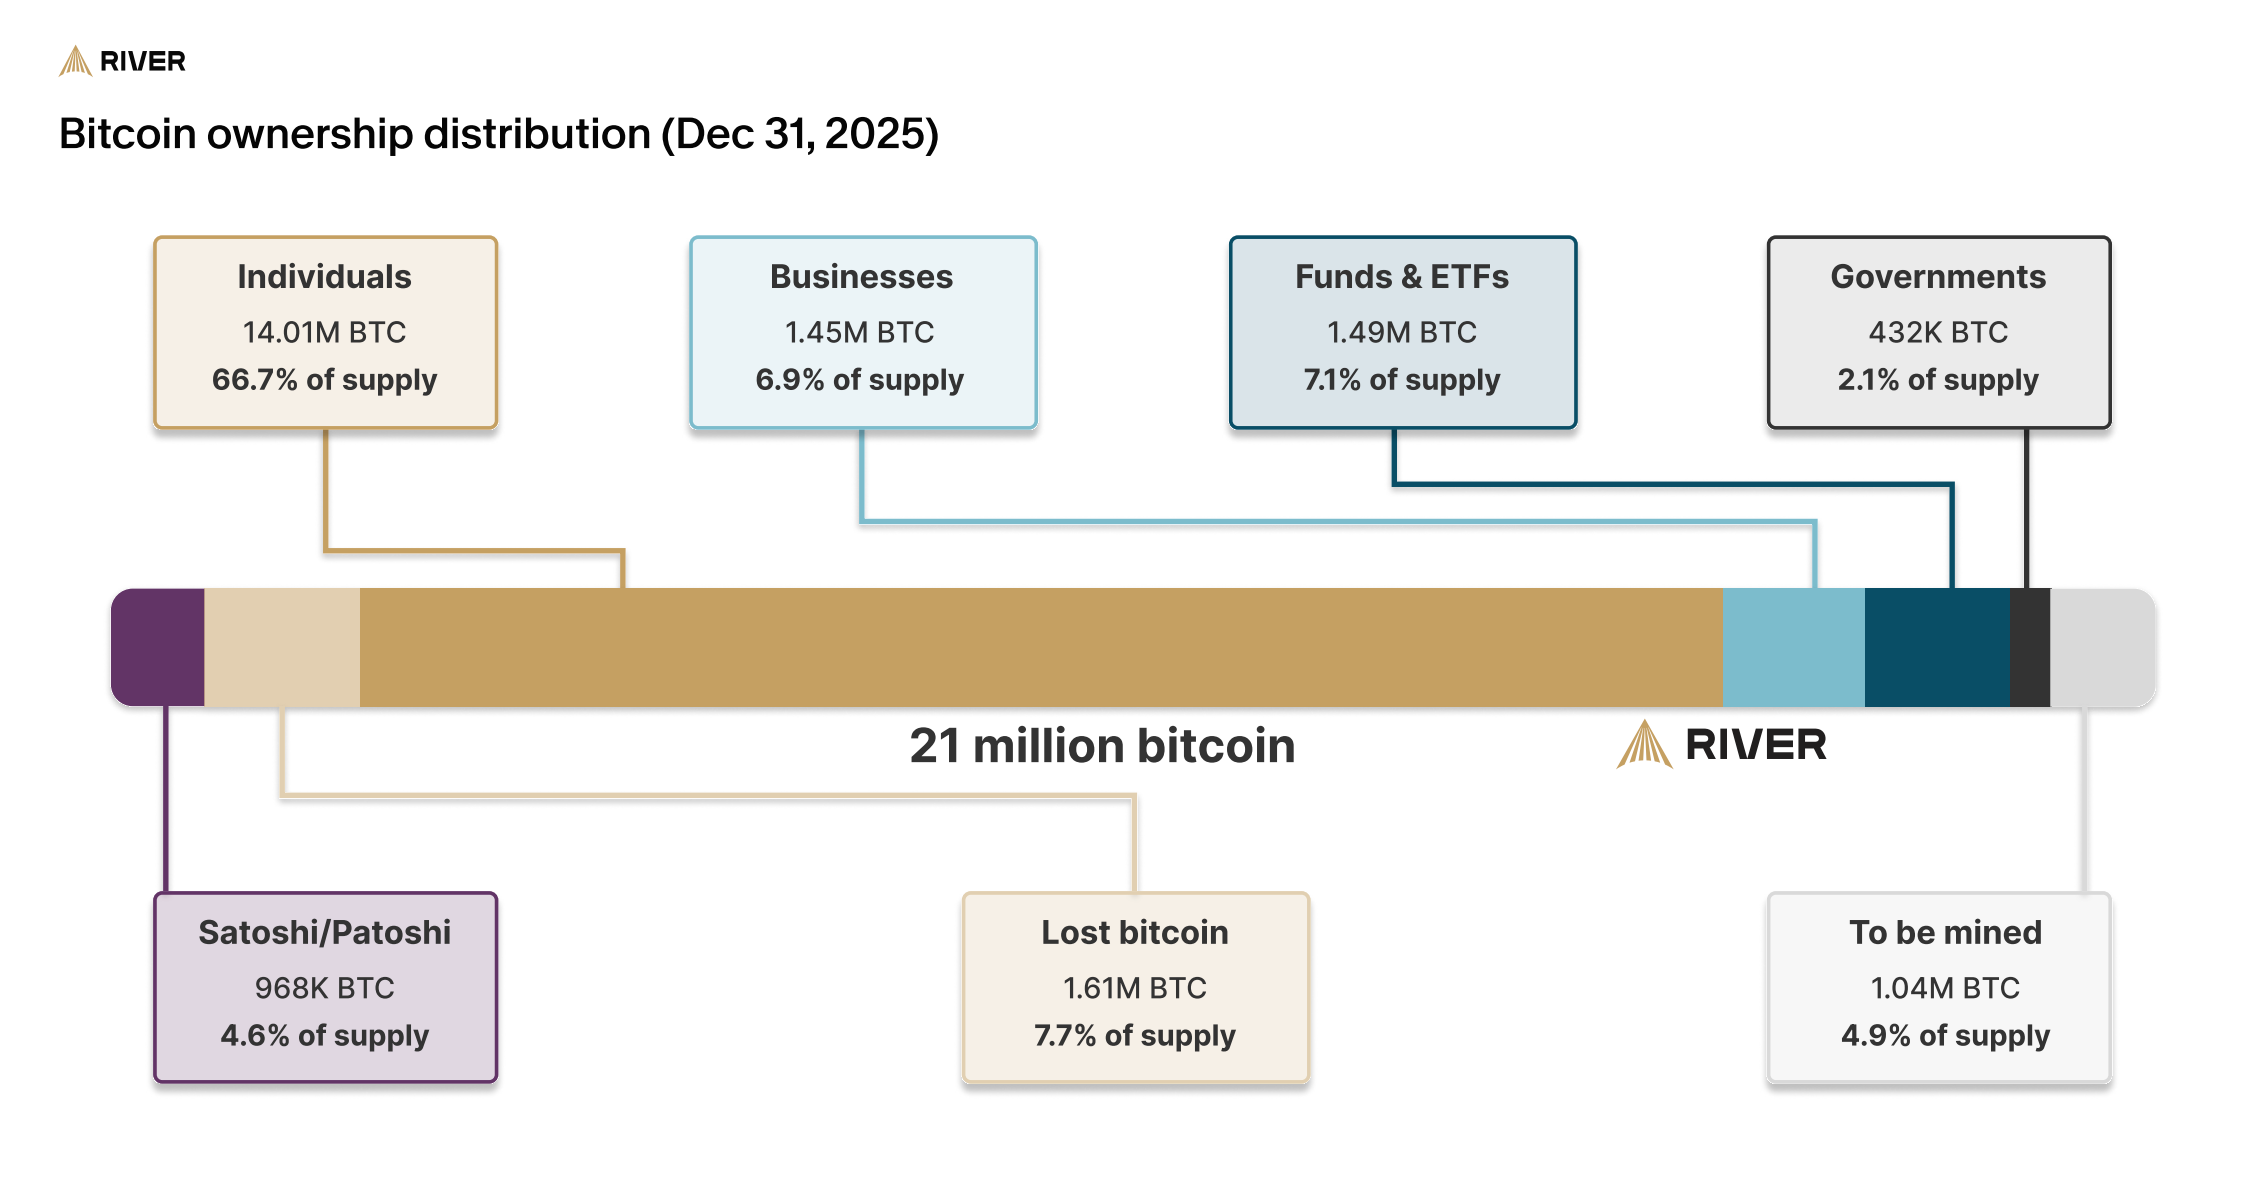
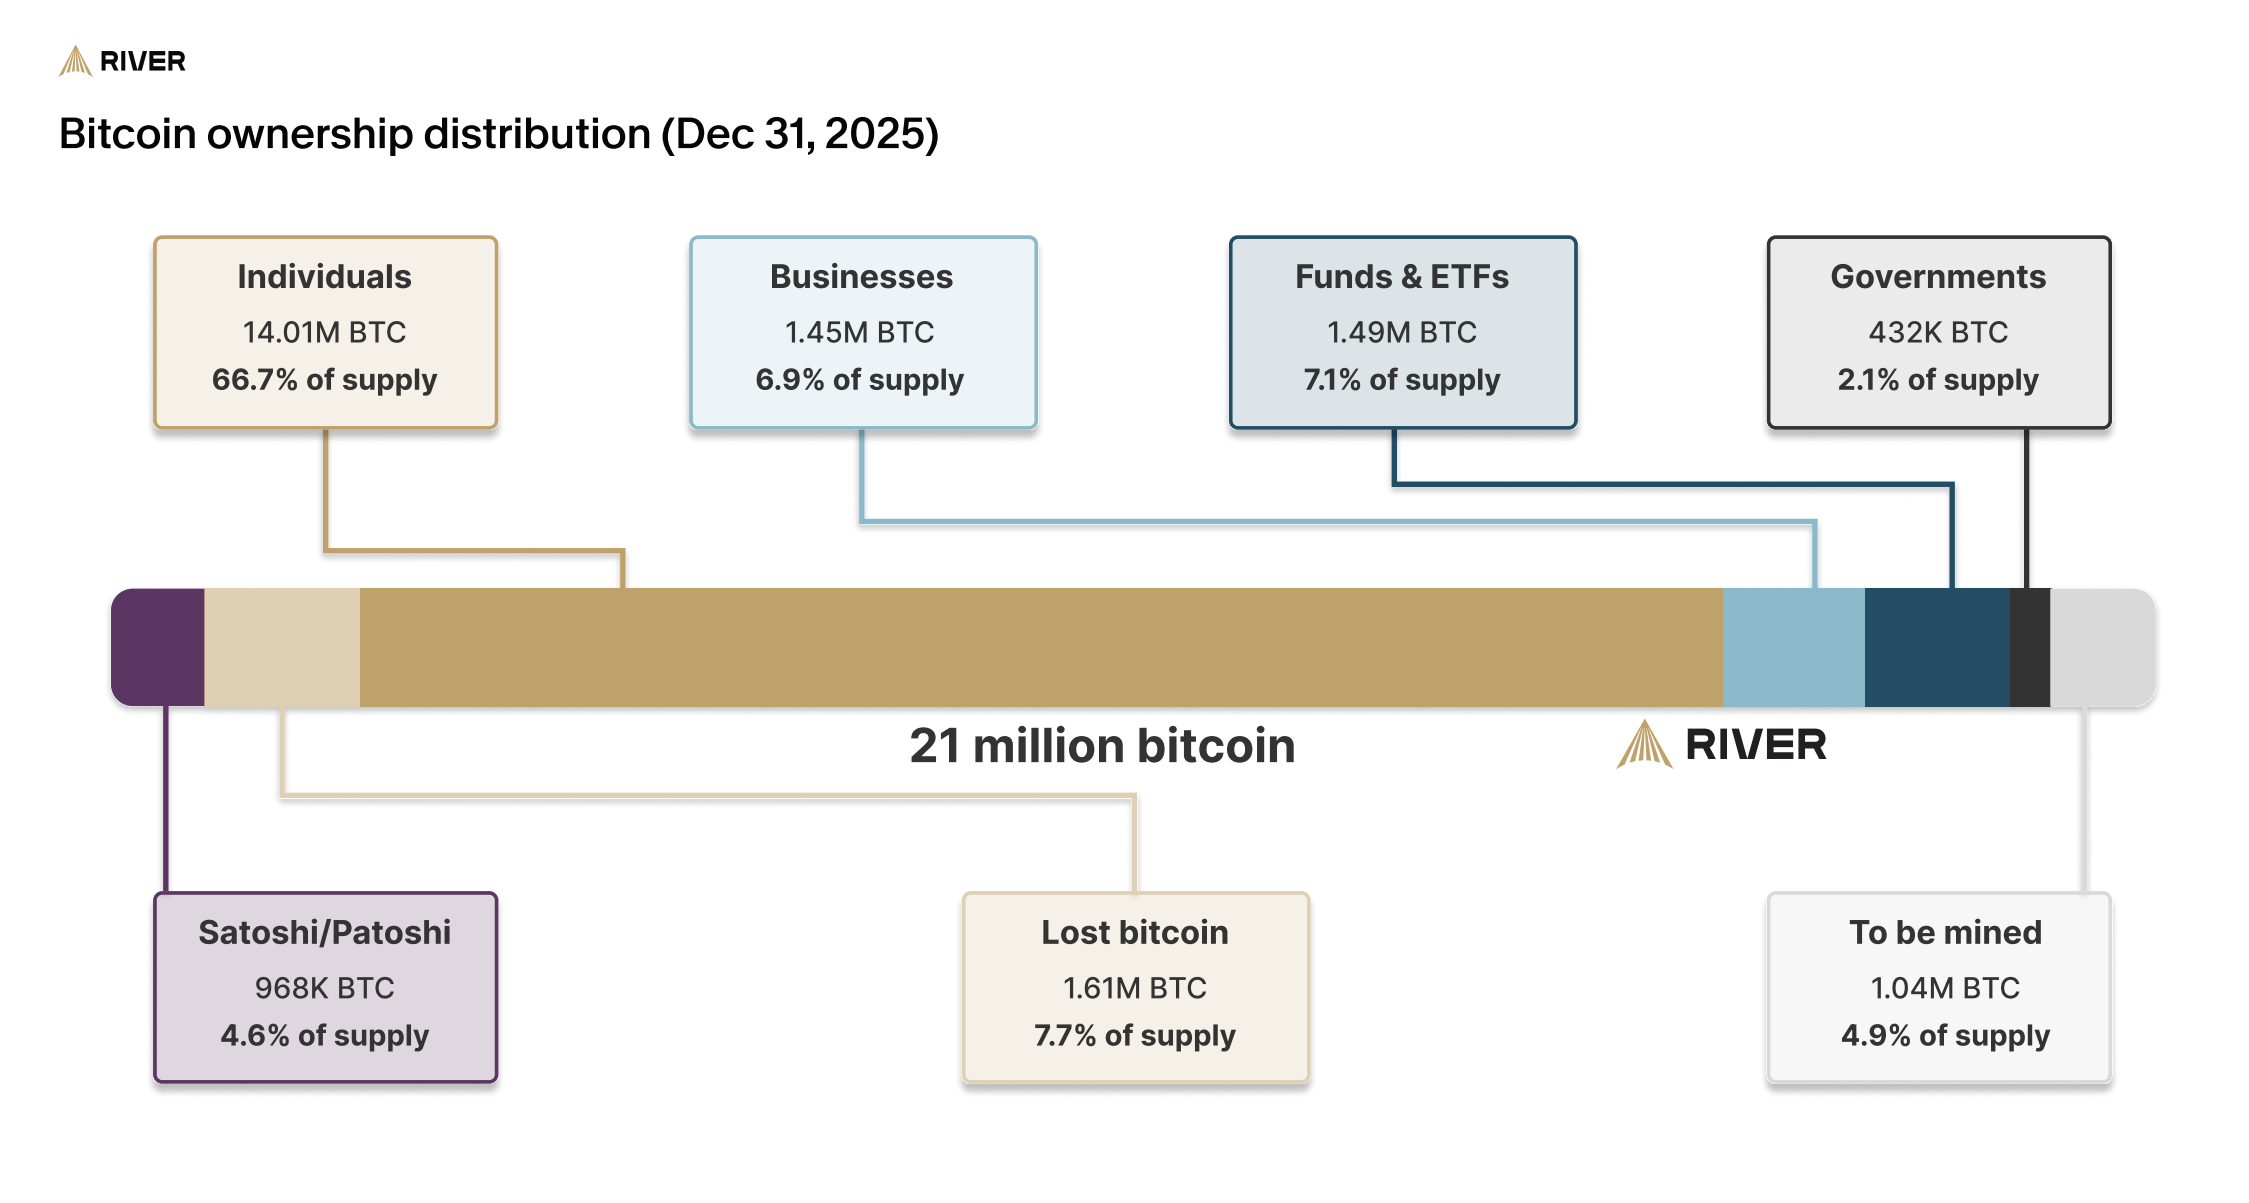
Bitcoin (BTC) continued its downward trajectory in February, trading at $64,492, nearly 50% below its early October all-time high (ATH) price.
Yet, price action tells only part of the story. According to River, Bitcoin adoption accelerated last year, with institutions, banks, merchants, public companies, and even nation-states increasing their exposure.
Is Bitcoin’s 50% Decline Masking a Structural Bullish Trend?
BeInCrypto recently reported that the crypto market has slipped into extreme fear, with retail investors growing increasingly pessimistic about Bitcoin’s price. This sentiment is reflected in a surge of “Bitcoin going to zero” searches, which recently reached an all-time high.
The price drawdown has also weighed on institutional participants. Crypto hedge funds have pulled back from the market.
“With Bitcoin and ETH continuing to slide, crypto hedge funds have retreated to cash. Their average cash levels are currently 15.32%, the highest in almost a year,” Nic Puckrin, co-founder of Coin Bureau, told BeInCrypto.
Moreover, recent disclosures show that in Q4 2025, institutional investors also trimmed their Bitcoin exchange-traded fund (ETF) exposure.
However, when viewed from a broader perspective, the long-term adoption trajectory remains constructive. In a recent market report, River highlighted that the largest cryptocurrency’s adoption surged in 2025.
“There is no bear market in bitcoin adoption. Bitcoin is down 50% from all-time highs, but adoption is compounding in ways that aren’t affecting the price, yet,” the post read.
According to River, institutions collectively added approximately 829,000 BTC in 2025. This figure includes purchases from businesses, governments, funds, and ETFs.
Registered investment advisors allocated close to $1.5 billion per quarter into Bitcoin ETFs over the past two years. Notably, none of those quarters recorded net outflows.
Although exposure among RIAs is widespread, with 29 of the 30 largest US firms holding positions, portfolio allocations remain minimal, averaging 0.008%.
Businesses emerged as the largest buyers in 2025. They added $54 billion worth of Bitcoin to their balance sheets during the year.
Bitcoin treasury companies account for the majority of corporate holdings, collectively controlling 866,000 BTC. At the same time, the number of publicly listed firms with Bitcoin holdings rose to 194.
At the sovereign level, five nations became new Bitcoin holders in 2025, including purchases linked to two sovereign wealth funds, Luxembourg and Saudi Arabia, as well as the Czech Republic’s central bank. In total, 23 nation-states now hold Bitcoin.
“Trust in bitcoin has grown faster than that of any asset in history. What began as an experiment is now a globally recognized store-of-value, with adoption patterns that rival the internet,” River wrote.
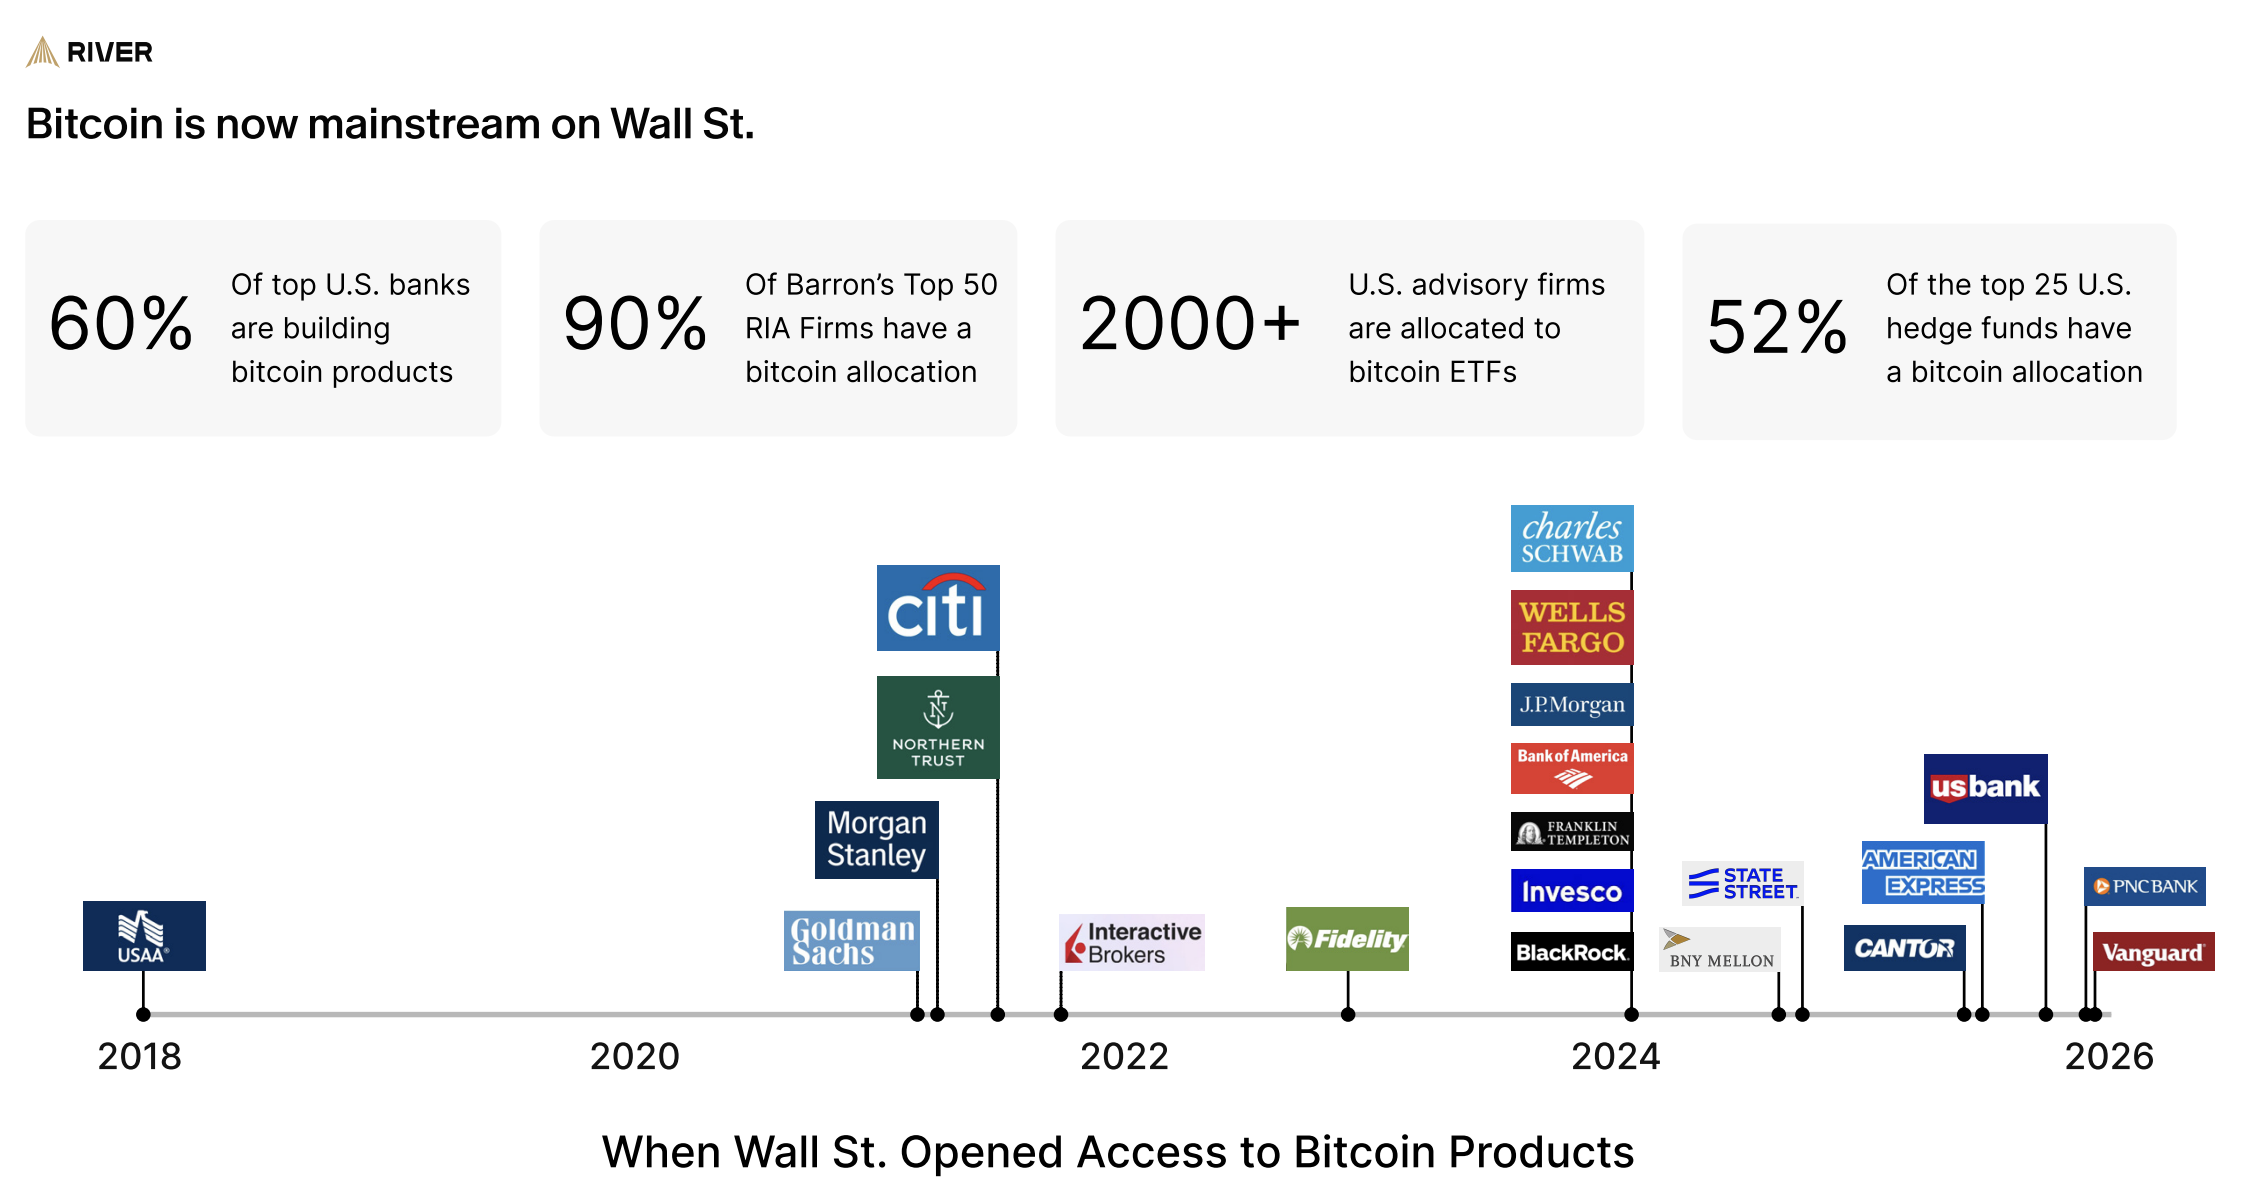
US Businesses Embrace Bitcoin Payments
Beyond direct accumulation, payment adoption expanded materially. The number of US merchants accepting Bitcoin payments tripled during the year. Furthermore, global usage increased by 74%.
Meanwhile, development activity within traditional finance continues. Approximately 60% of the 25 largest US banks are building Bitcoin products, indicating ongoing institutional integration.
River stated that the current wave of adoption is unlikely to trigger an immediate 10-fold price surge for Bitcoin. However, the firm argued that this type of steady integration may carry greater significance.
Looking ahead, River said it expects adoption to accelerate meaningfully over the coming years as broader participation deepens.


Meta targets H2 2026 for stablecoin creator payouts, enabled by Stripe’s Bridge under new U.S. rules.
Summary
- Meta plans to integrate third-party stablecoins for creator payouts across Facebook, Instagram and WhatsApp, focusing on ~$100 cross-border transfers.
- Stripe’s Bridge, acquired for ~$1.1b in 2024, just secured conditional OCC trust bank approval, enabling regulated stablecoin issuance and custody.
- The GENIUS Act, signed in 2025, created a federal framework for fully reserved payment stablecoins, giving Meta and Bridge clearer compliance rails.
Meta Platforms Inc. is preparing to integrate stablecoin payments across its social media platforms in the second half of 2026 through a third-party provider, CoinDesk reported, citing three people familiar with the plans.
The company has issued requests for proposals to external infrastructure firms, with Stripe emerging as the likely partner, according to the report. Stripe CEO Patrick Collison joined Meta’s board in April 2025.
The initiative marks a shift from Meta’s previous stablecoin effort. The company’s 2019 Libra project, later rebranded as Diem, faced intense regulatory opposition and was ultimately abandoned. Libra was designed as a global currency backed by a basket of assets, which regulators viewed as an attempt by a private company to build sovereign-scale monetary infrastructure.
According to Fortune reporting from May 2025, Meta CEO Mark Zuckerberg told Stripe’s John Collison that the Diem project was dead.
The current approach differs significantly from the earlier effort. Meta will not mint its own stablecoin but will instead integrate existing stablecoin infrastructure, positioning itself as a distribution channel rather than an issuer, according to a source who told CoinDesk the company wants to pursue the initiative “at arm’s length.”
The likely integration partner is Stripe’s Bridge platform, which received conditional approval from the Office of the Comptroller of the Currency for a national trust bank charter in February 2026.
The timeline of developments includes Stripe’s acquisition of Bridge for approximately $1.1 billion in October 2024, Collison’s appointment to Meta’s board in April 2025, and Bridge’s OCC conditional approval in February 2026, the same month Meta sent out requests for proposals.
In its 2025 annual letter, Stripe reported that Bridge’s transaction volume quadrupled as stablecoin adoption expanded beyond cryptocurrency market cycles. “Stablecoin payments are advancing quietly and inexorably as real-world uptake continues apace,” the company stated.
Meta’s focus centers on reducing costs for international creator payouts, particularly small transfers around $100 that currently face high wire transfer and foreign exchange fees. The company’s platforms, including Facebook, Instagram, and WhatsApp, serve approximately 3 billion users globally.
Stablecoin integration could reduce costs for cross-border settlements and accelerate payout speeds compared to traditional banking systems, according to the CoinDesk report. The move would also position Meta competitively against X and Telegram in developing super app functionality.
The regulatory environment has shifted since Meta’s earlier stablecoin attempt. The GENIUS Act, signed by President Donald Trump in July 2025, established the first federal legal framework for U.S. stablecoin issuers, contrasting with the regulatory opposition that existed between 2019 and 2022.
Bridge’s pursuit of an OCC charter reflects the new regulatory approach, operating within a federal framework rather than outside it.
Several implementation details remain unclear, including which specific stablecoins Meta will support, whether transactions will be on-chain or abstracted from blockchain infrastructure, how the company will handle wallet custody and compliance requirements, and whether non-U.S. markets will serve as initial testing grounds.
Meta declined to comment on the reported plans. Stripe did not immediately respond to requests for comment.

The second half of February has seen the dollar index strengthen, driven by a combination of bullish factors:
→ A hawkish Fed stance. Minutes from the latest FOMC meeting revealed differing views on rate cuts. With inflation remaining resilient, some members even left the door open to further tightening.
→ Rising tensions between the US and Iran, along with uncertainty surrounding trade tariffs, have boosted demand for the dollar as a safe-haven asset.
→ Recent data pointing to solid industrial output and labour market resilience have reinforced confidence in the strength of the US economy.
As a result, an upward trend line (shown in blue) has formed on the DXY chart, increasing the likelihood that the index will finish February in positive territory after three consecutive months of decline.
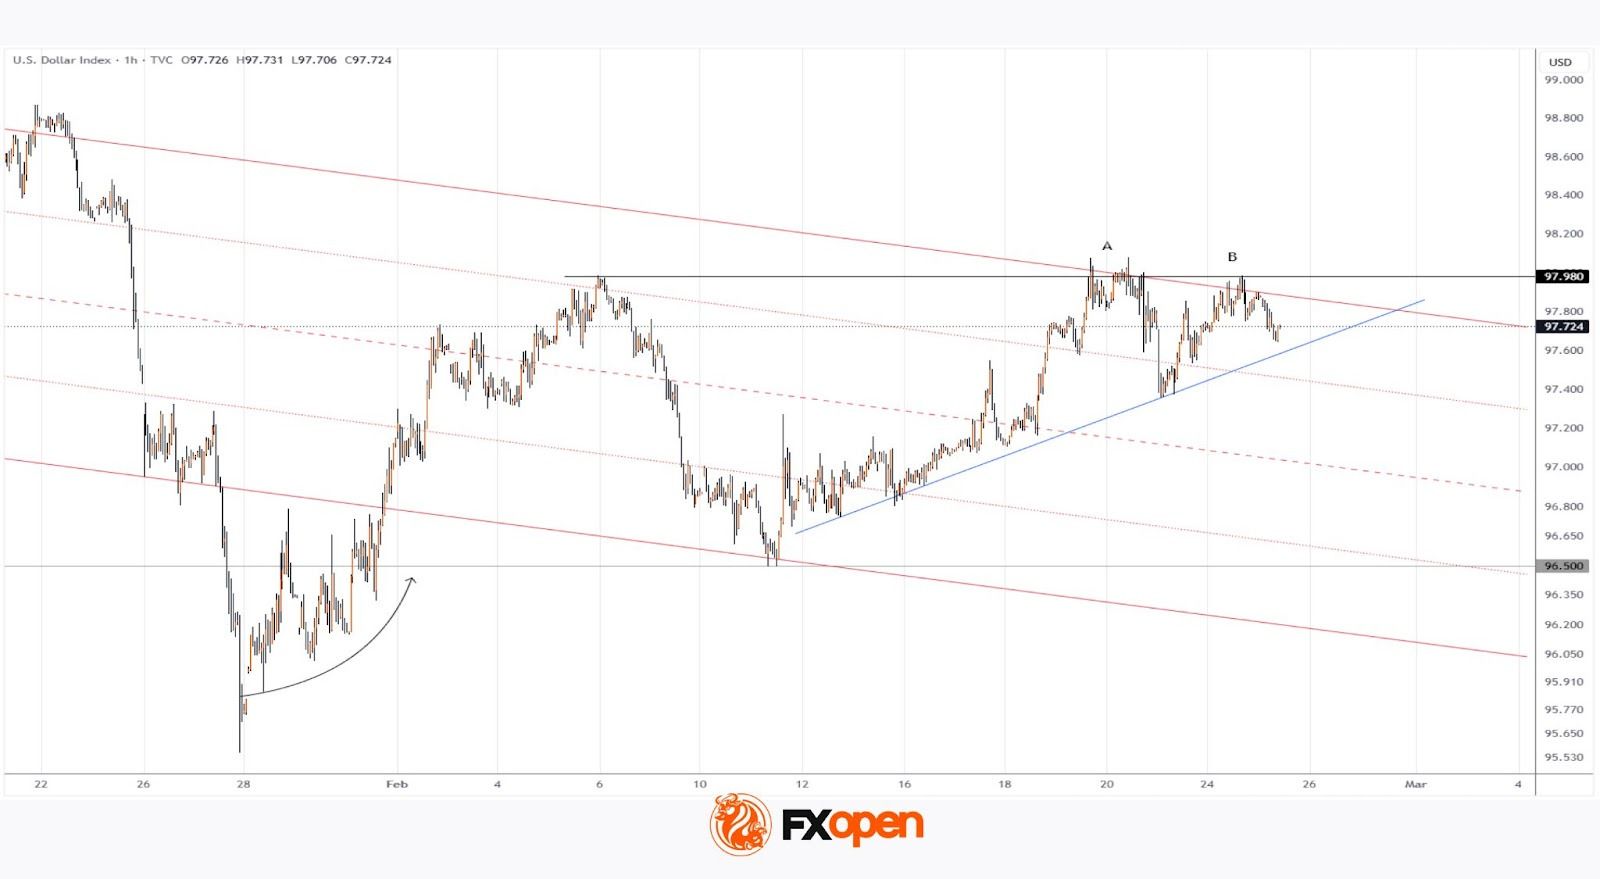
Technical Analysis of the DXY Chart
On 16 February, when analysing the dollar index (DXY), we:
→ Updated the descending channel (marked in red), originating in November 2025.
→ Highlighted strong demand, reflected in the confident upward trajectory (shown by the arrow) following the brief break below the multi-month low of 96.50 in late January.
Lower highs at points A and B suggest that the upper boundary of the channel continues to act as resistance, while the hesitant price action after breaking the 5 February high indicates waning bullish momentum. This raises the possibility that the blue uptrend line could soon come under pressure from renewed bearish attempts.
On the other hand, there are clear signs of active demand near the key 96.50 level. Therefore, in the longer term, bulls may regain strength and attempt to overturn the broader downtrend.
Trade global index CFDs with zero commission and tight spreads (additional fees may apply). Open your FXOpen account now or learn more about trading index CFDs with FXOpen.
This article represents the opinion of the Companies operating under the FXOpen brand only. It is not to be construed as an offer, solicitation, or recommendation with respect to products and services provided by the Companies operating under the FXOpen brand, nor is it to be considered financial advice.

Aerodrome Finance price climbed 12% over the past 24 hours, drawing renewed attention from traders. Despite the sharp uptick, AERO remains locked in a broader sideways structure.
This consolidation phase reflects cautious optimism rather than confirmed breakout strength. While short-term momentum improved, sustained upside requires stronger follow-through.
AERO Holders Exhibit Optimism
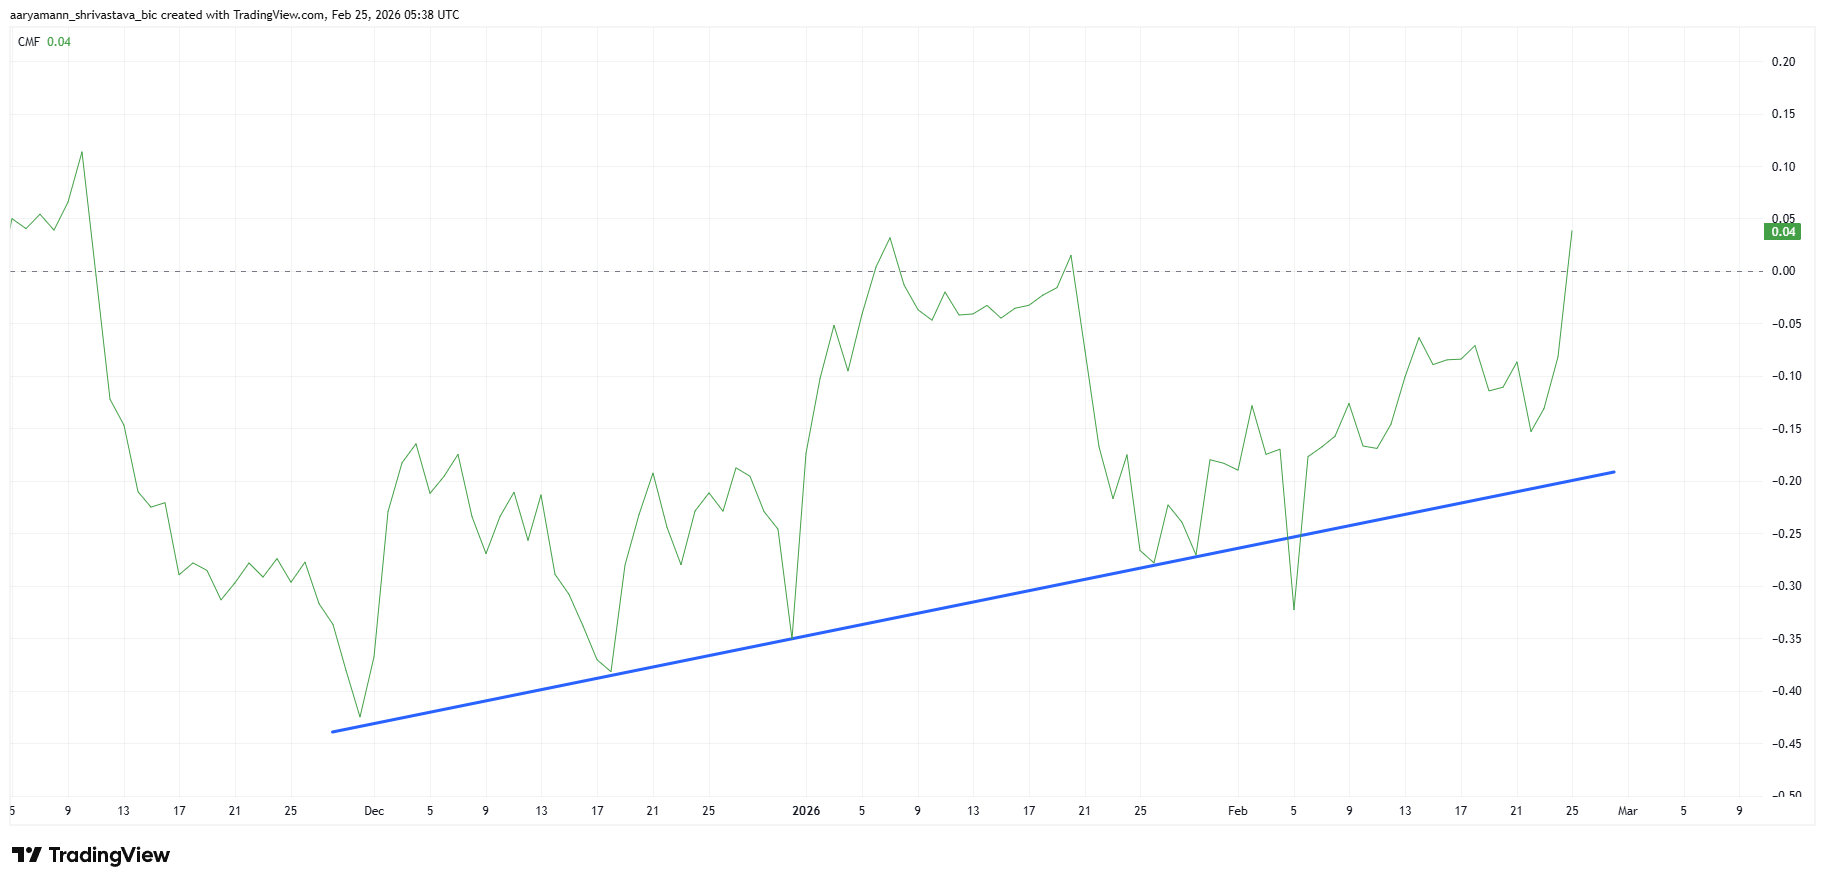
The Chaikin Money Flow indicator signals improving macro sentiment for Aerodrome Finance. Outflows that peaked around early December 2025 have steadily declined. Inflows now dominate, suggesting capital is returning to AERO. This shift indicates investors are gradually rebuilding exposure.
CMF currently sits at a three-and-a-half-month high. Elevated readings often reflect sustained buying pressure rather than short-lived speculation. Strengthening inflows point to growing confidence among participants. This macro bullishness may provide structural support for further price appreciation.
Want more token insights like this? Sign up for Editor Harsh Notariya’s Daily Crypto Newsletter here.
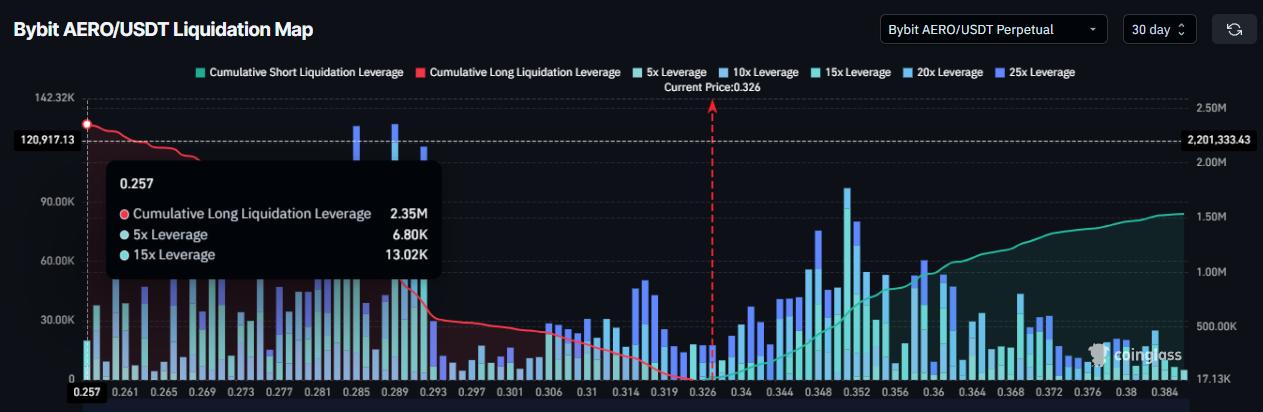
Futures market data reinforces the constructive outlook. AERO contracts are currently skewed toward long positions. Traders are positioning for potential upside continuation. Long exposure stands at approximately $2.35 million, reflecting notable bullish interest.
The $0.351 resistance level remains a critical barrier. A move above this threshold would trigger a significant short liquidation cluster worth roughly $623,560. Forced short covering can accelerate upward momentum. Such dynamics often amplify breakouts in volatile crypto markets.
AERO Price Is Awaiting a Breakout
AERO is trading at $0.327 at the time of writing after posting a 12% daily gain. Despite the surge, the token remains within its consolidation range. Current technical and derivatives signals present a cautiously bullish outlook. However, confirmation depends on overcoming immediate resistance.
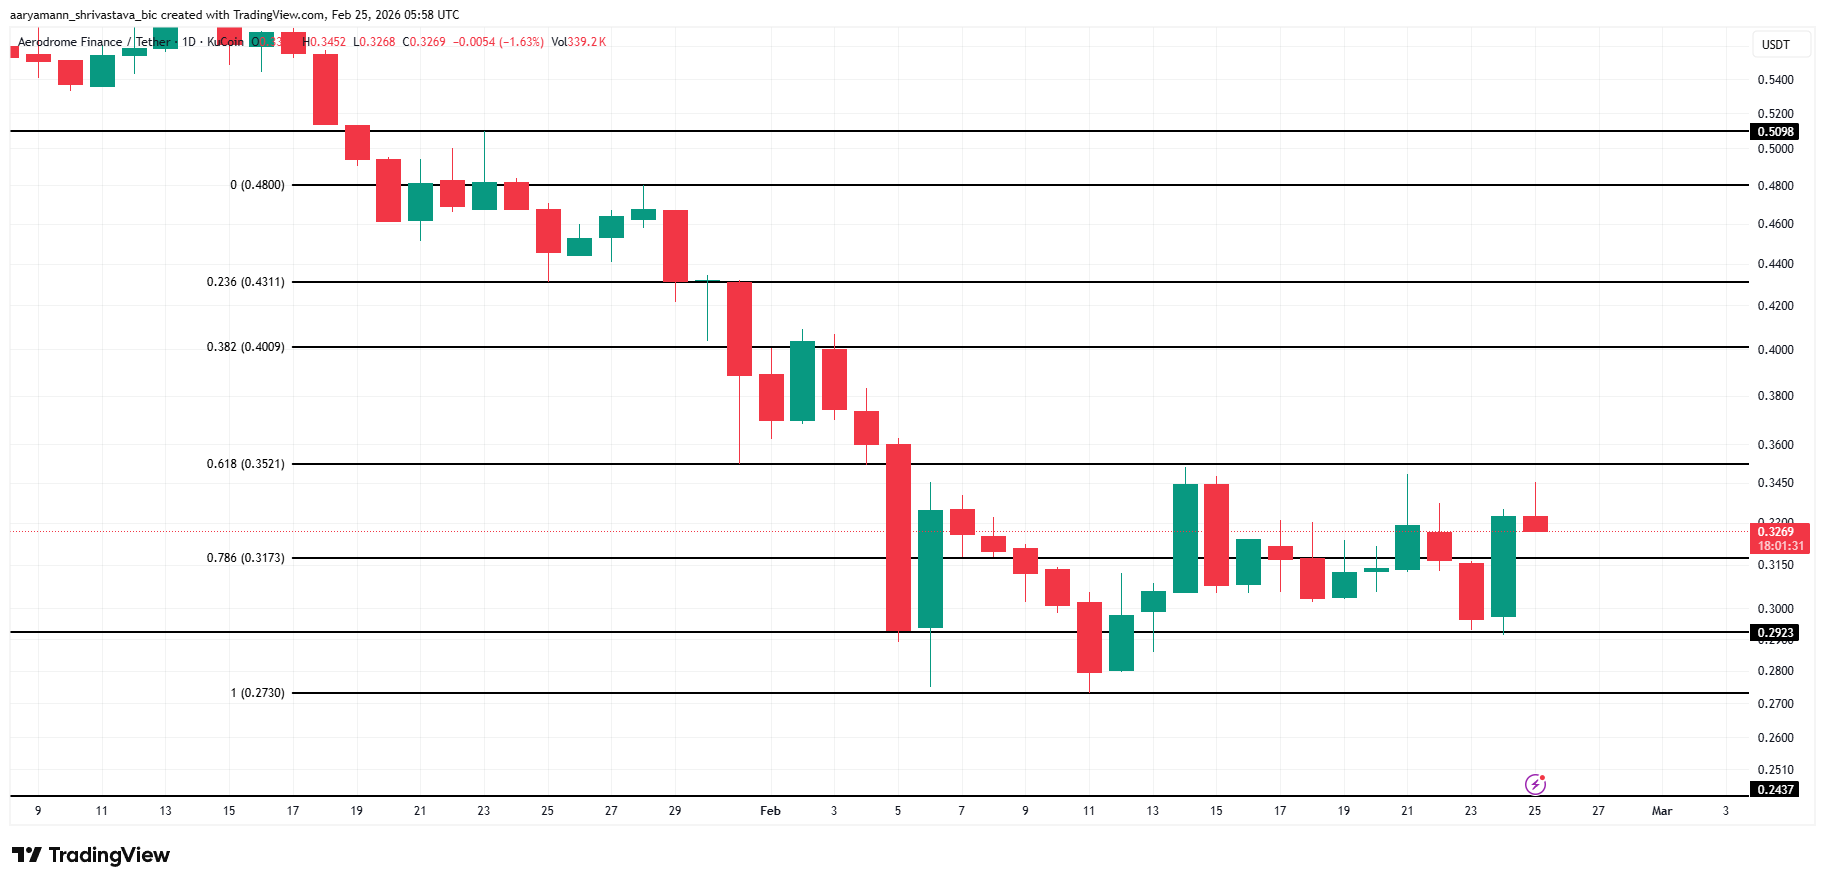
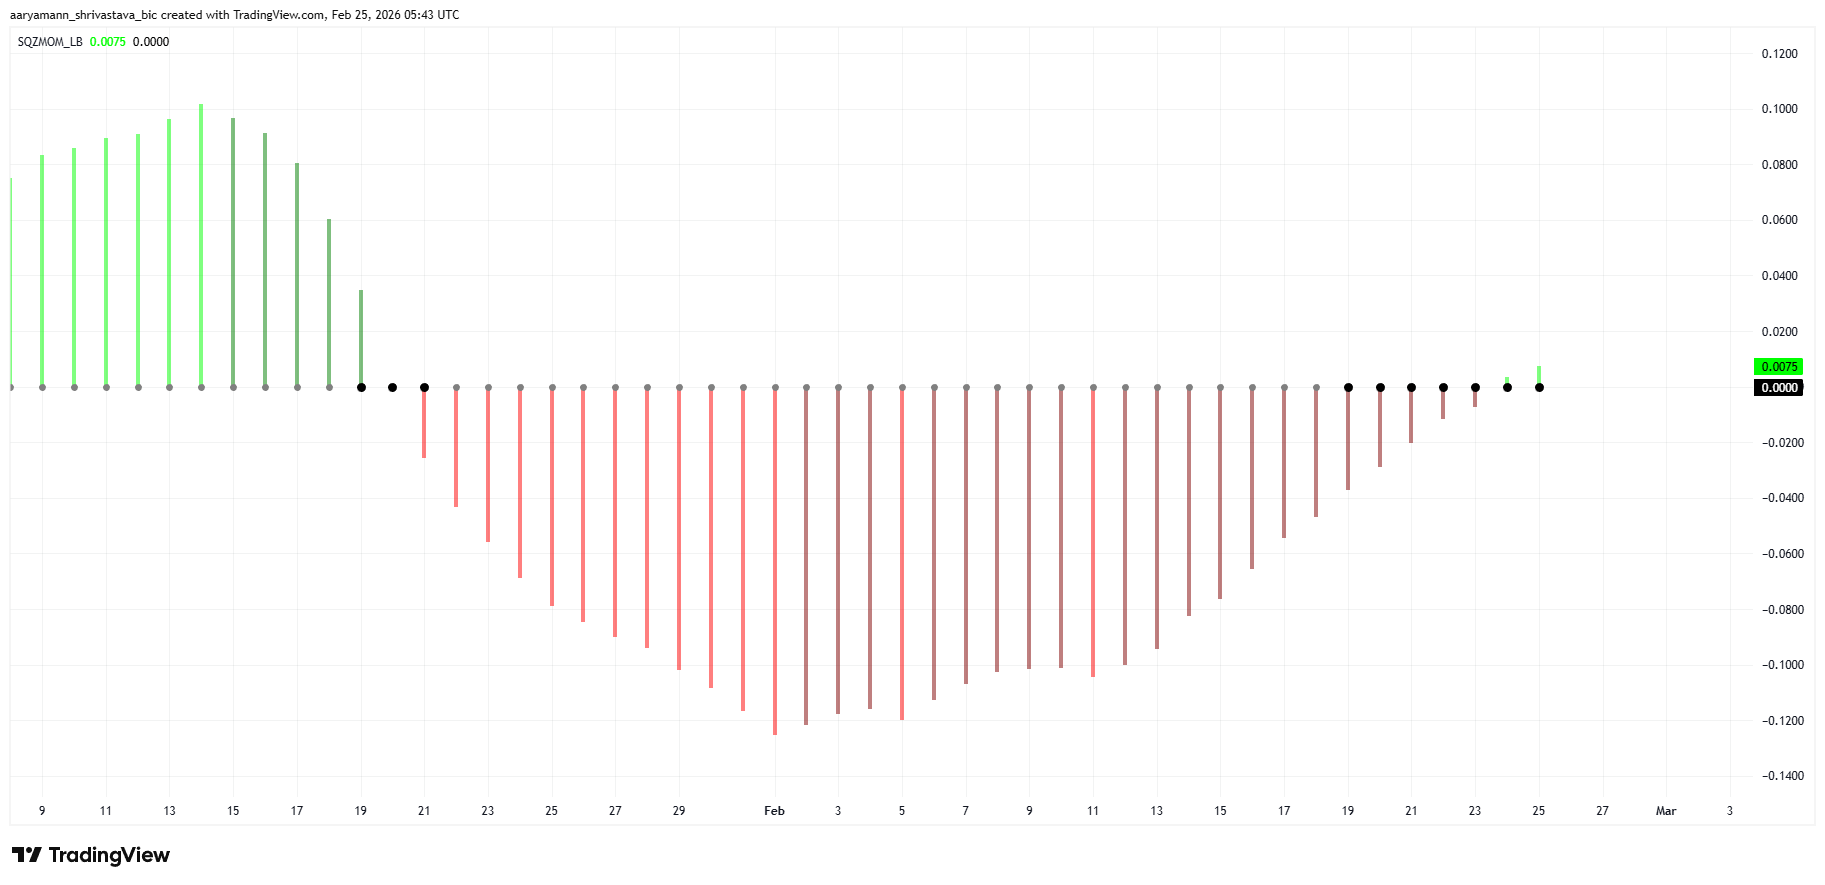
Breaching the $0.352 barrier is essential for a sustained breakout. Clearing this level would likely trigger short liquidations and strengthen bullish momentum. The Squeeze Momentum indicator shows compression building, while the histogram reflects underlying strength. A squeeze release could propel AERO toward $0.400.
Downside risks persist if buyers fail to maintain control. Continued consolidation between $0.352 and $0.292 would signal hesitation. A breakdown below $0.292 would weaken the bullish structure. Further losses could push AERO toward $0.273 or even $0.243, invalidating the current recovery thesis.

Lamborghini CEO Says EV Market for Luxury Cars Is ‘Close to Zero’

North Carolina DOJ Seizes $61 Million in USDT Tied to Pig Butchering Scam

Donald Trump Calls Democrats ‘Crazy’ During State of the Union


-

 Video5 days ago
XRP News: XRP Just Entered a New Phase (Almost Nobody Noticed)
-

 Fashion5 days ago
Weekend Open Thread: Boden – Corporette.com
-

 Politics3 days ago
Baftas 2026: Awards Nominations, Presenters And Performers
-

 Entertainment7 days ago
Kunal Nayyar’s Secret Acts Of Kindness Sparks Online Discussion
-

 Sports2 days ago
Women’s college basketball rankings: Iowa reenters top 10, Auriemma makes history
-

 Politics2 days ago
Nick Reiner Enters Plea In Deaths Of Parents Rob And Michele
-
 Sports6 days ago
Clearing the boundary, crossing into history: J&K end 67-year wait, enter maiden Ranji Trophy final | Cricket News
-

 Crypto World1 day ago
XRP price enters “dead zone” as Binance leverage hits lows
-

 Business3 days ago
Mattel’s American Girl brand turns 40, dolls enter a new era
-

 Business3 days ago
Law enforcement kills armed man seeking to enter Trump’s Mar-a-Lago resort, officials say
-

 Entertainment7 days ago
Dolores Catania Blasts Rob Rausch For Turning On ‘Housewives’ On ‘Traitors’
-

 Tech3 days ago
Anthropic-Backed Group Enters NY-12 AI PAC Fight
-
 NewsBeat2 days ago
‘Hourly’ method from gastroenterologist ‘helps reduce air travel bloating’
-

 NewsBeat3 days ago
Armed man killed after entering secure perimeter of Mar-a-Lago, Secret Service says
-

 Politics3 days ago
Maine has a long track record of electing moderates. Enter Graham Platner.
-

 Crypto World7 days ago
WLFI Crypto Surges Toward $0.12 as Whale Buys $2.75M Before Trump-Linked Forum
-

 Tech17 hours ago
Unsurprisingly, Apple's board gets what it wants in 2026 shareholder meeting
-
 NewsBeat12 hours ago
Police latest as search for missing woman enters day nine
-

 Crypto World6 days ago
83% of Altcoins Enter Bear Trend as Liquidity Crunch Tightens Grip on Crypto Market
-
 Sports2 days ago
2026 NFL mock draft: WRs fly off the board in first round entering combine week