
Crypto World
How High Can Ripple (XRP) Go Next Week? 4AIs Make Bullish Predictions


Can XRP spike to $2 or beyond as early as next week?
While Ripple’s cross-border token crashed to almost $1.10 on February 6, bulls have since stepped in to stabilize the valuation, which currently trades around $1.55.
The question now is whether next week can deliver further gains and how high the price could go. Here’s what four of the most widely used AI-powered chatbots said on the matter.
The Bulls
ChatGPT estimated that the most probable outcome for the week ahead is for XRP to rise to roughly $1.60, which it did on Sunday, but has yet to reclaim that level. It claimed that a move north is much more plausible than a renewed crash, based on recent investor behavior.
“At the moment, XRP looks more like it’s in a stabilization phase rather than the beginning of a major breakout. The bounce from around $1.10 to $1.50 shows that buyers stepped in aggressively at lower levels, which is constructive. However, sharp rebounds are often followed by consolidation before any serious continuation higher,” its analysis reads.
The chatbot projected that an explosion to as high as $2 next week is also possible, but it would depend heavily on a major catalyst, such as a solid revival of the broader crypto market or huge news concerning Ripple and its ecosystem.
Grok – the chatbot integrated within X – agreed with ChatGPT’s assumption that XPR is most likely to surge and maintain $1.60 next week. Nonetheless, it projected that such a scenario will only be possible if the price reclaims decisively the important zone of $1.40. Grok also envisioned a jump to as high as $1.80 but expects the rally to occur toward the end of February rather than in the following seven days.
Several indicators, including the declining amount of XRP held on the largest crypto exchange, Binance, and the formation of certain technical setups, reinforce the bullish thesis.
The Bears
Unlike the aforementioned chatbots, Perplexity is pessimistic about XRP’s performance next week and expects the price to decline. It outlined that investor sentiment has been quite depressing lately, predicting that the price may drop to as low as $1.24 in the coming days.
You may also like:
Google’s Gemini also envisioned a bearish tilt in the week ahead. It noted that February has historically been a challenging month for XRP, characterizing the $1.35 – $1.40 range as “the line in the sand.”
“This level isn’t just a number – it’s the technical floor that has been holding the ‘February slide’ together. XRP is hovering right on that edge, and if it plummets below this, it could open the door to a further plunge to as low as $1,” it concluded.
SECRET PARTNERSHIP BONUS for CryptoPotato readers: Use this link to register and unlock $1,500 in exclusive BingX Exchange rewards (limited time offer).


Vitalik Buterin has called for a shift to a “local-first” approach to artificial intelligence. He said modern AI tools pose serious privacy and security risks.
Summary
- Vitalik Buterin urged a shift to local-first AI, warning that cloud-based systems expose user data and increase risks of manipulation, leaks, and unauthorized actions.
- He cited research showing that about 15% of AI agent “skills” contain malicious instructions and warned that models may include hidden backdoors or lack full transparency.
- Buterin proposed a local setup using on-device models, sandboxing, and human-AI confirmation to limit risks, as autonomous AI agents continue to expand capabilities and attack surfaces.
In a recent blog post, he said AI is moving beyond simple chat tools. Newer systems now act as autonomous agents that can “think for a long time and use hundreds of tools” to complete tasks. He warned that this change raises the risk of sensitive data exposure and unauthorized actions.
Buterin said he has already stopped using cloud-based AI. He described his setup as “self-sovereign, local, private, and secure.”
“I come from a position of deep fear of feeding our entire personal lives to cloud AI,” he wrote. He added that recent developments could mean “taking ten steps backward” in privacy, even as encryption and local-first tools become more common.
Buterin said many AI systems rely on cloud infrastructure. He warned that users are effectively “feeding our entire personal lives to cloud AI,” allowing external servers to access and store their data.
He also pointed to risks tied to AI agents. Some systems can “modify critical settings” or introduce new communication channels without asking the user.
“LLMs fail sometimes too,” he wrote. They “can make mistakes or be tricked,” which increases the need for safeguards when they are given more control.
Research cited in his post found that about 15% of agent “skills” contained malicious instructions. Some tools were also shown to send data to external servers “without user awareness.”
He warned that certain models may contain hidden backdoors. These could activate under specific conditions and cause the system to act in the developer’s interest.
Buterin added that many models described as open-source are only “open-weights.” Their internal structure is not fully visible, which leaves room for unknown risks.
Vitalik’s personal setup to address risks
To deal with these concerns, Buterin proposed a system built around local inference, local storage, and strict sandboxing. He said the idea is to “sandbox everything” and stay cautious about outside threats.
He tested several hardware setups using the Qwen3.5:35B model. Performance below 50 tokens per second felt “too annoying” for regular use. Around 90 tokens per second provided a smoother experience.
A laptop with an NVIDIA 5090 GPU delivered close to 90 tokens per second. DGX Spark hardware reached about 60 tokens per second, which he described as “lame” compared to a high-end laptop.
His setup runs on NixOS with llama-server handling local inference. Tools like llama-swap help manage models, while bubblewrap is used to isolate processes and limit access to files and networks.
He said AI should be treated with caution. The system can be useful, but it should not be fully trusted, similar to how developers approach smart contracts.
To reduce risk, he uses a “2-of-2” confirmation model. Actions such as sending messages or transactions require both AI output and human approval. He said combining “human + LLM” decisions is safer than relying on either alone.
When using remote models, Vitalik’s requests are first passed through a local model which helps remove sensitive information before anything is sent out.
For those who cannot afford such setups, he suggested users “get together a group of friends, buy a computer and GPU of at least that level of power,” and connect to it remotely.
AI agent growth raises new concerns and opportunities
The use of AI agents is increasing, with projects like OpenClaw gaining traction. These systems can operate on their own and complete tasks using multiple tools.
Such capabilities also introduce new risks. Processing external content, such as a malicious webpage, can lead to an “easy takeover” of the system.
Some agents can change prompts or system settings without approval. These actions increase the chances of unauthorized access and data leaks.
Disclosure: This article does not represent investment advice. The content and materials featured on this page are for educational purposes only.
Crypto World
Startup lets researchers test blockchain tasks on a quantum computer for the first time


Most of the crypto industry spent this week processing Google’s paper on how quantum computers could break blockchain encryption. One startup is asking a different question — whether quantum hardware can make blockchains better.
Postquant Labs, which is building the world’s shared quantum computer, Quip.Network announced Wednesday the launch of what it calls the first publicly available quantum classical blockchain testnet, where quantum computers and legacy technology work side by side to solve problems.
Quantum computers use the physics of subatomic particles to test many possible solutions simultaneously rather than checking them one by one, which makes them fundamentally different from even the fastest conventional supercomputers, which are just very fast versions of the same step-by-step approach.
The testnet has already attracted 13,000 signups from researchers at MIT, Stanford, and universities around the world, according to the press release shared with CoinDesk. Out of these, six teams have submitted serious computational work so far.
Postquant Labs’s attempt to investigate how quantum processors can improve blockchain performance stands in contrast to most blockchain developers who see quantum as a threat.
The threat perception has increased multifold after Google published a paper on Monday which found that breaking bitcoin’s cryptographic defenses would require fewer than 500,000 physical qubits, roughly a 20-fold reduction from prior estimates
Note, however, that Postquant Labs’ testnet is a testing environment, not a live, final product. It’s where researchers experiment before anything goes into production.
The testnet has been built in consultation with D-Wave Quantum Inc, a leader in quantum computing systems, software, and services.
“From a technical perspective, the hybrid design of the testnet is particularly interesting. Participants can contribute using QPUs, CPUs and GPUs, creating a shared environment to evaluate how different compute models perform side by side,” Dr. Trevor Lanting, chief development officer, D-Wave, told CoinDesk.
“This creates an environment to help better understand how quantum approaches compare with classical methods in a blockchain setting, and where they may provide meaningful benefits such as improved energy efficiency or security,” he added.
Developers and researchers can earn QUIP tokens by solving complex mathematical problems using quantum machines, GPUs or regular CPUs. QUIP is meant to be a utility token that can be exchanged for computation resources provided by quantum and classical miners on the network.
If quantum computers can actually outperform regular computers on blockchain tasks — solving problems faster, using less energy, and delivering better results — then distributed ledger could become way more useful for real business applications, not just crypto trading.
“Today, annealing quantum computers are starting to show performance advantages on useful optimization applications across logistics, manufacturing, and beyond, often delivering better results, faster, and at lower energy cost than classical-only solutions,” said Colton Dillion, CEO and co-founder of Postquant Labs.
“Our goal is to make this quantum advantage accessible across a blockchain network,” Dillion added.
As of now, that’s a big “if.” This testnet needs to prove whether the quantum advantage is real or just marketing.
“Mainnet launch will depend entirely on the performance of testnet, but we are eager to launch as soon as we have proven the capabilities of the network to solve real-world problems, and shown quantum demand and supply both exist on either side of the market,” Postquant Labs told CoinDesk.
Do quantum computers exist?
Yes, they do, but not the sci-fi version that breaks Bitcoin and other blockchains or hacks into banks and major financial institutions.
D-Wave’s machines are not the quantum computers in Google’s paper. They are annealing systems, specialized hardware for optimization problems like route planning and resource allocation.
They cannot run Shor’s algorithm, cannot break encryption, and cannot do anything the Google paper describes. They are good at one specific class of problem, and that is the class Quip.Network is testing.
Postquant is using D-Wave’s Advantage2 annealing quantum computer through the company’s Leap cloud service.
In early internal tests, Postquant says D-Wave’s Advantage2 system beat out 80 H100 GPUs and 480 CPU cores on solution quality, time-to-solution, and energy efficiency for these specific optimization problems.
Those results have not been independently verified or published. Until they are, the claim is the company’s alone.
What role does D-Wave play?
D-Wave is not a full partner or investor. and has only advised Quip Network on the development of the testnet” and is “providing access to the Advantage2 system and consultation on the development of the testnet.”
Importantly, D-Wave has not independently endorsed the overall technical architecture — their involvement is limited to providing hardware access and consultation.

The two things most cryptocurrency investors are pondering are how much lower can bitcoin go and how much longer this bear market could last.
The price pain aspect has been discussed widely, but the time-based dimension is another question in itself.
Price pain refers to sharp drawdowns or volatility that force participants out of positions, while time pain reflects slow, range-bound conditions that exhaust both bulls and bears through lack of direction.
Bitcoin is currently trading below $66,000, down over 3% in the past 24 hours and roughly 45% below its October all-time high, an almost six-month bear market.
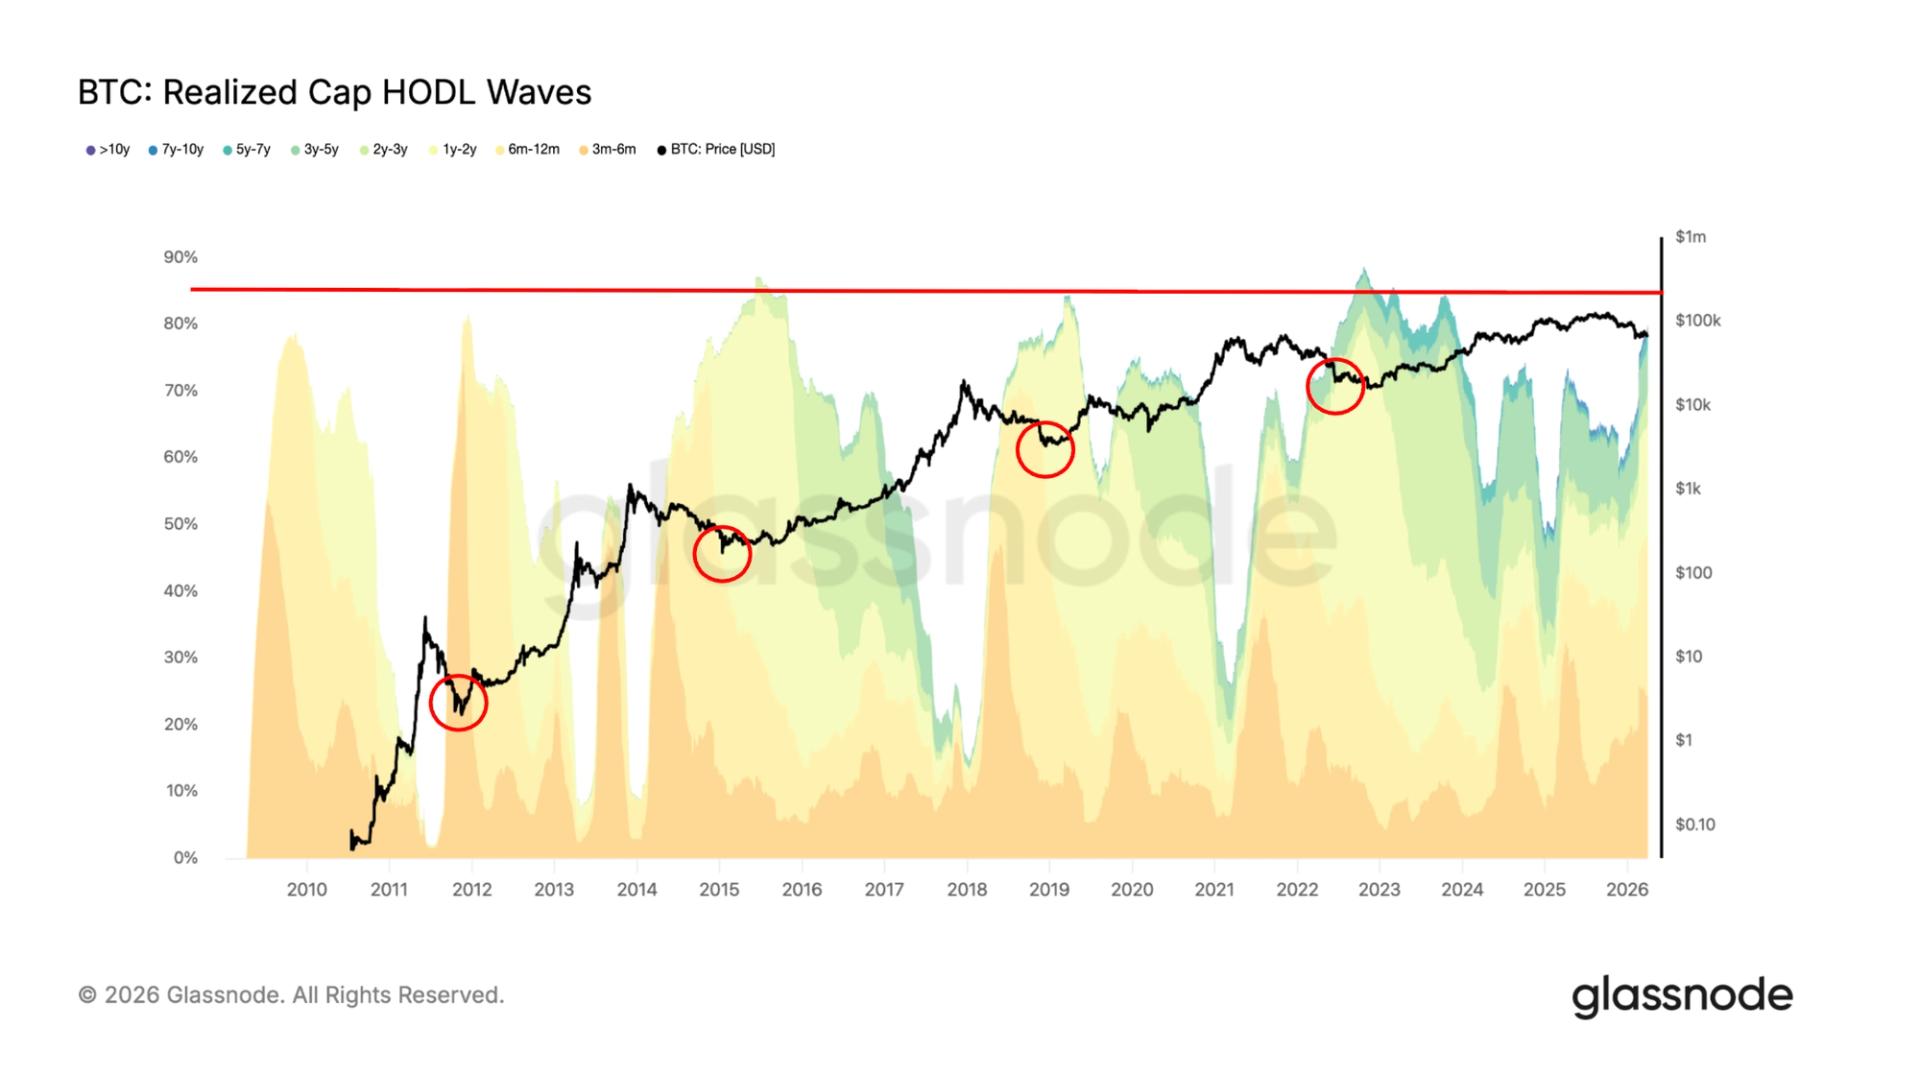
One indicator pointing toward continued time pain is the Realized Cap HODL Waves from Glassnode. This metric groups bitcoin supply by the last time coins moved, with each band representing different holding periods, and weights them by realized price, the average price at which coins last transacted on chain.
Historically, bear market bottoms have coincided with long-term holders, those holding for six months or more, controlling at least 85% of supply. Typically, price bottoms form first, and only several months later does long-term holder supply approach these high levels, indicating these investors bought at depressed prices and held through the bear market.
Currently, long term holders account for about 80% of supply. If this trend continues, the market may be nearing a bottoming phase, though several months of consolidation are likely still ahead.

SoFi said Thursday it is launching a new business banking platform designed to let companies handle both traditional money and crypto in one place, as it pushes deeper into digital assets.
The service, called SoFi Big Business Banking, allows firms to hold U.S. dollars, convert them into stablecoins and move funds around the clock, all within SoFi’s regulated bank.
Today, companies operating in crypto often rely on a patchwork of providers: a bank for cash, a separate firm for stablecoins and another for custody. Moving money between them can take hours or days. SoFi said it is trying to simplify that.
“To be competitive, businesses today must operate… 24 hours a day, 7 days a week,” SoFi CEO Anthony Noto said in a press release, contrasting the platform with traditional banking hours.
Under the new system, a trading firm could deposit dollars at SoFi, convert them into a digital token like SoFiUSD and deploy that capital instantly into markets, without waiting for bank wires to clear. Funds can also move back into dollars just as quickly.
The platform includes large crypto firms as early partners, including Cumberland, Wintermute, Galaxy (GLXY), BitGo (BTGO) and CoinDesk parent company Bullish (BLSH). These companies, which handle trading, liquidity and asset custody, are expected to use the system to move money and settle transactions more efficiently.
A central piece of the offering is SoFiUSD, a stablecoin that can be created and redeemed inside the bank. Unlike many stablecoins issued outside the U.S. banking system, SoFi’s version is tied directly to a regulated balance sheet, with reserves held internally.
The platform will also use blockchain networks, including Solana (SOL), to process transactions.
The launch reflects a broader shift in finance, as banks and crypto firms move closer together.
Instead of operating as separate systems, companies are increasingly trying to merge traditional banking with blockchain-based infrastructure. If successful, SoFi’s approach could reduce the need for multiple intermediaries and make it easier for large firms to move money globally.
Crypto World
Coinbase’s AI payments system joins Linux Foundation, gathers support from Google, Stripe, AWS and others


Coinbase’s AI-focused payment protocol x402 is moving toward becoming an open, standardized infrastructure under the Linux Foundation, the non-profit hub for open-source software development. The move aims to create a community-governed ecosystem for high-frequency, micro transactions that legacy finance can’t efficiently handle.
The protocol has formed an initial governing body, the x402 Foundation, that includes internet services firm Cloudflare and payments giant Stripe, with support from a long list of other big players.
The industry interest in X402 comes as AI-driven commerce expands. Especially, so-called agentic payments, executed autonomously by AI agents, is a hot topic particularly within certain areas of the crypto industry where the belief is that programmable, blockchain-based micro-payments make the most sense.
x402 is designed for these payments. Unlike using ChatGPT as a front-end for a traditional shopping cart, it can handle transactions worth only fractions of a cent at high frequency — something traditional credit card networks struggle to manage.
Now, by using the Linux Foundation to scale an open-source ecosystem, x402 aims to tackle potential interoperability issues by creating something like a Secure Sockets Layer (SSL) for AI agents, in other words a standard technology that encrypts the connection between a web server and a browser.
“The internet was built on open protocols,” said Jim Zemlin, CEO of the Linux Foundation. “The x402 Foundation will create an open, community-governed home to develop these capabilities in the open, ensuring they evolve with transparency, interoperability, and broad participation across the ecosystem.”
Coinbase said in a press release on Thursday that additional membership of the foundation will be comprised of participants from multiple verticals with initial intent and support being expressed by Adyen, Amazon Web Services, American Express, Ampersend.ai, Ant International, Base, Circle, Fiserv Merchant Solutions, Google, KakaoPay, Mastercard, Merit Systems, Microsoft, Polygon Labs, PPRO, Sierra. Shopify, Solana Foundation, Thirdweb, and Visa.
“The shift toward agentic commerce requires cloud infrastructure that is as open as the protocols it supports,” said James Tromans, Managing Director, Web3 and Digital Assets, Google Cloud. By joining the x402 Foundation, Google is reinforcing its commitment to interoperable standards that enable secure, AI-driven transactions across platforms.”
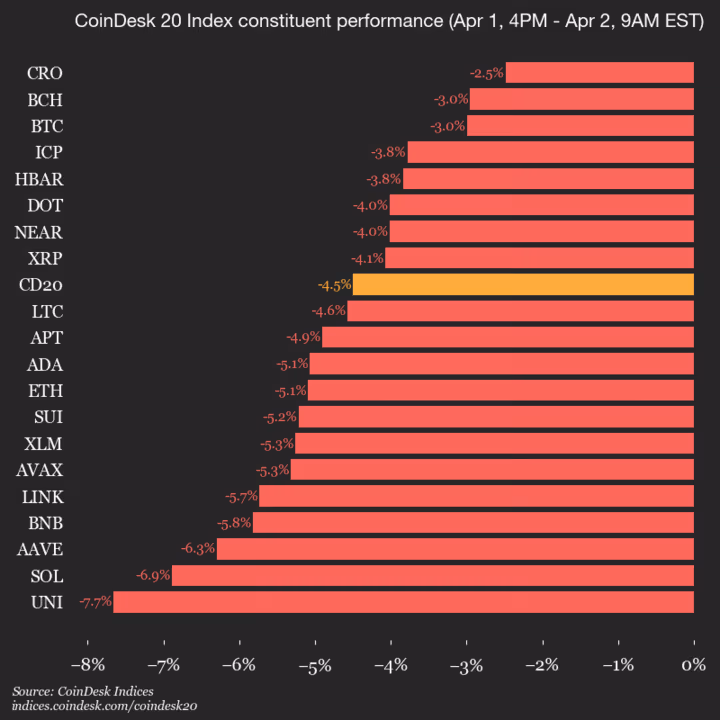
CoinDesk Indices presents its daily market update, highlighting the performance of leaders and laggards in the CoinDesk 20 Index.
The CoinDesk 20 is currently trading at 1875.68, down 4.5% (-88.38) since 4 p.m. ET on Wednesday.
None of the 20 assets are trading higher.

Leaders: CRO (-2.5%) and BCH (-3.0%).
Laggards: UNI (-7.7%) and SOL (-6.9%).
The CoinDesk 20 is a broad-based index traded on multiple platforms in several regions globally.


The crypto market recovered for the second straight day, rising 2.1% over the past 24 hours to $2.45 trillion on Tuesday.
Summary
- Crypto market rose 2.1% to $2.45 trillion, with Bitcoin nearing $69,000 and altcoins posting broad-based gains.
- Risk appetite improved ahead of a key update from Donald Trump on U.S.–Iran tensions, easing pressure from elevated oil prices.
- Over $200 million in short liquidations and continued ETF inflows added momentum to the market rebound.
Bitcoin (BTC), the bellwether asset, rose 2.4% to a six-day peak of $69,000. Ethereum (ETH) price was up 4.2%, back above $2,100, while other major crypto assets such as BNB (BNB), XRP (XRP), Solana (SOL), and Dogecoin (DOGE) posted gains between 1-3%.
Some of the best performers of the day were Algorand (ALGO), Stable (STABLE), and Zcash (ZEC), which led gains of 20.5%, 16%, and 8% each.
The latest market recovery comes as reports suggest that U.S. President Donald Trump will provide an important update on the ongoing tensions with Iran later at 9 PM ET today. This anticipation comes just a day after reports emerged that Trump was considering ending the U.S. war with Iran in the Middle East, even if the Strait of Hormuz remains closed.
The blockade in the key maritime corridor has led oil prices to surge to multi-year levels, which contributed a big part to deteriorating investor demand for risk assets as they flee to safe-haven assets such as gold and U.S. equities.
Meanwhile, a contrasting narrative came from a report by the Wall Street Journal, which indicated that several nations, including the UAE and Saudi Arabia in the Gulf stream, are pressuring the U.S. to continue its war against Iran as they try to force open the strait.
The Iranian government, for its part, has stated that the country will end the war only if certain conditions are met; these include full compensation for the wartime damages incurred.
All this combined makes Trump’s speech today a high-stakes event for global markets. Investors are likely pricing in Trump’s potential plan of looking into ending the war, although details of his speech today remain sparse at the time of writing.
Notably, the initial impact of the potential peace talks has already been seen in the energy markets as crude oil fell lower today. At press time, West Texas Intermediate (WTI) crude oil and Brent were both down 4% each, moving below $100.
Short liquidations and ETF inflows add momentum to rally
The crypto market recovery has triggered a massive short squeeze as short sellers were caught off guard. Data from CoinGlass shows that over $200 million in short positions were liquidated in the past 24 hours across leveraged markets. Such a trend could continue to accelerate the bullish momentum if the resistance levels are broken.
Meanwhile, crypto ETFs also seem to have played a part in today’s gains. Notably, spot Bitcoin ETFs recorded $117 million in net inflows over the past day, extending their inflow streak to the second day, while their Ethereum counterparts drew in $31 million on the day.
Disclosure: This article does not represent investment advice. The content and materials featured on this page are for educational purposes only.


U.S. technology and AI giants’ stocks, such as Meta, Microsoft, and NVIDIA, crashed after Iran’s Islamic Revolutionary Guard Corps threatened military action against their regional bases.
Summary
- U.S. tech stocks, including Meta, Microsoft, and NVIDIA, dropped sharply after Iran designated 18 American companies as potential military targets.
- Disruptions at AWS data centers in the Middle East impacted AI and cloud services, raising concerns over operational risks to critical infrastructure.
- AI-linked crypto tokens such as TAO, NEAR, and ICP declined 4–6% as geopolitical tensions spilled into digital asset markets.
On April 1, 2026, the IRGC officially designated 18 U.S. companies as “legitimate targets” described by Tehran as retaliation for the targeted assassination of major Iranian leaders by the U.S. and Israeli forces. These include Alphabet (Google), Apple, Microsoft, Meta, NVIDIA, Intel, IBM, Oracle, Cisco, Dell, HP, Palantir, Boeing, Tesla, GE, JPMorgan Chase, G42, and Spire Solutions
Following the announcement, Meta shares dropped by 13.31% while Microsoft and NVIDIA shares dropped by 8.34% and 6.00%, respectively.
The threats have translated into immediate operational risks with reports of drone activity causing power failures at two Amazon Web Services data centers in the Middle East, which have disrupted AI and cloud services in the region, affecting banking payment processors and consumer apps. Notably, Anthropic’s Claude AI platform reportedly went offline for a period because it relies on AWS infrastructure.
Iranian officials allege that these ICT and AI companies are complicit in tracking and identifying targets for “terrorist operations” against Iranian leaders.
For its part, the U.S. administration has dismissed the threats, with White House officials stating the U.S. military is prepared to thwart any potential aggression. Meanwhile, companies like Intel and Boeing have already implemented safety protocols for regional staff amid the escalating geopolitical and kinetic risk to critical infrastructure.
The news of the attack on AI-focused companies also rippled onto AI-focused crypto assets, which rely on the hardware and cloud ecosystems of NVIDIA and other giants that have come under fire.
According to data from crypto.news, Chainlink (LINK), currently the largest AI coin with a market cap of over $6 billion, has fell 5.8% over the past 24 hours. Bittensor (TAO), Near Protocol (NEAR), and Internet Computer (ICP) also recorded nearly similar losses between 4% and 5%. Together, the negative sentiment in the AI market led its market capitalization to drop over 3% to $0.59 billion at last check.
While these assets remain at risk of further losses if Iran starts carrying out more strikes, a sector-wide rebound could be in the cards if the U.S. manages to de-escalate the situation.
Disclosure: This article does not represent investment advice. The content and materials featured on this page are for educational purposes only.
Anthropic said on Tuesday that a release error led to portions of the internal source code for its AI coding assistant, Claude Code, being unintentionally made public.
Summary
- Anthropic accidentally exposed nearly 500,000 lines of Claude Code’s source code via a packaging error, with files rapidly spreading across GitHub.
- The leak revealed internal architecture and proprietary AI agent instructions but did not include user data or model weights.
- The company has issued around 8,000 takedown requests as concerns grow over security practices and competitive risks.
A file meant for internal use was mistakenly bundled into a software update, pointing to an archive containing roughly 2,000 files and nearly 500,000 lines of code. The material was quickly circulated on GitHub after being discovered, with a post on X sharing access to the files drawing more than 29 million views by early Wednesday. A modified version of the codebase also surged to become one of the fastest-downloaded repositories on the platform.
“Earlier today, a Claude Code release included some internal source code. No sensitive customer data or credentials were involved or exposed,” an Anthropic spokesperson said, attributing the incident to a packaging mistake rather than a security breach.
The exposed materials largely detailed the tool’s internal architecture, including its command-line interface, agent framework, and development tooling. However, the company said that no user data or model weights tied to its underlying Claude AI system were compromised.
While parts of Claude Code had previously been inferred through reverse engineering, the latest disclosure offered a far more complete view of how the system operates. An earlier version of the assistant had also seen its code exposed in February 2025.
The latest episode adds to a string of recent incidents. A prior report by Fortune indicated that Anthropic had stored thousands of internal files on publicly accessible systems, including a draft blog post referencing unreleased models named “Mythos” and “Capybara”.
Security researchers traced the current leak to a 60MB source-map file embedded in the tool’s npm package, which allowed reconstruction of the full TypeScript codebase. Within hours, developers had begun replicating and analysing the code, uncovering internal techniques used to turn Claude into a functional coding agent.
The disclosure has raised concerns among some experts about internal safeguards at a company that positions itself around AI safety. The availability of detailed implementation methods may also provide rivals such as OpenAI and Google with insights into Claude Code’s design and capabilities. According to The Wall Street Journal, the leaked material included commercially sensitive elements such as proprietary workflows and agent instructions.
In response, Anthropic has moved aggressively to contain the spread, issuing around 8,000 copyright takedown notices targeting repositories and derivative projects hosting the leaked material on GitHub.
By Wednesday morning, April 1, the company had begun efforts to remove both original files and modified versions shared by developers, The Wall Street Journal reported. Anthropic reiterated that the incident stemmed from human error and said additional safeguards are being introduced to prevent a repeat.
Despite those assurances, the episode may weigh on the company’s operational credibility, particularly as it is reportedly preparing for a potential $380 billion initial public offering.
Disclosure: This article does not represent investment advice. The content and materials featured on this page are for educational purposes only.

Key Takeaways
- Alastair Syme from Citi upgraded his XOM price objective to $175 from $150 while maintaining a Neutral stance
- The upgrade stems from Middle East tensions potentially reducing equity costs for energy companies across the board
- Syme suggests regional conflict may spark renewed institutional investment in the oil and gas industry
- Former President Trump’s reported warnings against Iran intensified supply concerns in petroleum markets
- Despite the upgrade, Citi favors TotalEnergies, ConocoPhillips, and BP over Exxon as preferred energy investments
Citi has announced a significant upward revision to its Exxon Mobil (XOM) price objective, moving from $150 to $175, with escalating Middle East tensions serving as the primary catalyst for energy sector revaluation. Analyst Alastair Syme maintained his Neutral position while implementing the increase as part of sweeping adjustments throughout oil and gas coverage.
Syme’s rationale centers on a clear thesis: geopolitical instability in the Middle East compresses the cost of capital for energy companies, which mathematically elevates valuation targets. He characterized the regional tensions as potentially catalyzing a “structural re-engagement” from institutional capital in the oil and gas sector — an industry segment that has experienced diminishing investor enthusiasm in recent years.
XOM experienced upward momentum midweek as commodity traders assessed geopolitical uncertainties against already elevated petroleum prices. This convergence created favorable conditions for the equity.
Regional Conflict Reshapes Market Dynamics
The primary catalyst involves crude oil’s acute sensitivity to Middle Eastern geopolitical developments. Recent trading sessions saw petroleum prices advance on concerns that escalating conflict might interrupt critical shipping corridors or precipitate broader supply constraints.
Compounding market anxieties, reports emerged that former President Donald Trump threatened severe action against Iran — rhetoric that rattled traders and elevated the geopolitical risk premium embedded in oil pricing. Markets frequently react to potential supply disruptions before any actual interruption materializes. Perceived threats alone typically suffice to trigger repricing.
Exxon, representing one of the planet’s largest vertically integrated energy corporations, stands directly within this repricing dynamic. Elevated crude prices enhance upstream profitability, while its downstream refining operations provide diversification. The company’s financial foundation is considered robust, a critical attribute during volatile commodity environments.
Alternative Investment Preferences from Citi
An important distinction: although Citi elevated its XOM target, the firm’s preferred energy sector positions remain TotalEnergies, ConocoPhillips, and BP. The Neutral designation indicates Syme views the shares as appropriately valued at present levels, even after the target adjustment.
The target elevation primarily reflects industry-wide momentum rather than Exxon-specific optimism.
Energy equities have broadly regained investor consideration as protection against geopolitical volatility and inflationary pressures. Exxon features prominently in these discussions given its operational scale and financial discipline, yet Citi clearly signals superior opportunities exist elsewhere within the sector.
Citi’s upgraded $175 price objective marks the latest in successive upward revisions across major oil companies as analysts recalibrate expectations for an increasingly unstable geopolitical environment.


Diverse teams start with diverse VCs

Tees Valley Combined Authority marks ten years since its formation

Denby appoints administrators in 'necessary step'


-

 Business7 days ago
Instagram, YouTube Found Responsible for Teen’s Mental Health Struggle in Historic Ruling
-

 NewsBeat6 days ago
The Story hosts event on Durham’s historic registers
-
 Tech7 days ago
Intercom’s new post-trained Fin Apex 1.0 beats GPT-5.4 and Claude Sonnet 4.6 at customer service resolutions
-

 Sports6 days ago
Sweet Sixteen Game Thread: Tide vs Michigan
-
Entertainment3 days ago
Fans slam 'heartbreaking' Barbie Dream Fest convention debacle with 'cardboard cutout' experience
-
 Entertainment5 days ago
Lana Del Rey Celebrates Her Husband’s 51st Birthday In New Post
-
Crypto World2 days ago
Dems press CFTC, ethics board on prediction-market insider trades
-

 Crypto World17 hours ago
Gold Price Prediction: Worst Month in 17 Years fo Save Haven Rock
-

 Tech3 days ago
The Pixel 10a doesn’t have a camera bump, and it’s great
-

 Sports2 days ago
Tallest college basketball player ever, standing at 7-foot-9, entering transfer portal
-

 Tech2 days ago
EE TV is using AI to help you find something to watch
-

 Fashion4 days ago
Amazon Sundays: Soft Spring Layers
-

 Tech3 days ago
Apple will hide your email address from apps and websites, but not cops
-

 Tech2 days ago
Flipsnack and the shift toward motion-first business content with living visuals
-

 Tech2 days ago
How to back up your iPhone & iPad to your Mac before something goes wrong
-

 Politics3 days ago
Should Trump Be Scared Strait?
-

 Crypto World3 days ago
U.S. rule change may open trillions in 401(k) funds to crypto
-

 Fashion7 days ago
En Vogue in Brown Leather and Tailored Neutrals by Atelier Savoir, Styled by J Bolin
-

 Fashion7 days ago
What Are Your Favorite T-Shirts for the Weekend?
-

 Business6 days ago
Chinese universities with military links bought Super Micro servers with restricted AI chips
You must be logged in to post a comment Login