
Crypto World
HYPE Price to New ATH? TradFi’s Secret Edge Says Yes
Hyperliquid (HYPE) price has risen almost 31% since Feb. 24, then gave up some of its gains. At press time, the token traded near $32, up roughly 4.5% on the day and approximately 20% over the past seven days. Over the past 30 days, the HYPE price has remained in positive territory, up around 5%, while most top cryptocurrencies, including Bitcoin, Ethereum, BNB, XRP, and Solana, have posted losses over the same period.
The rally ties into a structural shift: Hyperliquid is becoming the go-to venue for trading traditional financial assets like oil, gold, and stocks around the clock, and every one of those trades feeds directly into the token’s deflationary burn engine. Meanwhile, smart money wallets are overwhelmingly long on HYPE itself, even as retail positions lean short.
Hyperliquid Removes TradFi’s Biggest Bottleneck
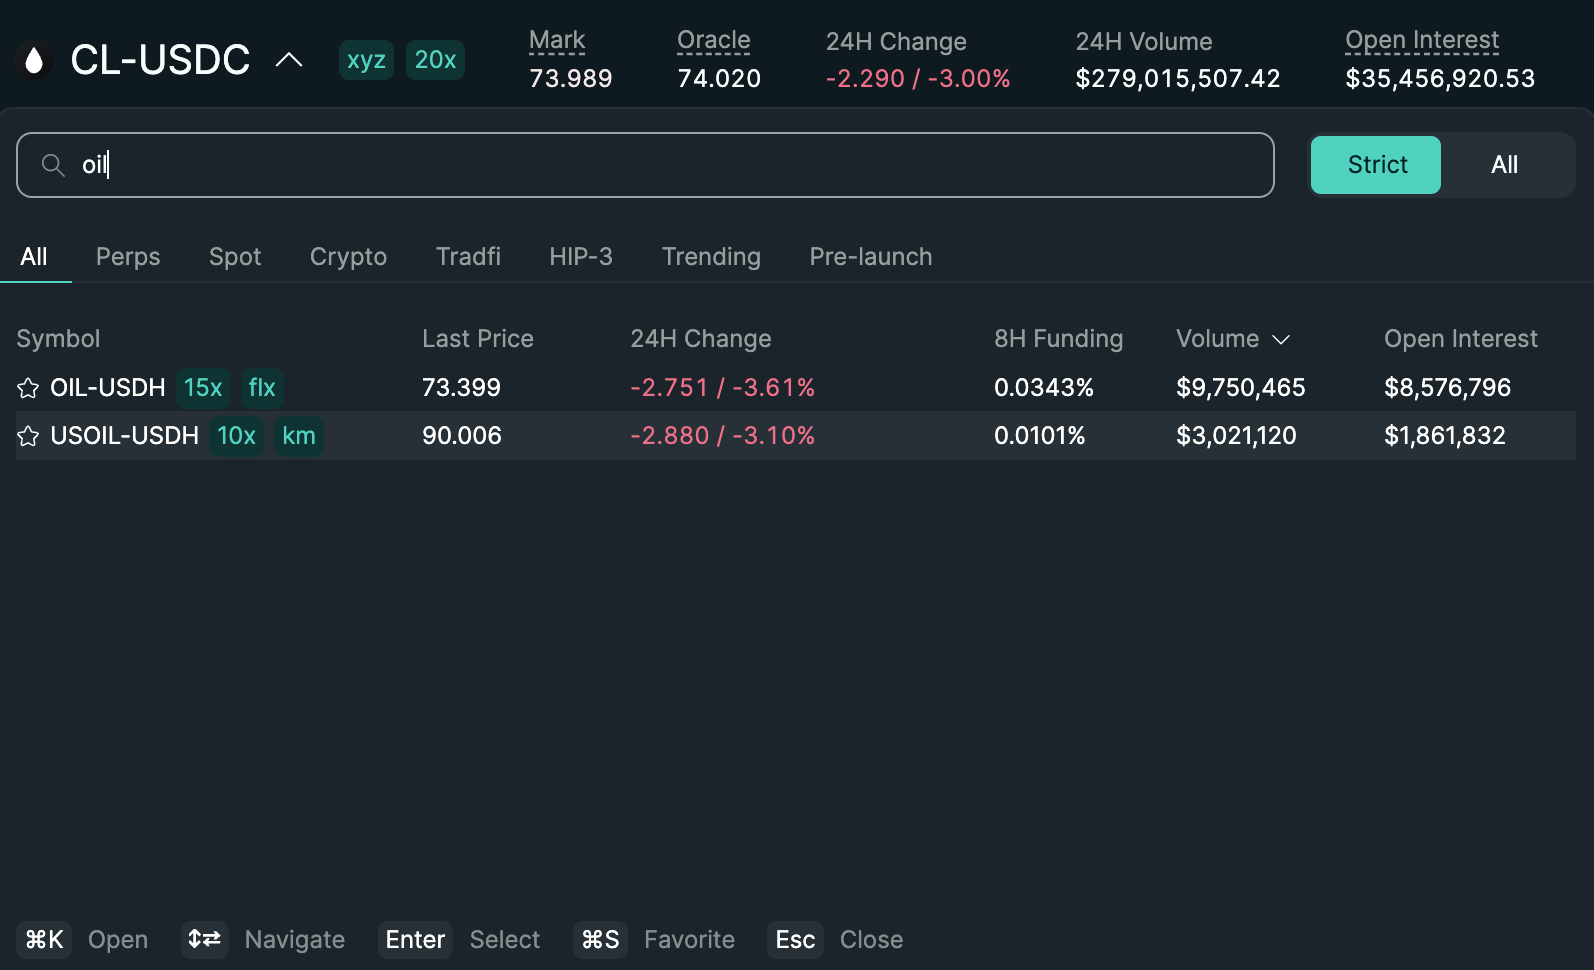
Traditional financial markets close on weekends and after hours. Hyperliquid does not. Traders can trade oil, gold, silver, and even stocks like NVIDIA on Hyperliquid using perpetual futures: 24 hours a day, 7 days a week, with sizeable leverage. That edge became impossible to ignore during the March 1–2 weekend.
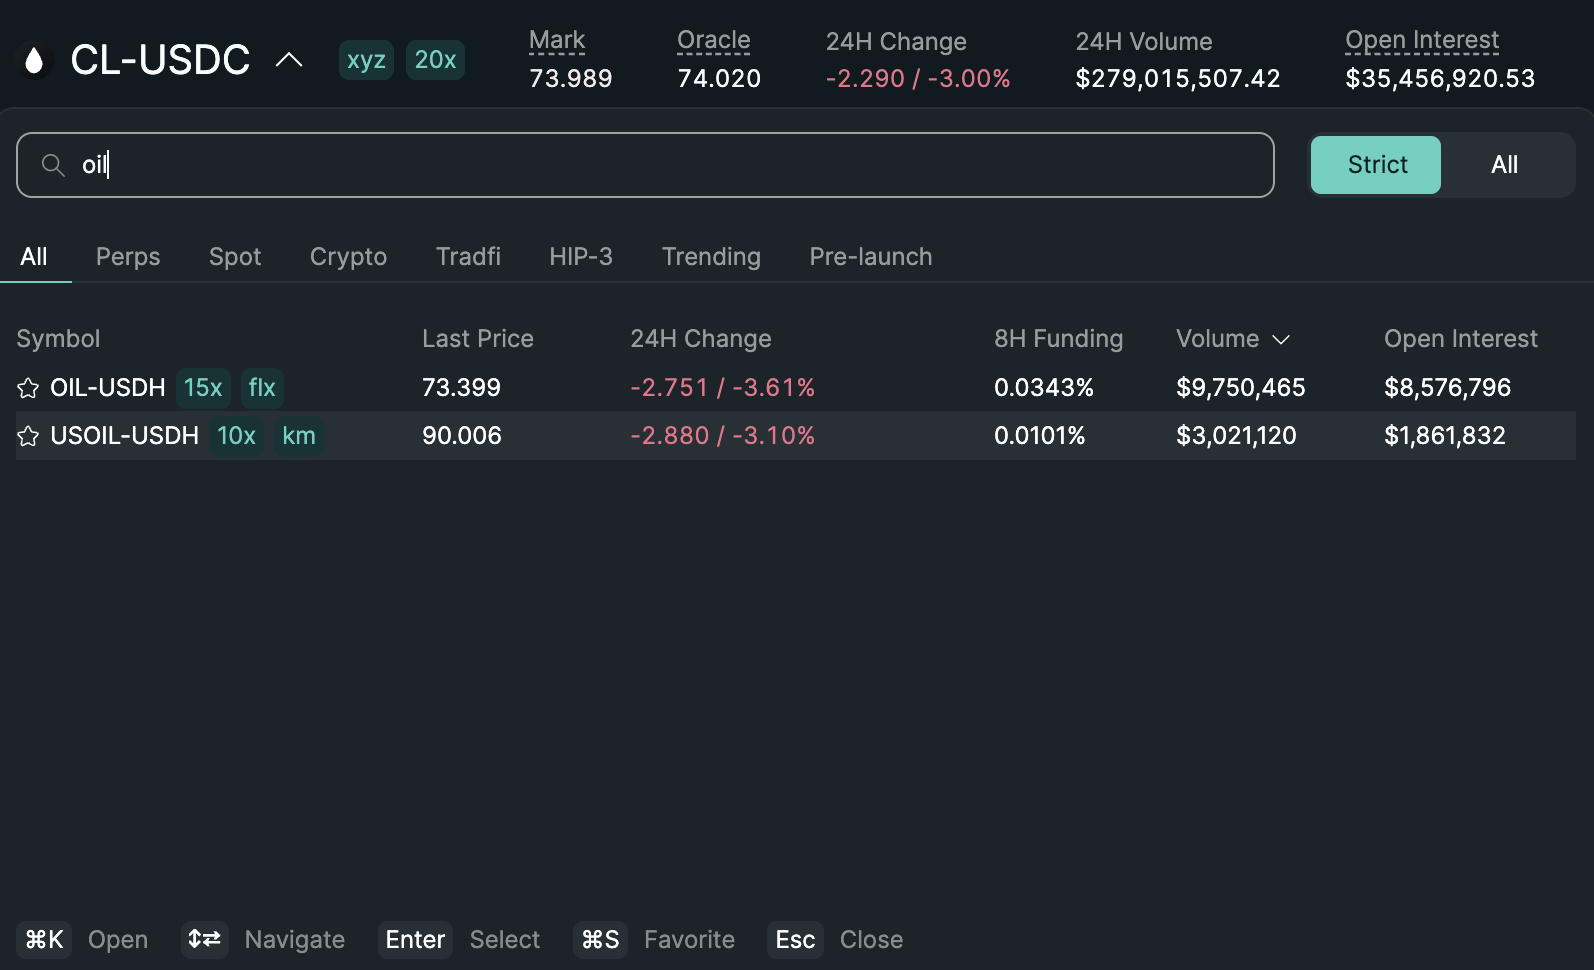
Platform volume jumped to over $6.4 billion on Sunday alone.
Oil perpetuals on Hyperliquid reportedly surged nearly 20%. Open interest for commodities-focused derivatives allegedly reached an all-time high above $1.1 billion.
This was not a one-off spike.
According to Delphi Digital, tokenized TradFi assets hit 31.6% of all Hyperliquid trading volume in late January — up from under 5% just a month earlier. Metals, equity indices, and individual stocks possibly drove the rotation.
On-chain data from Lookonchain showed one whale depositing $7.35 million in USDC into Hyperliquid to long NVDA and SNDK stocks; holding over $11.94 million in NVDA and $2 million in SNDK with additional limit orders worth $4.53 million pending. This happened right before NVIDIA announced the Q4 results.
Integrations have further accelerated this adoption.
Ripple Prime, launched in early February, gives institutions access to Hyperliquid on-chain perpetuals through a traditional prime brokerage wrapper.
Trojan (formerly Unibot) integrated non-custodial bot trading of real TradFi assets, including TSLA, AMZN, GOOGL, gold, and silver, directly on Hyperliquid’s orderbook.
And on Feb. 24, CoinShares launched a physically backed HYPE staking ETP (ticker: LIQD) on the Xetra exchange — the first regulated product giving traditional finance investors direct exposure to HYPE with staking yield. So the TradFi to crypto link now seems to be working both ways.
The volume surge, mentioned earlier, matters for HYPE price because of a direct mechanical link — and that is where the burn flywheel comes in.
Every Oil, Gold, and Stock Trade on Burns Tokens Permanently
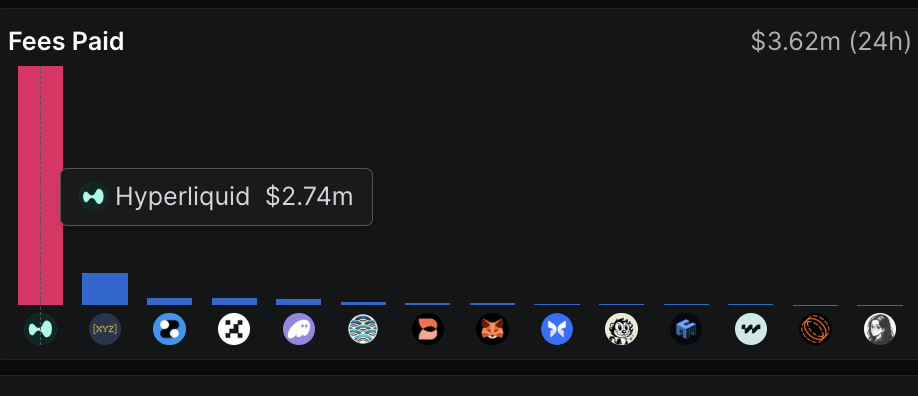
Approximately 97% of all core trading fees on Hyperliquid flow into the Assistance Fund: a system address that automatically buys HYPE on the open market and permanently burns the purchased tokens.
HyperEVM gas fees are also burned. This is not a governance vote or a manual marketing event. It is code-enforced, on-chain, and happens with every single trade; whether that trade is a Bitcoin perpetual, an oil future during a geopolitical crisis, or a leveraged NVIDIA position from a whale wallet.
Want more token insights like this? Sign up for Editor Harsh Notariya’s Daily Crypto Newsletter here.
Recent on-chain data showed the platform generated $2.74 million in 24-hour fees, $16.96 million over seven days, and approximately $9.22 million worth of HYPE burned last week — up over 20% week-over-week.
On the supply side, only about 26,790 HYPE are minted daily as staking rewards. Recent daily burn figures have exceeded 48,000 HYPE, resulting in a net removal of over 17,000 tokens per day. Burns are currently running 1.8 to 2.3 times faster than emissions.
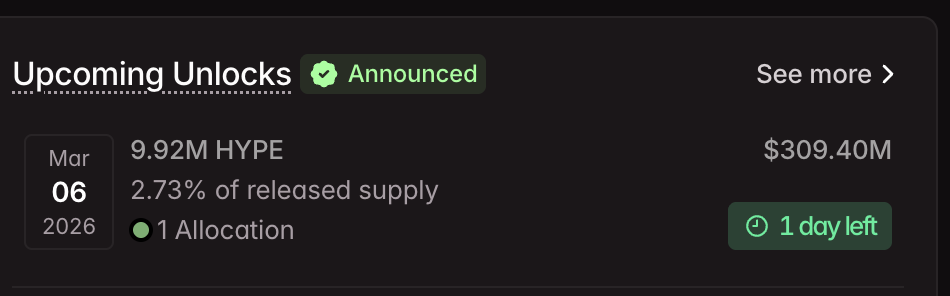
That makes HYPE structurally net deflationary at current volume levels, even after accounting for the scheduled March 6 unlock of roughly 9.92 million HYPE for core contributors.
The flywheel is straightforward. More traders using Hyperliquid to trade oil, gold, stocks, and commodities around the clock generate higher fees. Higher fees mean more HYPE bought from the market and burned. More burning means a shrinking supply. And shrinking supply, combined with rising demand, creates price support, which is exactly what smart money appears to be positioning for.
Smart Money Goes All In While Retail Bets Against
On-chain positioning data on HYPE itself reveals a sharp divide between smart money and retail.
According to Nansen AI, overall sentiment on HYPE among tracked smart money wallets reads “strongly bullish.”
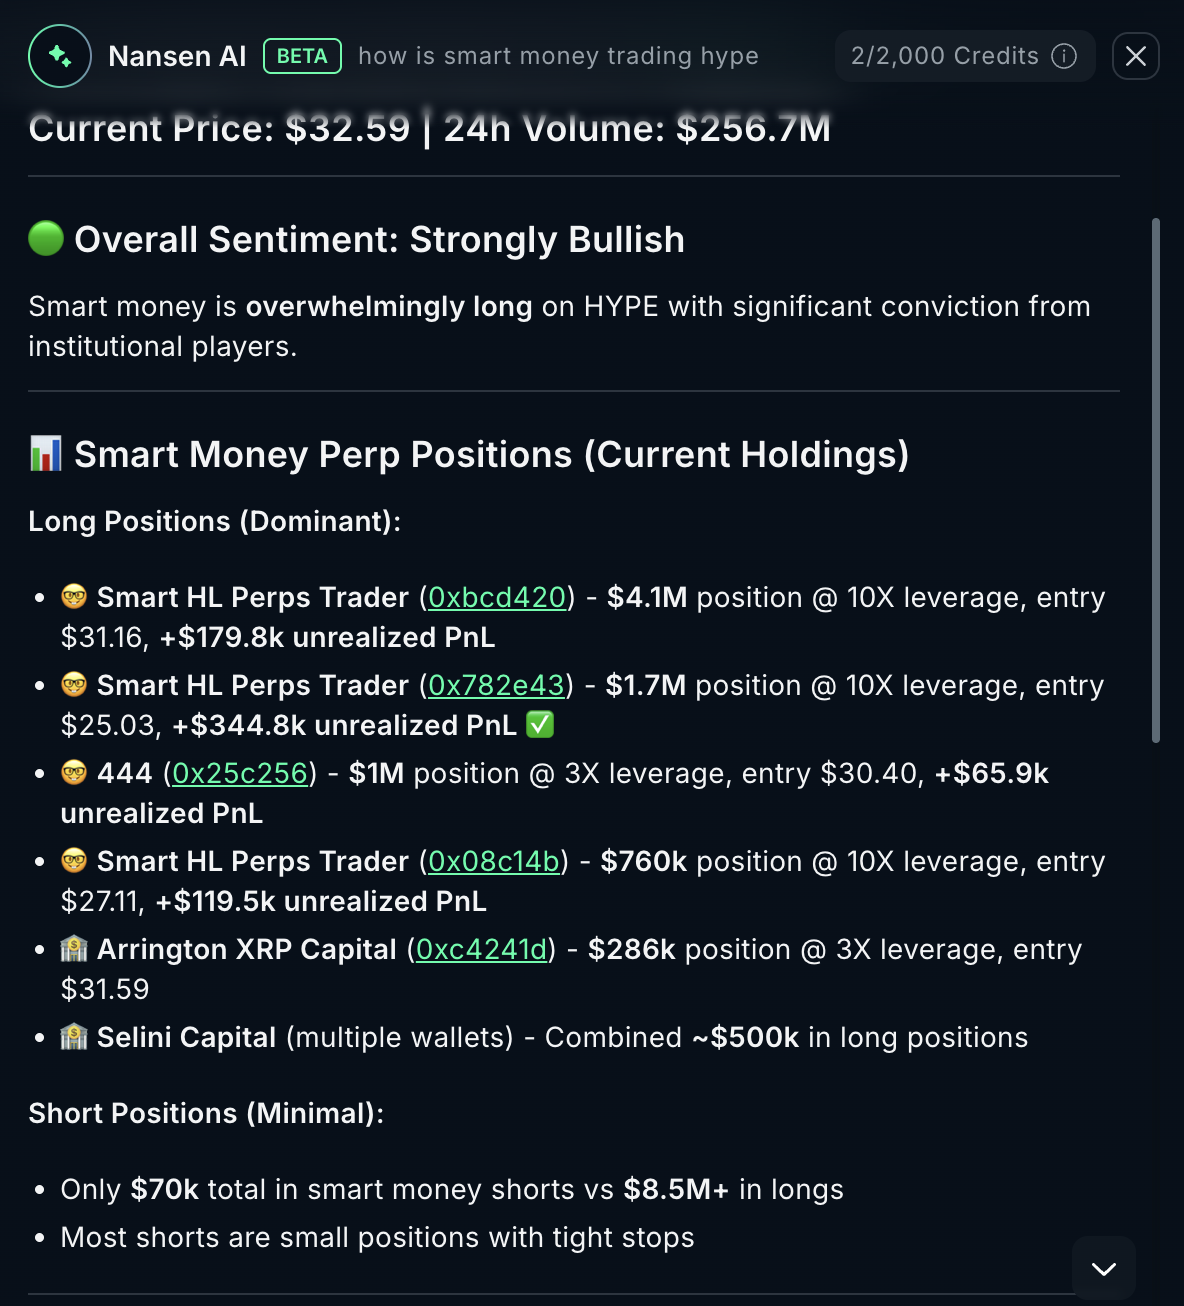
Named participants include Arrington XRP Capital with a $286,000 long entered near $31. Another one is Selini Capital with roughly $500,000 in combined longs across multiple wallets. Plus, there are several tracked smart Hyperliquid perps traders with entries ranging from $25 to $31 — all sitting on unrealized profits at press time.
Retail, however, is positioned in the opposite direction, especially in the broader timeframe. The Bybit HYPE/USDT 30-day liquidation map shows cumulative short liquidation leverage at approximately $33 million compared to roughly $23 million on the long side.
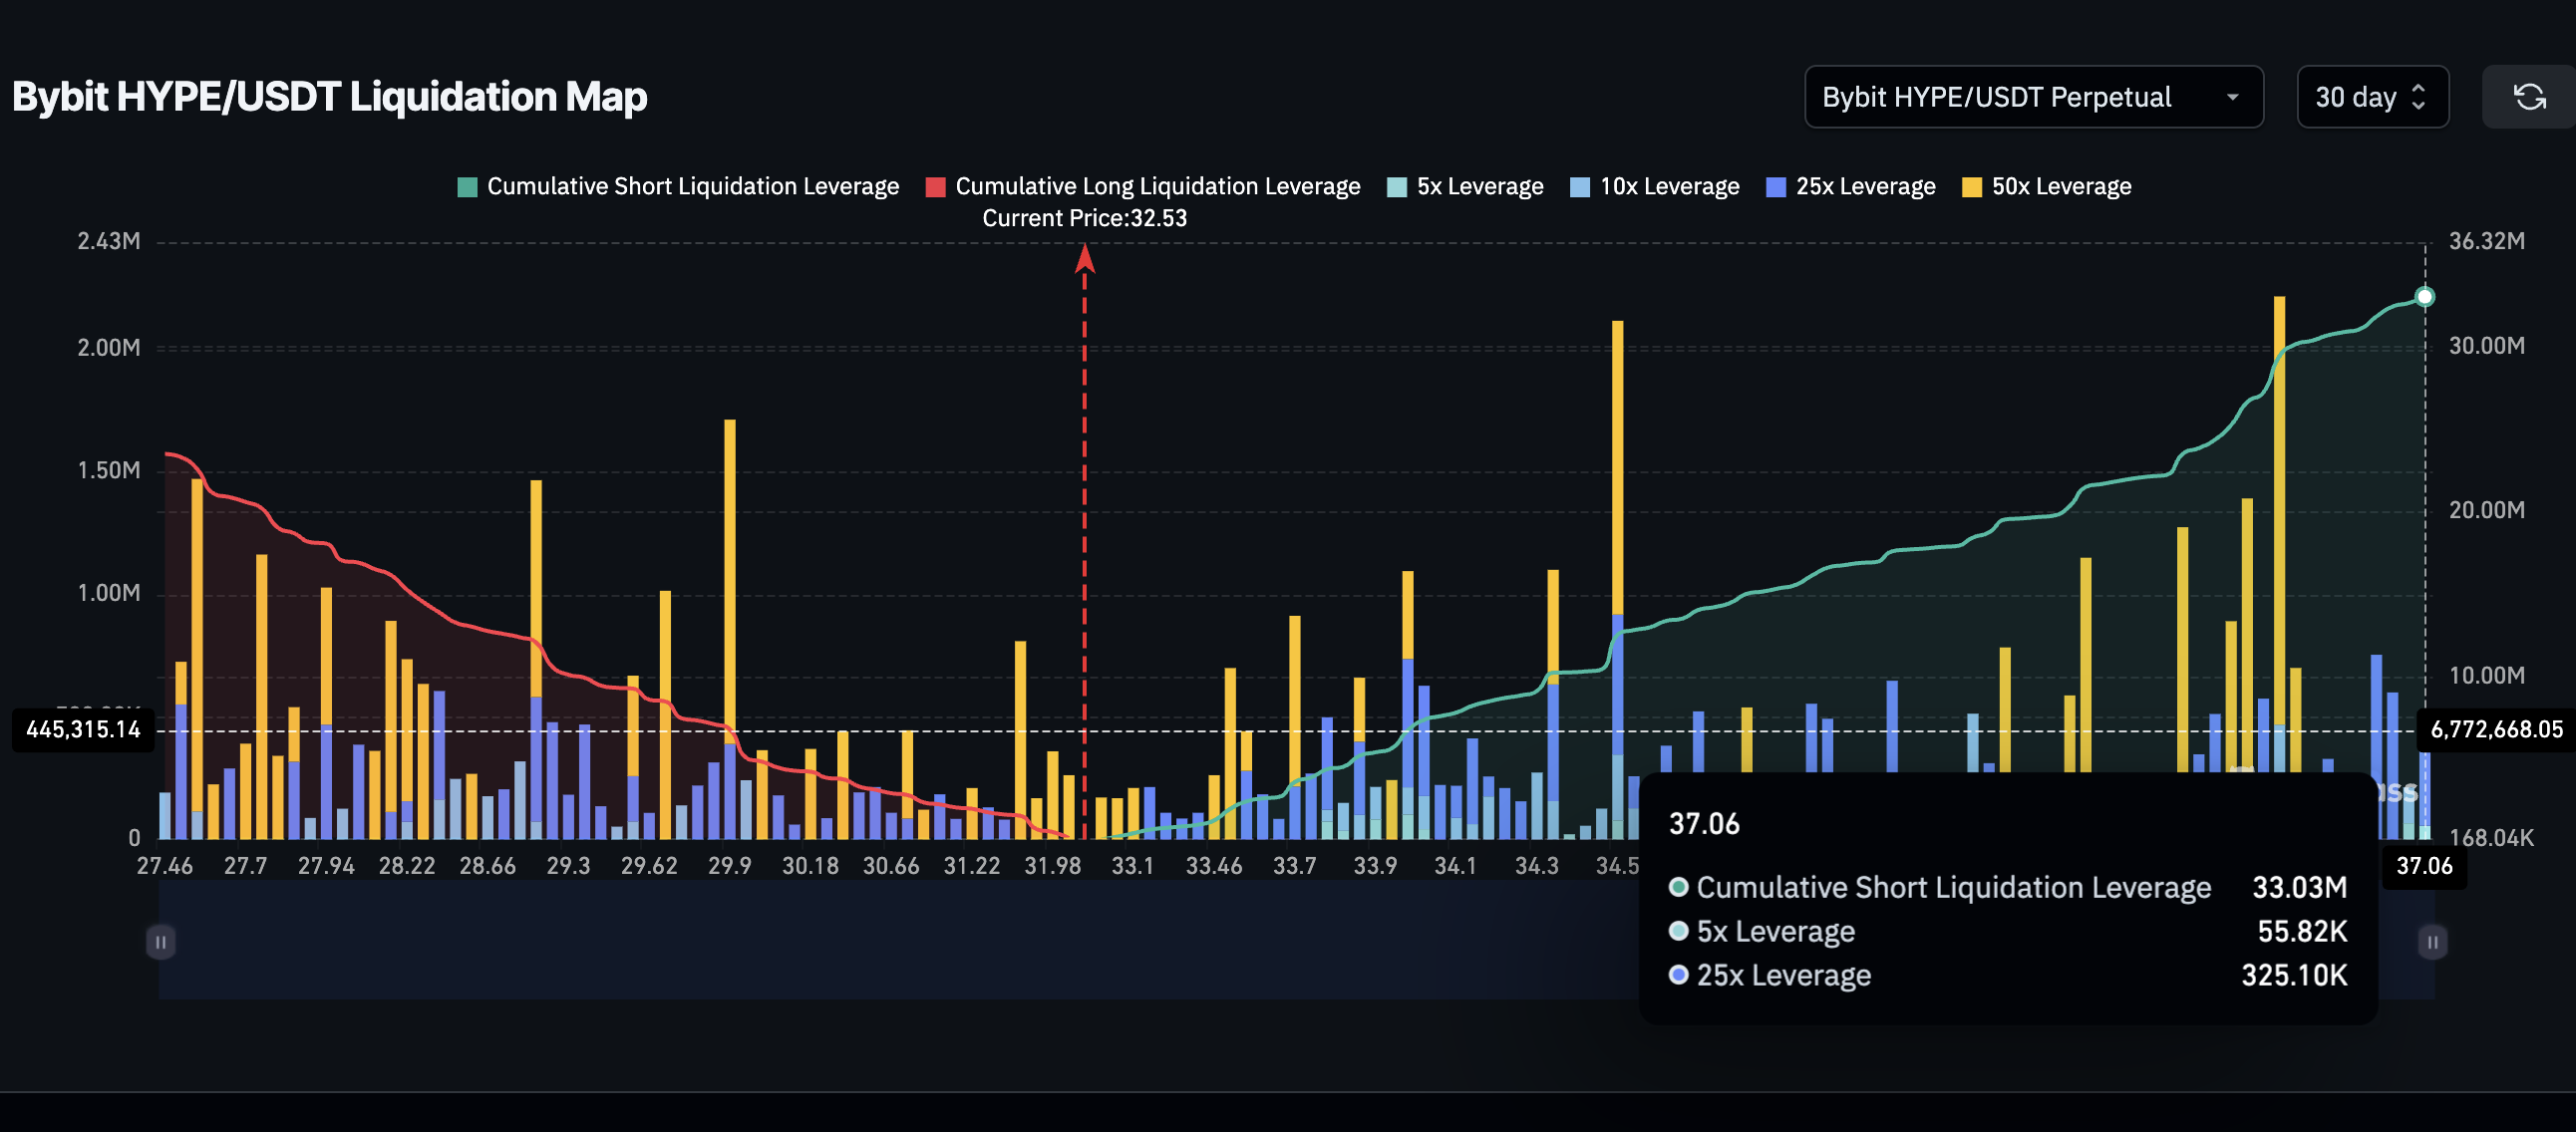
Short leverage clusters build significantly above the $34 range, creating potential fuel for a short squeeze if the Hyperliquid price pushes through that zone.
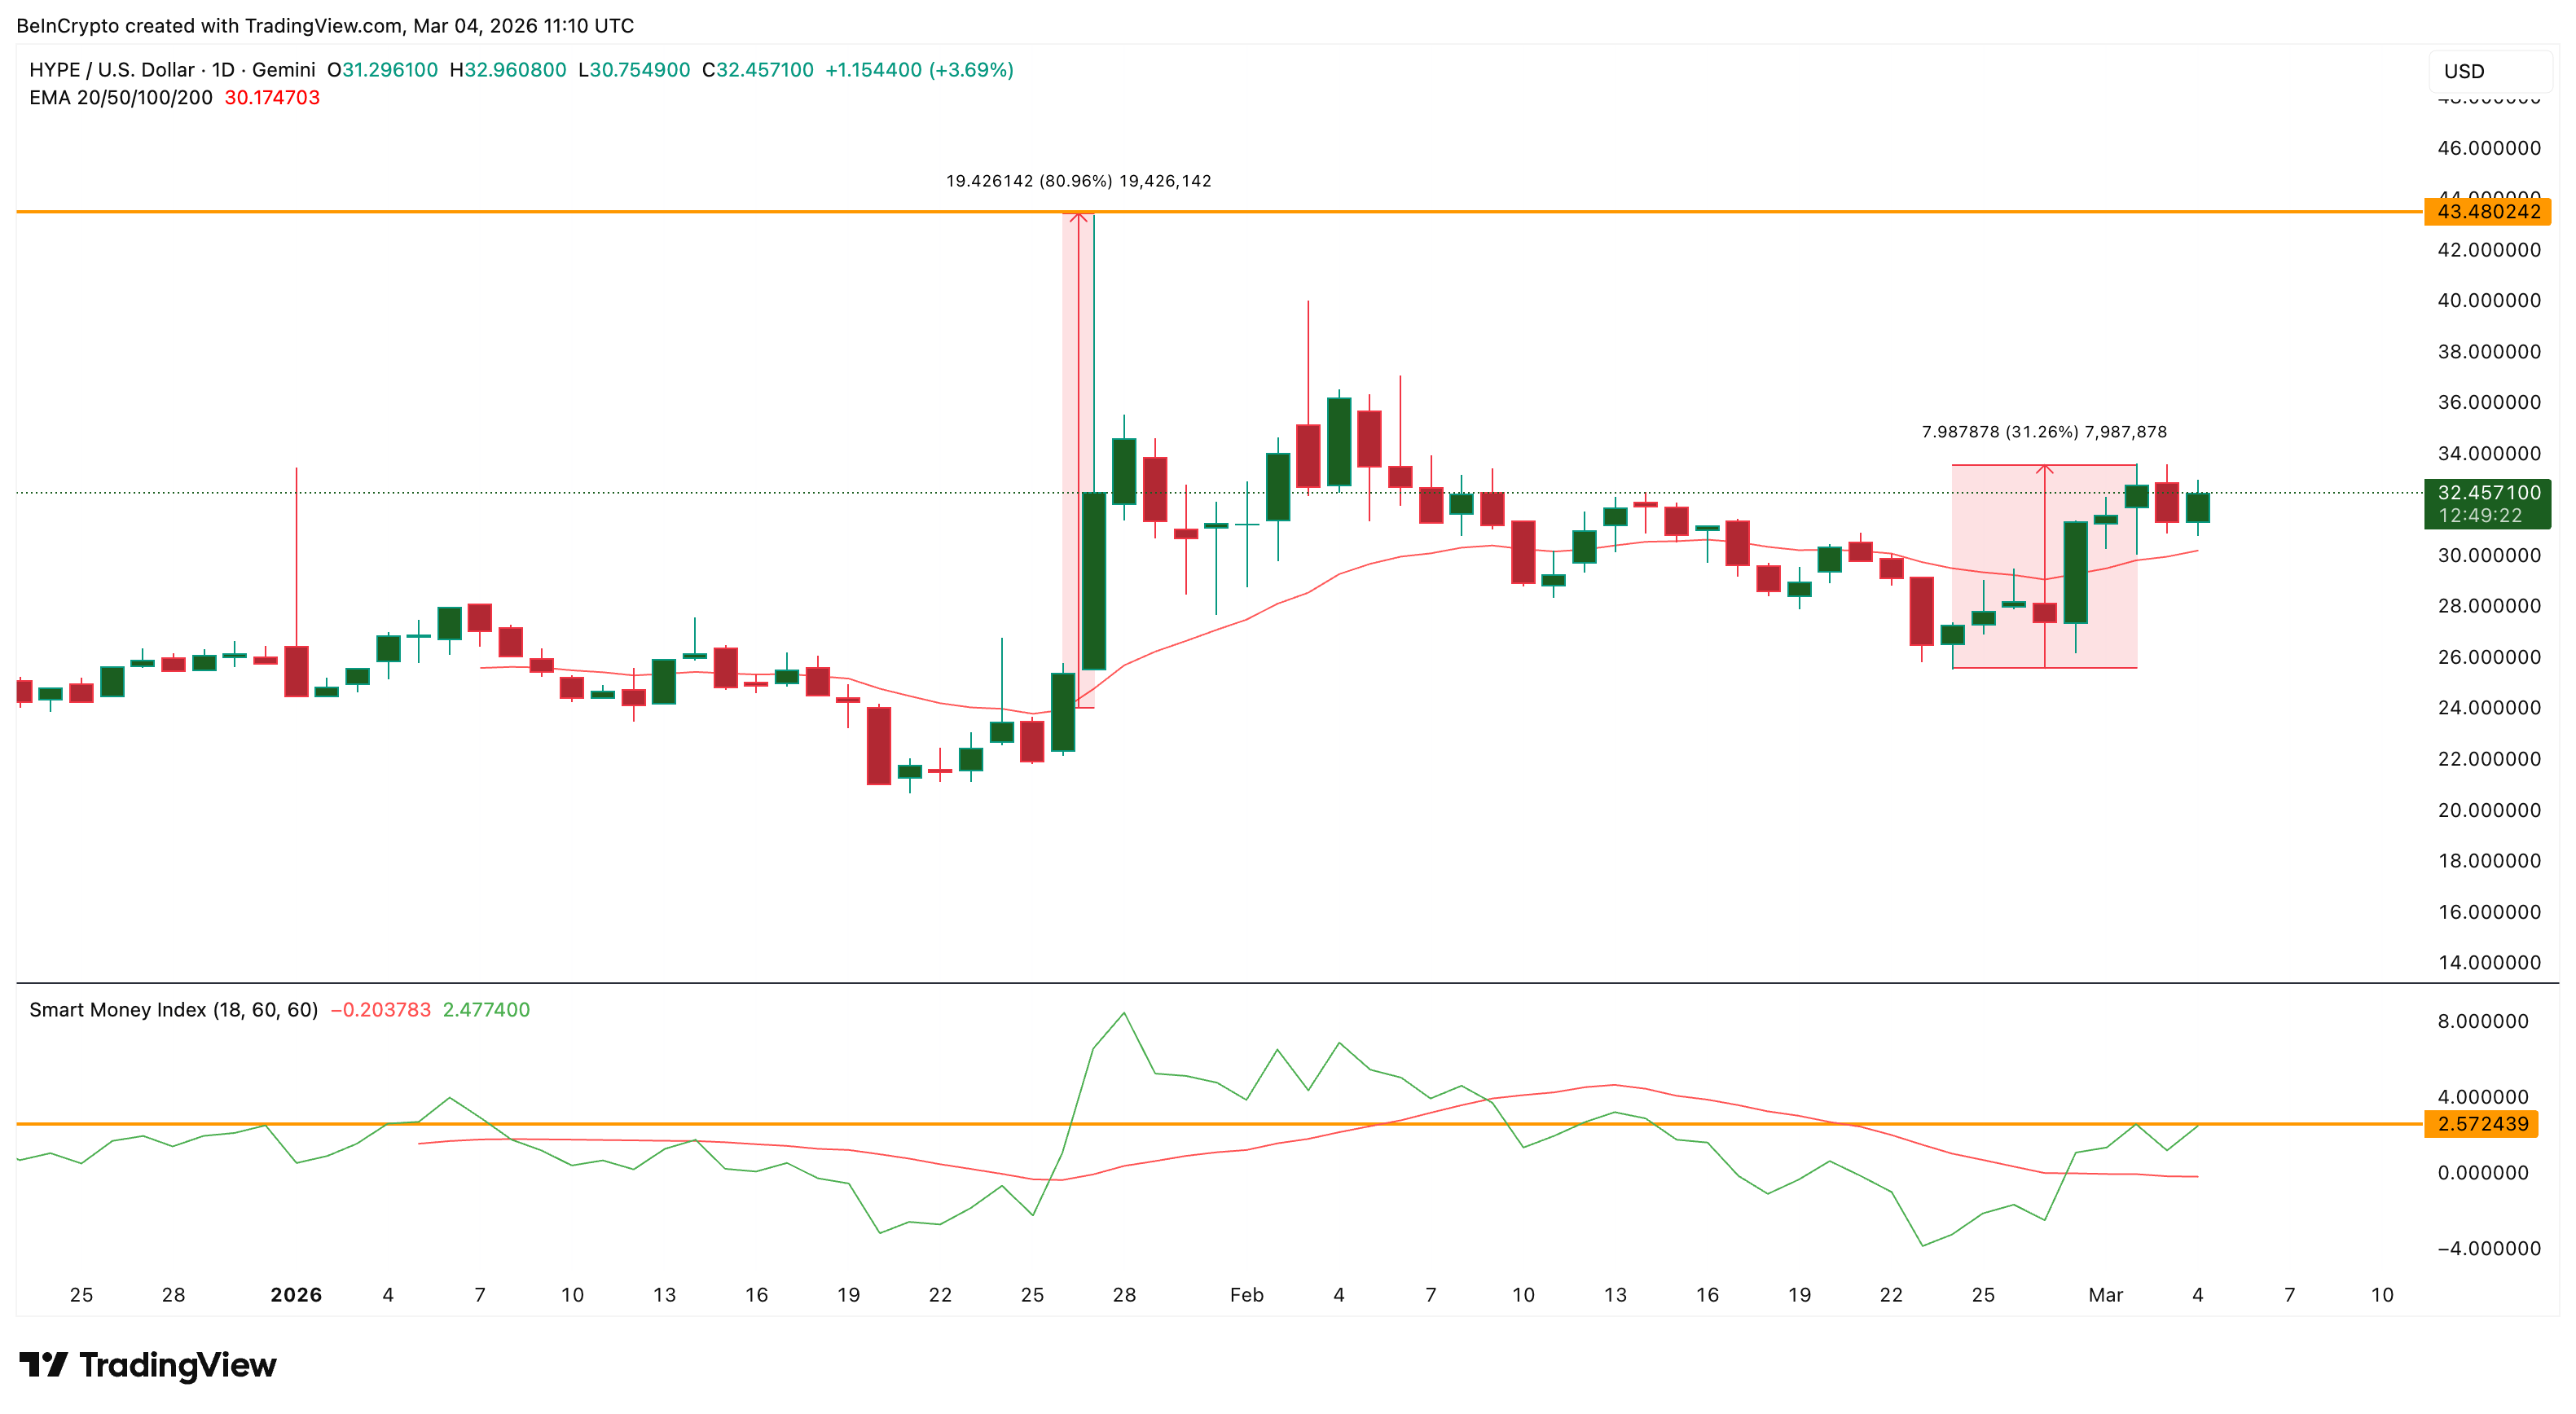
The Smart Money Index, which tracks the positioning of informed traders, on the technical chart, adds further confirmation for what the Nansen AI highlighted. It crossed above the signal line around Feb. 28, coinciding with the price acceleration. During the late January rally, this same indicator turned down right as sellers rejected HYPE at $43. This time, the indicator is pointing up again, though it still needs to clear the nearest horizontal resistance to confirm stronger momentum.
The divide is clear: smart money is accumulating HYPE while retail leans short. That setup, combined with the liquidation clusters above the price, has historically preceded sharp upward moves in crypto markets. And the technical levels above map out exactly where the next legs could go.
HYPE Price Targets $62 for a New All-Time High
The Hyperliquid price rally gained further technical significance when HYPE crossed and reclaimed the 20-day exponential moving average (EMA), a trend-following indicator. The last time this reclaim happened was in late January. HYPE subsequently rallied approximately 81% to $43 before sellers forced a correction.
Despite the current move measuring 31% from the swing low, HYPE is only about 15% above the 20-day EMA level itself. In the January instance, the token had moved much further above its EMA at the equivalent stage before accelerating into the full 81% rally. This suggests the current move may still be in its early stages if the pattern repeats.
Technical extension levels show that the immediate resistance sits near $34. It is also the zone where short liquidation leverage begins stacking heavily, making it the first real test. A break above $34 could trigger cascading short liquidations that accelerate the move.
The $39 represents one of the higher levels, followed by $43. Beyond $43, the technical extension reaches $48 and $62, which would represent a new all-time high, surpassing the September 2025 peak of over $59. From the current price near $32, that represents roughly 90% upside.
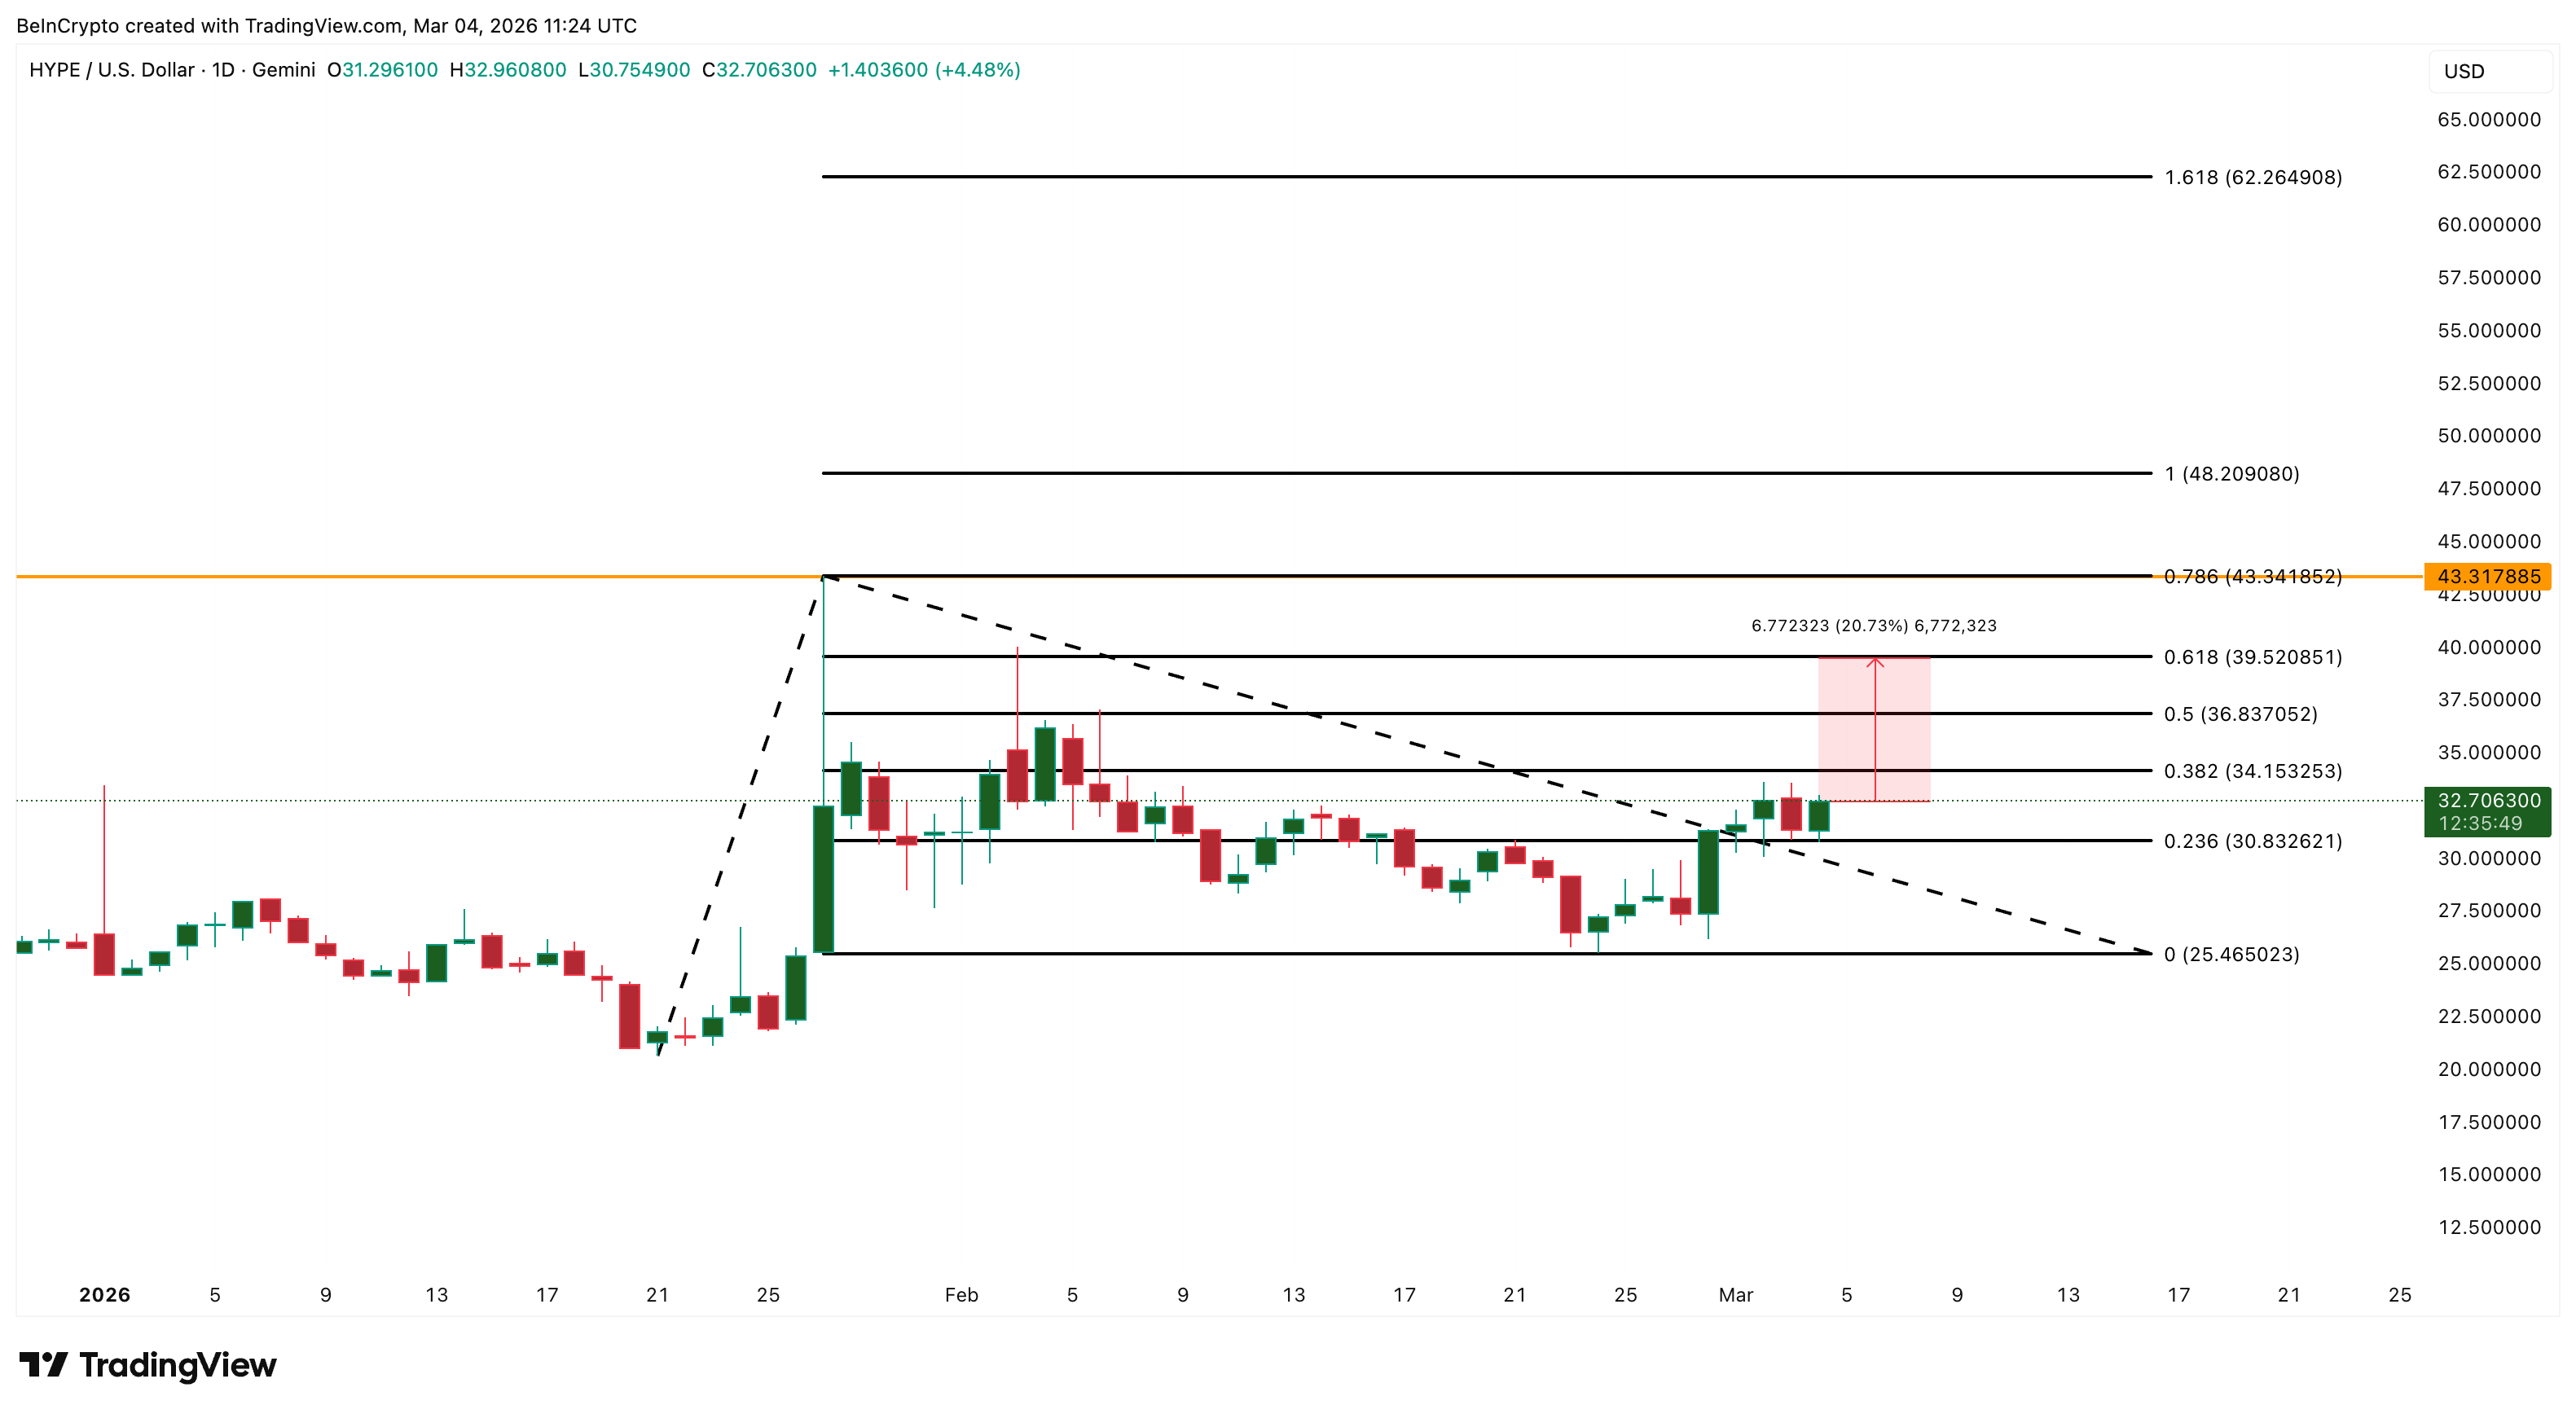
On the downside, losing $30 would weaken the bullish structure. A drop below $25 would invalidate the setup entirely, regardless of how strong the TradFi burn flywheel remains.


TLDR:
- Bitcoin trades near $75K as ETF inflows exceed $1B weekly, reversing a four-month outflow trend
- Stable US jobs data and easing geopolitics support risk assets across crypto and equity markets
- Solana and Ethereum upgrades improve efficiency, supporting network growth and user activity
- Institutional moves and rising stablecoin supply strengthen liquidity across crypto markets
Global markets are moving in a steady range as equities reach new highs while Bitcoin trades near $75,000. At the same time, ETF inflows, policy signals, and network upgrades are shaping current crypto market conditions.
Liquidity Conditions and Capital Flows Drive Market Stability
Market activity reflects a shift toward risk assets as liquidity conditions improve across global markets. Stocks are recording fresh highs, while Bitcoin continues consolidating within a narrow price range near $75,000.
A recent post by Nick Research outlined the current drivers influencing both crypto and traditional markets. The tweet noted strong ETF inflows exceeding $1 billion weekly, ending a four-month outflow streak. It also pointed to easing geopolitical tensions and steady earnings supporting a risk-on environment.
These ETF inflows indicate renewed institutional participation in digital assets. Capital movement into Bitcoin products shows improving sentiment among large investors after a prolonged period of reduced exposure.
At the same time, macroeconomic data in the United States remains stable. Job growth has shown recovery, while unemployment levels remain relatively low. This stability continues to support investor confidence across markets.
Geopolitical developments are also playing a role in shaping sentiment. Reports of easing tensions linked to a possible Iran ceasefire are contributing to a more favorable risk environment.
Monetary policy expectations are shifting gradually. The Federal Reserve is expected to ease at a slower pace, with rates projected near 3% by year-end. Quantitative tightening has paused, easing pressure on liquidity conditions.
Bitcoin is also showing increased correlation with traditional markets. The asset is now moving closely with the S&P 500 and gold, reflecting broader macro alignment.
Institutional Activity and Blockchain Upgrades Support Momentum
Beyond macro factors, institutional actions and blockchain upgrades are shaping current market conditions. Regulatory developments remain active, with the CLARITY Act expected to move into Senate markup in the coming weeks.
Institutional involvement continues to expand within the crypto sector. Deutsche Börse has committed $200 million to Kraken, signaling continued engagement from established financial firms.
In addition, Goldman Sachs has filed for a Bitcoin ETF, adding to the list of institutional products targeting digital asset exposure. These filings show continued integration between traditional finance and crypto markets.
Network upgrades are also contributing to improved efficiency across blockchain ecosystems. The Solana SIMD-266 upgrade is expected to reduce data costs by up to 98%, improving network performance.
Ethereum is preparing for upcoming upgrades, including Pectra and Glamsterdam. These updates are designed to enhance scalability and maintain network competitiveness.
Supply conditions remain another factor shaping the market. The post-halving environment continues to limit Bitcoin supply, while stablecoin supply is expanding toward the $1 trillion level.
This growth in stablecoin supply reflects increasing liquidity within the digital asset ecosystem. It also supports trading activity and broader market participation.
Together, macro stability, institutional flows, and network upgrades are shaping current market direction. These elements are driving activity across both crypto and traditional financial markets.

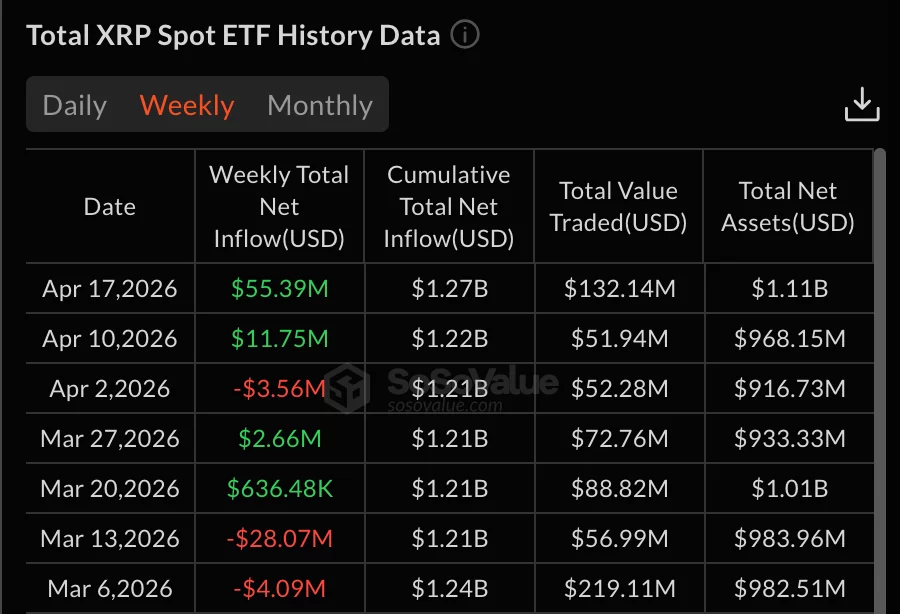
XRP exchange-traded products have recorded their strongest weekly inflows of the year.
Summary
- XRP ETFs recorded $55.39 million in weekly inflows, the highest level seen in 2026.
- Institutional investors increased exposure after XRP price rose more than 7 percent last week.
- Analysts note XRP remains within long-term bullish structure despite short-term market volatility signals.
The increase comes after renewed interest from both retail and institutional investors across the broader crypto market.
Data from SoSoValue showed that XRP ETFs attracted $55.39 million in net inflows over the past week. This marks the first time in 2026 that inflows have reached this level after several weeks of weaker performance.

The ETF products did not record any daily outflows during the week, indicating steady demand across all trading sessions.
Institutional investors increased exposure to XRP-linked investment products following a recent rise in price activity. XRP recorded a price gain of more than 7 percent over the same period.
Market data showed consistent inflows throughout the week, with the lowest daily intake at $1.46 million on April 13. Other trading days recorded higher levels of capital movement into XRP ETFs.
The broader crypto market also showed improved sentiment during the same period, which supported demand for digital asset investment products.
Market position and price performance
At press time, XRP traded near $1.43 with a market capitalization of approximately $88 billion. The asset recorded a slight daily decline but maintained a positive weekly performance.
Trading volume remained above $2 billion in the last 24 hours, reflecting continued market participation. XRP also appears positioned to end a multi-month period of negative returns, after six consecutive months of losses that began in late 2025.
The market movement follows volatility linked to earlier macroeconomic conditions, including a sharp correction in October 2025.
Meanwhile, market commentary from analyst EGRAG CRYPTO has focused on long-term chart patterns. The analyst stated “”the Bifrost Bridge is still our guide”” when describing XRP’s current structure.
The analysis suggests XRP remains inside a broader channel despite short-term pattern breakdowns. The commentary also noted that descending triangle formations may not fully reflect the wider trend.
The analyst added “”this is not a breakdown, this is a setup”” when referring to projected price levels between $9 and $13. The view is based on long-term accumulation phases and market structure interpretation.
Disclosure: This article does not represent investment advice. The content and materials featured on this page are for educational purposes only.

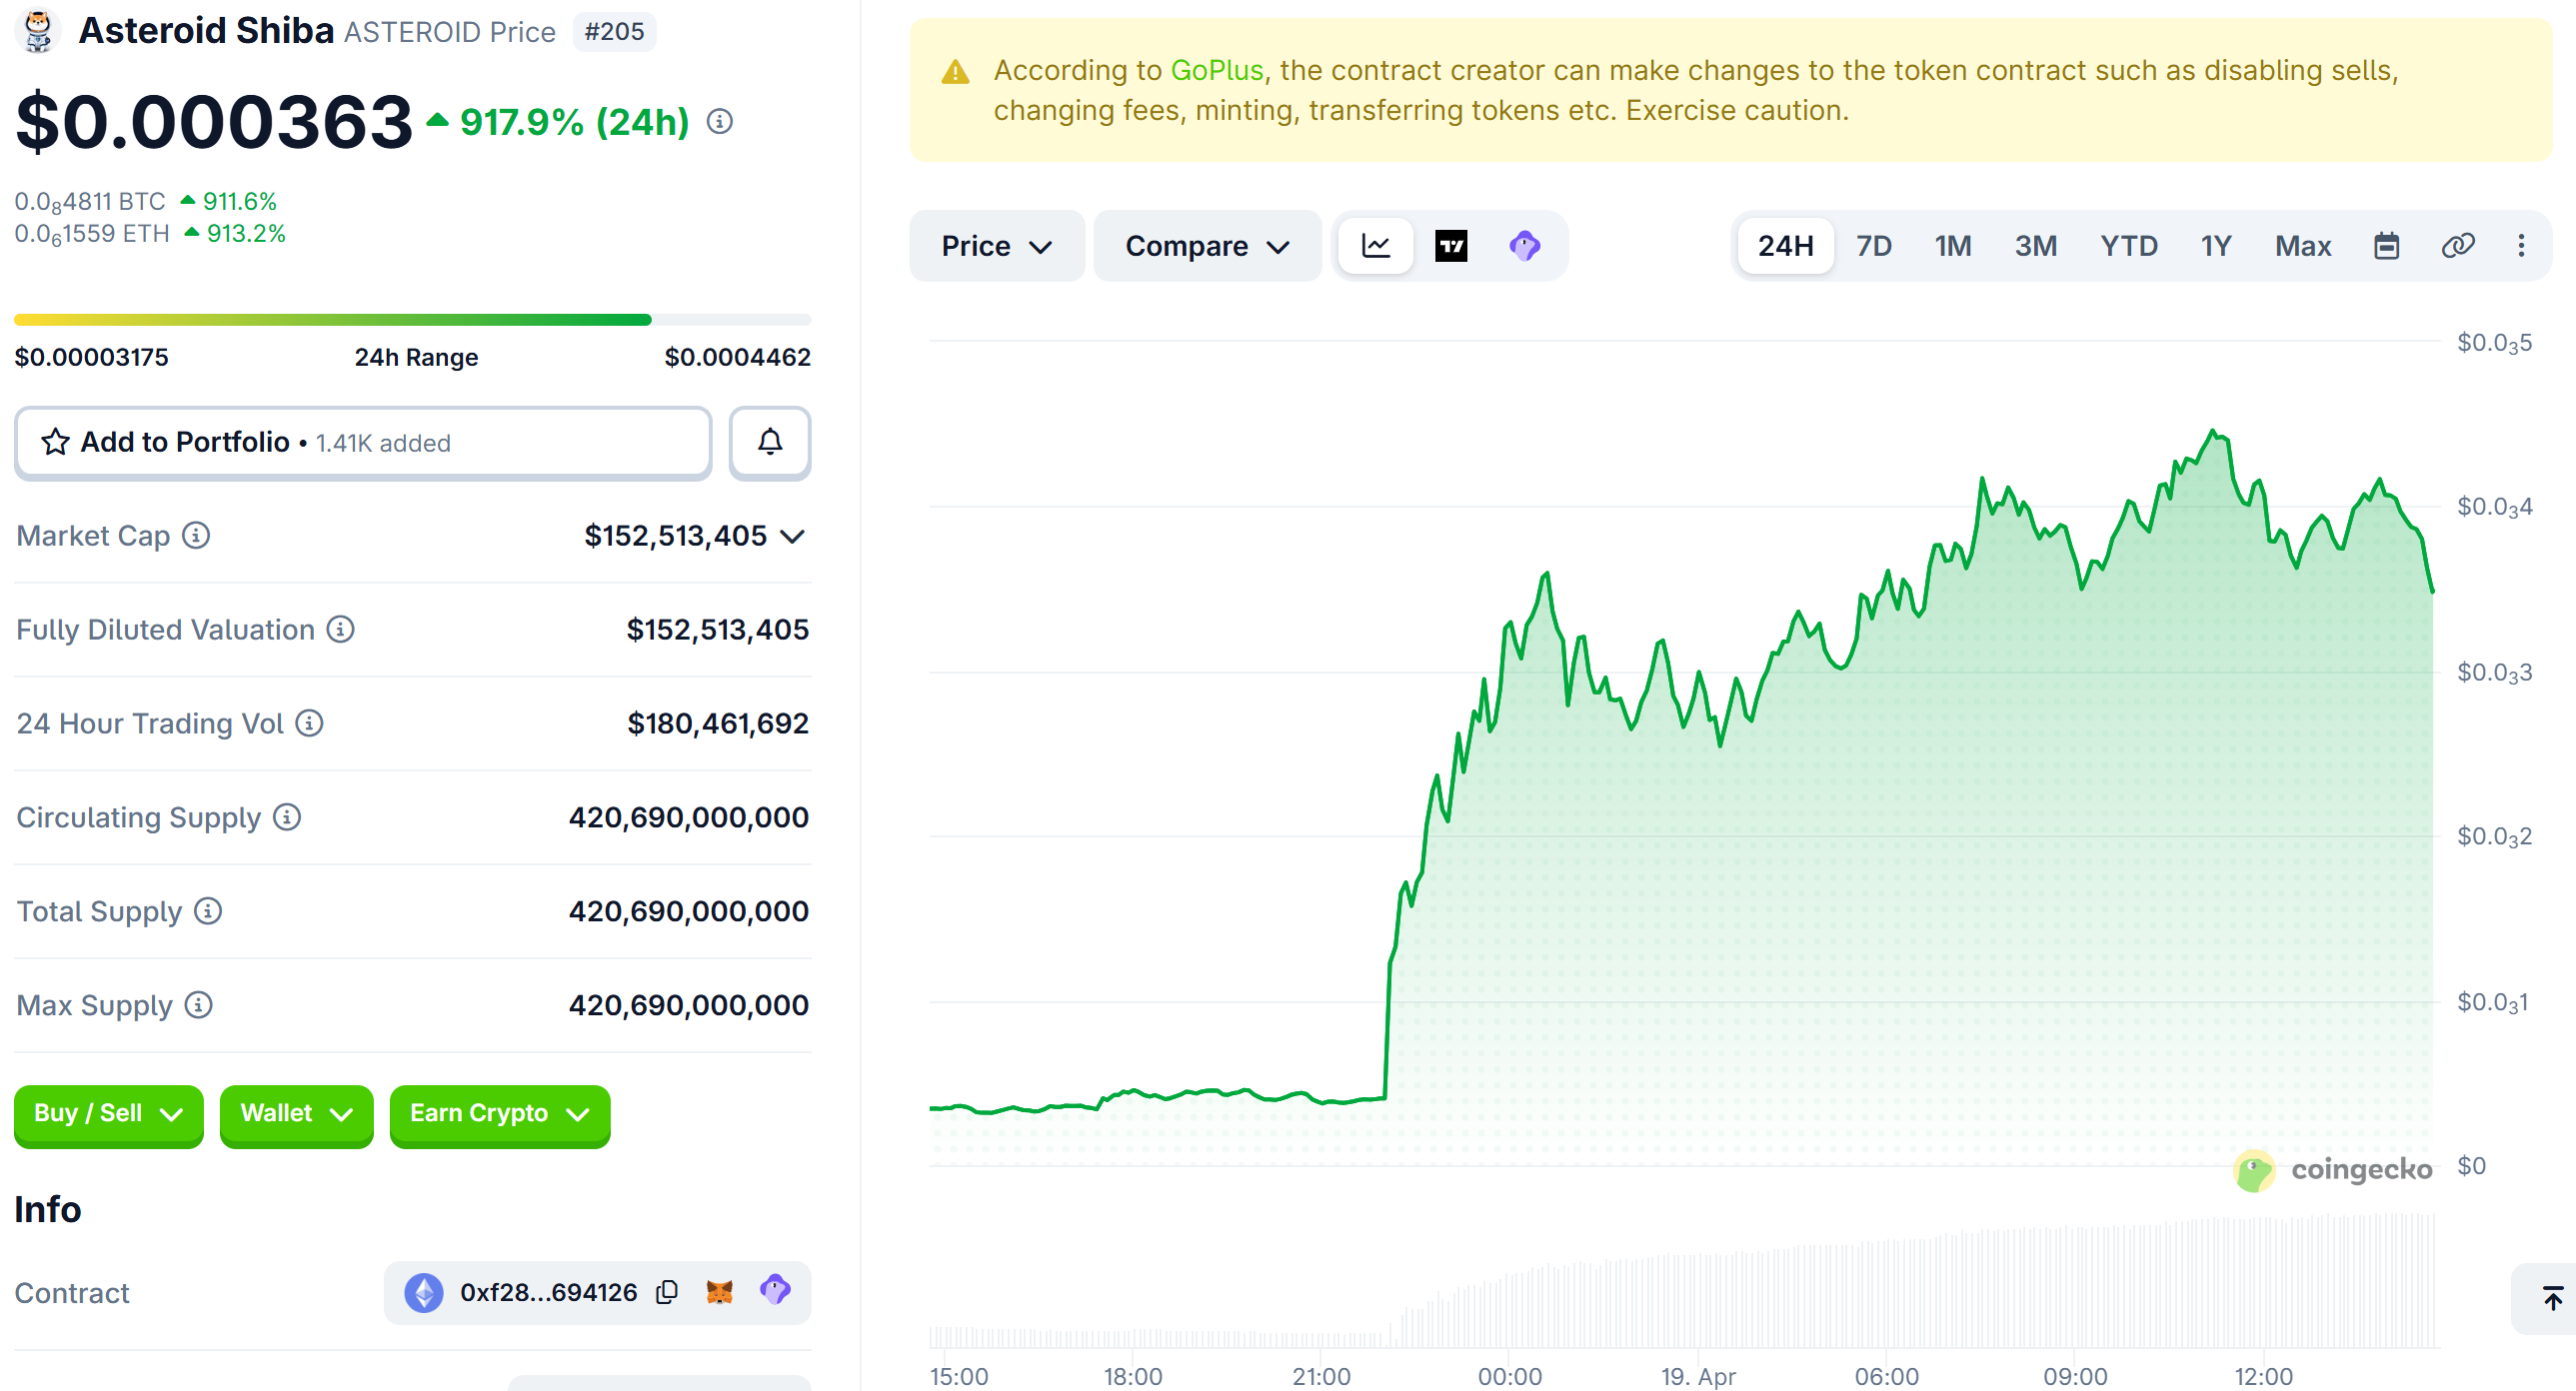
A trader sold 7.43 billion Asteroid Shiba (ASTEROID) tokens for $405 just one day before the meme coin rallied over 920%, turning that same position into a $2.6 million windfall.
On-chain data from Lookonchain revealed that wallet 0x5811 had bought the tokens 80 days earlier for $542. The sale locked in a $137 loss, erasing what would have been a life-changing gain.
What Triggered the Asteroid Shiba Rally
The rally began after Elon Musk replied to eight questions left behind by Liv Perrotto, a 15-year-old who died in January after a five-year battle with cancer.
Perrotto had designed a plush Shiba Inu named Asteroid as the zero-gravity indicator for SpaceX’s Polaris Dawn mission in September 2024.
For her final question, she asked Musk to make Asteroid the official SpaceX mascot. He agreed.
The Asteroid Shiba price is up by almost 920%, and nearly 68,000% in the last week.
Her mother, Rebecca Perrotto, responded on X, thanking him for keeping her daughter’s memory alive.
“You didn’t just honor a young girl’s dream, you are keeping her spirit alive. Liv’s love, her laughter, her unbreakable fight lives on through Asteroid,” she wrote.
Winners, Losers, and Risk
While wallet 0x5811 missed millions, another trader turned roughly $1,800 in ETH into nearly $500,000 within hours of Musk’s post.
However, Musk’s ability to move meme coins has shown signs of fading. Previous Musk-linked rallies in tokens like GORK and KEKIUS were short-lived.
Musk himself has previously compared meme coins to gambling. ASTEROID has no product, roadmap, or team behind it. The token carries significant risk for anyone buying after the initial move.
“If you expect to win at meme coins, you’re being foolish. You’re not going to win with meme coins. Don’t sink your life savings into a meme coin,” he said in an interview with The Joe Rogan Experience podcast.
The post Asteroid Shiba Gains 920% After Musk Names SpaceX Mascot, But One Trader Misses Big appeared first on BeInCrypto.
Crypto World
Arbitrum (ARB) Breaks Descending Trendline After 96% Crash: Analyst Eyes 7400% Return to $5+
TLDR:
- ARB has dropped 96.36% from its all-time high, now trading at $0.12 after a prolonged descending channel.
- A liquidity sweep below dynamic support confirmed capitulation, triggering a 57% rally from the $0.07–$0.095 demand zone.
- Bullish structure remains valid only if ARB reclaims and holds above $0.27; a breach of $0.065 invalidates the setup.
- Analyst bull cycle targets for ARB range from $0.27 to $5+, representing a potential upside of over 7400% from lows.
Arbitrum (ARB) has broken out of a multi-year descending trendline following a 96% drawdown from its all-time high. The token, currently trading at $0.12, is drawing fresh attention after printing a 57% rally from its cycle lows.
Analysts are now pointing to a potential 7400% return from current levels, with targets stretching to $5 and beyond.
The breakout comes after a prolonged accumulation phase that appears to have absorbed the final wave of selling pressure.
Trendline Break Follows Months of Capitulation and Liquidity Sweeps
ARB spent the better part of its post-2024 cycle trapped inside a brutal descending channel. Every bounce within that structure attracted retail buyers, only to be met with another wave of distribution. The repeated pattern of fake reversals kept bearish pressure firmly in control throughout the decline.
Crypto analyst Crypto Patel flagged a high-risk accumulation zone between $0.095 and $0.07 well before the recent move.
According to the analyst, price completed a full liquidation phase inside that zone before reversing. That sweep of stops below dynamic support confirmed what technicians call a liquidity grab or SSL sweep.
Following that sweep, ARB rallied 57% from its lows, breaking above the descending trendline that had capped price for over a year.
Crypto Patel noted that traders who entered from the previous accumulation call are now sitting on approximately 50% gains. That kind of follow-through after a capitulation event carries more weight than a typical relief rally.
The trendline break, combined with the liquidity sweep below dynamic support, sets up a textbook post-accumulation structure.
However, traders should note that a single breakout candle does not guarantee continuation. Price action in the coming weeks will determine whether this move holds or fades back into the prior range.
Analyst Maps Out Targets as ARB Eyes Structural Recovery
For the bullish case to remain intact, ARB must reclaim and hold above $0.27 on higher timeframes. That level serves as the primary support-resistance flip zone and the first gate for confirming trend recovery. A failure to reclaim $0.27 keeps the structure vulnerable to another distribution leg.
Crypto Patel outlined a full ladder of bull cycle targets starting at $0.27, followed by $0.50, $1.20, $2.50, and $5 or higher.
The previous cycle high of $2.425 is marked as an exit liquidity zone, meaning price could push through it before facing heavier resistance. A move to $5 from current levels would represent a gain of over 7400%.
The invalidation level sits at a two-week close below $0.065. A confirmed close at that level would signal that the accumulation thesis has failed. Until that line breaks, the broader setup remains active for traders who entered near the demand zone.
ARB’s 96.36% macro correction places it among the hardest-hit assets in the current altcoin cycle. Whether the trendline break marks a genuine turning point depends entirely on how price behaves around the $0.27 reclaim in the sessions ahead.

Bitcoin paused its recent ascent as geopolitical tensions resurfaced over the weekend, keeping markets wary of a broader conflict between the United States and Iran. With renewed talk of the Strait of Hormuz facing disruption, traders weighed the potential for an oil-price shock against the appetite for risk assets, including cryptocurrencies. Bitcoin traded near the mid-$70,000s, attempting to defend key levels ahead of Sunday’s weekly close after briefly brushing higher late in the week.
Data and market chatter pointed to a fresh sense of tension. Bitcoin climbed to around $78,400 on Friday, a ten-week high, before retreating as headlines shifted and risk appetite tempered. By Sunday, the price was hovering near $75,000, signaling a pullback after the prior surge. The backdrop remained fluid as market participants gauged whether a ceasefire or renewed hostilities would take hold, and how such developments would interact with oil and broader macro moves.
Key takeaways
- Bitcoin faced renewed resistance near the 21-week exponential moving average, a level around $78,900, as it retraced from intraday highs.
- The geopolitical context intensified oil-market risk: reports of renewed disruptions to the Strait of Hormuz heightened concerns about a potential supply shock and its spillover to risk assets, including crypto assets.
- Oil prices showed sensitivity to headlines, with WTI crude trading below $80 per barrel on some signals of a possible ceasefire, highlighting the link between macro risk and crypto sentiment.
- Market mood remained bullish but vulnerable to sudden news or social-media sparks, with traders cautioning that a single headline or tweet could shift momentum.
- Liquidation data pointed to notable risk-off liquidity pressures, with aggregate crypto liquidations around $260 million over a 24-hour window, underscoring the fragility of near-term positions.
Oil, war fears and the price backdrop
Oil markets became a focal point again as the weekend’s headlines revived fears of a renewed US-Iran confrontation. Reports of renewed activity around the Strait of Hormuz amplified concerns about supply disruptions and renewed price volatility for crude futures. In tandem, traders watched how oil moves might influence appetite across crypto markets, where liquidity often shifts with macro headlines rather than purely idiosyncratic crypto catalysts.
Communication around a possible ceasefire or de-escalation did little to steady the longer-term risk calculus, and oil traders noted that even partial headlines could trigger quick reactions in prices. The up-and-down dynamic in oil underscored a broader market logic: when macro risk rises, risk assets can be pressured, even those like Bitcoin that some participants view as a hedge or diversifier in times of macro uncertainty.
For now, the day-to-day energy-relevant headlines remain a meaningful driver for traders looking for directional cues in crypto. The oscillation between hawkish rhetoric and quiet moments of diplomatic negotiation has the potential to tilt sentiment on short timeframes, particularly if the Strait of Hormuz scenario tightens again or if oil futures react decisively to any fresh geopolitical signals.
Bitcoin price action and key technical themes
Beyond the headlines, Bitcoin’s price action in the near term has been tethered to a critical technical juncture. A close near the weekly low around $75,000 would keep the market within a range defined by a rising but tested resistance near the 21-week EMA. The EMA, a broad gauge of medium-term momentum, sits close to $78,900 and has repeatedly acted as a cap on advances in recent sessions. Rejection at this level could set up a retest of nearby support zones and, depending on weekly closes, potentially expose traders to a retest of the lower boundary of a prior consolidation pattern around the mid-$70k area.
Analysts have flagged the possibility that the market could undergo a short-term pullback even amid a broader bullish backdrop. The sense that sentiment is “overwhelmingly bullish” at present notwithstanding, some observers warned that a sudden shift—whether from a social-media post, a geopolitical headline, or a shift in macro data—could reframe risk appetite quickly. As one market watcher cautioned, “sentiment is bullish, but that could change with one Tweet in the coming days.”
On the micro front, leveraged long positions and other speculative bets faced pressure as Bitcoin retraced from intraday highs. Data aggregators tracked a flurry of liquidations across the broader crypto complex, with total crypto liquidations estimated at about $260 million over a 24-hour window as traders recalibrated exposures in light of the move lower. The quick swing underscored the sensitivity of near-term price action to changes in market mood, even as longer-run fundamentals remained a topic of ongoing debate among investors and builders alike.
From a futures perspective, some traders looked to a potential gap opening in CME Group’s Bitcoin futures market at the start of the week. Historical precedents show gaps can act as magnets for price action after a weekend or holiday backdrop, drawing participants to monitor the opening prints for signs of momentum. As the weekend downward drift fed into talk of a fresh gap, observers anticipated whether the “week opening magnet” effect might pull BTC higher or contribute to further consolidation near a key level.
Looking further ahead, prominent technical analysts emphasized the importance of a weekly close near critical support and resistance zones. For instance, commentary highlighted a potential post-breakout retest of the upper boundary of a former double-bottom pattern if the weekly candle closes show structural resilience. In practical terms, a weekly close that preserves the bullish structure could set the stage for renewed attempts to challenge the $80k barrier and beyond, provided macro and crypto-specific catalysts line up.
Market dynamics, signals and what to watch next
Beyond the price tape, several threads are shaping the near-term narrative. Traders are watching sentiment drivers that could tip the balance from cautious optimism to renewed risk appetite or vice versa. The presence of a volatile macro backdrop—where geopolitical headlines, oil-price moves and policy signals intersect—means crypto markets could quickly flip direction if a major headline emerges.
In addition to macro factors, liquidity dynamics remain a critical determinant of short-term price action. The recent wave of liquidations is a reminder that the crypto market can exhibit sharp, disorderly moves when positions are unwound rapidly. For traders, it’s a reminder to manage risk and to avoid overreliance on a single data point or indicator, especially in an environment where headlines can outrun technical signals.
On the technological and adoption side, observers continue to monitor how broader macro volatility may influence demand for decentralized finance, layer-1 ecosystems, or crypto-native hedging strategies. While Bitcoin and the wider market have shown resilience at times, the path forward will likely hinge on how the geopolitical situation evolves, how oil markets respond to headlines, and whether risk appetite returns with a stronger, more durable macro backdrop.
Industry voices have offered a cautious note: the current setup could breed both opportunity and risk. If the market can digest the latest headlines without triggering a self-sustaining downside, Bitcoin could attempt to extend gains toward the high-$70k region and perhaps test the previous swing highs. Conversely, a renewed spike in energy prices or an escalation in tensions could reassert downside pressure, prompting a reversion toward key support near the mid-$70k zone.
Notably, the weekend’s developments—and the ensuing discussions about possible gaps in CME futures—illustrate how crypto markets are increasingly intertwined with macro narratives. For investors and builders, the takeaway is clear: macro headlines remain a primary channel of influence, and the next few sessions could be decisive in establishing the next directional bias for Bitcoin and the broader crypto complex.
As the week opens, traders will be scanning a constellation of inputs: oil-price movements, any shifts in geopolitical talk, and the technical signals from Bitcoin’s chart, particularly the interplay with the 21-week EMA and the possibility of a retest of critical support. The coming days will reveal whether current bullish undertones harden into a sustained up-leg or whether the market cools and consolidates as macro uncertainties persist.
Meanwhile, observers will continue to monitor the macro backdrop for signs of a lasting shift in risk sentiment. If the Strait of Hormuz remains stable or oil prices stabilize despite headlines, there could be a constructive setup for Bitcoin and altcoins. If not, the market could test previously broken levels and reassert risk-off dynamics across digital assets.
What remains uncertain is how quickly macro news translates into crypto price action and whether any single event can set a new baseline for risk appetite. Readers should keep a close eye on the weekly close, the trajectory of oil futures, and the dynamics of CME futures gaps, all of which will shape the near-term path for Bitcoin and the wider market in the days ahead.
Crypto World
Caitlyn Jenner Wins $JENNER Memecoin Lawsuit as Federal Court Rules Token Is Not a Security
TLDR:
- A California federal court dismissed all Securities Act claims against Caitlyn Jenner over the $JENNER memecoin on April 16, 2026.
- The court ruled the $JENNER Ethereum token failed the Howey test due to lack of horizontal and vertical commonality among investors.
- Jenner’s 3% transaction tax gave her independent income regardless of investor losses, defeating vertical commonality claims in court.
- State law claims for fraud and quasi contract were dismissed without prejudice, leaving Greenfield the option to refile in California state court.
Caitlyn Jenner wins lawsuit after a California federal court dismissed all securities claims tied to the $JENNER cryptocurrency token.
Lead plaintiff Lee Greenfield had sued Jenner and her manager Sophia Hutchins, alleging the token was an unregistered security.
The U.S. District Court for the Central District of California ruled on April 16, 2026, that the Ethereum-based token did not meet the legal definition of a security. Greenfield had lost over $40,000 in the investment.
Judge Rules $JENNER Token Fails the Howey Test for Securities
The court applied the longstanding Howey test to determine whether the $JENNER token qualified as an investment contract.
That test requires proof of a common enterprise and an expectation of profits from others’ efforts. Greenfield could not satisfy either requirement, and the court dismissed the Securities Act claim with prejudice.
Greenfield argued that all token holders experienced identical percentage gains and losses, proving horizontal commonality.
The court disagreed, stating that parallel price movement does not substitute for pooling of investor funds. The SAC itself acknowledged that cryptocurrencies like the $JENNER token “lack utility other than as a store and transfer of value.”
Jenner and Hutchins made no development commitments behind the $JENNER token. Defendants described it plainly as “a memecoin on the Ethereum blockchain intended solely for entertainment purposes.” No funds were raised to build any product, software, or ecosystem connected to the token.
Jenner’s promotion included an AI-generated tweet image of her in a “JENNER ETH” T-shirt carrying an American flag.
A crowd member in the image held a sign reading, “LETS MAKE EVERYONE RICH!” Hutchins further promoted the project by touting Jenner’s ability to “bring attention and investors into the project,” citing her awards, fame, and powerful connections.
The court ruled that promotional activity alone could not replace the pooling structure that securities law requires.
Jenner’s Transaction Tax Seals Vertical Commonality Argument Against Plaintiff
Greenfield also pursued vertical commonality, pointing to Jenner’s holdings of over 20 million $JENNER tokens. He argued her financial stake linked her fortunes directly to those of investors. The court found otherwise, citing her 3% transaction tax as a decisive factor working in Jenner’s favor.
During a Twitter Spaces chat, Jenner said tax proceeds would fund Trump campaign donations, buybacks, and marketing.
When an X user pushed back, writing, “Use half of the taxes for buybacks. The community doesn’t like to just fund Trump. It would be fair to do half and half,” Jenner responded, “Not all taxes going for Trump.
The first distribution would be made when we hit 50m MC. And never said it would be ALL of them. Some have been used for buybacks, marketing, etc.” The court treated these statements as too vague to constitute meaningful managerial commitments.
Critically, the tax paid Jenner on every transaction whether investors profited or not. Under the Ninth Circuit’s ruling in Brodt v. Bache & Co., a promoter must share in investor losses for vertical commonality to exist.
The court noted that Jenner “kept hundreds of thousands of dollars in tax revenues for herself even as the investments of Greenfield and others became nearly worthless.” Because Jenner faced no downside risk tied to investor outcomes, the vertical commonality standard was not met.
With no viable federal claim remaining, the court declined jurisdiction over Greenfield’s state law claims for fraud and quasi contract. Those claims were dismissed without prejudice, allowing him to refile in California state court.
The court also denied any further attempt to amend the Securities Act claim, finding such an amendment would be futile. Jenner’s legal victory draws a clear legal boundary between celebrity-promoted memecoins and regulated securities.
Crypto World
Nomura survey shows rising institutional crypto adoption driven by regulation and diversification


Institutional investors are warming to digital assets, with improving sentiment and broader use cases emerging as key drivers of adoption, according to a new survey from Tokyo-based bank Nomura and its crypto unit Laser Digital.
The study, based on responses from more than 500 investment professionals in Japan, found that 31% of respondents now hold a positive outlook on crypto over the next year, up from 25% in 2024. Meanwhile, negative sentiment has declined, pointing to a gradual shift in perception as the asset class matures.
A central theme is diversification. Some 65% of respondents said they view crypto as a portfolio diversifier, while 79% of those considering exposure plan to invest within three years. Most expect relatively modest allocations — typically between 2% and 5% — suggesting institutions are still in the early stages of adoption.
That shift is being supported by a changing regulatory and policy backdrop. In Japan, policymakers have spent the past year refining crypto frameworks, including discussions around classification, taxation and investor protections. Globally, clearer rules in major markets — alongside the approval and expansion of crypto investment products such as exchange-traded funds (ETFs) and tokenized assets — have reduced some of the uncertainty that previously kept institutions on the sidelines.
As a result, interest is expanding beyond simple price exposure. More than 60% of respondents expressed interest in staking, lending, derivatives and tokenized assets, reflecting growing demand for yield-generating strategies and more sophisticated portfolio construction.
Stablecoins are also gaining traction, with 63% of respondents identifying potential use cases ranging from treasury management to cross-border payments and investment in tokenized securities.
Still, barriers remain. Concerns around volatility, counterparty risk and the lack of established valuation frameworks continue to weigh on adoption. Regulatory uncertainty, while improving, has not fully disappeared.
Even so, the survey suggests the conversation is shifting. Rather than debating whether to invest in crypto, institutions are increasingly focused on how to do so — a sign that digital assets are moving closer to becoming a standard component of institutional portfolios.


Peter Schiff, a well-known Bitcoin critic and gold advocate, has raised concerns about MicroStrategy’s ongoing Bitcoin acquisition strategy.
Summary
- Peter Schiff says MicroStrategy Bitcoin funding model may increase shareholder dilution through repeated share issuance.
- Company shifts toward 11.5% yield preferred shares as earlier funding methods become less effective.
- Debate continues as analysts disagree whether MicroStrategy faces risk or retains financial flexibility.
The company has continued to expand its holdings through a mix of debt and equity issuance.
Schiff stated that MicroStrategy’s approach is becoming harder to sustain under current market conditions. He said “the company is shifting toward more expensive capital” while referencing recent financing changes linked to preferred shares.
He added that earlier funding methods, which included issuing shares at higher valuations, are becoming less effective in the present environment.
MicroStrategy has recently relied more on preferred share offerings with higher yield obligations. Schiff noted that the company is now issuing instruments with yields around 11.5 percent.
He said ”these obligations cannot be covered by software earnings alone” when describing the firm’s financial position. The company’s core software business has limited profit contribution compared to its Bitcoin exposure.
Schiff stated that funding future purchases may require additional issuance of preferred shares, discounted equity, or Bitcoin sales. He argued this could increase pressure on shareholders through dilution over time.
Claims of structural risk and market reaction
Schiff described the company’s financing approach as vulnerable if market conditions weaken. He said the structure depends heavily on continued access to capital markets.
Canadian billionaire Frank Giustra also commented on the strategy, calling it ”a giant ponzi that will unravel when the next financial crisis hits” according to remarks cited in reports. He suggested that macroeconomic stress could expose weaknesses in the model.
The comments reflect ongoing debate over corporate treasury strategies that rely on digital assets as a primary reserve.
Additionally, market research group BitMEX Research provided a different view on MicroStrategy’s approach. The firm stated that MicroStrategy is not under forced liquidation pressure and still has financial flexibility.
BitMEX Research said ”nobody is forcing MSTR to do this” and described the strategy as potentially beneficial under current conditions. It noted that the company can adjust financing terms, including coupon rates, instead of selling assets.
The discussion continues as MicroStrategy maintains one of the largest corporate Bitcoin holdings while using structured financial instruments to support its accumulation strategy.
Bitcoin foreshadows fresh market mayhem as it appears that the US-Iran war has returned, including the closure of the Strait of Hormuz oil route.
Bitcoin (BTC) sought to protect $75,000 into Sunday’s weekly close as crypto surfed fresh uncertainty over the US-Iran war.
Key points:
-
Bitcoin price action sinks from ten-week highs amid fears that the US-Iran war has returned in full force.
-
Iran closes the Strait of Hormuz, bringing back the risk of an oil-price surge.
-
BTC price action faces ongoing resistance at a 21-week trend line into the weekly close.
Bitcoin abandons highs as US-Iran war fears return
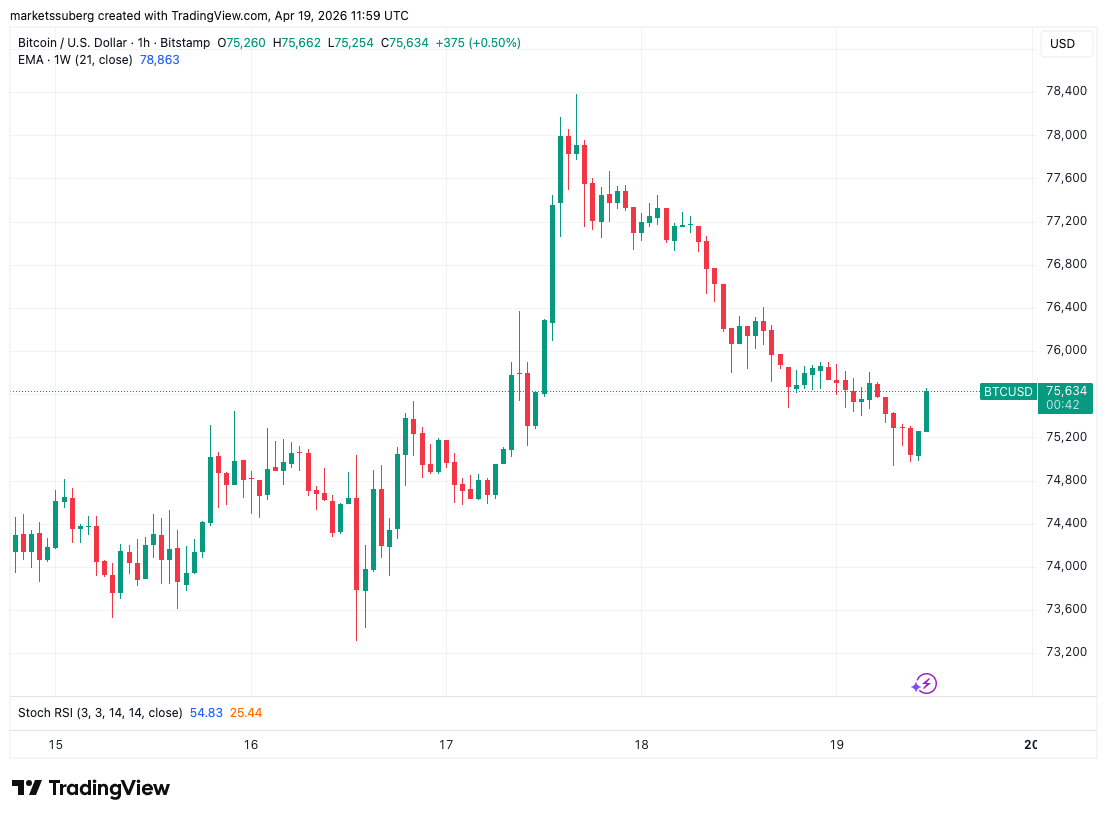
Data from TradingView showed BTC price pressure reentering after a trip to ten-week highs of $78,400 on Friday.

Mixed signals from US and Iranian sources characterized the weekend, with an assumed ceasefire and mutual agreements between the two sides now seemingly undone.
Among the latest developments was the repeat closure of the Strait of Hormuz, putting the focus on oil futures on the day. News of a ceasefire had sent WTI crude below $80 per barrel for the first time since March 10.
“We expect an eventful Sunday ahead,” trading resource The Kobeissi Letter summarized in ongoing analysis on X.

As BTC/USD circled local highs, and sentiment with it, market participants stayed cautious. Trading resource Material Indicators noted that the entire market mood could flip on relatively little input, such as a social media post.
“Sentiment is overwhelmingly bullish at the moment, but that could change with one Tweet in the coming days. Know your invalidations,” it told X followers.
Data from CoinGlass showed long positions coming under fire during the BTC price retracement, with total crypto liquidations at $260 million over the past 24 hours.

BTC price capped by resistance trend line
Continuing, trader Daan Crypto Trades eyed a potential gap in CME Group’s Bitcoin futures market opening as a result of the weekend comedown.
Related: Bitcoin can grow ‘probably a lot bigger’ than $30T+ gold market — Analysis
As Cointelegraph reported, such gaps often act as short-term price magnets when the new week begins.
“It’s going to be interesting to see the futures open today and how $OIL will react to the recent headlines regarding the strait,” he added.

Looking at the weekly close, trader and analyst Rekt Capital placed importance on Bitcoin’s 21-week exponential moving average (EMA) near $78,900.
“Bitcoin is rejecting from the 21-week EMA (green),” he observed alongside the weekly chart.
“It is this rejection that could force a post-breakout retest of the top of the Double Bottom (~$73k) next week, provided Bitcoin Weekly Closes just like this.”

This article is produced in accordance with Cointelegraph’s Editorial Policy and is intended for informational purposes only. It does not constitute investment advice or recommendations. All investments and trades carry risk; readers are encouraged to conduct independent research before making any decisions. Cointelegraph makes no guarantees regarding the accuracy or completeness of the information presented, including forward-looking statements, and will not be liable for any loss or damage arising from reliance on this content.


World has rolled out upgrades to its World ID protocol, positioning it as a wider digital identity layer for online verification.
Summary
- World ID now serves 18 million users across 160 countries with identity verification tools.
- System uses biometric scanning and cryptography to confirm humans without storing personal data.
- New features aim to block bots, deepfakes, and AI agents in digital platforms.
The system is designed to confirm whether an online user is a real person while keeping personal data private.
The network is currently used by close to 18 million people across around 160 countries. It aims to address growing issues linked to bots, automated accounts, and AI-generated identities in online environments.
World ID uses cryptographic methods to confirm uniqueness without sharing personal data. The system relies on an Orb device that scans biometric features and generates a secure anonymized identifier for each user.
The upgraded system introduces one-time-use nullifiers to prevent tracking across different services. These tools allow users to prove identity without exposing personal information or linking activity between platforms.
World ID also includes multi-key support, session control, and account recovery features. These functions are designed to improve system stability and support enterprise-level use while maintaining user control over identity data.
The company stated ”only cryptographic proofs are utilized, no personal information is stored” when describing how the system handles user data, according to project documentation.
Furthemore, World ID is being integrated into various digital services that require user verification. The system is used in areas such as ticketing platforms, gaming services, and online dating applications.
Examples include identity checks on platforms like Tinder and ticket systems designed to reduce automated resale. Tools such as Concert Kit aim to limit scalping by ensuring ticket buyers are verified individuals.
In enterprise use cases, the system has been linked to digital agreement tools and video verification services. Platforms such as DocuSign and Zoom are cited as potential integration points for human verification features.
Expansion toward AI and automated systems
The protocol also extends to AI agent environments. Developers can require human approval before automated systems complete sensitive actions or transactions.
World ID allows AI agents to be linked to verified human users. This setup is designed to support controlled automation in areas such as digital commerce and workflow systems.
The project stated ”the system enables accountability in automated environments” when describing its approach to AI integration. The focus remains on distinguishing human users from automated agents while maintaining privacy protection across digital platforms.
Bitcoin Holds $75K as ETF Inflows Return and Macro Signals Support Risk Assets
If We Were the Vikings, This Would Be the Pick at No. 18

Dublin’s Audrey AI closes $1.8m pre-seed funding round

Why Israel is blocking foreign journalists from entering

Bitcoin: We’re Entering The Most Dangerous Phase

Alan Cumming Brands Baftas Ceremony A ‘Triggering S**tshow’

Did you know you can do this with a $100 bill? #cash #money #trick #hundred

When Life Gets Hard, Choose Financial Stability | April 16, 2026

Wallet with no money. #viral #funny #comedy #shortvideos #reaction #viralvideo #viralshorts #prank
-
 NewsBeat7 days ago
Pep Guardiola and Gary Neville agree over Arsenal title problem that benefits Man City
-

 Crypto World6 days ago
The SEC Conditionalises DeFi Platforms to Be Avoided for Broker Registration
-

 Fashion2 days ago
Weekend Open Thread: Theodora Dress
-

 Politics7 days ago
World Cup exit makes Italy enter crisis mode
-

 Crypto World6 days ago
SEC Signals Exemption for Crypto Interfaces From Broker Registration
-

 News Videos4 days ago
Secure crypto trading starts with an FIU-registered
-

 Sports2 days ago
NWFL Suspends Two Players Over Post-Match Clash in Ado-Ekiti
-

 Crypto World5 days ago
SEC Proposes Certain Crypto Interfaces Don’t Need to Register as Brokers
-

 NewsBeat5 days ago
Trump and Pope Leo: Behind their disagreement over Iran war
-

 Politics2 days ago
Palestine barred from entering Canada for FIFA Congress
-

 Crypto World2 days ago
Russia Pushes Bill to Criminalize Unregistered Crypto Services
-

 Sports6 days ago
NWFL opens Pathway for new Clubs ahead of 2026 Season
-
 Business3 days ago
Creo Medical agree sale of its manufacturing operation
-

 Crypto World6 days ago
Trump whales load up ahead of Mar-a-Lago luncheon.
-
Business6 days ago
Kering slides after Morgan Stanley downgrade, Gucci woes loom
-
 Entertainment5 days ago
Brand New Day’ Footage Reveals the Devastating Impact of ‘Now Way Home’
-

 Politics4 hours ago
Zack Polanski demands ‘council homes not luxury flats for foreign investors’
-
Crypto World7 days ago
Sei Network Enters Quiet Reset Phase as On-Chain Metrics Signal a Slowdown in 2026
-

 Tech6 days ago
Google adds E2E encryption to Gmail for iOS and Android enterprise users
-

 Tech6 days ago
Apple glasses won’t go brand shopping like Meta did with Ray-Ban and Oakley
You must be logged in to post a comment Login