Crypto World
ICT Trading: What Are the Main ICT Concepts?

Inner Circle Trading (ICT) is a price-action methodology developed by Michael J. Huddleston, also known as the Inner Circle Trader. It explains market behaviour through concepts such as liquidity, market structure, order blocks, fair value gaps, and trading session timing. Traders use them to analyse price movements from an institutional perspective. Although ICT trading is most commonly associated with the forex market, the methodology is also applied to indices, commodities, and other financial instruments.
This article explains the core ICT concepts, how they fit together, and how traders use them to develop market bias, identify potential liquidity targets, and analyse price action across different market conditions.
Key Takeaways
- ICT explains market movement through institutional behaviour, focusing on liquidity, structure, and order flow rather than indicators.
- The Inner Circle Trading method is used across forex, indices, and commodities on intraday and higher timeframes to interpret how major players influence price.
- Core ICT concepts include Break of Structure (BOS), Change of Character (CHoCH), Market Structure Shift (MSS), liquidity pools, order blocks, fair value gaps, optimal trade entries, and kill zones.
- ICT shows how price targets liquidity, reacts to imbalances, and shifts momentum, giving traders a clearer narrative of market intent.
- The framework combines structure, timing, and context, making it a detailed but discretionary approach to analysing market movement.
- The ICT methodology is not a mechanical strategy. It relies on discretionary analysis rather than fixed rules.
What Is ICT in Trading?
ICT, or Inner Circle Trading, is a price-based methodology developed by Michael J. Huddleston that offers a way to read institutional behaviour in the markets. It focuses on identifying where banks and large funds, the so-called “smart money,” enter, exit, and target liquidity. Traders use ICT across forex, indices, and commodities, mainly on intraday charts like the one-minute to one-hour, as well as higher timeframes when building directional bias.
The approach breaks price into structure, liquidity, and imbalance. It teaches traders to spot where the market takes stops, when momentum shifts, and where price often returns before moving again. Rather than relying on indicators, ICT centres on raw price action and the recurring patterns created by institutional order flow. This makes it a structured way to analyse short- and medium-term movements.
ICT is one interpretation of smart money concepts (SMC) rather than the whole field. Other institutional order-flow approaches exist and use different terms for similar ideas. What separates ICT is its specific vocabulary and its focus on when liquidity enters the market, not only where.
Who Developed ICT?
Inner Circle Trading was created by Michael J. Huddleston, widely known as “The Inner Circle Trader.” He is an online educator who built a large following by teaching institutional-style price action.
The abbreviation ICT refers to two things. It names Huddleston himself, and it names the body of concepts he teaches. When traders say they follow ICT, they usually mean the methodology rather than the person.
His public lessons shaped much of the terminology traders now associate with the Inner Circle Trader methodology, including order blocks, liquidity grabs, and kill zones.
How Do ICT and Smart Money Concepts Differ?
Smart money concepts is the broader term. It covers any approach that reads price through institutional order flow, including work by educators with no connection to Huddleston. ICT sits inside that category as one version of it, with its own vocabulary and its own sequence of analysis.
The two share most of their core ideas. Both read market structure, both treat liquidity as a target rather than a by-product, and both look for imbalances left behind by fast moves. The differences sit in the detail. The ICT methodology adds session timing through kill zones, defined entry models such as optimal trade entry, and terms like inducement and displacement that general SMC material often leaves out.
Traders frequently treat the two labels as identical. They are not. ICT is one branch of SMC, so ICT ideas are smart money ideas, while the reverse does not hold.
ICT vs Smart Money Concepts at a glance:
|
ICT |
Smart Money Concepts |
|
|
Scope |
One defined methodology |
Broad family of institutional order-flow approaches |
|
Origin |
Michael J. Huddleston |
No single author |
|
Terminology |
Fixed and detailed, including kill zones, OTE, inducement, displacement |
Varies between educators |
|
Session timing |
Central to the framework |
Optional |
|
Structure reading |
BOS, CHoCH and MSS defined precisely |
Similar ideas, looser definitions |
How Do ICT Concepts Differ From Traditional Technical Analysis?
Inner Circle Trading differs from traditional technical analysis because it focuses on reading institutional order flow rather than reacting to indicators. The approach strips charts back to structure, liquidity, and imbalance, giving traders a more price-driven way to analyse markets.
Traditional technical analysis tends to start with a tool, such as a moving average or an oscillator, and read price through it. Institutional trading concepts start with price itself and ask which levels large participants are likely to be working towards.
The main differences include:
- Focus on liquidity: ICT centres on where stop orders sit and how the market seeks them, while technical analysis relies on indicators or pattern recognition.
- Institutional logic: ICT frames moves as deliberate actions by large players. Traditional analysis often treats price swings as neutral or random.
- Market structure detail: ICT breaks trends into Break of Structure (BOS), Change of Character (CHoCH), Market Structure Shift (MSS), offering a tighter read on shifts in momentum than generic swing-high/swing-low analysis.
- Imbalance and displacement: Inner Circle Trading highlights rapid moves and Fair Value Gaps as signals of strength, whereas standard approaches often minimise the relevance of these gaps.
- Time-based context: ICT uses kill zones to track when liquidity enters the market, while technical analysis rarely factors in session timing.
What Are the Main ICT Trading Concepts?
Inner Circle Trading concepts are a group of price-action tools that explain how institutional traders move the market. They cover structure, which includes ideas like Break of Structure (BOS), a Change of Character (CHoCH), liquidity through pools, sweeps, and engineering, and order blocks that show where major players commit orders. It also works with fair value gaps, optimal trade entries built from retracements, and kill zones linked to specific trading sessions. Together, these concepts offer a clear framework for reading intraday and higher-time-frame behaviour.
The sections below group these ICT trading concepts into four blocks: structure, order blocks, liquidity, and imbalance, followed by the timing and entry tools that sit alongside them. To understand them, you can consider following along in FXOpen’s TickTrader platform.
1.Structure
In the context of ICT, market structure is based on the idea that market direction can be identified through patterns of highs and lows. Within market structure, key structural events are split into distinct movements: a Break of Structure (BOS), a Change of Character (CHoCH), and a Market Structure Shift (MSS).
Market Structure
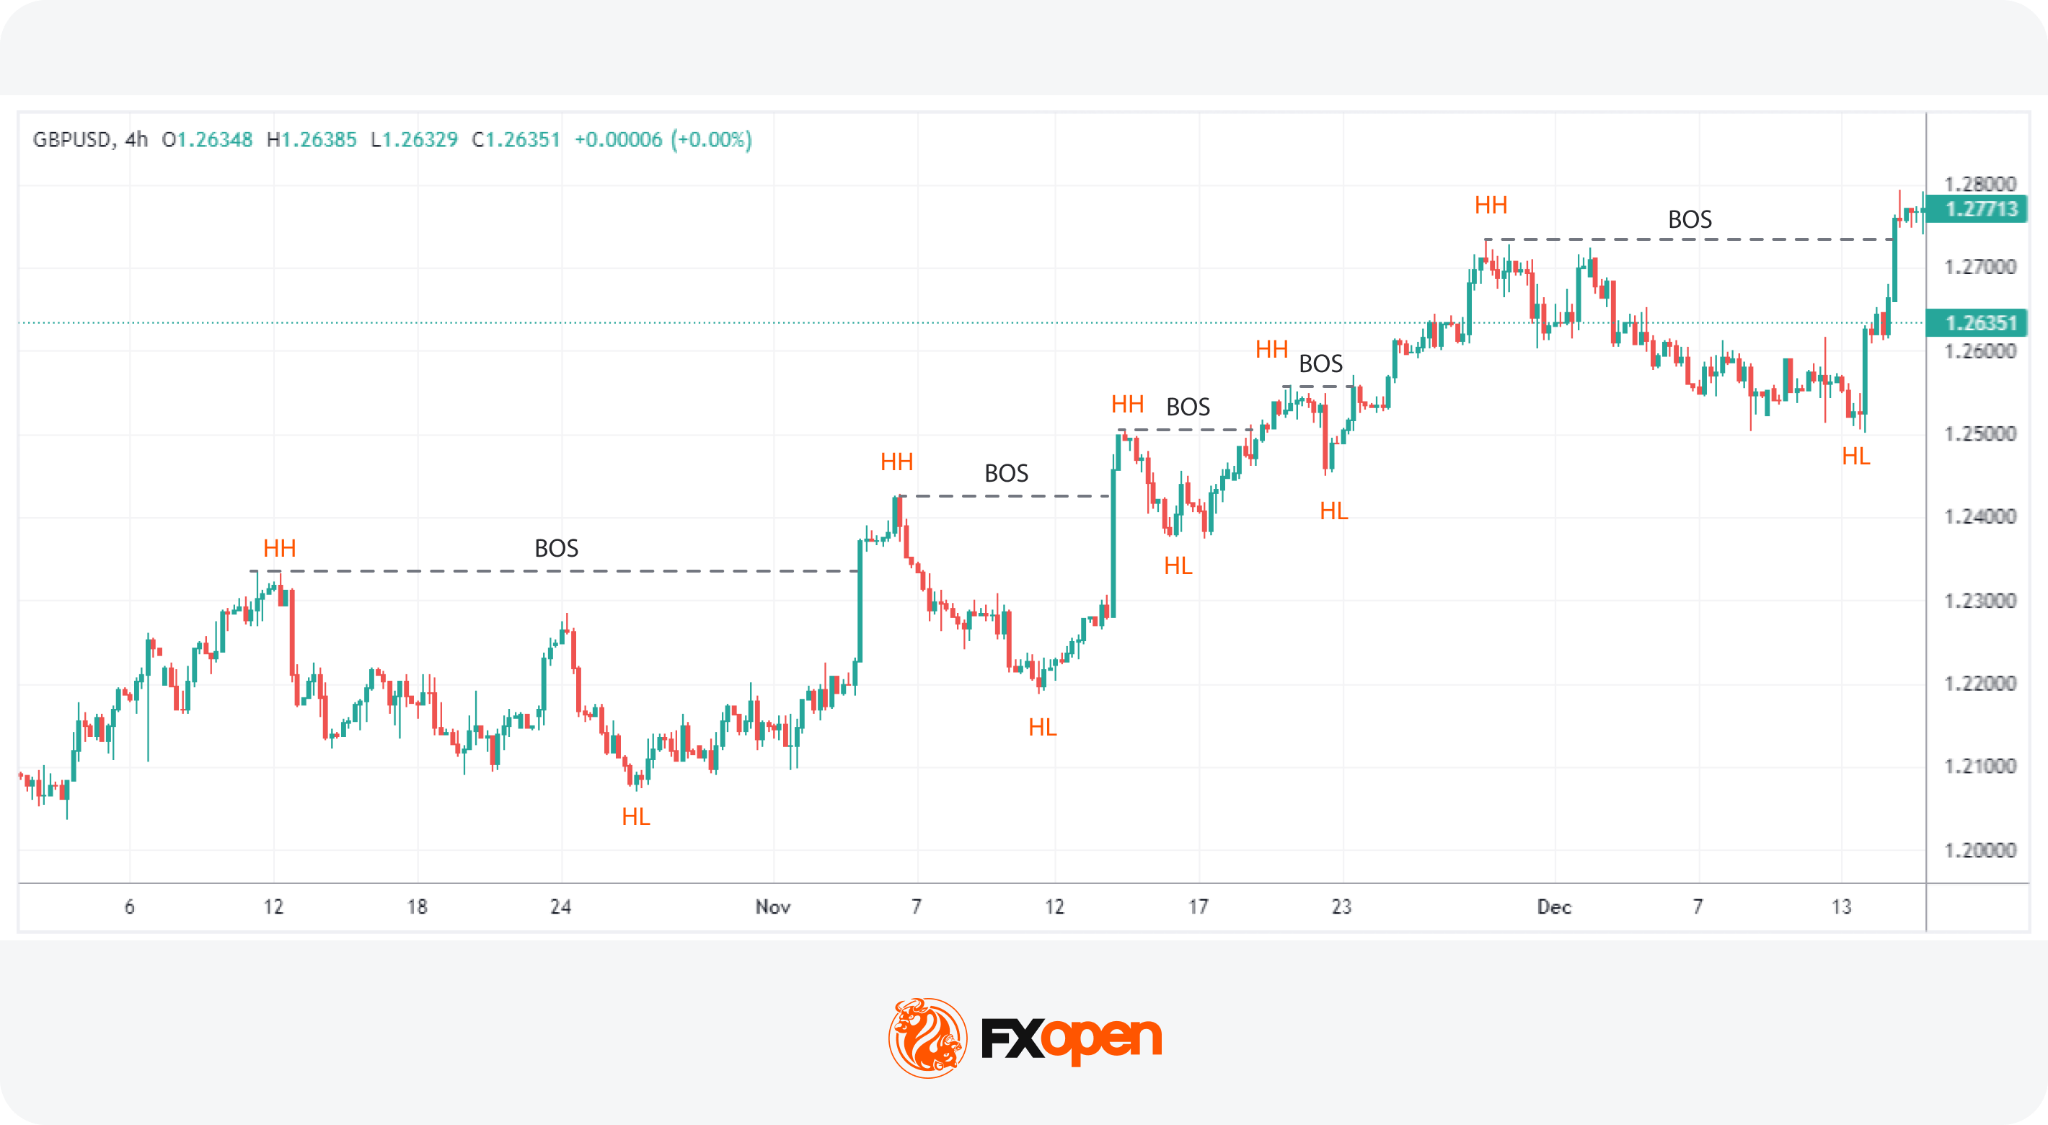

Market structure describes how price moves through a sequence of highs and lows. It shows whether the market trends up, trends down, or ranges, and gives traders a clear view of the current direction. In ICT, structure forms the foundation for reading intent behind price movements and deciding when a trend strengthens, weakens, or begins to reverse.
Specifically, structure is characterised by a series of higher highs and higher lows in an uptrend, or lower highs and lower lows in a downtrend.
For example, EUR/USD rises to 1.0850, pulls back to 1.0800, then pushes on to 1.0920 before dipping to 1.0870. Each high and each low sits above the one before it, so the structure stays bullish. That reading holds until the price closes below 1.0800.
Structure is also fractal, which means a downtrend on a 15-minute chart can be a single pullback inside a daily uptrend. Reading ICT market structure on more than one timeframe keeps that context visible, which is why traders often check the higher timeframe before acting on a lower one.
Break of Structure (BOS)
A Break of Structure (BOS) is a concept that confirms the continuation of the current market direction. It occurs when price moves beyond a key swing point that defines the current trend.
- Bullish BOS appears in an uptrend, when a candle moves above the most recent swing high while the prior swing low remains intact.
- Bearish BOS occurs in a downtrend, when a candle drops below the most recent swing low while the prior swing high holds.
An ICT BOS points to trend continuation, so it tells traders the existing direction is still intact rather than warning of a turn. Traders looking for signs of trend reversal watch for a Change of Character instead, which breaks the swing point on the opposite side of the move.
Change of Character (CHoCH)
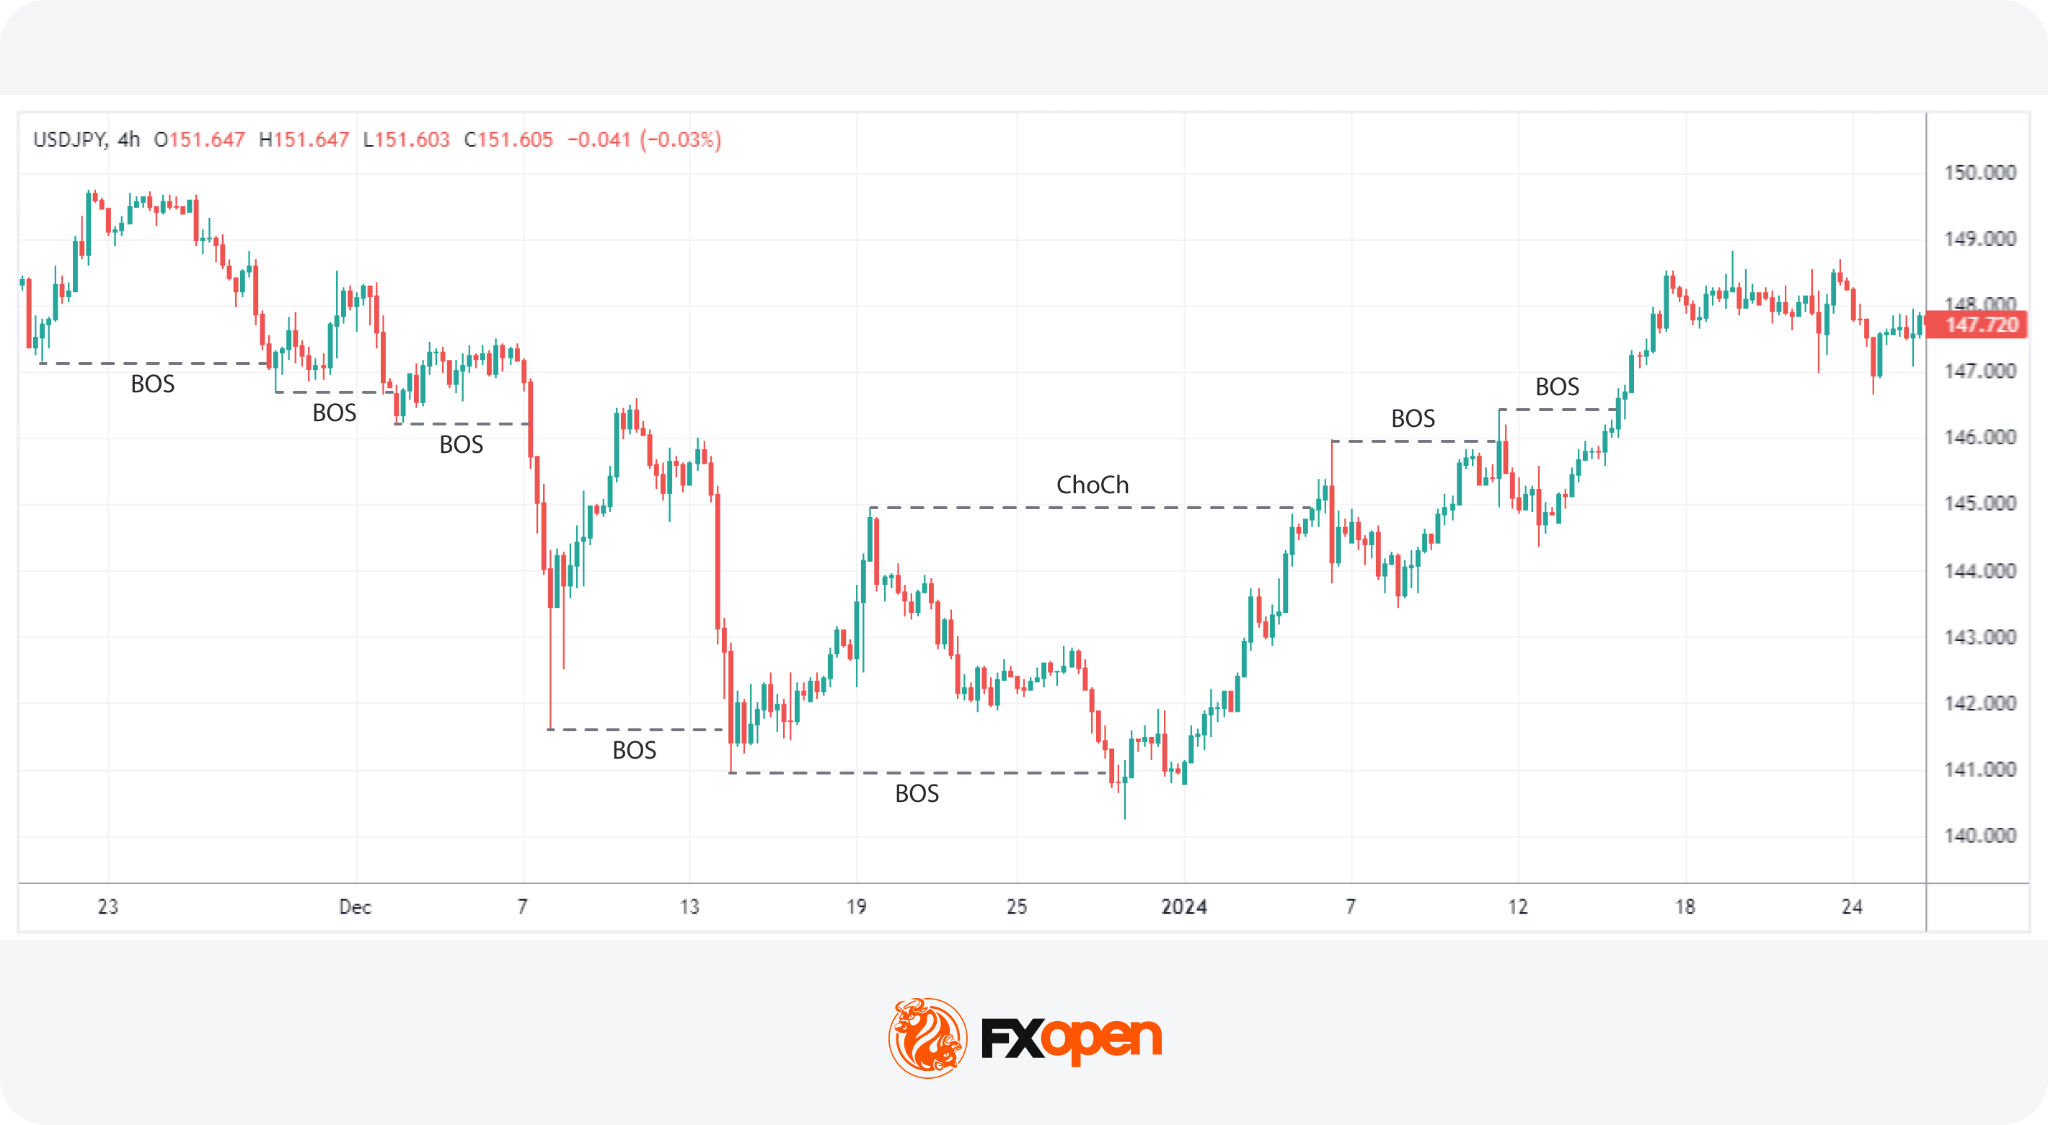
A Change of Character concept reflects a possible trend change. It occurs when price violates the swing point that protects the current trend, signalling the first meaningful shift in control. In an uptrend, a CHoCH forms when price fails to set a new high and then closes below the most recent swing low that previously held the trend. In a downtrend, it forms when price fails to create a fresh low and then closes above the most recent protective swing high.
An ICT CHoCH on its own does not confirm a reversal. It marks the first crack in the existing structure, and price often reclaims the level and continues in the original direction. Traders typically wait for follow-through, such as strong displacement that breaks a key structural level, before treating the shift as established.
Market Structure Shift (MSS)
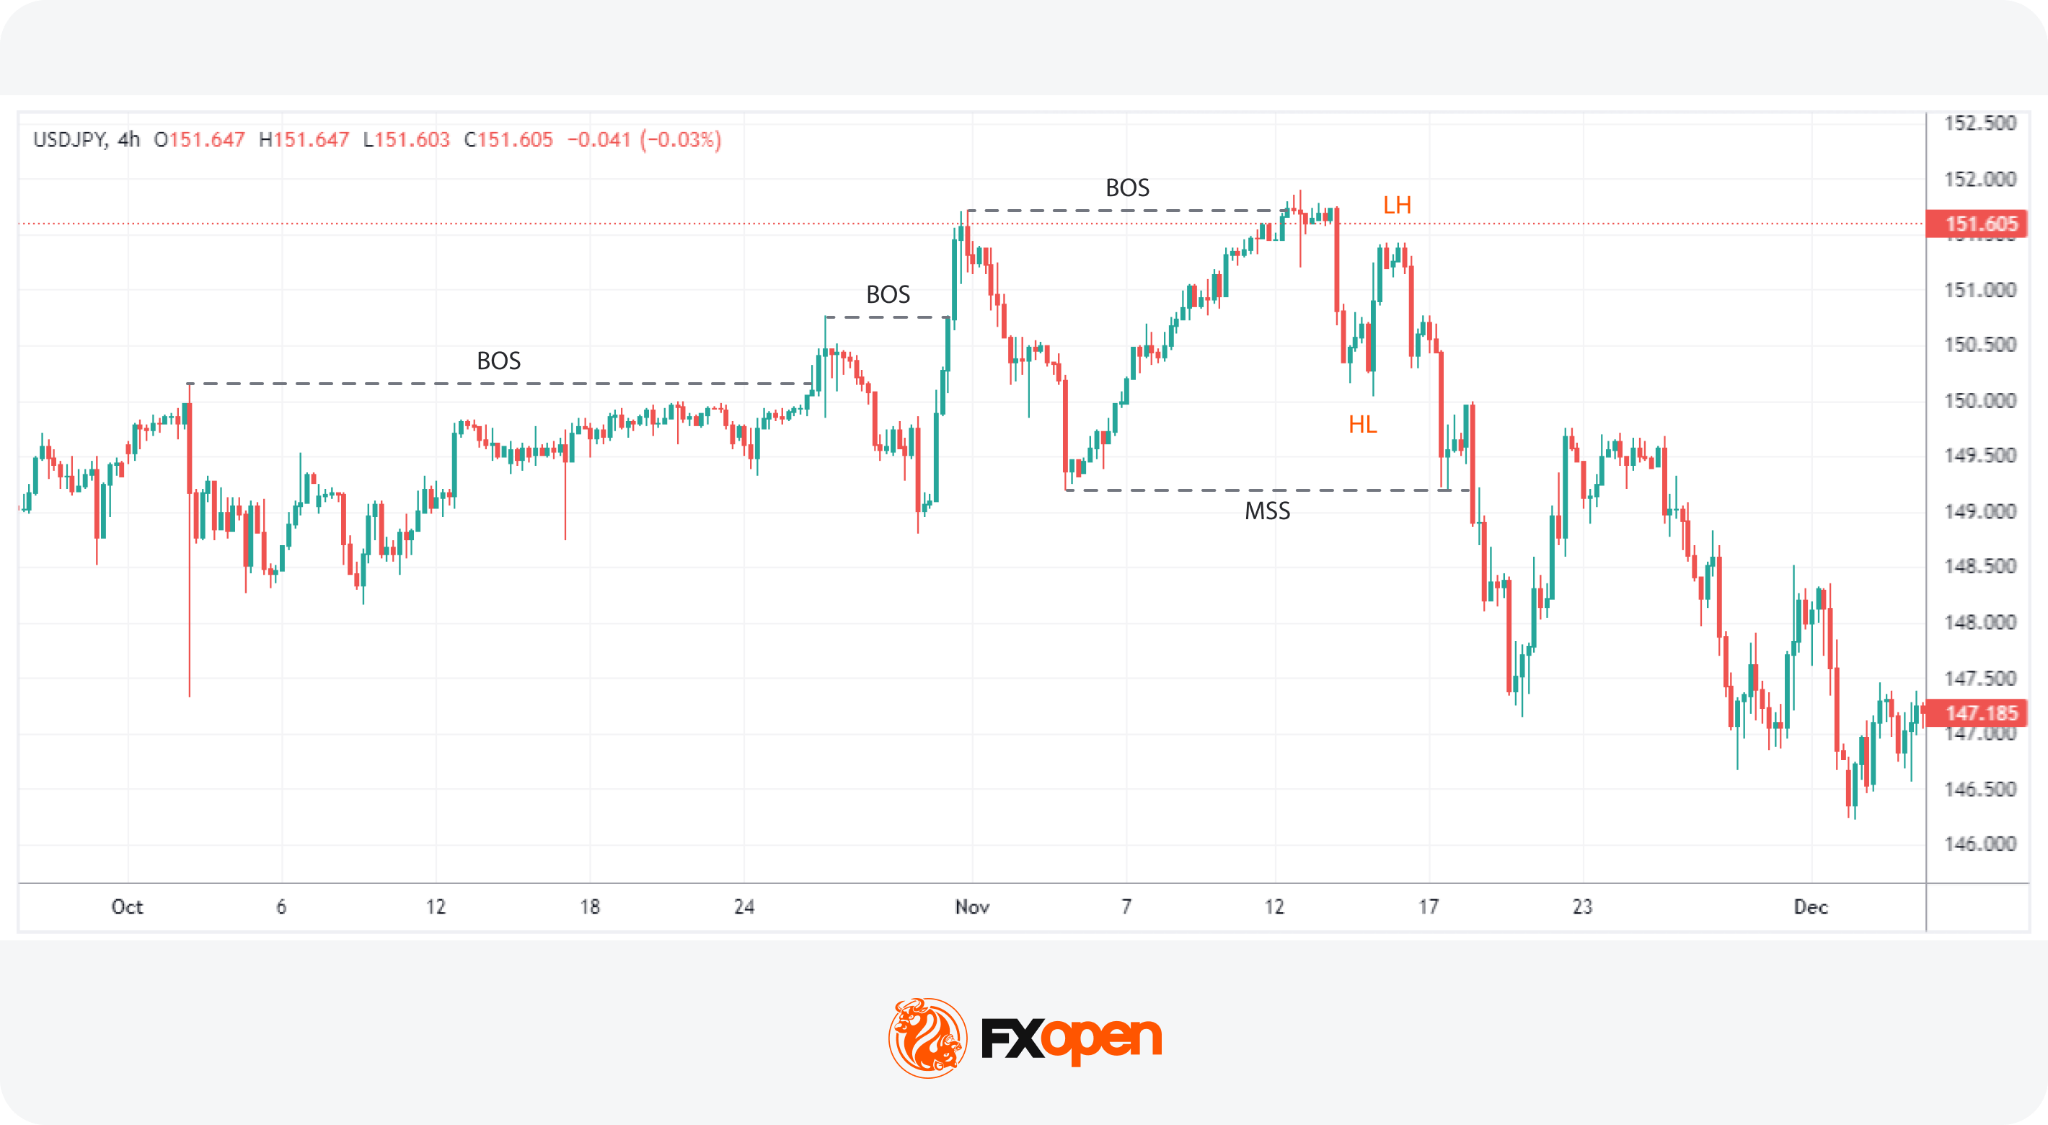
A Market Structure Shift is a significant change in the market that can disrupt the existing trend. This specific type of CHoCH is typically marked by a price moving sharply (a displacement) through a key structural level, such as a higher low in an uptrend or a lower high in a downtrend.
An ICT MSS differs from a CHoCH in how the level breaks rather than which level breaks. A CHoCH can form on a slow drift through the protective swing point, while an MSS requires a decisive move, often leaving an imbalance behind it.
These shifts can signal a profound change in market dynamics, with the sharp move often preceding a new sustained trend. Recognising an MSS allows traders to reevaluate their current bias and adapt to a new trend, given its clear signal.
2. Order Blocks
ICT order block meaning relates to a price area associated with the final buying or selling activity before a strong directional move. In ICT analysis, traders monitor these areas because price may later return to them and react.
There are a few different types of order blocks to be aware of: regular order blocks, breaker blocks, and mitigation blocks.
Regular Order Blocks
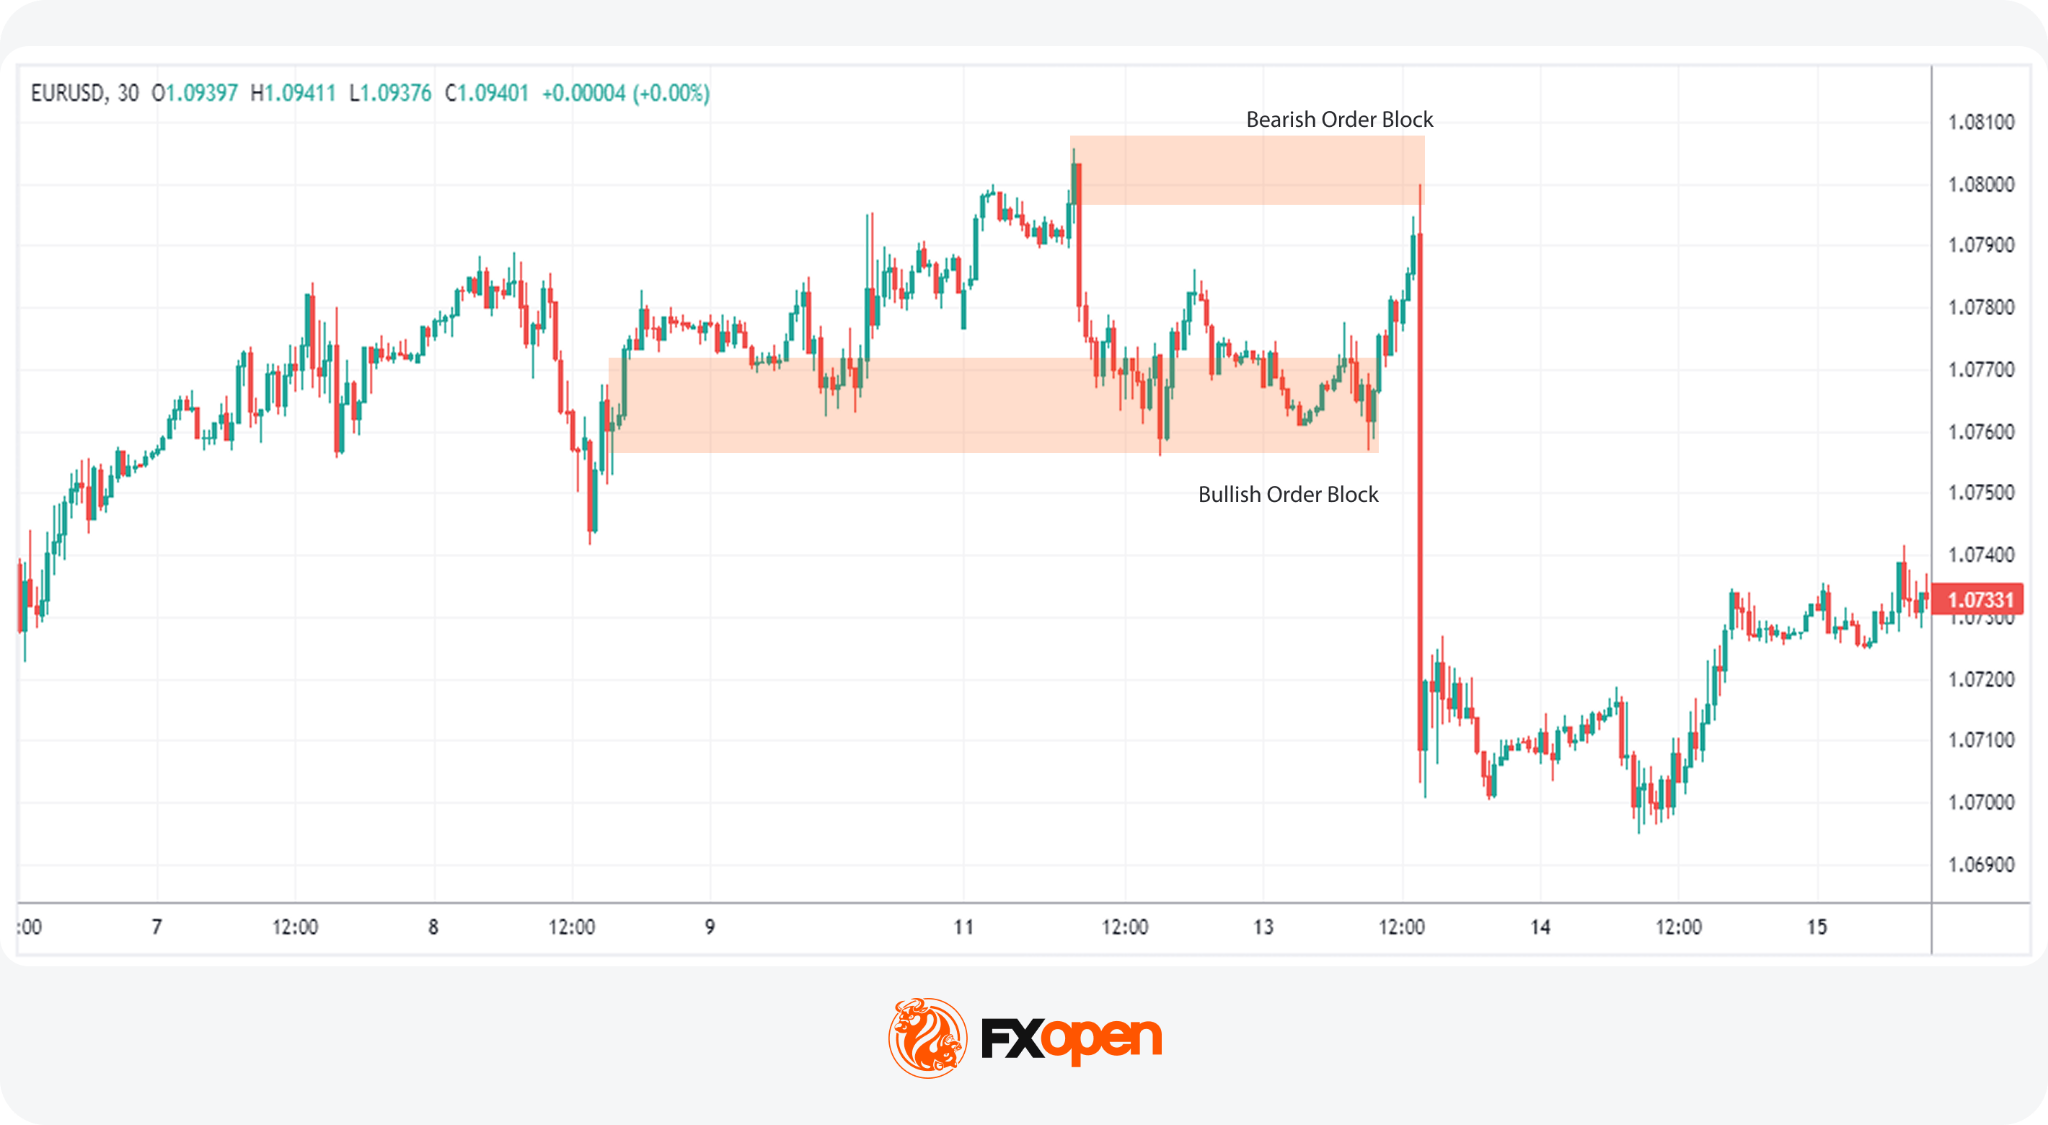
A regular ICT order block is an area on the price chart representing a concentration of buying (demand zone) or selling (supply zone) activity.
A bullish order block typically forms around the last bearish candle or price area before a strong move higher, while a bearish order block forms around the last bullish candle or area before a strong move lower. Depending on the existing market structure, the subsequent move may either continue the prevailing trend or contribute to a structural shift.
In the ICT trading strategy, order blocks are treated as potential reaction areas. In an established uptrend, for example, a bullish order block may form during a retracement before price moves higher and produces a bullish Break of Structure (BOS). If price later retraces into that order block, traders may monitor the area for a bullish reaction and potential continuation of the existing trend.
Conversely, in an established downtrend, a bearish order block may form during a retracement before price moves lower and produces a bearish Break of Structure (BOS). If price later retraces into that order block, traders may monitor the area for a bearish reaction and potential continuation of the existing trend.
Breaker Blocks
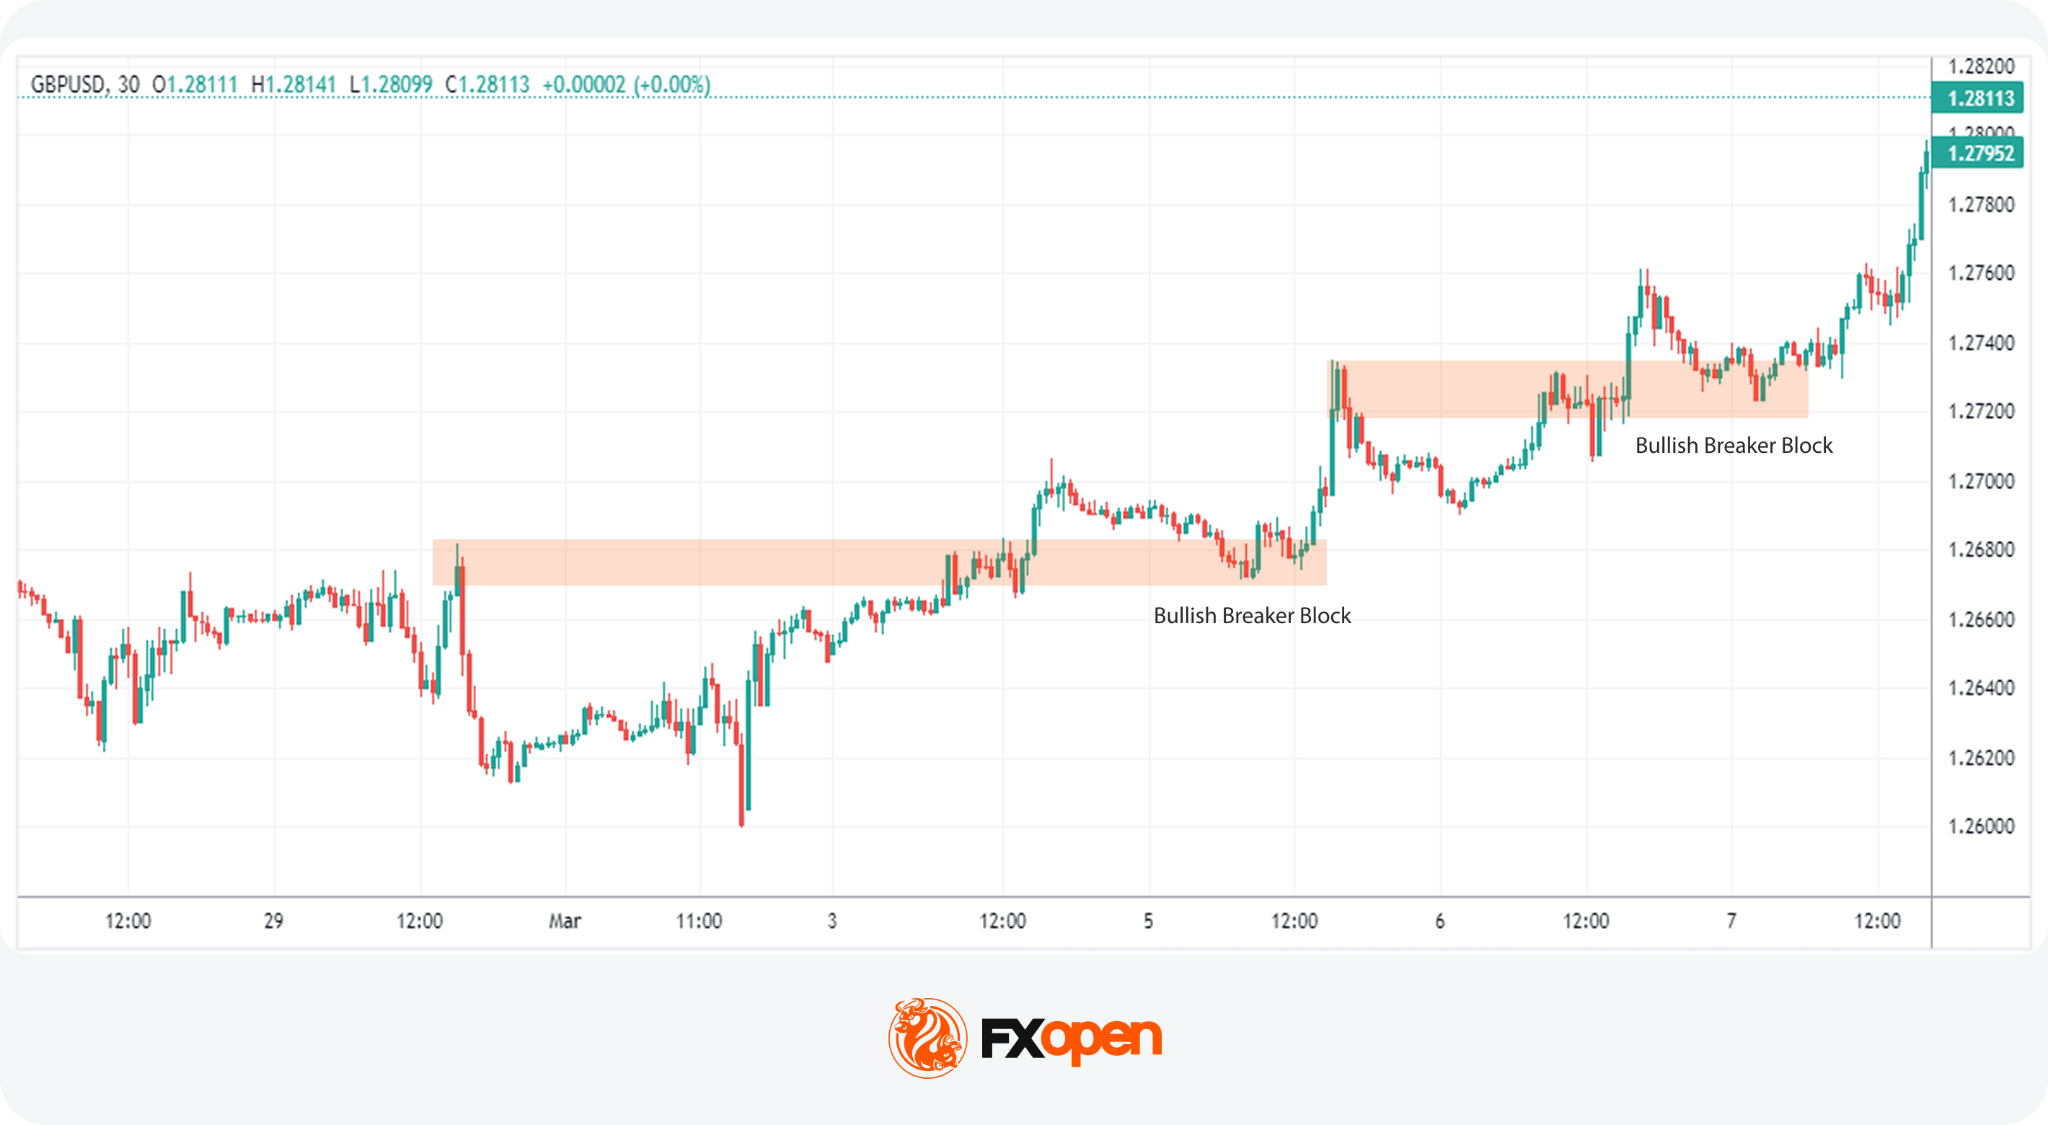
A breaker block forms when price invalidates an order block that should have held if the trend remained intact. This formation indicates that liquidity has been taken (fueling the movement through the order block) and that the trend is likely shifting.
For instance, in an uptrend, if the price creates a new high but then reverses below the previous higher low, the bullish order block above the low becomes a breaker block. Price often returns to that zone afterwards, and traders watch how it reacts there as the new direction develops.
Mitigation Blocks
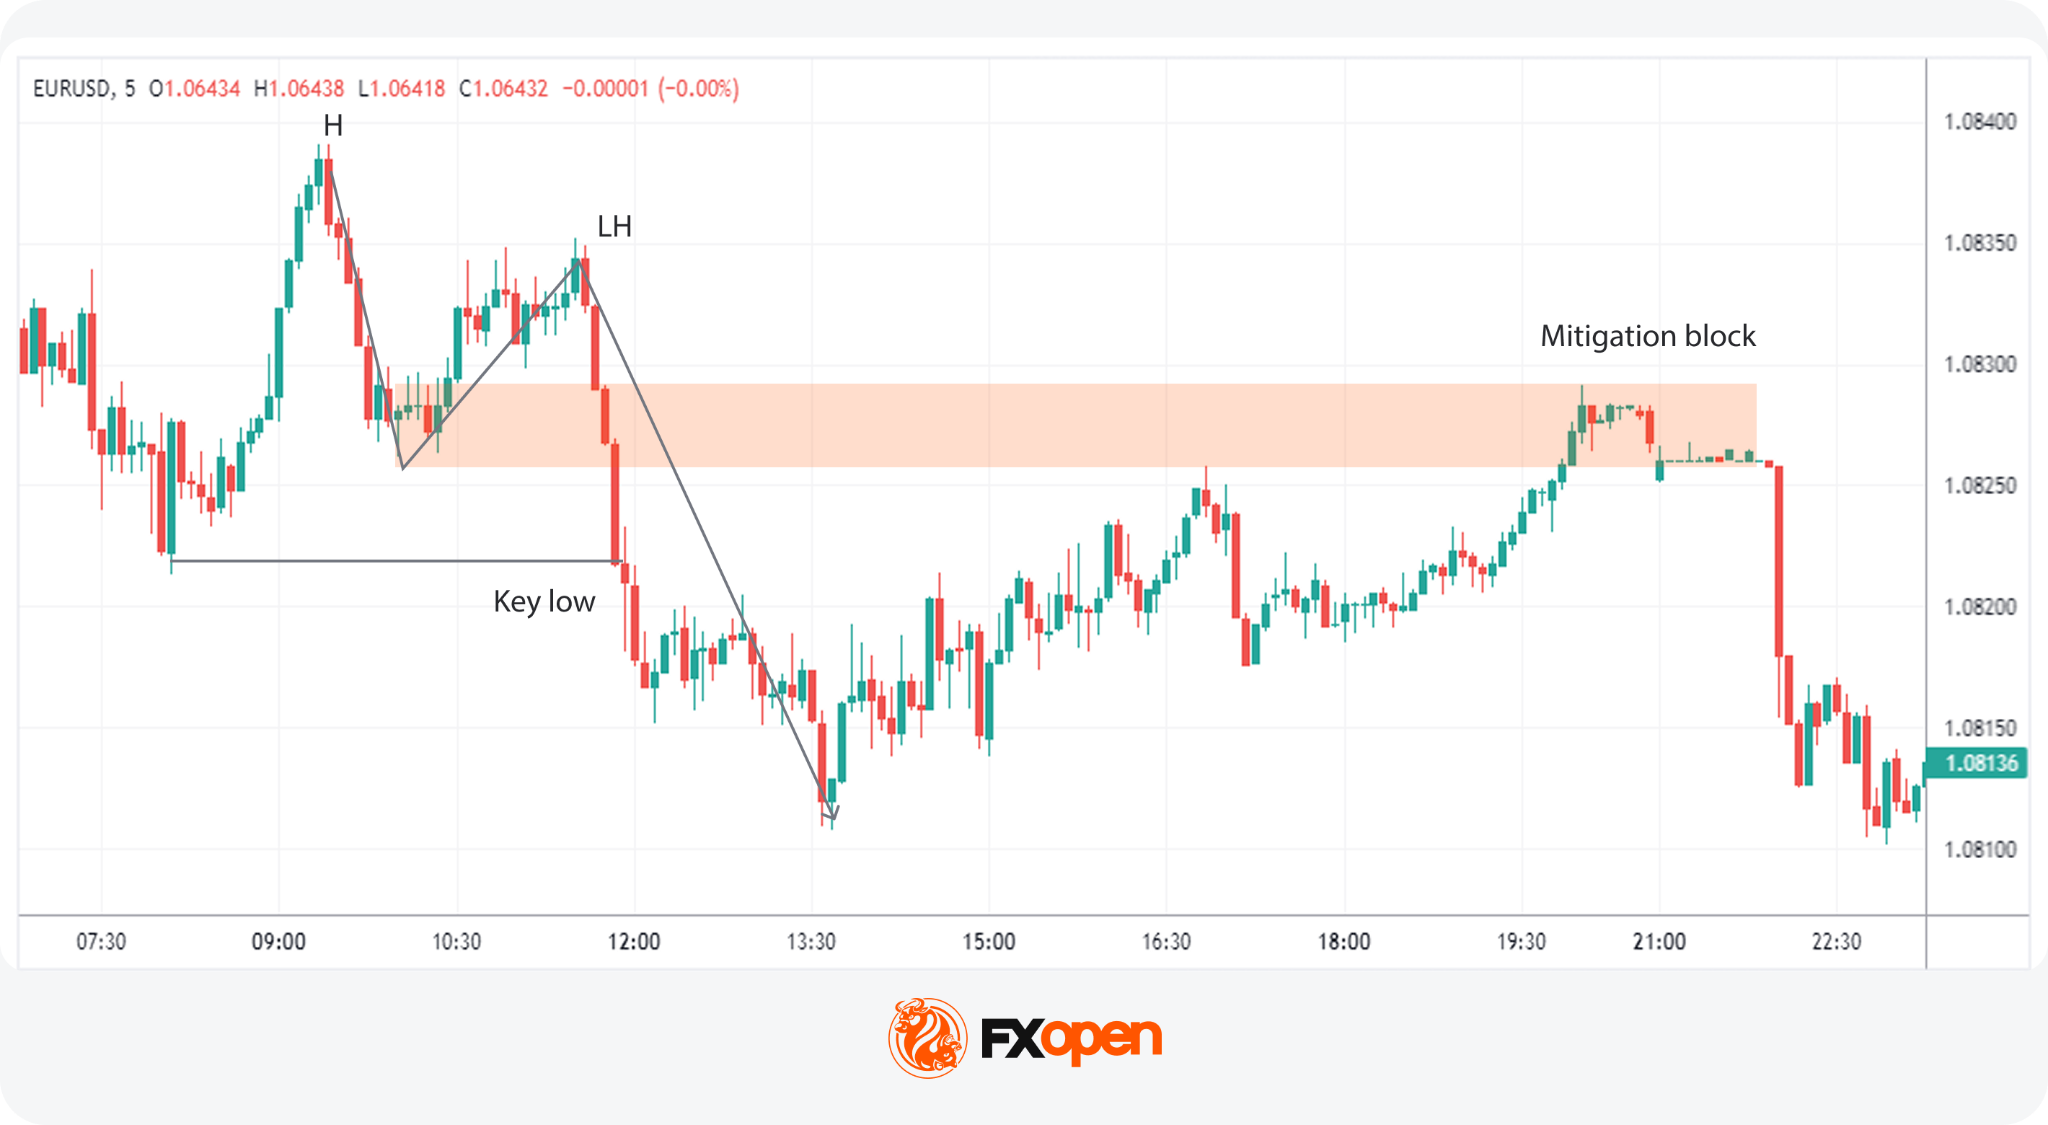
A mitigation block appears when institutional players place orders to offset (“mitigate”) losses from an earlier position that moved against them.
The sequence runs in three parts. A strong displacement moves price away from a level, a counter-move brings price back to where that displacement began, and institutions use the revisit to close out the earlier losing position and re-enter in the direction of the original move.
A bullish mitigation block is the last down candle before a strong upward displacement. A bearish one is the last up candle before a strong downward move, as in the example above. When price returns and reacts from that candle, ICT traders read it as the original order flow resuming.
3.Liquidity
Liquidity refers to areas on the price chart with a high concentration of trading activity, typically marked by stop orders. ICT liquidity concepts include: buy- and sell-side liquidity, liquidity grabs, and inducements.
Buy-Side and Sell-Side Liquidity
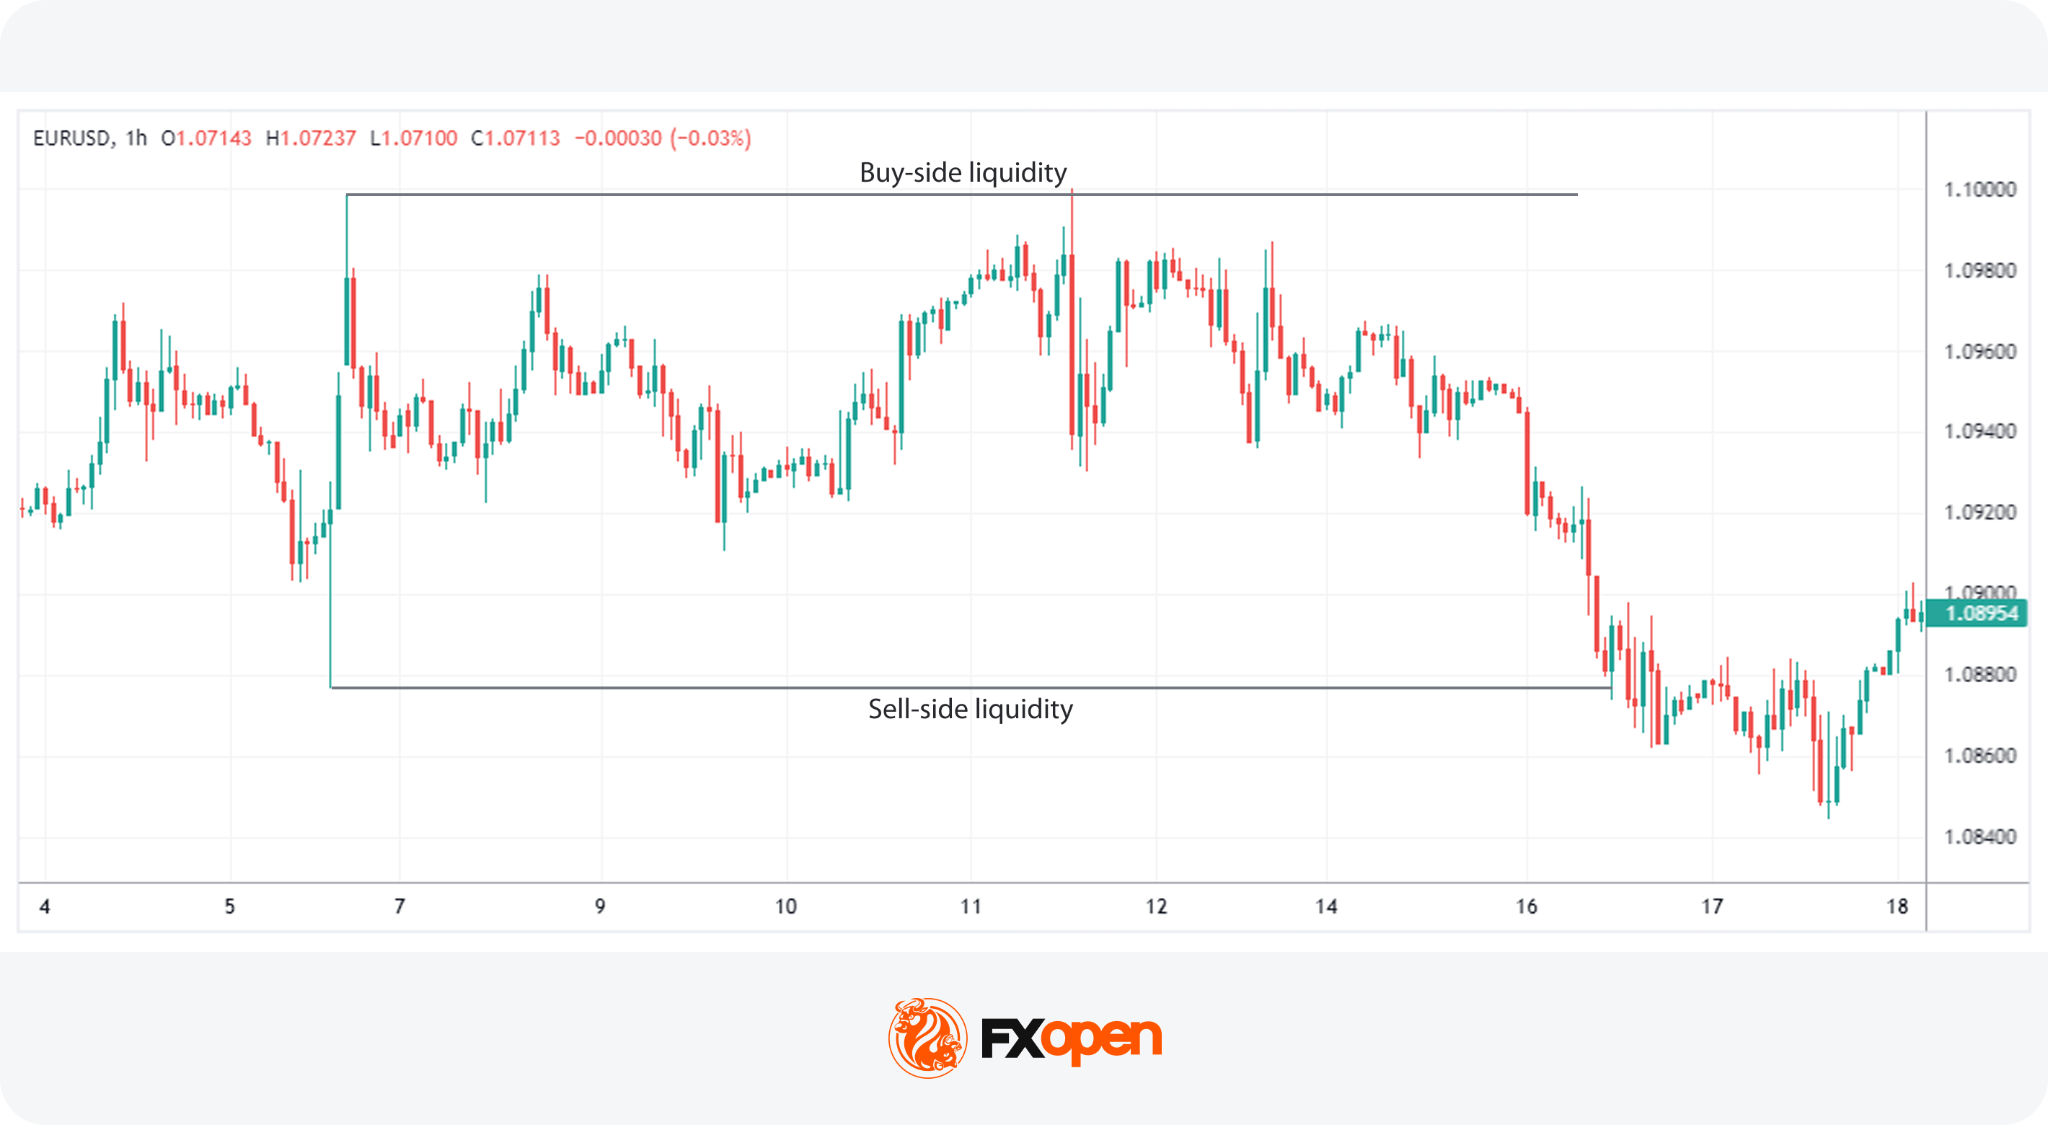
Buy-side liquidity is typically found above recent or equal highs, where stop-loss orders from short positions and breakout buy orders may cluster. When triggered, these orders can add buying pressure. Sell-side liquidity works inversely, with sell orders typically clustering below recent or equal lows.
In ICT analysis, if price moves beyond a high or low to take liquidity but quickly returns within the previous range, the move may be interpreted as a liquidity sweep and a potential reversal signal.
For example, if EUR/USD repeatedly fails to break 1.1500, buy-side liquidity may build above this level. Price may rise above 1.1500, trigger buy orders, and then fall back below it. ICT traders may interpret this rejection as a sweep of buy-side liquidity and watch for signs of a bearish reversal.
Liquidity Grabs
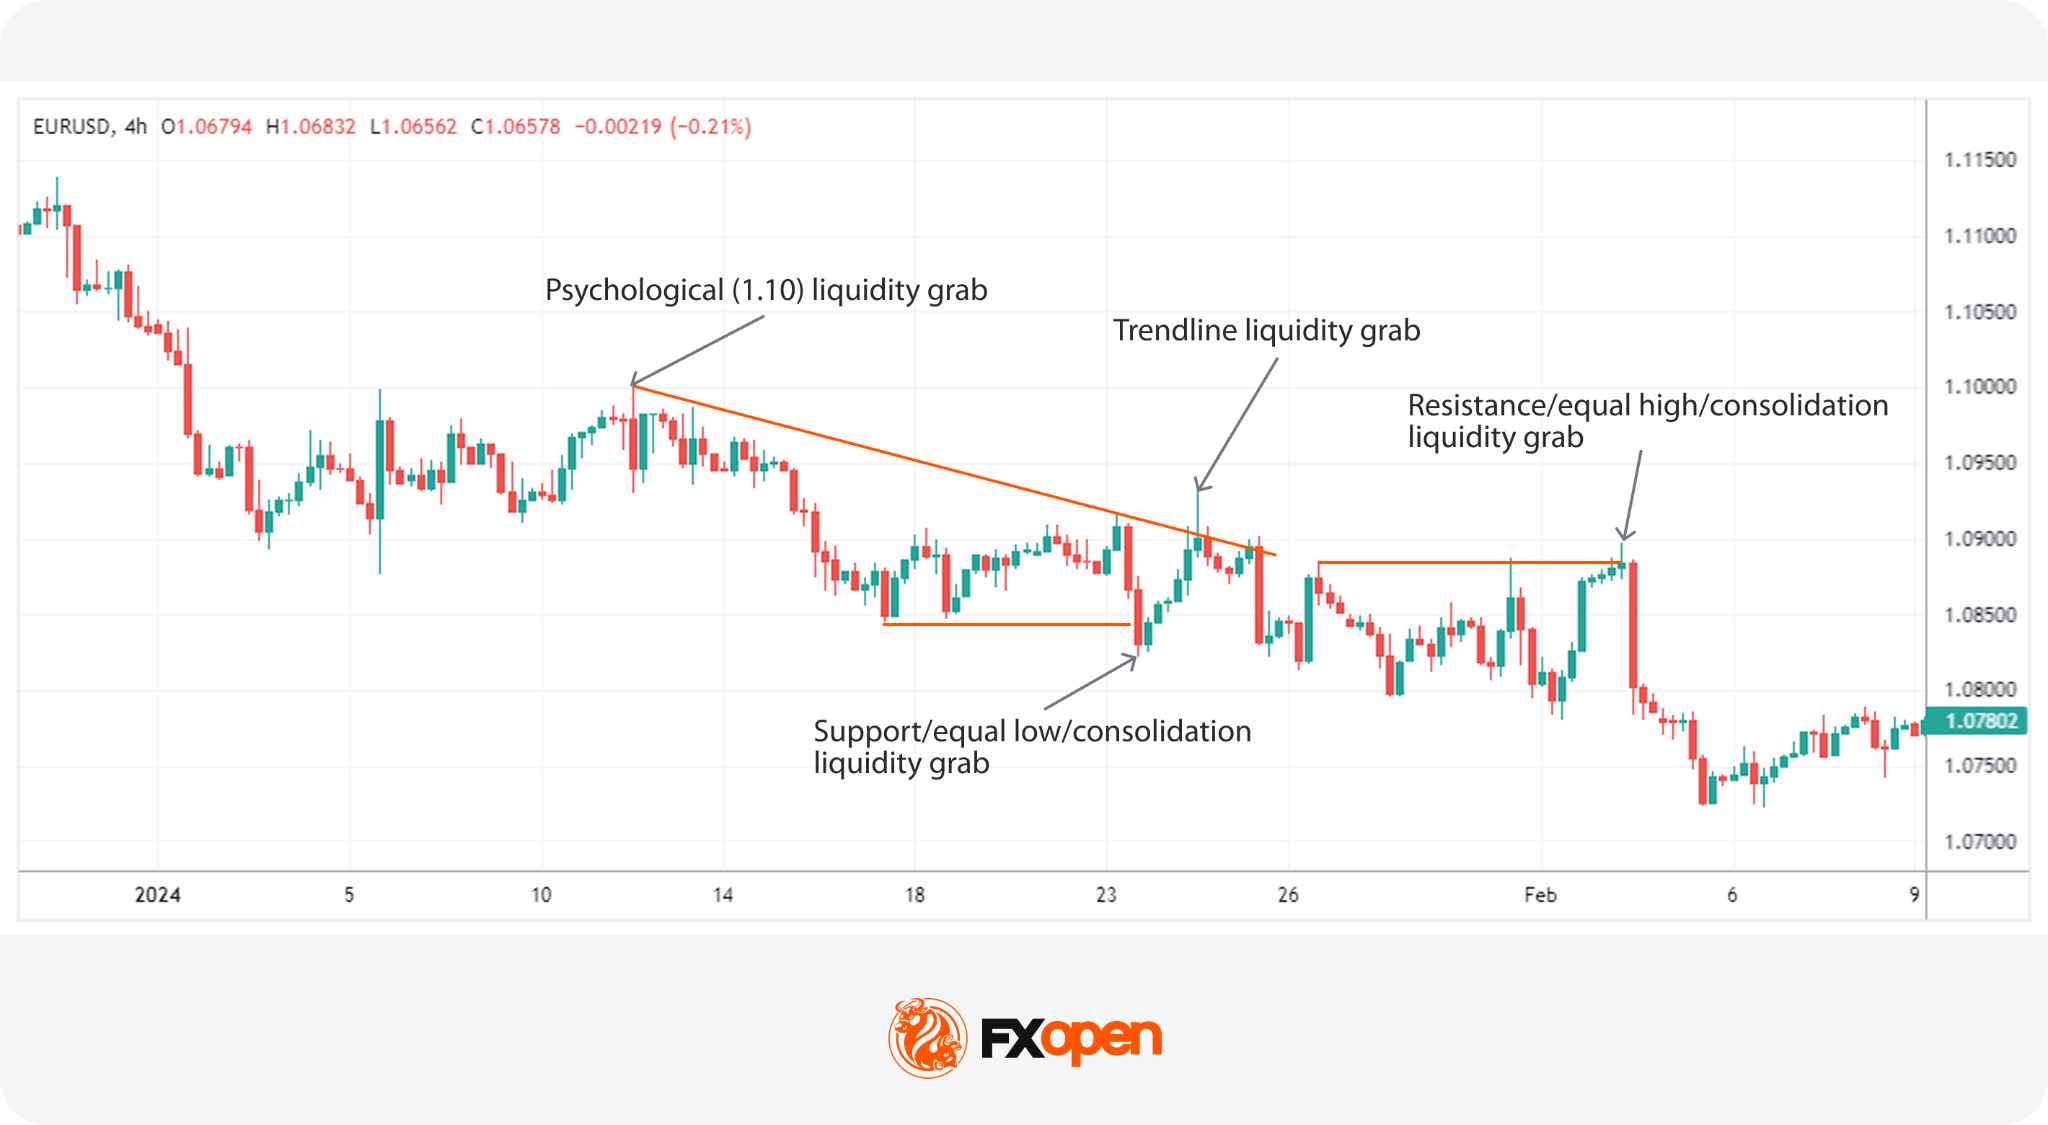
A liquidity grab occurs when the price quickly spikes into high-density order areas, triggering stops and then reversing direction. According to ICT methodology, larger participants take advantage of the resulting order flow to fill sizeable positions with limited slippage. The move temporarily shifts price momentum, usually just long enough to trigger the stops before direction reverses.
What traders observe is the pattern itself, and a liquidity sweep through an obvious high or low that immediately fails is the signature they look for.
Inducement
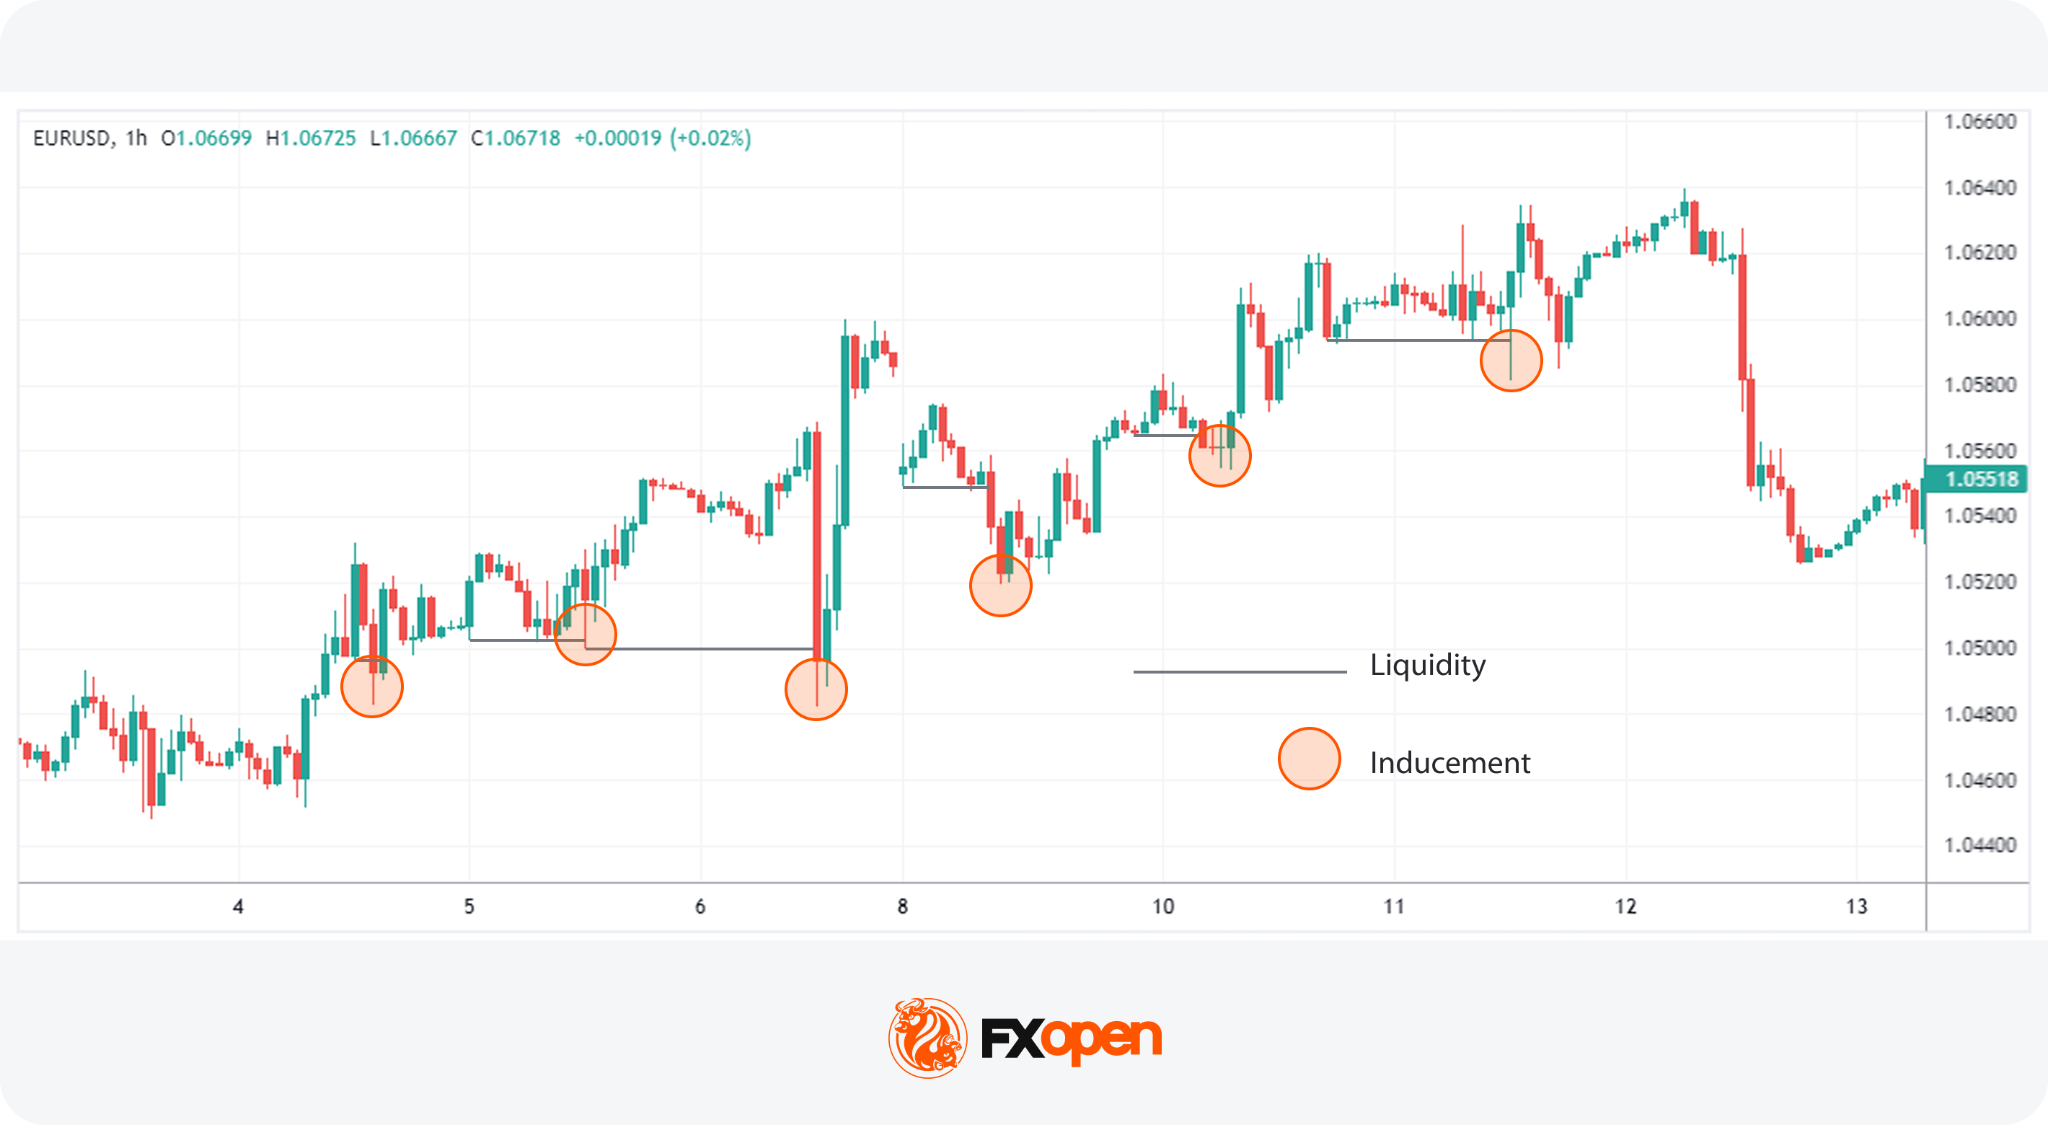
An inducement is a specific type of liquidity grab that triggers stops and makes other traders enter the market. It often appears as a peak or trough, typically into an area of liquidity, in a minor counter-trend within the larger market trend. The pattern creates the appearance of a trend change, which tends to attract entries in that direction. Price then reverses and continues with the original major trend, and the stops from those entries add to the order flow behind the move.
4.Fair Value Gaps and Displacement
In the Inner Circle Trading methodology, two specific types of sharp trending movements signal significant shifts in market dynamics: fair value gaps and displacements.
Fair Value Gaps (FVGs)
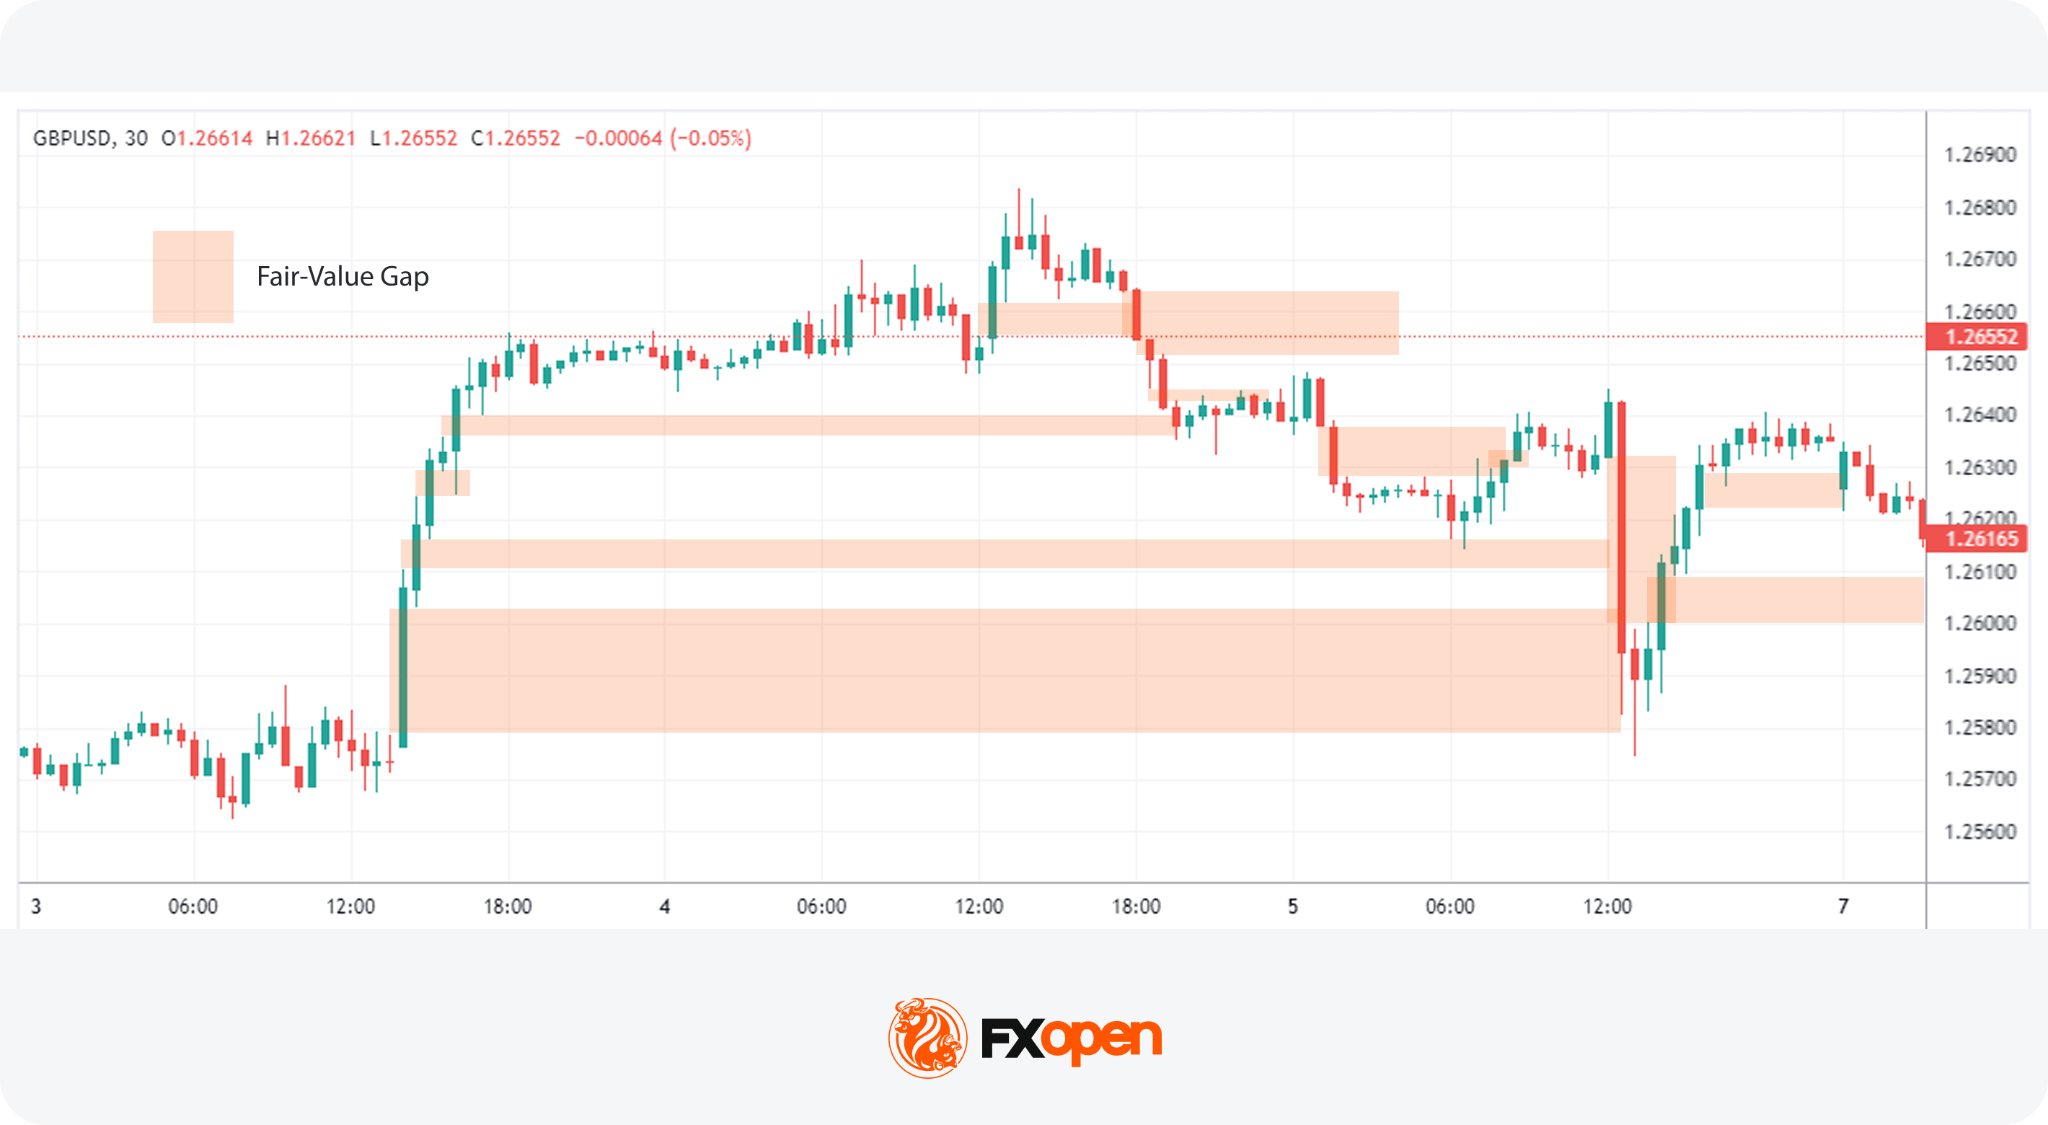
A fair value gap is a concept that reflects an imbalance in price caused by a fast, aggressive move where the market skips over prices that normally would be traded. It forms when a three-candle sequence leaves a space where the middle candle’s body and wick do not overlap with the wicks of the candles on either side. This shows that price moved so quickly in one direction that no trading occurred in that portion of the range.
Traders monitor revisits because the gap represents unfilled orders. Buyers and sellers who wanted to transact in that range never got the chance, and their orders may still be resting there. When price returns, that pending interest can produce a reaction, which is why an ICT fair value gap is often treated as a potential entry area rather than a target.
Displacements
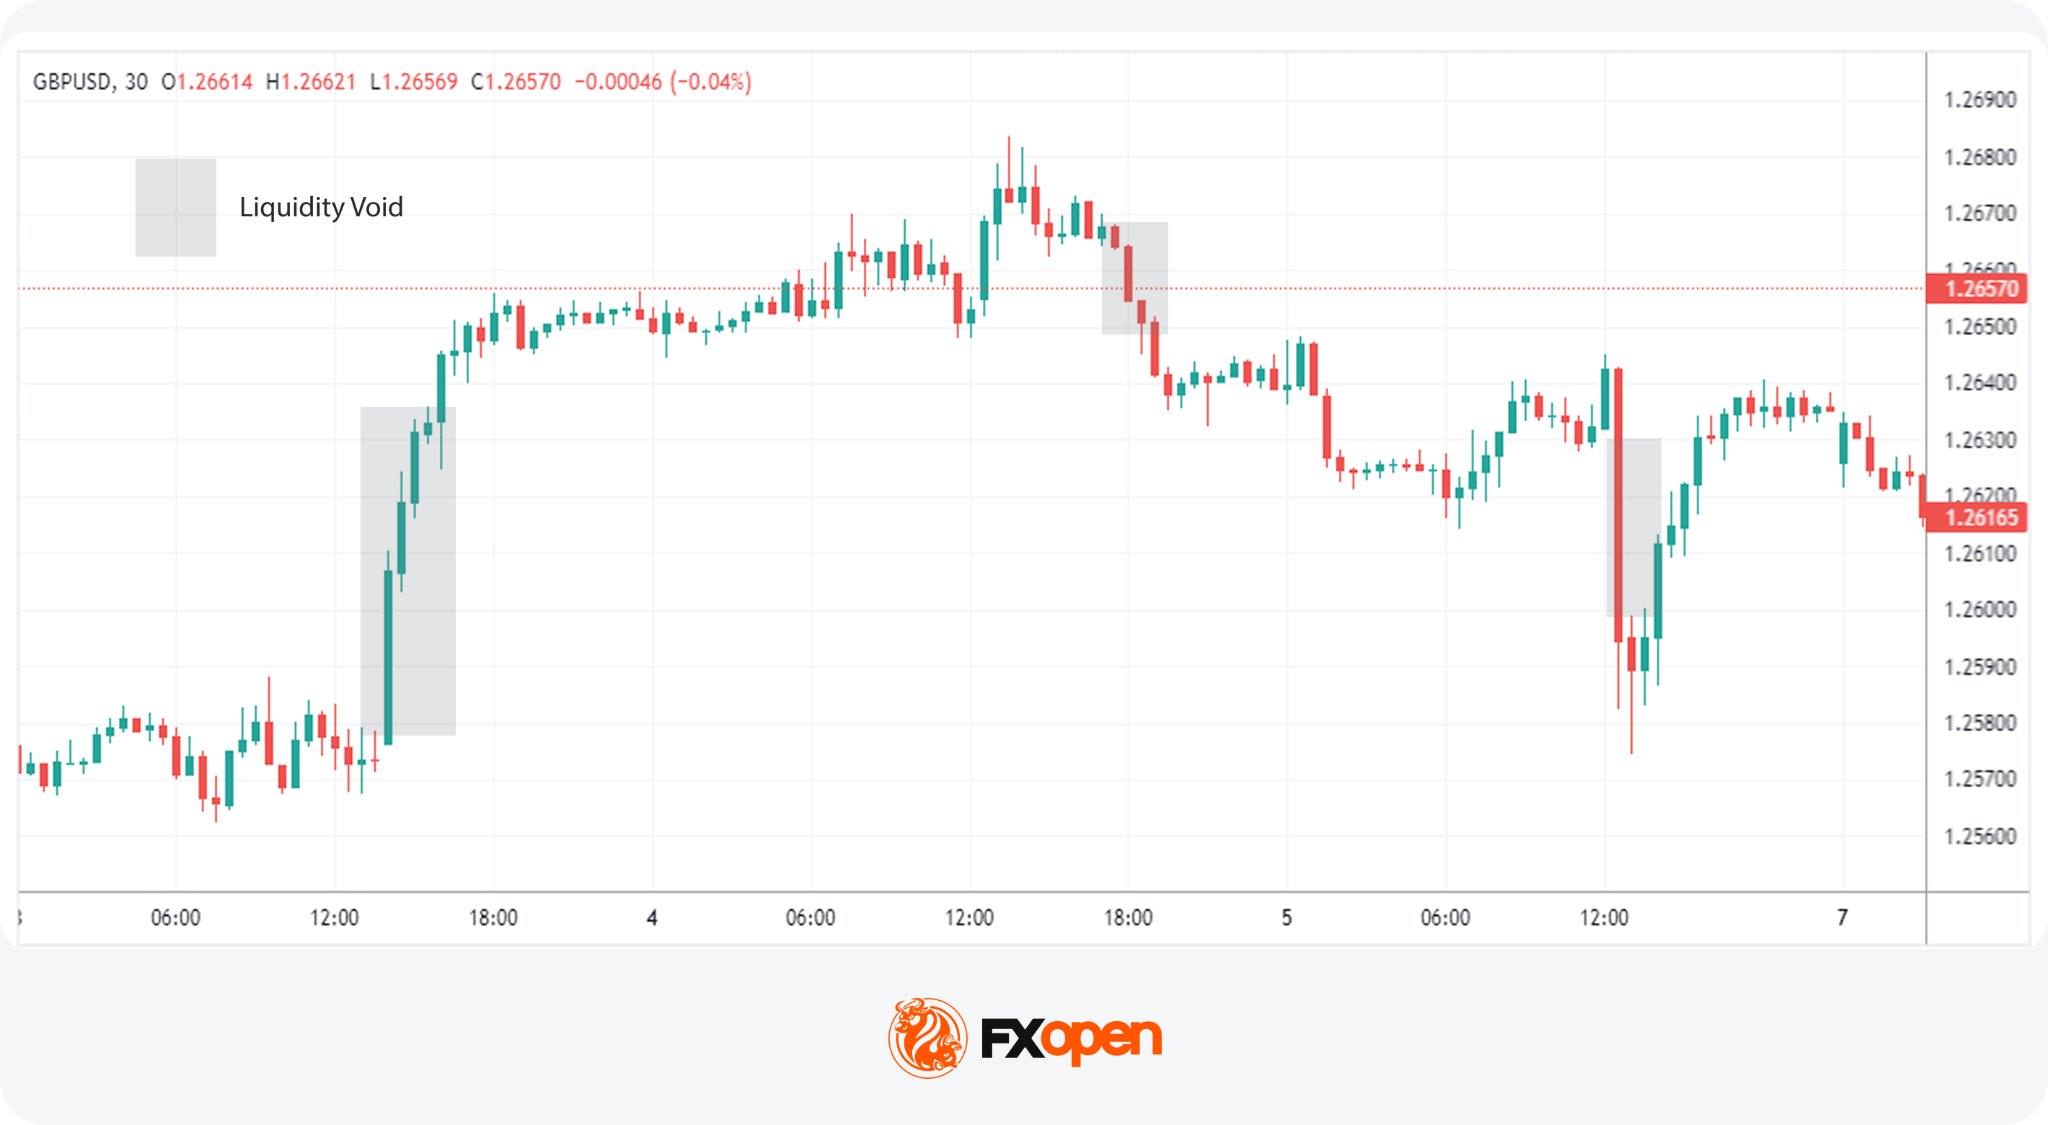
Displacements, also known as liquidity voids, is a sudden, forceful price move that leaves a large stretch of the chart with little trading activity behind it. It typically spans several candles and can contain multiple fair value gaps within it.
Displacement matters most for what it implies about intent. A slow drift through a level and a violent push through the same level are read differently, and the second is what turns a structural break into an MSS or gives an order block its significance.
5.Additional ICT Concepts
Beyond these ICT concepts, there are a few other niche components. These include Kill Zones, optimal trade entries, and balanced price ranges.
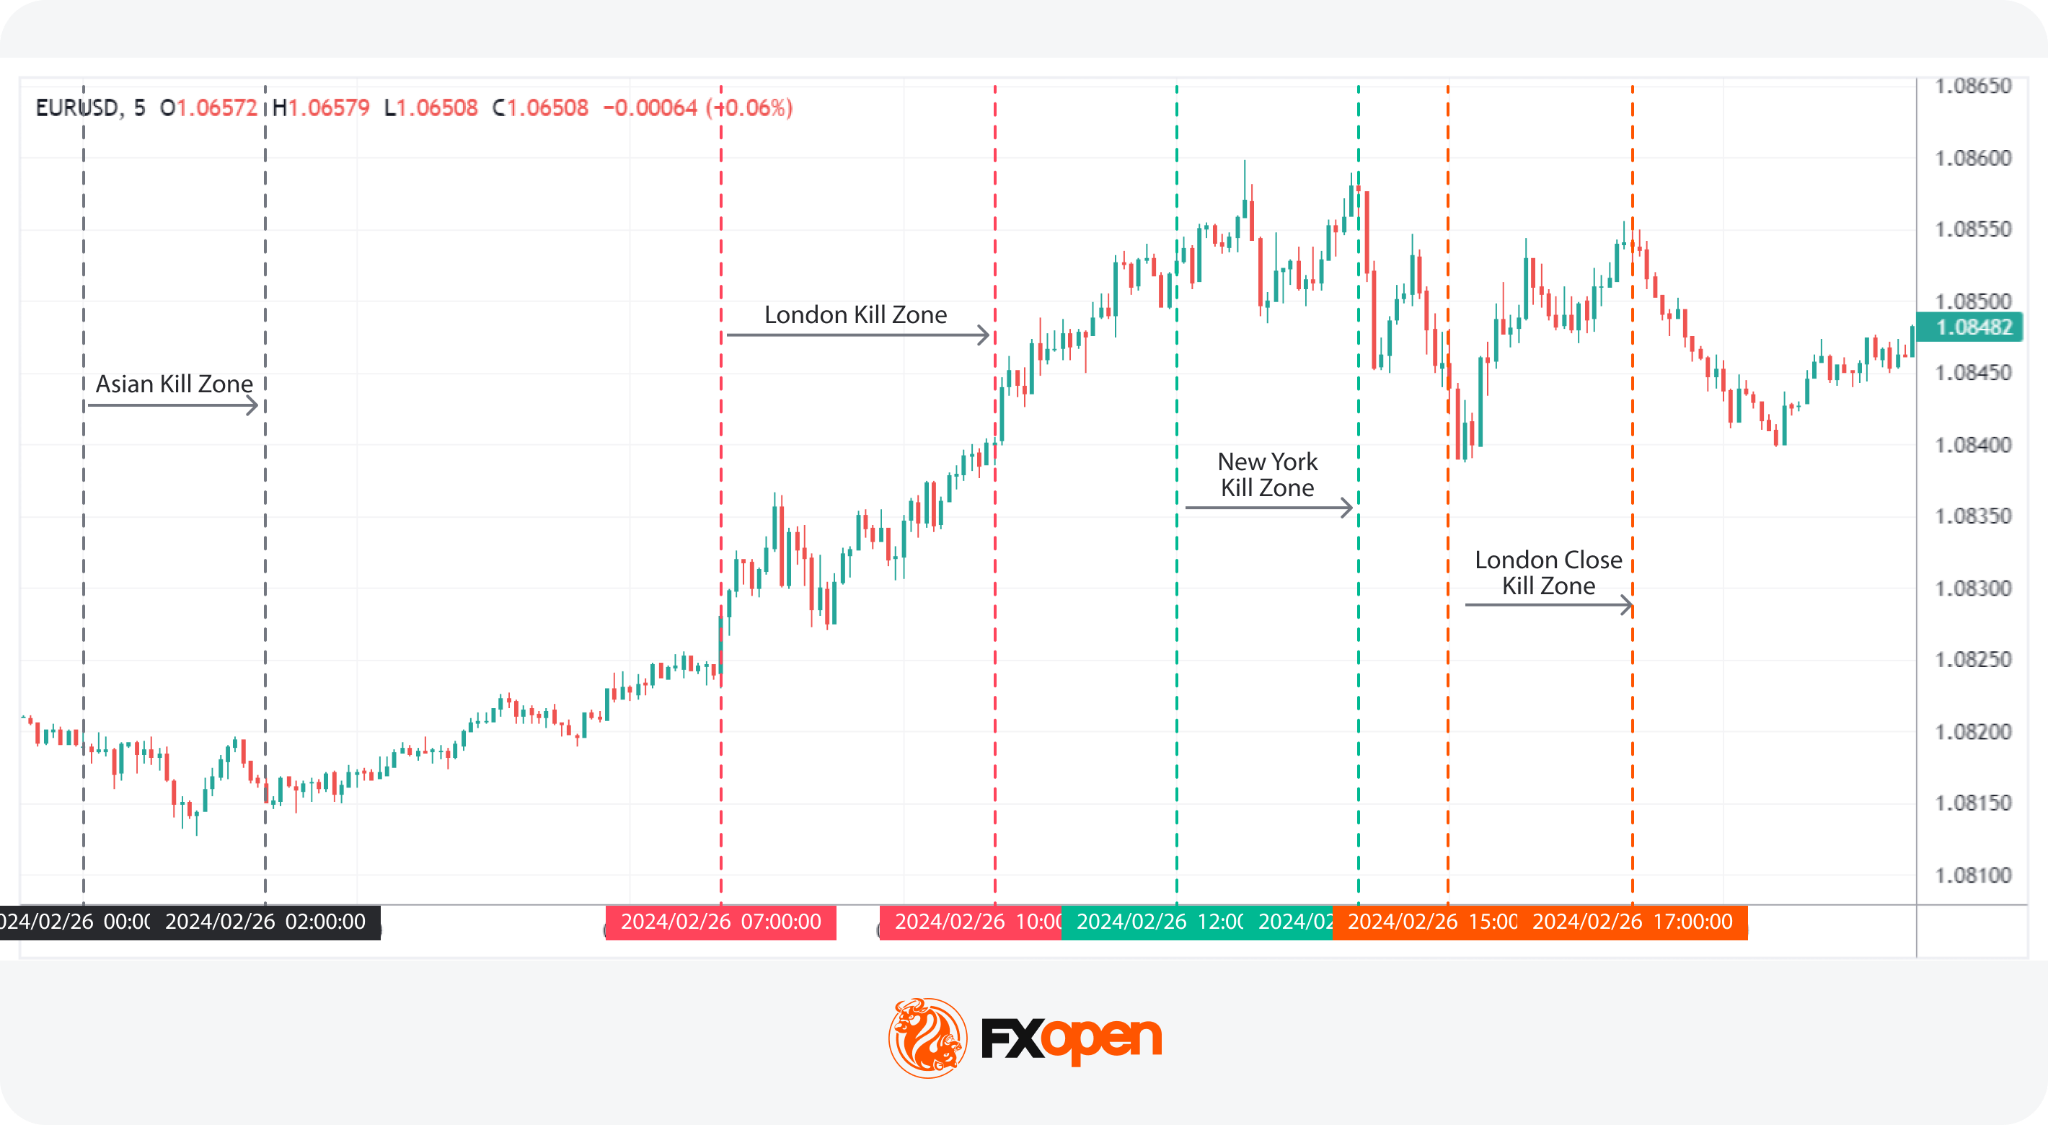
Kill Zones
Kill Zones refer to specific periods during the trading day when market activity significantly increases due to the opening or closing of major financial centres. These periods often set the tone for price movements based on the increased volume and volatility.
The concentration is real. BIS data for April 2025 puts global OTC foreign exchange turnover at $9.6 trillion dollars a day, with sales desks in the United Kingdom handling around 38% of it and the United States about 19%. That is why ICT kill zones cluster around the hours those two centres are active.
|
Kill zone |
Time (GMT) |
What traders watch for |
|
London |
07:00 to 10:00 |
The London session open often sets the day’s directional move and takes out Asian session highs or lows |
|
New York |
12:00 to 15:00 |
The New York session brings US data releases and frequently reverses or extends the London move |
|
London and New York overlap |
12:00 to 16:00 |
Both centres active at once, producing the heaviest volume of the day |
Times shift by an hour when either region moves to daylight saving, so traders check the current session times against their own platform clock rather than relying on fixed hours.
Optimal Trade Entry (OTE)
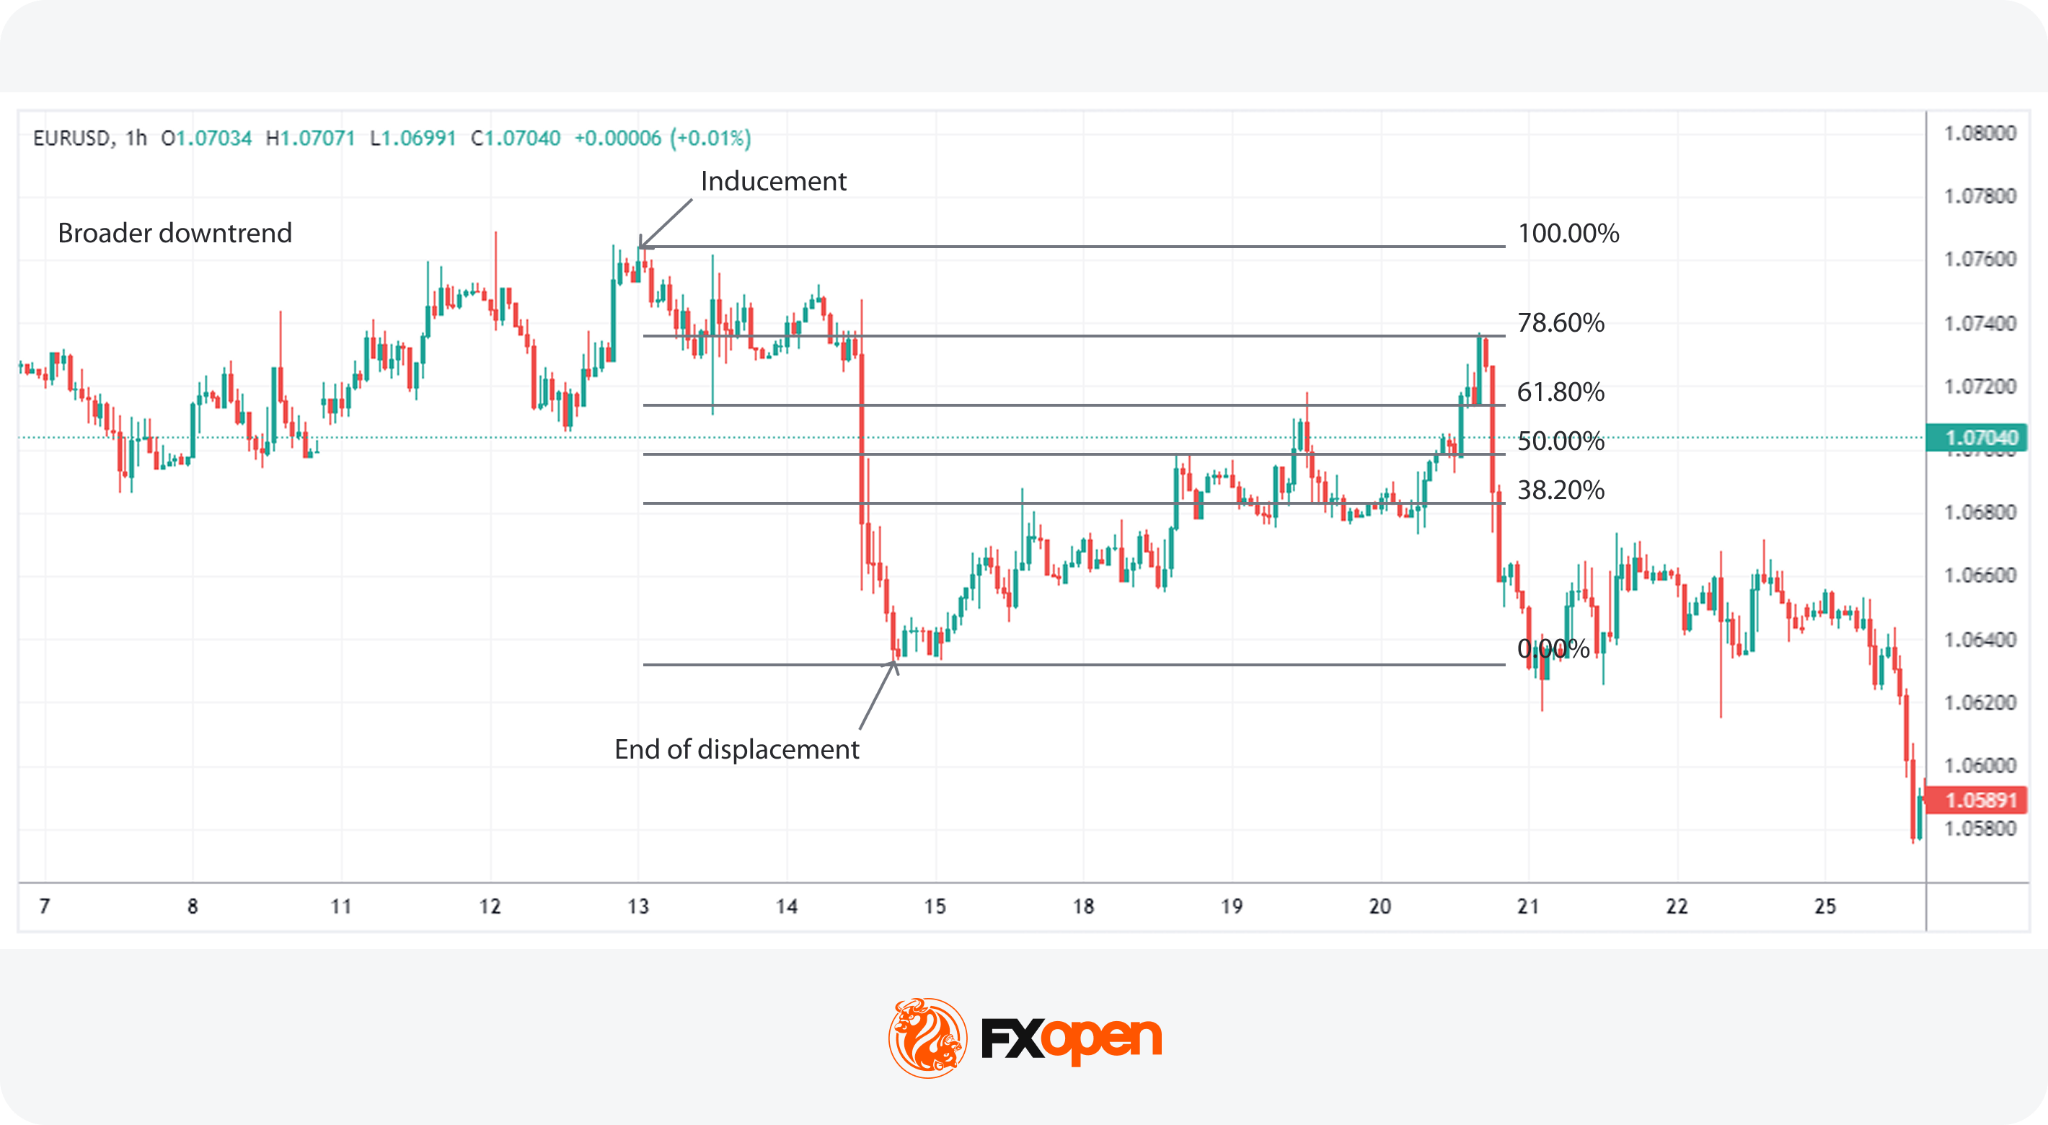
An optimal trade entry (OTE) is a type of Inner Circle trading strategy, found using Fibonacci retracement levels. After an inducement that prompts a displacement (leaving behind an FVG), traders use the Fibonacci retracement tool to pinpoint entry areas.
The Fibonacci tool is applied to the price move that created the displacement, from high to low in a bearish move and from low to high in a bullish move. Traders typically focus on the 61.8% to 78.6% retracement zone as a potential entry area.
Traders may also look for an order block or fair value gap within the ICT OTE zone. When these concepts overlap, they can provide additional confirmation for the setup.
Balanced Price Range (BPR)
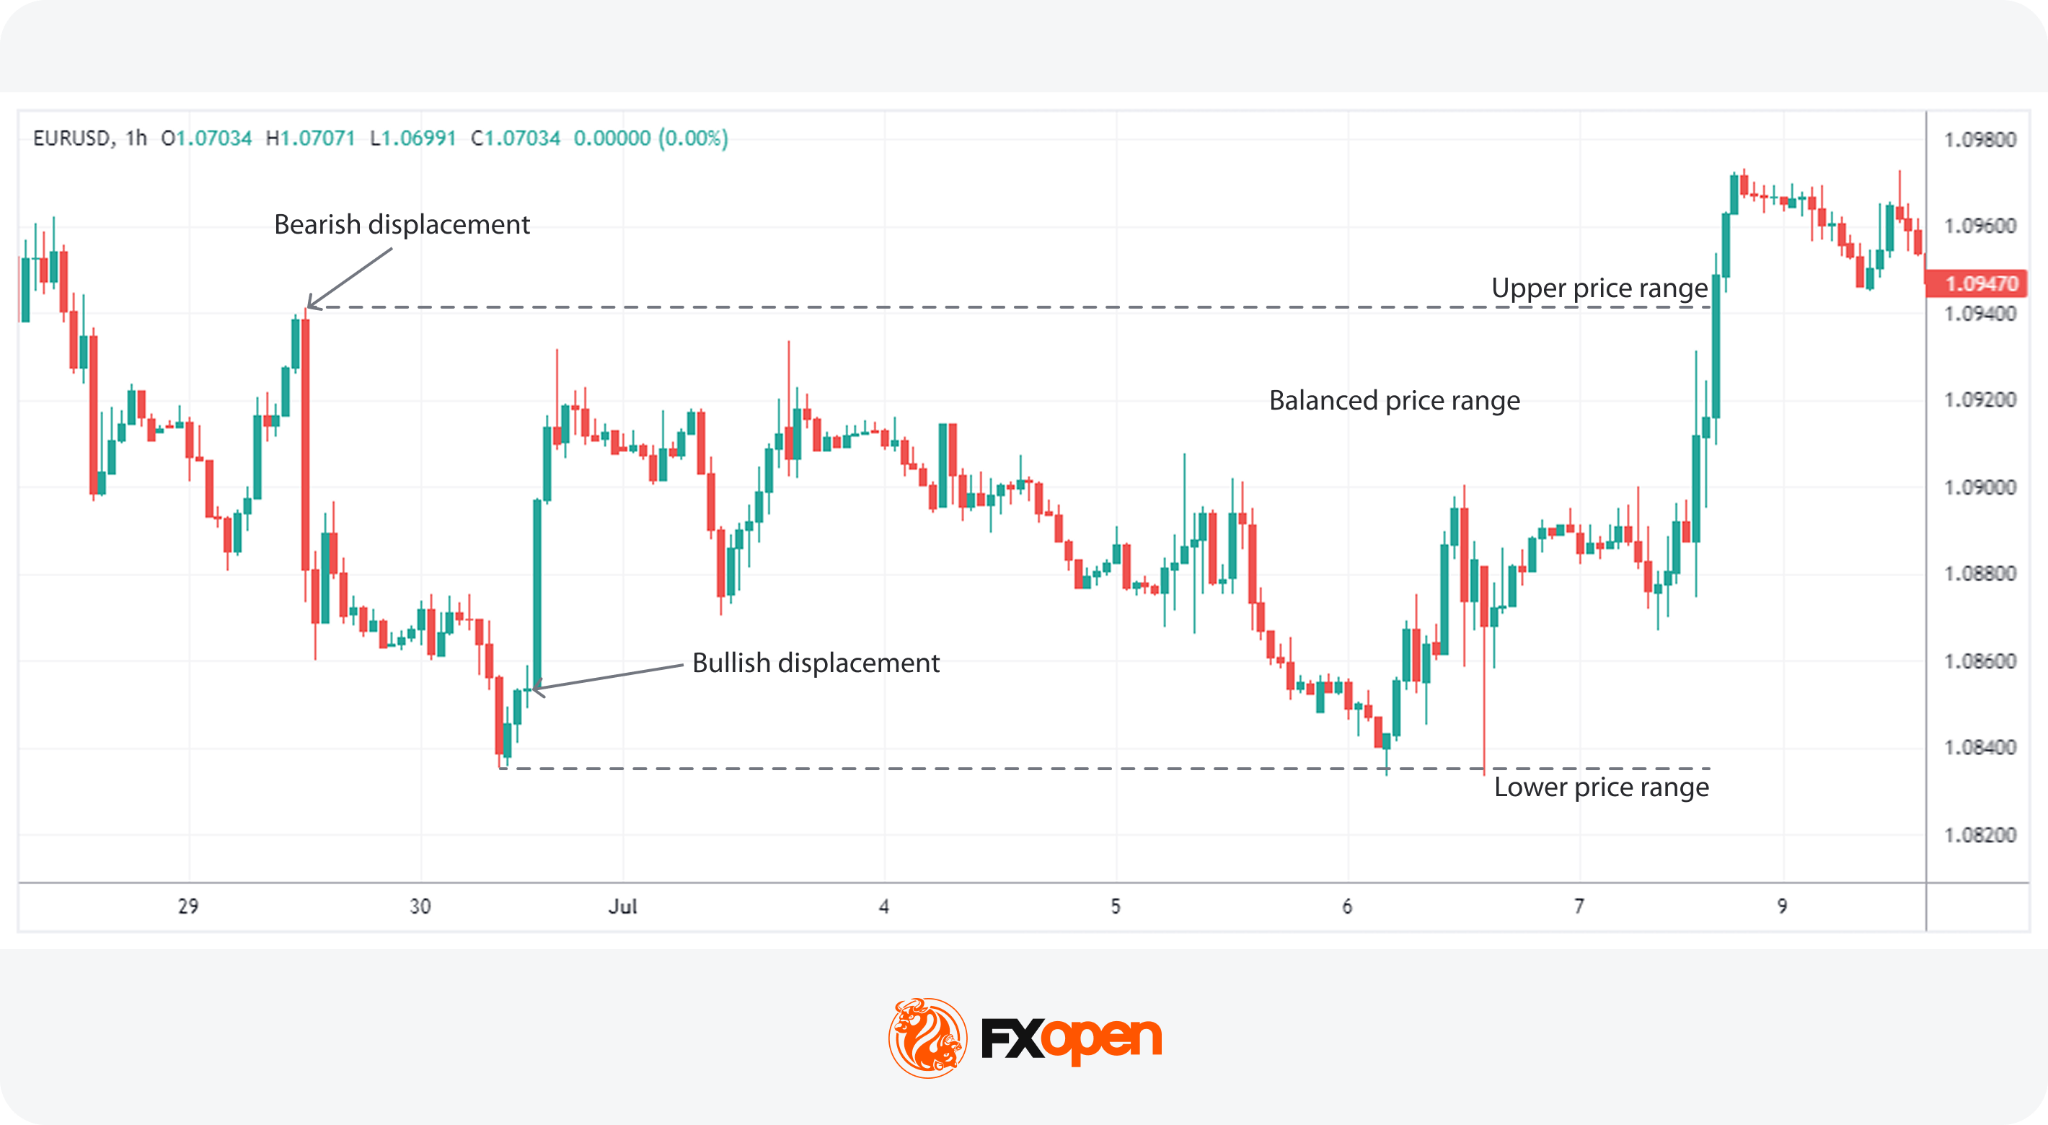
A balanced price range is a zone where price trades back and forth, rebalancing previous inefficiencies. Opposing displacements create overlapping FVGs, and the resulting zone shows where both directions have now traded. During this phase, price often oscillates between the extremes of the range as it works to resolve the imbalance.
A BPR gives traders defined boundaries rather than a single level. Reactions at the edges are watched for continuation, and a decisive move beyond either edge is read as the imbalance resolving in that direction.
ICT Trading Workflow
This is an analytical framework rather than a fixed rule set. Traders work through it in order, but each step involves judgment, and the sequence adapts to what the market is doing. It blends systematic market reading with judgment, context, and experience. The goal is to build a coherent narrative from higher-time-frame bias down to precise execution zones.
- Establishing a Higher Timeframe Bias
Traders begin by analysing the weekly, daily, and four-hour structure to identify the prevailing trend, key swing points, and major liquidity pools. This step frames whether the market is delivering higher or lower prices. - Marking Liquidity and Structural Levels
Traders identify buy-side and sell-side liquidity, including equal highs/lows, obvious stop clusters, and major swing points. Structural markers like BOS, CHoCH, and MSS may help traders understand whether momentum is intact or shifting. - Locating Imbalances and Institutional Footprints
Fair value gaps, order blocks, mitigation blocks, and displacements provide clues about where institutional orders may sit. Traders study how price reacts around these levels to understand whether smart money is adding to, mitigating, or closing positions. - Assessing Session Timing and Volatility Windows
Kill zones filter periods of heightened activity, potentially helping traders judge when ICT liquidity is likely to be taken. Timing adds context that chart patterns alone do not provide. - Building a Directional Narrative
Traders combine structural bias, liquidity targets, imbalances, and timing into a single market narrative. This sets expectations without forcing a mechanical decision. - Identify Potential Execution Zones
Areas such as retracements into order blocks, FVG fills, or OTE regions often align with points where momentum may resume. Traders use confluence, not a single signal, to refine these zones. - Review, Adapt, and ReassessAs price develops, traders reassess structure, liquidity, and displacement. The ICT strategy relies on active interpretation, so the process stays flexible.
Which Markets an ICT Concepts Be Used In?
ICT is built around price behaviour rather than the characteristics of any single market, so the same reading applies wherever there is enough participation to produce clean structure and visible liquidity.
ICT forex analysis is the most common application, particularly on major pairs, where session timing lines up directly with the London and New York kill zones. Index CFDs are the next most active area, since instruments tracking the S&P 500 or the DAX respond to the same session-driven volume. Commodities such as gold and oil, individual shares, and cryptocurrency* CFDs are all analysed with the same concepts, though liquidity and session behaviour vary between them.
Timeframes work the same way. Traders apply ICT concepts from the weekly chart down to the one-minute, usually running two or three timeframes together, with the higher one setting bias and the lower one refining entry areas. The shorter the timeframe, the more noise sits alongside the structure, which is why ICT concepts forex trading material tends to focus on the 15-minute to 1-hour range for execution.
What Challenges Do ICT Traders Face?
ICT presents several practical challenges because it demands strong chart interpretation skills and a good grasp of context. Traders often find the approach mentally demanding, especially when markets move quickly or produce conflicting signals.
Newer traders tend to struggle for a specific reason: individual concepts are easy to define, but they only make sense when combined, so learning definitions isn’t the same as being able to read a chart in real time.
The main challenges include:
- High complexity: ICT uses many concepts that interact with each other, so traders must read multiple layers of structure, liquidity, and imbalance at once.
- Context dependence: Signals rarely stand alone. Traders need to judge whether a displacement, BOS, or liquidity grab aligns with the broader narrative, which requires experience.
- Session-based variation: Price behaves differently across sessions, meaning traders must adapt to changing conditions rather than stick to fixed expectations.
- Discretion and nuance: ICT relies heavily on interpretation, so traders manage uncertainty and avoid forcing patterns that are not there.
- Emotional discipline: Because setups form quickly around liquidity events, traders face pressure to act without overreacting to noise.
ICT Trading Concepts: Advantages and Limitations
ICT trading offers a structured way to analyse price, but it also has clear limitations for traders to consider. The framework gives a detailed view of institutional behaviour, yet it remains demanding to apply consistently.
Advantages
- Institutional focus: ICT centres on how large players move price, giving traders a clearer read on why markets expand or reverse.
- Strong structural logic: Concepts like BOS, CHoCH, and MSS make trend shifts clearer than broad pattern-based methods.
- Precision in levels: Order blocks, liquidity pools, and FVGs provide well-defined areas that traders may use to take advantage of key price reactions.
- Multi-time-frame alignment: The framework links higher-time-frame bias with intraday execution, creating a coherent workflow.
Limitations
- Assumption of deliberate intent: ICT often interprets market moves as intentional actions by institutional traders, which may not always reflect how order flow actually operates.
- Steep learning curve: The depth of the framework means traders may require considerable time before applying it with consistency.
- Retrospective clarity: Many concepts appear clearer in hindsight, making them harder to apply consistently in real time.
- No fixed rules: The discretionary nature means consistency can be harder to maintain than with mechanical systems.
Whether ICT suits a particular trader depends less on the concepts themselves than on how they are used. This methodology rewards traders who are willing to tolerate uncertainty and form opinions based on multiple factors, and tends to disappoint those looking for a signal to enter a trade.
The Bottom Line
ICT trading brings market structure, liquidity, imbalances, and timing into a single framework for analysing price action. Rather than treating concepts such as BOS, order blocks, fair value gaps, and liquidity sweeps as isolated signals, traders can use them together to build a broader view of market direction and potential price reactions. As ICT relies heavily on interpretation, these concepts require practice and should be considered alongside appropriate risk management.
Traders interested in applying ICT concepts across forex and CFD markets can open an FXOpen account and access multiple markets with spreads from 0.0 pips and commissions from $1.50 per lot.
FAQs
What Is ICT Trading?
ICT (Inner Circle Trading) is a price-action methodology developed by Michael J. Huddleston. It focuses on market structure, liquidity, order blocks, fair value gaps, displacement, and session timing to analyse price movements and potential changes or continuations in market direction.
What Are the Main ICT Concepts?
The main ICT concepts include market structure, Break of Structure (BOS), Change of Character (CHoCH), Market Structure Shift (MSS), liquidity, order blocks, fair value gaps (FVGs), displacement, Optimal Trade Entry (OTE), and kill zones. Together, they form a framework for analysing price action.
What Is an ICT Trading Strategy?
An ICT trading strategy combines several concepts rather than relying on a single signal. Traders may establish a higher-timeframe bias, identify liquidity and market structure, and then look for potential entry areas using order blocks, fair value gaps, or OTE zones.
What Is the Difference Between ICT and SMC?
ICT (Inner Circle Trading) is a specific methodology developed by Michael J. Huddleston, while Smart Money Concepts (SMC) is a broader term for approaches that analyse price through liquidity and institutional market behaviour. They share concepts such as market structure, liquidity, and order blocks, while ICT uses specific terminology and models.
Is ICT Trading for Beginners?
ICT trading can be studied by beginners, but it involves numerous interconnected concepts and requires discretionary analysis. Understanding market structure, liquidity, and ICT price action first may make concepts such as order blocks, fair value gaps, and market structure shifts easier to interpret.
Does ICT Trading Use Indicators?
ICT trading primarily focuses on price action rather than technical indicators. Its core analysis is based on market structure, liquidity, imbalances, order blocks, and trading sessions. Some traders combine ICT concepts with indicators, but indicators are not central to the methodology.
Can ICT Concepts Be Used in Forex Trading?
Yes. ICT concepts are commonly applied to forex, as well as indices, commodities, shares, and other financial markets. Because the methodology focuses on price structure, liquidity, and timing, traders can analyse ICT concepts across different instruments and timeframes.
What Is the Difference Between BOS, CHoCH, and MSS?
A Break of Structure (BOS) generally indicates continuation of the existing market direction. A Change of Character (CHoCH) suggests that the current structure may be changing, while a Market Structure Shift (MSS) involves a structural change accompanied by strong displacement through a significant level.
What Is a Fair Value Gap in ICT Trading?
A Fair Value Gap (FVG) is a price imbalance created during a strong directional move. In ICT analysis, traders monitor these areas because price may later return to the gap before continuing or establishing a new direction.
Can ICT Be Combined With Other Trading Methods?
Yes. Traders may combine ICT concepts with other forms of technical analysis, such as support and resistance, trend analysis, or technical indicators. However, additional tools do not necessarily confirm an ICT setup, and each method should be assessed within the broader market context.
*Important: At FXOpen UK, Cryptocurrency trading via CFDs is only available to our Professional clients. They are not available for trading by Retail clients. To find out more information about how this may affect you, please get in touch with our team.
This article represents the opinion of the Companies operating under the FXOpen brand only. It is not to be construed as an offer, solicitation, or recommendation with respect to products and services provided by the Companies operating under the FXOpen brand, nor is it to be considered financial advice.
You must be logged in to post a comment Login