
Crypto World
If Bitcoin falls below $60K, recovery could slip to 2027, data shows

Bitcoin (BTC) has given back much of its March momentum, dipping about 1.4% for the month and registering a roughly 24.6% drop for the first quarter of 2026. Market observers note that this retreat fits a longer-term drawdown pattern that could extend into the end of 2026, with many analysts projecting another roughly 40% slide from prior highs. If that path plays out, a sustained recovery might not arrive until 2027, shifting the timing of a new bull phase well into the next year.
Across on-chain and market indicators, the signal mix remains nuanced. While price action points to renewed selling pressure, some metrics suggest the market is not yet at historic bottom zones, leaving traders watching for clearer signs of capitulation before a bottom is confirmed.
Key takeaways
- Bitcoin’s drawdown deepens the uncertainty around the timing of a new cycle low, with potential relief not expected until late 2026 or 2027.
- The Bitcoin Combined Market Index (BCMI) sits near 0.27, well above past bottoms around 0.12–0.15, implying further downside could be needed to retrace to historical troughs.
- Historical data linking drawdown depth to recovery time suggests that a 40–60% decline can extend the path back to prior highs by many months.
- On-chain and liquidity-focused perspectives point to ongoing selling pressure from larger market participants, potentially prolonging the downturn before a durable bottom forms.
- A handful of macro- and policy signals—such as anticipated rate moves—could influence the pace of BTC’s recovery, reinforcing that the trajectory depends on both crypto dynamics and external factors.
Longer-cycle implications for BTC’s recovery window
Analysts highlight a pronounced link between how far Bitcoin falls and how long it takes to reclaim previous highs. Data from Ecoinometrics indicates that each additional 10% drop historically adds roughly 80 days to the time required to surpass prior peaks. With BTC down about 48% from its late-2025 highs, the implied recovery horizon stretches toward roughly 300 days from the October peak of around $126,000 in 2025. At the same time, about 172 days have elapsed in this cycle, suggesting approximately 125 to 130 more days if the cycle low lands near $60,000.
Even so, those cycle lows have not necessarily been definitively tagged, leaving open the possibility of further downside in the near term. The current picture is one of a protracted consolidation with macro volatility capable of reshaping the trajectory depending on policy and external demand drivers.
On-chain and market indicators complicate the bottoming process
On-chain analytics add nuance to the narrative. The Bitcoin Combined Market Index (BCMI), which aggregates MVRV, NUPL, SOPR and market sentiment, sits around 0.27. That level remains above the thresholds that have historically marked cycle bottoms since 2018, where bottom zones hovered near 0.15 or lower. In practical terms, BCMI’s current position suggests additional downside could be required to revisit historical lows, particularly if sell pressure persists across spot and futures markets.
From a liquidity perspective, commentary from market observers underscores a stubborn weakness in the broader BTC liquidity regime. The narrative centers on a persistent distribution by larger holders, a factor that can slow any swift rebound even in the face of favorable macro developments.
Analyst voices: cycles, capitulation, and macro context
“Larger players are selling into this structure harder than they have in 18 months. That does not mean price has to collapse immediately. But it does mean this level is being tested with real sell pressure pressing into it.”
That assessment comes from a well-known trader who tracks whale-to-retail dynamics, highlighting that the current setup is being tested by substantial selling pressure at key technical levels. The implication is not an imminent crash, but rather a test of supply-demand equilibrium under heavy participation from larger market players.
Another influential voice in the space has long emphasized a wider cycle narrative. A prominent liquidity-focused analyst had previously sketched a path where Bitcoin could rally to the mid-$70,000s, only to re-enter a bearish regime as overall market liquidity deteriorates, and the “bear” phase extends through the latter part of the decade. In this framework, a deeper capitulation could extend the cycle until a clearer bottom forms, with the recovery not taking hold until early 2027.
Within the same ecosystem, macro considerations loom large. A respected macro-focused publication recently noted that monetary policy expectations are shifting. A notable forecast referenced by market watchers suggested rate cuts might not arrive until late 2027, with a non-trivial probability that rates could rise by March 2027. The dynamic between policy expectations and liquidity conditions adds an additional layer of uncertainty to Bitcoin’s timing for a durable rebound.
These perspectives—whether anchored in on-chain signals, macro policy, or liquidity dynamics—underscore a common thread: the path to a new upside regime remains contingent on both the crypto market’s internal mechanics and the broader economic backdrop.
Related coverage has previously highlighted how shifts in on-chain metrics—such as supply in profit levels and other profit-and-loss indicators—can precede multi-fold moves in Bitcoin’s price. While not a guarantee, the interplay between investor behavior, realized versus market value, and macro stimuli remains a focal point for evaluating the next meaningful swing in BTC.
This synthesis reflects a cautious, data-driven view: Bitcoin’s next phase will depend on deeper capitulation signals, a rebalancing of on-chain metrics toward traditional bottoms, and a macro environment that gradually aligns with a renewed appetite for risk. Investors should monitor how the BCMI behaves relative to historical bottoms and watch for any decisive shifts in liquidity conditions and policy expectations as the year progresses.
This article does not constitute financial advice. Readers should conduct their own research and consider their risk tolerance before acting on market signals.

XRP’s risk-adjusted performance turned modestly positive on March 26, marking a shift after months of flat-to-negative readings. A 30-day average return of 0.00063 accompanies a Sharpe ratio of 0.0267, suggesting that current gains are modest but still outpaced by risk. On-chain data shows persistent accumulation by large holders, implying underlying demand even as price action remains subdued.
Analysts point to a broader pattern: on-chain buying and a slowly improving risk profile could set the stage for a steadier path higher, even if price upside remains constrained in the near term.
Key takeaways
- The XRP Sharpe ratio moved into positive territory for the first time in months on March 26, supported by a 30-day average return of 0.00063.
- Whale activity has remained firm, with CryptoQuant data showing XRP inflows averaging about $9 million per day over the last 30 days, continuing a pronounced accumulation phase that began in late February.
- Open interest surged 14.8% in the 24 hours to March 26, signaling renewed trader participation, alongside repeated long-liquidation spikes above $2 million in recent sessions.
- XRP’s price structure has shifted to a bearish bias: the asset invalidated its previously bullish ascending triangle and shed about 13.63% over ten days, with near-term support at $1.27 and a yearly low near $1.11 in focus.
- Past patterns suggest that prolonged accumulation can precede stronger upside, as seen in Q2 2025 when accumulation preceded a rally to a $3.65 high on July 18, 2025; watchers will want to see if the current phase leads to a similar outcome.
Positive risk-adjusted returns amid on-chain demand
CryptoQuant-derived data indicate that XRP’s improved risk-adjusted profile aligns with a pickup in trading activity. Arab Chain, in a CryptoQuant quicktake, framed the recent Sharpe ratio improvement as part of a gradual rebalancing that could limit downside for holders. However, the analyst cautioned that a return to negative territory would signal renewed volatility and fading momentum.
“If the indicator falls back into negative territory, it could signal a return of volatility and weakening momentum.”
While the short-term signals point to hedged risk, the long-run picture suggests a more constructive tilt if accumulation continues. The last substantial accumulation wave in Q2 2025 culminated in XRP’s expansion rally to an all-time high of $3.65 on July 18, 2025, underscoring how inflows can precede meaningful upside in subsequent months.
Whale flows and market momentum
On-chain trackers show that XRP whale inflows have remained robust, with the 30-day moving average holding around $9 million per day. The sustained demand has persisted since February 27, marking the longest accumulation stretch in months and echoing a broader pattern seen during prior cycles when whales stepped in ahead of bigger price moves.
That trend matters for investors because it points to durable demand that could underpin market returns even if price volatility remains elevated. The question for traders is whether this accumulation translates into sustained upside or simply supports a slower drift higher as macro and liquidity conditions evolve.
Open interest and near-term technicals
Open interest figures reinforce a market where risk is being actively recycled. CryptoQuant data show a 14.8% rise in 24-hour open interest on March 26, the strongest such move since March 4, reflecting renewed participation from long and short positions and a pattern of consecutive long liquidations—$2.5 million on March 18, roughly $2.45 million on March 21, and about $2.15 million on March 26.
From a price-structure perspective, XRP has broken from a bullish ascending triangle, and the prior ten-day slide of around 13.6% points to a bearish bias in the near term. If the current dynamic persists, traders will likely test support around $1.27, with a deeper look toward the yearly low near $1.11 in the weeks ahead.
The combination of a positive risk-adjusted metric and steady whale inflows paints a nuanced picture: a market where demand is accumulating even as prices wobble, potentially laying a groundwork for a more durable move if buyers sustain their activity.
Looking ahead, buyers will want to see whether the positive risk-adjusted read holds and whether whale demand remains steady. The next critical junctures to watch include whether XRP can sustain levels above near-term support and whether accumulation pulses continue to shape the risk landscape in the coming weeks.
Past patterns offer a useful lens: the accumulation phase seen in Q2 2025 preceded a rally to an all-time high later that year, suggesting that continued demand could precede stronger upside if sustained by shifting market dynamics.
Looking ahead, traders will watch if the positive risk-adjusted reads endure and whether whale accumulation remains steady; a sustained move higher will depend on whether demand translates into durable upside beyond the near-term support.

Key Insights
- MetaComp launches AI-driven StableX upgrade to unify compliance, payments, and digital asset operations
- VisionX engine strengthens AML/CFT with multi-layer analytics and near-zero false clean rates
- AgentX and KYA enable regulated AI automation across payments, treasury, and compliance workflows
Singapore-based MetaComp has introduced major upgrades to its StableX Network, aiming to strengthen compliance, payments, and wealth management across fiat and stablecoin systems. The move positions StableX as a compliance-first platform designed to bridge traditional finance and digital assets.
The upgrade integrates three core components: VisionX Engine, AgentX AI layer, and the KYA governance framework, focused on enabling regulated, AI-driven financial infrastructure.
VisionX Engine Enhances AML/CFT Monitoring
The Web2.5 VisionX Engine delivers multi-layered risk monitoring across identity, behavior, and network levels. Identity screening combines traditional KYC data with Web3 wallet intelligence, while behavioral analysis detects transaction anomalies.
Network screening highlights the concealed counterparty risks, offering a closer supervision of the flow of transactions. MetaComp said parallel screening across four blockchain analytics providers reduces false clean rates from around 25% to near zero.
The system supports both cross-border payments and digital asset transactions, allowing institutions to maintain compliance with global AML/CFT requirements.
AgentX Powers AI Financial Execution
AgentX serves as the platform’s AI execution layer, enabling autonomous financial operations. AI agents can handle transactions, detect risks and perform operations on fiat and crypto systems.
The layer enables AI-to-AI communication, enabling automated processes in the payment, treasury and compliance operations. The most important characteristics are real-time transaction intelligence, wallet screening, compliance integration, and a modular and protocol-agnostic infrastructure.
The initial implementation, Agentic KYT, is concerned with the monitoring of transactions as an AML/CFT compliance, which expands the automation of regulation.
KYA Framework Governs AI Activity
The KYA (Know Your Agent) framework provides a regulatory mechanism over AI agents in financial systems. It ensures that AI-based processes are auditable and compliant with regulatory standards.
MetaComp observed that Singapore Model AI Governance Framework is consistent with the given framework, and it helps to responsibly deploy agentic AI in financial services.
AI-Native Automation and Expansion Plans
Together, AgentX and KYA enable AI-native financial automation, allowing intelligent agents to independently manage payments, treasury, and compliance while remaining regulated.
The upgrade is after the $35 million Pre-A round at MetaComp. The company will increase the penetration of StableX in the Asian, Middle East, African and Latin American markets to attract the use by institutions.
MetaComp also published a whitepaper called Cross-Border Payments for SMEs: Voices in ASEAN and the Rise of Stablecoins, which states that the stablecoin is increasingly becoming an important part of enhancing the efficiency of payment.
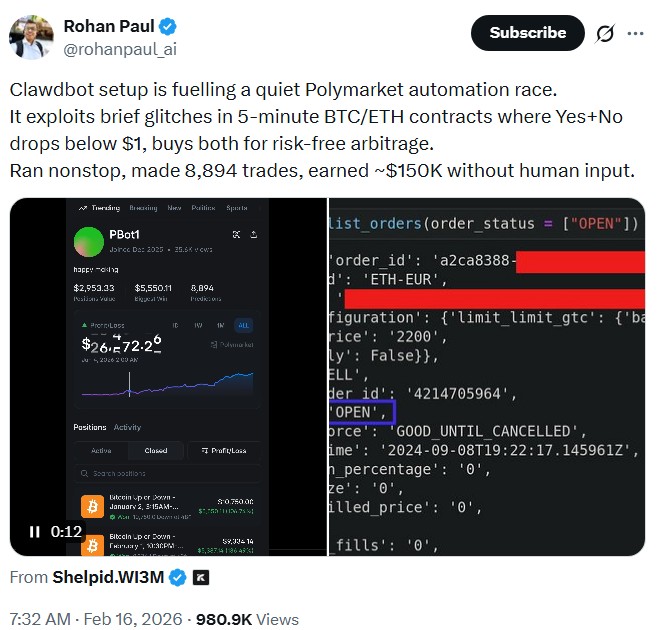
Prediction markets aggregate human judgment in theory, but some of their consistent trading opportunities may end up captured by systems that move faster than any person can.
Arbitrage opportunities can show up as brief mispricings, from outcomes that temporarily fail to sum up to 100%, to short delays in how quickly markets react to new information.
Rodrigo Coelho, CEO of Edge & Node, said bots are already scanning hundreds of markets per second, a role that increasingly overlaps with more advanced AI-driven agents.
“Capturing those opportunities requires monitoring thousands of markets and executing trades almost instantly, which is why they’re largely dominated by automated systems,” Coelho told Cointelegraph.
That makes prediction markets a natural next step for AI-driven systems built to exploit short-lived pricing gaps without human input.

Arbitrage mechanics in prediction markets
Bitcoin and crypto prices haven’t been performing well recently, with BitMine’s Tom Lee calling the current sentiment a “mini-crypto winter.” Meanwhile, prediction markets have emerged as venues where users can bet to profit independently of broader economic conditions.
The rise of prediction markets has also seen opportunities such as what Coelho calls “latency arbitrage,” which rely on short windows too narrow for humans to manually target. He told Cointelegraph:
If there’s even a few-second delay between an event happening and the market updating, bots scan for that and place bets on the correct outcome. For that window, they have a 100% guaranteed win.”
A recent study found that Polymarket exhibits frequent pricing inconsistencies, allowing traders to construct arbitrage positions. These opportunities arise both within individual markets, where probabilities don’t sum to 100%, and across related markets with inconsistent pricing. The researchers estimated that roughly $40 million has been extracted from these inefficiencies.

Prediction markets are still nascent, but their technology has been improving as well. For example, Polymarket recently introduced taker fees to increase trading costs. Outcomes aren’t finalized immediately, making these strategies less reliable and not always profitable.
AI agents could amplify market manipulation risks
Aside from arbitrage, AI agents could increasingly take over activity in prediction markets, raising concerns that automated systems may replicate the same behaviors seen from humans. They are trained on human activity, after all.
Coelho pointed out that large players can influence outcomes by placing sizable bets on one side, and that more advanced agents could exploit similar dynamics at scale.
“If you have a large pool of money and the market is thin, you can bet on one side and sway the market, like we saw in the election when some French guy put in like [$45 million] on Donald Trump winning,” he said.
Polymarket’s open interest was highest around October and early November of 2024, during the US elections, according to Dune Analytics data. Following a sharp initial decline, it has continued to surge in popularity, with politics leading as the most popular topic, followed by sports and crypto.

Related: Federal regulation looms as 11 states go after prediction markets
Pranav Maheshwari, engineer at Edge & Node, said the rapid improvement of AI agents alongside prediction markets makes such risks more urgent and called for guardrails.
“Up until now, AI agents have medium capability and we give them a lot of permissions. With this medium capability, they have already started acting autonomously,” Maheshwari told Cointelegraph.
But in the future, AI agents will have really high capabilities. When it has really high capabilities as humans, you have to restrict their permissions.”
From execution bots to AI-driven systems
Trading itself is undergoing a shift, as automation moves from simple execution bots to more advanced, AI-assisted systems capable of identifying and acting on opportunities in real time.
The systems currently used to exploit market inefficiencies remain largely rule-based, but the tools behind them are evolving.
Archie Chaudhury, CEO of LayerLens, said most retail participants are not using AI agents directly, relying instead on chatbot interfaces like ChatGPT or Gemini for research, while more advanced users are beginning to experiment with automation.
“Some of us simply use coding agents such as Claude Code to create automated bots or algorithms for executing trades, while others take it a step further, using autonomous tools such as OpenClaw to enable the automatic execution of trades and other policies,” he told Cointelegraph.
Related: Do Super Bowl ads predict a bubble? Dot-coms, crypto and now AI
As AI literacy among retail traders rises, agents could broaden access to strategies that were previously limited to institutions, according to Chaudhury. However, this does not eliminate competition, and large institutions are already using AI, though not always publicly.
He added that existing large language model architectures are well suited to interpreting structured financial data, which could lower the technical barrier for building trading systems that would have previously required specialized quantitative expertise.
The same dynamics are already visible across crypto markets, where arbitrage increasingly depends on automation rather than human judgment. As these systems evolve, the edge is shifting execution speed. Those leaning on AI and automation have a clear edge over those that don’t.
Magazine: Agent wastes 14 hours of scammers’ time, LLMs ‘poisoned’ by Iran: AI Eye
P2P.me, a cryptocurrency payments platform, is facing questions over a $20,000 Polymarket bet tied to its own fundraising campaign after disclosing that it traded on the outcome before the round opened publicly.
On March 27, P2P.me announced that it had liquidated a Polymarket betting position on its ability to meet its $6 million fundraising target. The company disclosed that it placed the bets 10 days before officially opening its funding round.
Big Polymarket Profit Sparks Insider Trading Debate
P2P.me admitted that, at the time the wagers were placed, it had already secured an oral commitment of $3 million from the venture capital firm Multicoin.
Some legal observers said the $3 million oral commitment could be viewed as material non-public information, though P2P.me said the absence of signed documents meant the outcome was still uncertain.
P2P.me further defended the trade and characterized the bet as a “vote of confidence.”
“We named the account “P2P Team” deliberately – to give a marketing signal of our presence to the community and reflect our intent to be transparent. But intent isn’t the same as action. Not disclosing at the time was a mistake we own. We took time to study the legal implications before speaking, which is why we stayed silent until now with a “No Comments” stance! – that too is a fair criticism,” it stated.
P2P.me eventually raised $5.2 million from outside investors, allowing the firm to close its Polymarket positions at $35,212. The trade generated a profit of roughly $14,700 from an initial entry of $20,500.
Following the backlash, some investors and industry insiders argued that the incident was being blown out of proportion. They attributed the trade to naiveté rather than malice.
Simon Dedic, co-founder of Moonrock Capital and an investor in P2P.me, defended the team’s character and motive. According to him, the trade was a misguided “guerrilla marketing stunt” designed to show conviction.
“No one with any common sense would risk a $6 million raise over $15,000. The idea was to show such strong conviction in the sale that they’d even bet on themselves. This is exactly why they intentionally named the account ‘P2P team.’ Otherwise, you’d have to argue they’re the most incompetent insider traders of all time,” Dedic added.
Amid mounting criticism on the eve of its planned initial coin offering, P2P.me announced that it would route the proceeds from trading to the MetaDAO Treasury. The company clarified that MetaDAO had no prior knowledge of the trades.
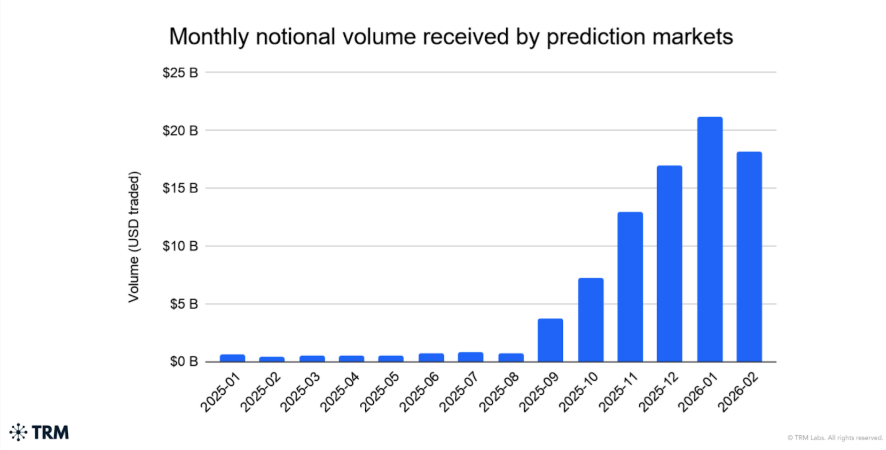
This incident comes at a time when prediction markets are enjoying an explosive growth in the sector. Blockchain platform TRM Labs stated that the sector’s transaction volumes have surged from $1.2 billion in early 2025 to more than $20 billion by January 2026.
Due to this rapid growth, there have been increasing regulatory concerns about decentralized prediction markets. Platforms such as Polymarket and Kalshi have recently implemented stricter surveillance measures to curb insider trading.
The post P2P.me Faces Insider Trading Allegations Over Polymarket Bets appeared first on BeInCrypto.
Google is preparing to support a multibillion-dollar data center project in Texas leased to Anthropic as competition for AI infrastructure accelerates.
The project, operated by Nexus Data Centers, could exceed $5 billion in its initial phase, with Google expected to provide construction loans, Financial Times reported on Friday, citing people familiar with the matter. A consortium of banks is also competing to arrange financing by mid-year, per the report.
According to the report, Anthropic recently signed a lease for the 2,800-acre campus, which forms part of its broader infrastructure tie-up with Google. Construction is already underway, supported by early-stage debt financing from Eagle Point, a publicly traded closed-end investment company.
The site is expected to deliver around 500 megawatts of capacity by late 2026, roughly equivalent to powering 500,000 homes, with potential expansion to 7.7 gigawatts. Its location is near major gas pipelines operated by companies including Enterprise Products Partners, Energy Transfer and Atmos Energy, allowing the project to rely on on-site gas turbines.
Related: David Sacks’ 130-day term as Trump’s crypto and AI czar has ended
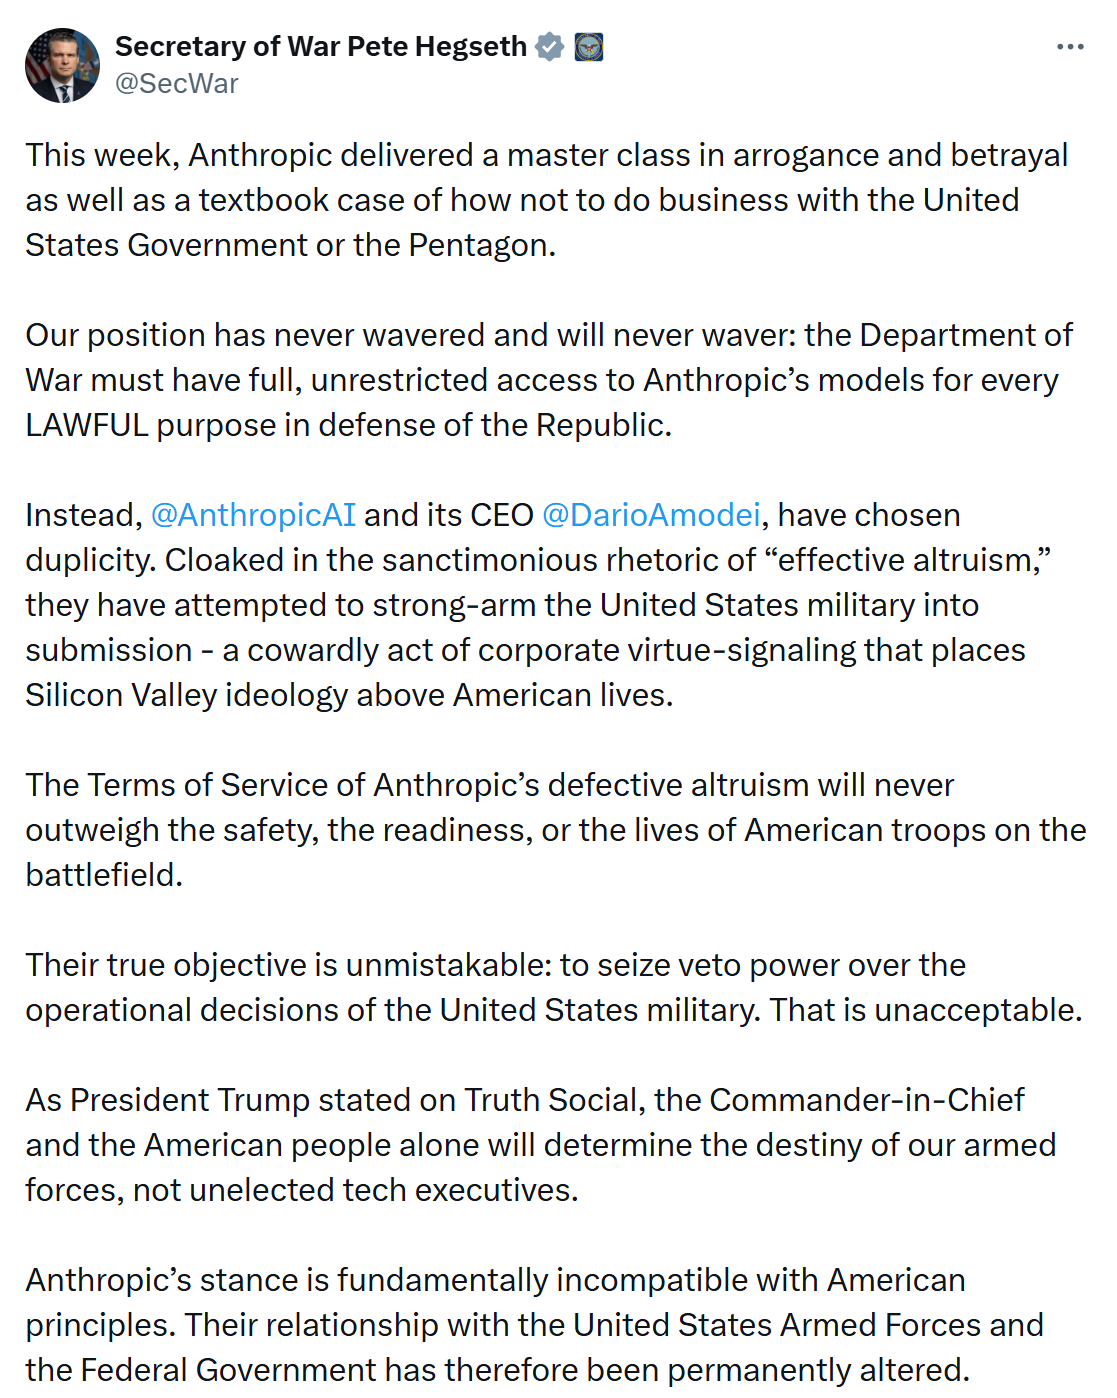
Judge blocks Pentagon ban on Anthropic
On Thursday, a US federal judge in San Francisco temporarily blocked the Pentagon from labeling Anthropic a national security risk and halting government use of its AI tools. Judge Rita Lin granted a preliminary injunction, pausing a directive backed by President Donald Trump that sought to cut off federal use of Anthropic’s chatbot, Claude.
The ruling came in a lawsuit filed by Anthropic, which argued that Defense Secretary Pete Hegseth overstepped his authority by designating the company a supply chain risk. The judge described the government’s actions as “arbitrary” and warned against branding a US company as a threat without clear legal basis.
The dispute followed a breakdown in negotiations between Anthropic and the Pentagon over the military use of its AI. The company resisted allowing its models to be used for lethal autonomous weapons or mass surveillance, leading to a broader standoff with the administration.

In her decision, Lin said the government may have retaliated against Anthropic for its public stance, calling the measures a likely violation of First Amendment protections.
Related: CFTC Chair Selig says blockchain could help verify AI-generated content
US military used Anthropic AI in Iran strike
As Cointelegraph reported, US military units reportedly used Anthropic’s Claude AI model during a major airstrike on Iran, even after the ban order by Trump. Military commands, including US Central Command (CENTCOM) in the Middle East, reportedly used the AI model for operational support
Magazine: Bitcoin may take 7 years to upgrade to post-quantum — BIP-360 co-author
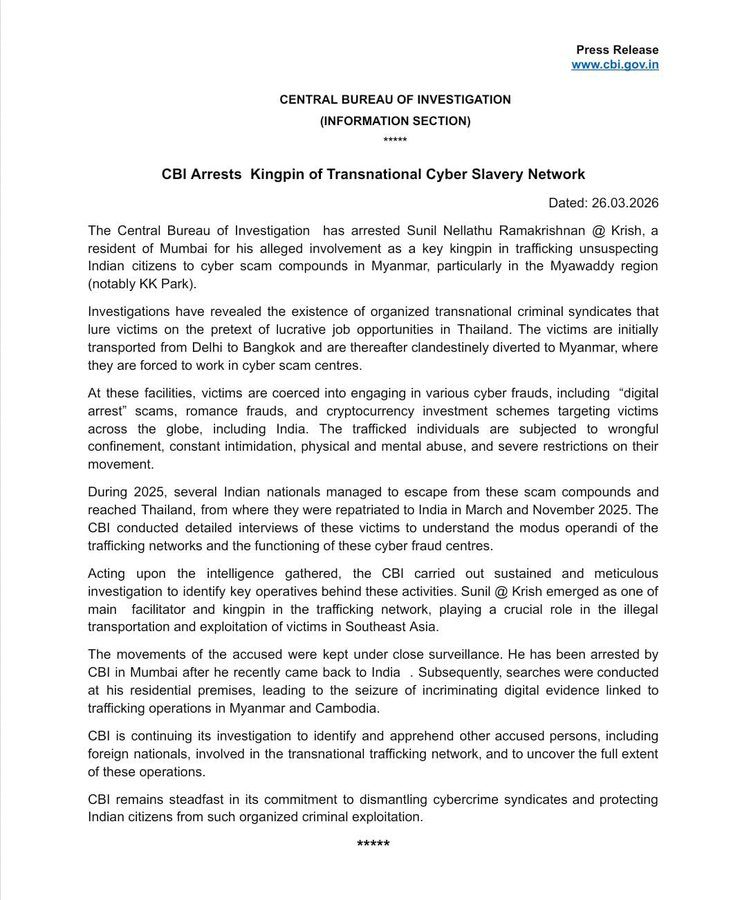
India Central Bureau of Investigation has arrested a Mumbai-based suspect it identifies as a key trafficking kingpin who funneled Indian nationals into crypto fraud compounds in Myanmar’s Myawaddy region, a cross-border enforcement action that pulls together intelligence threads from Thailand, Myanmar, and Cambodia.
The operation marks one of India’s most operationally specific strikes yet against the Southeast Asian scam compound ecosystem.
For crypto exchanges and compliance teams, the arrest is a direct signal: Indian regulators are actively tracing the human infrastructure behind pig butchering and digital arrest scams — and the financial rails those operations run on are next.
- Enforcement Action: The CBI arrested Sunil Nellathu Ramakrishnan, also known as Krish, after he returned to India, seizing digital evidence from his Mumbai residence linking him to trafficking networks in Myanmar and Cambodia.
- Suspect Profile: Ramakrishnan allegedly routed victims from Delhi to Bangkok under fake job offers before diverting them to KK Park in Myawaddy, where they were forced to run crypto investment scams, romance frauds, and digital arrest schemes.
- Regulatory Signal: The arrest — built on victim testimony from repatriations in March and November 2025 — shows Indian federal agencies operationalizing intelligence from trafficking survivors into actionable enforcement against financial crime networks.
Discover: The best crypto presales gaining institutional momentum right now
A Mumbai Manhunt: How the CBI Built the Case
The CBI identified Ramakrishnan as a main facilitator through sustained surveillance that tracked his return to India, following detailed accounts from Indian nationals who escaped KK Park.
Those victims were repatriated from Thailand in March and November 2025, and their interviews directly produced the intelligence that named him.

The operational model Ramakrishnan allegedly ran was precise. Victims were recruited in Delhi with promises of legitimate employment in Thailand, transported to Bangkok, then diverted into Myanmar’s Myawaddy region, a corridor that ethnic armed groups turned into a structured cybercrime hub after seizing control from the Myanmar junta in 2024.
Once inside KK Park, victims faced wrongful confinement, physical abuse, and forced participation in crypto investment scams and romance fraud operations targeting victims globally, including in India.
The CBI said searches at Ramakrishnan’s Mumbai residence produced incriminating digital evidence tying him to operations across both Myanmar and Cambodia, confirming the network extends beyond a single compound or geography.
The agency stated directly that he served as a “key kingpin in trafficking unsuspecting Indian citizens to cyber scam compounds in Myanmar,” and that it continues to pursue other accused individuals, including foreign nationals.
That matters because the evidentiary trail is now documented and cross-border. This is not an arrest on circumstantial grounds; it is a case built from survivor testimony, digital forensics, and international repatriation coordination.
The investigative architecture that produced this arrest is replicable against other nodes in the same network. Crypto-enabled fraud infrastructure operating across Southeast Asia should read this as a proof of concept, not an isolated action.
Discover: The best crypto to diversify your portfolio with
The post India Arrests Suspect Linked to Myanmar Crypto Scam Compounds appeared first on Cryptonews.

Tether just took a major step toward transparency by hiring KPMG and PwC to audit its finances, a first for the world’s biggest stablecoin. With tighter regulations coming, many investors are shifting their interest toward AI crypto coins that offer more growth potential.
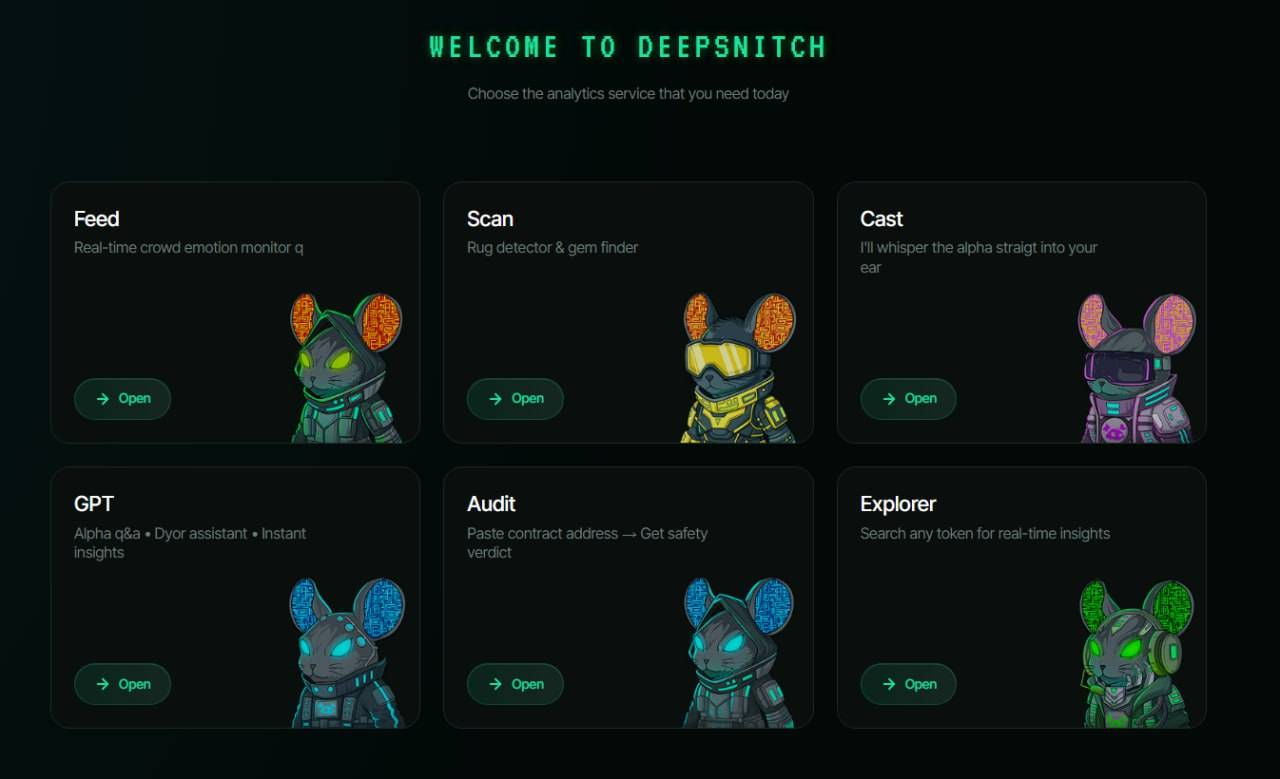
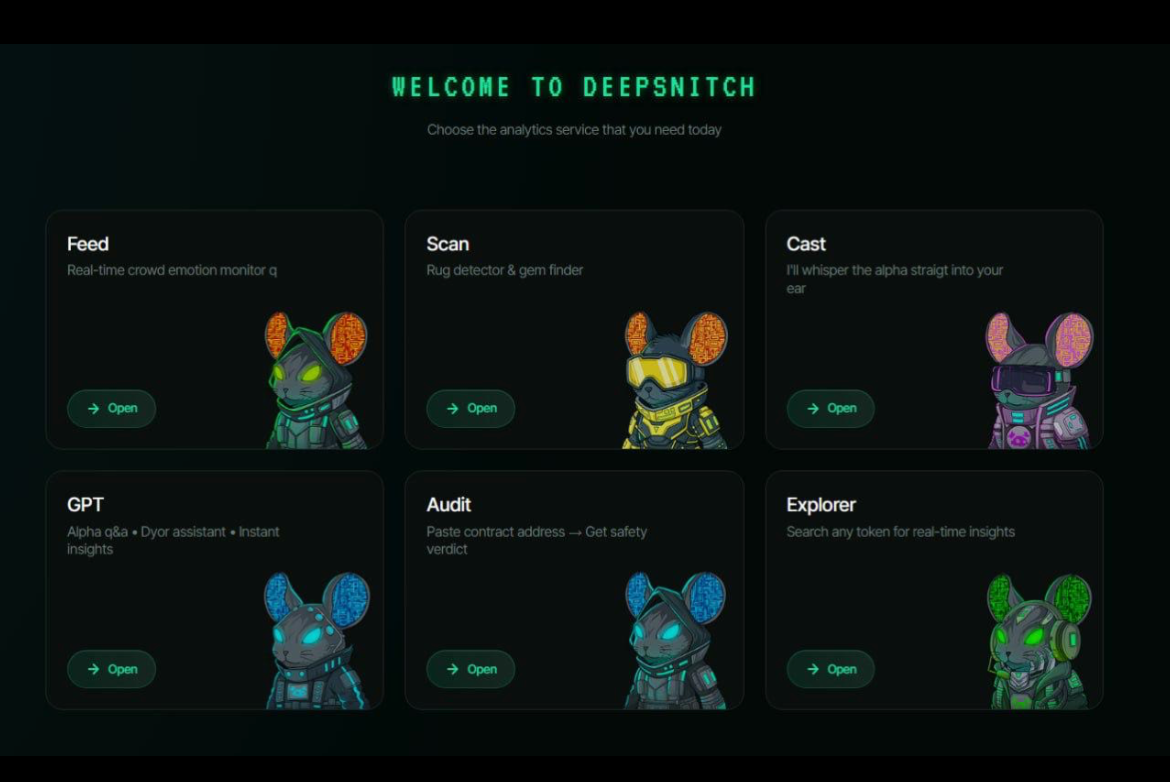
DeepSnitch AI has now raised over $2.6 million, with its Stage 8 presale price at $0.04669. It is better than most projects in the crypto market because it protects you from scams and is your smart trading assistant.
Here’s why you need to make a fast decision and join the presale now before it ends on March 31st.

Tether prepares for strict federal compliance
The Financial Times recently confirmed that Tether formally engaged KPMG for its inaugural financial statement audit and brought in PwC to prepare its internal systems. This massive mandate follows years of relying solely on periodic reserve attestations from BDO Italia.
This push for transparency comes as Tether weighs a major equity raise and expansion under the new federal GENIUS Act framework. With $185 billion in circulation, heavy regulatory compliance completely suffocates the explosive volatility that retail participants desperately need.
The best AI crypto coins in the market
DeepSnitch AI has established itself firmly among the top AI crypto coins.
DeepSnitch AI: This is your chance to make $1 million from this presale
DeepSnitch AI watches over your crypto transactions in real time and cuts off any suspicious activity immediately. That kind of hands-on protection is what separates it from most AI crypto coins that don’t offer much beyond a concept.
But the presale is ending very soon, and there are a few days left to take action. It ends at 11 AM UTC, March 31st, and then the listing on Uniswap is scheduled at 12 pm UTC.
If you want to make massive profits in this cycle, you can make a $10,000 investment before the presale ends. At the current presale price of $0.04669, this gets you about 214,178 DSNT tokens. Since the project is still small and early, a 100x surge to $4.67 per token is a realistic target. At that price, your $10,000 turns into roughly $1 million.
That’s why you need to get in early on a project with real utility. While other AI crypto coins are still trying to prove their value, DeepSnitch AI already has a clear purpose, and the numbers back it up.
BitQuant price prediction
BitQuant recently recorded a 933% increase in 24-hour trading volume as of March 27th, pushing its daily activity past $1.3 million. Within the same period, the RSI remains trapped within a neutral 30-70 range, indicating a completely stagnant price trend that is expected to persist.
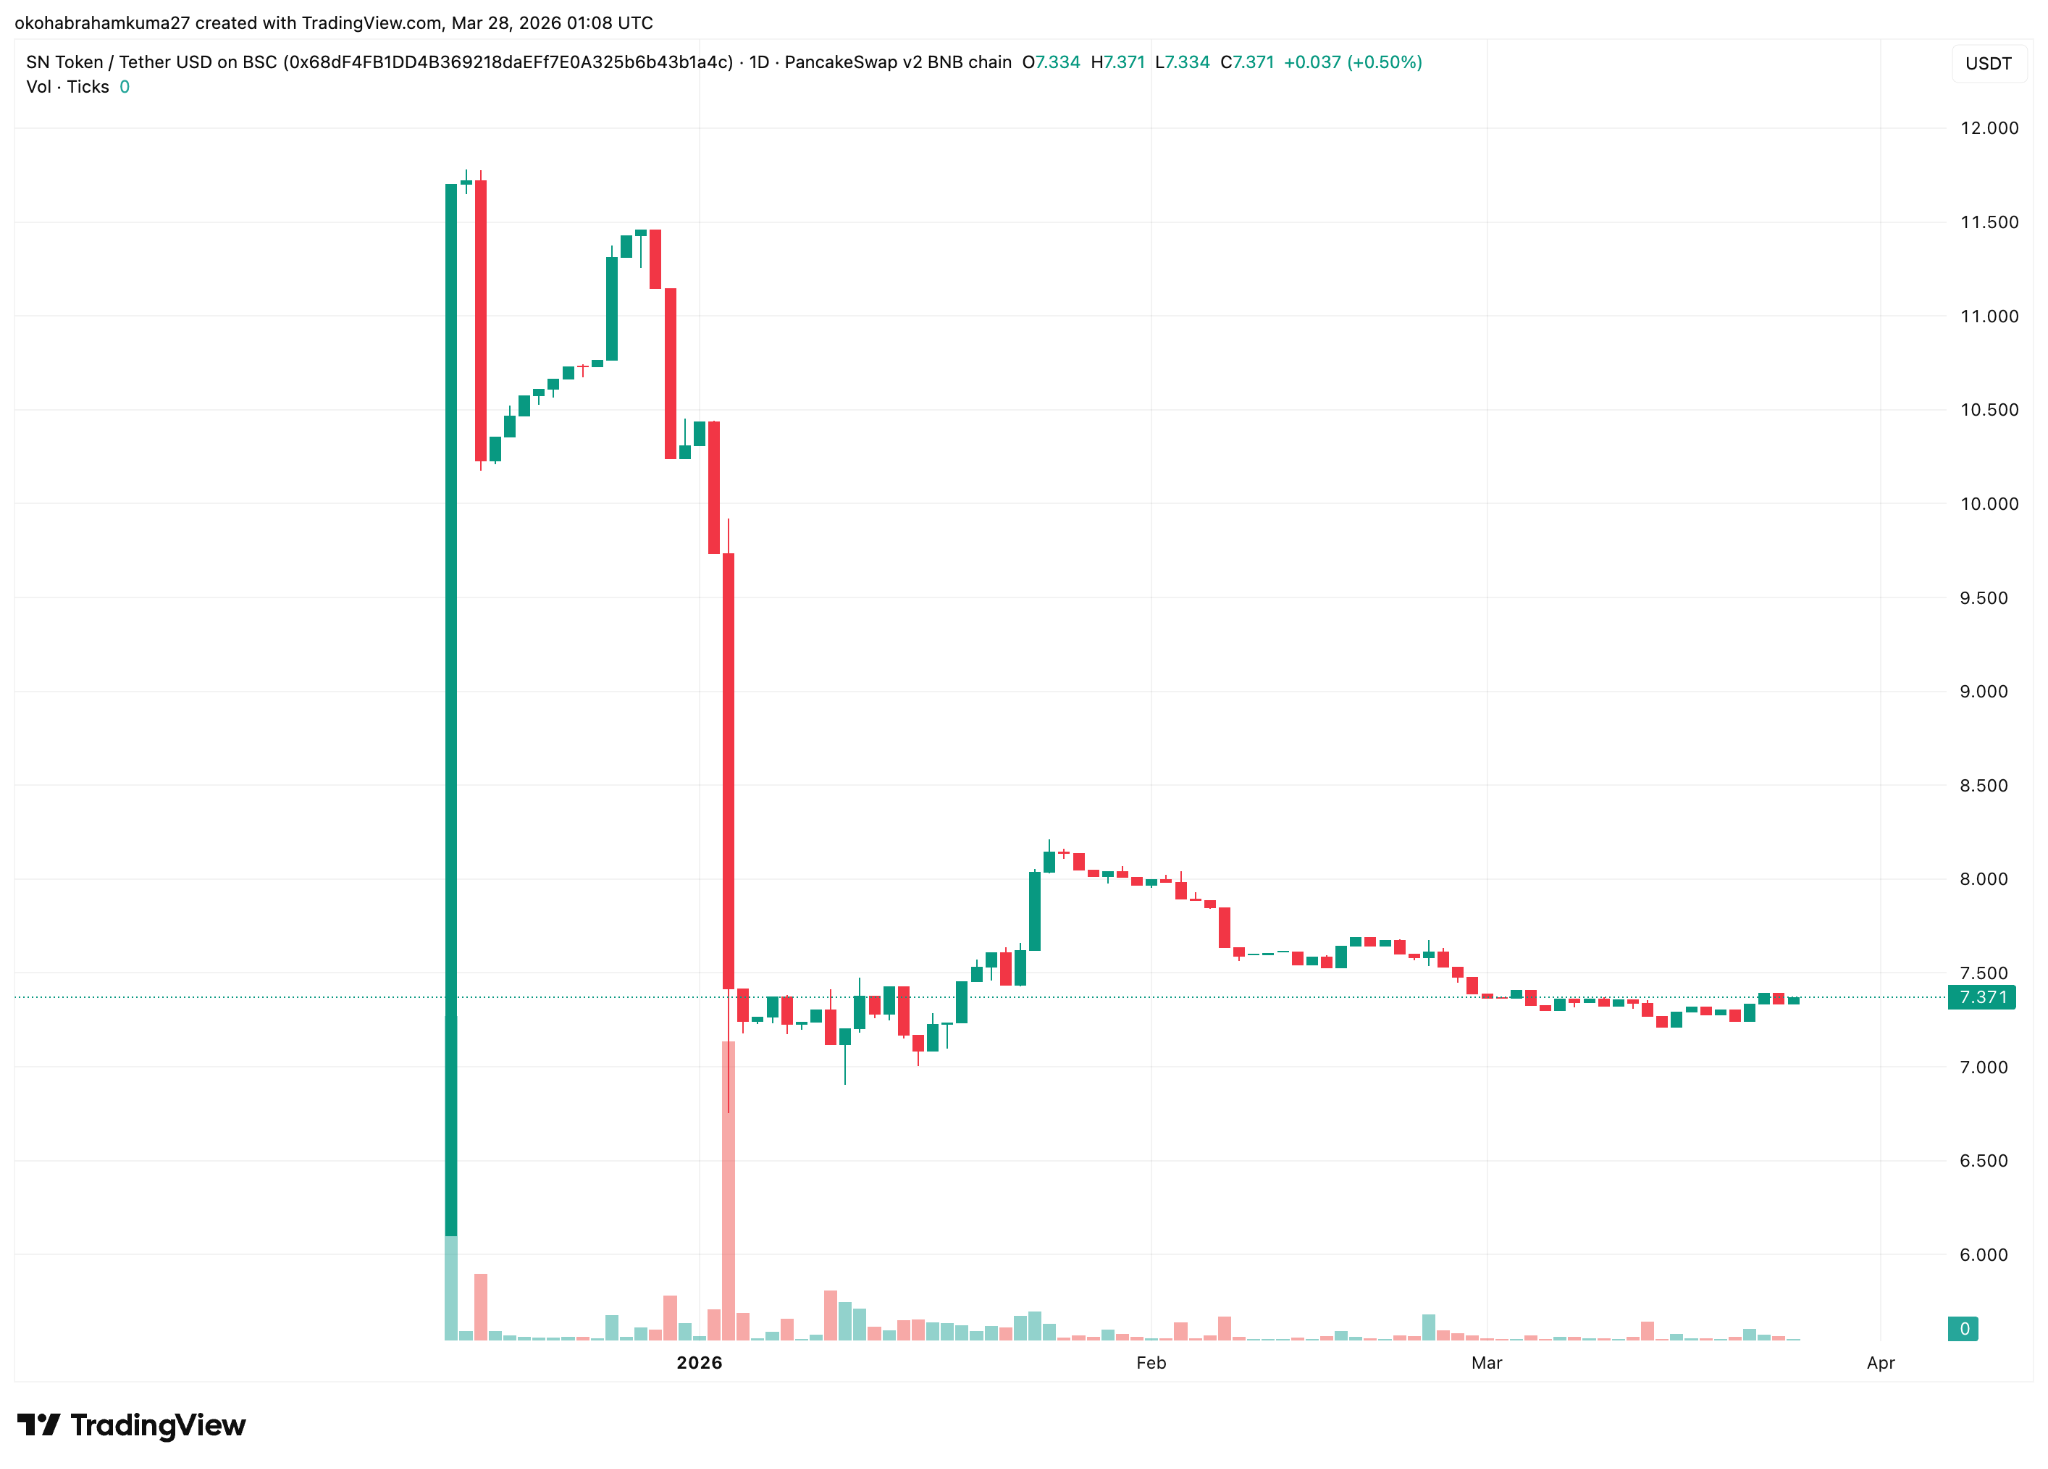
Price predictions for this token estimate that the price will only move from $8.02 in 2026 to $9.75 by the year 2030. Waiting four years to secure a small 20% gain is a highly inefficient capital allocation strategy. You must prioritize high-potential AI crypto coins like DeepSnitch AI to secure explosive multipliers.
NEAR Protocol price prediction
NEAR Protocol currently trades near $1.19 as of March 27th and is within an extreme fear index rating of 13. The technical analysis reveals a completely bearish market sentiment accompanied by a high volatility rate of 7.30%.
Price projections for this AI crypto token predict a devastating 21% decline by the end of 2026, dragging the price down to $0.9337. The long-term projections become even worse over time, expecting a 47% collapse by the year 2030.
Final verdict
Reviewing the potential of DeepSnitch AI confirms that you must enter immediately to secure your position among the top AI crypto coins.
By entering the promo code DSNTVIP150 during checkout, you can even earn a massive 150% bonus. People are joining before the presale ends on March 31st.
Visit the official DeepSnitch AI website, join Telegram, and follow on X for more updates.

FAQs
Which of the top AI crypto projects has big potential?
DeepSnitch AI has the highest potential among many top AI crypto projects because it is starting small but with a tangible utility.
What are the best AI crypto coins?
Among the best AI crypto coins, many investors say DeepSnitch AI is the number one, especially with the presale coming to an end.
What is the best AI crypto token?
The best AI crypto token might be DeepSnitch AI, as it has the potential to deliver over 100x ROI.
Disclaimer: This is a Press Release provided by a third party who is responsible for the content. Please conduct your own research before taking any action based on the content.


Pi Network has started its second migration phase with the required Protocol 21 upgrade. The update sets an April 6 deadline for mainnet node operators and opens the path toward later upgrades that aim to add smart contracts and DeFi tools.
Summary
- Pi Network requires mainnet nodes to upgrade to Protocol 21.2 before the April 6 deadline.
- The roadmap schedules Protocol 22.1 for April and smart contract features for the May rollout.
- Pi traded near $0.174 as RSI and MACD signaled weak momentum and sellers still controlled.
The move also comes as Pi’s token trades near $0.174, far below its all-time high. At the same time, chart indicators show weak momentum as the market waits for the next stage of network changes.
Pi Network has moved from Protocol 20.2 to version 21.2 as part of its second migration phase. The Pi Core Team said all mainnet node operators must complete the upgrade before April 6 to remain connected to the network.
The update focuses on network stability and better node efficiency. It aims to help the system handle heavier traffic while keeping nodes synchronized across the mainnet.
The team warned that nodes that miss the April 6 deadline may lose network connection. That notice places direct pressure on node operators to update their software on time and avoid disruption.
Pi Network framed Protocol 21 as a base layer for future features rather than a full feature release. While new tools will arrive in stages, the current step prepares the network for broader functionality in later protocol versions.
According to the roadmap shared by the Pi team, Protocol 22.1 is scheduled for April 22. Protocol 23.0 is expected to follow on May 18 as the network moves toward smart contract support.
The roadmap also lists features tied to that transition, including a Pi DEX, on-chain liquidity tools, and broader support for decentralized applications. The stated goal is to improve transaction flow and expand network use cases for its user base.
Pi price holds weak tone as traders track indicators
Pi coin traded around $0.174 at the time of reporting, about 78% below its all-time high. That price level reflects a market that remains cautious even as the network moves ahead with technical upgrades.
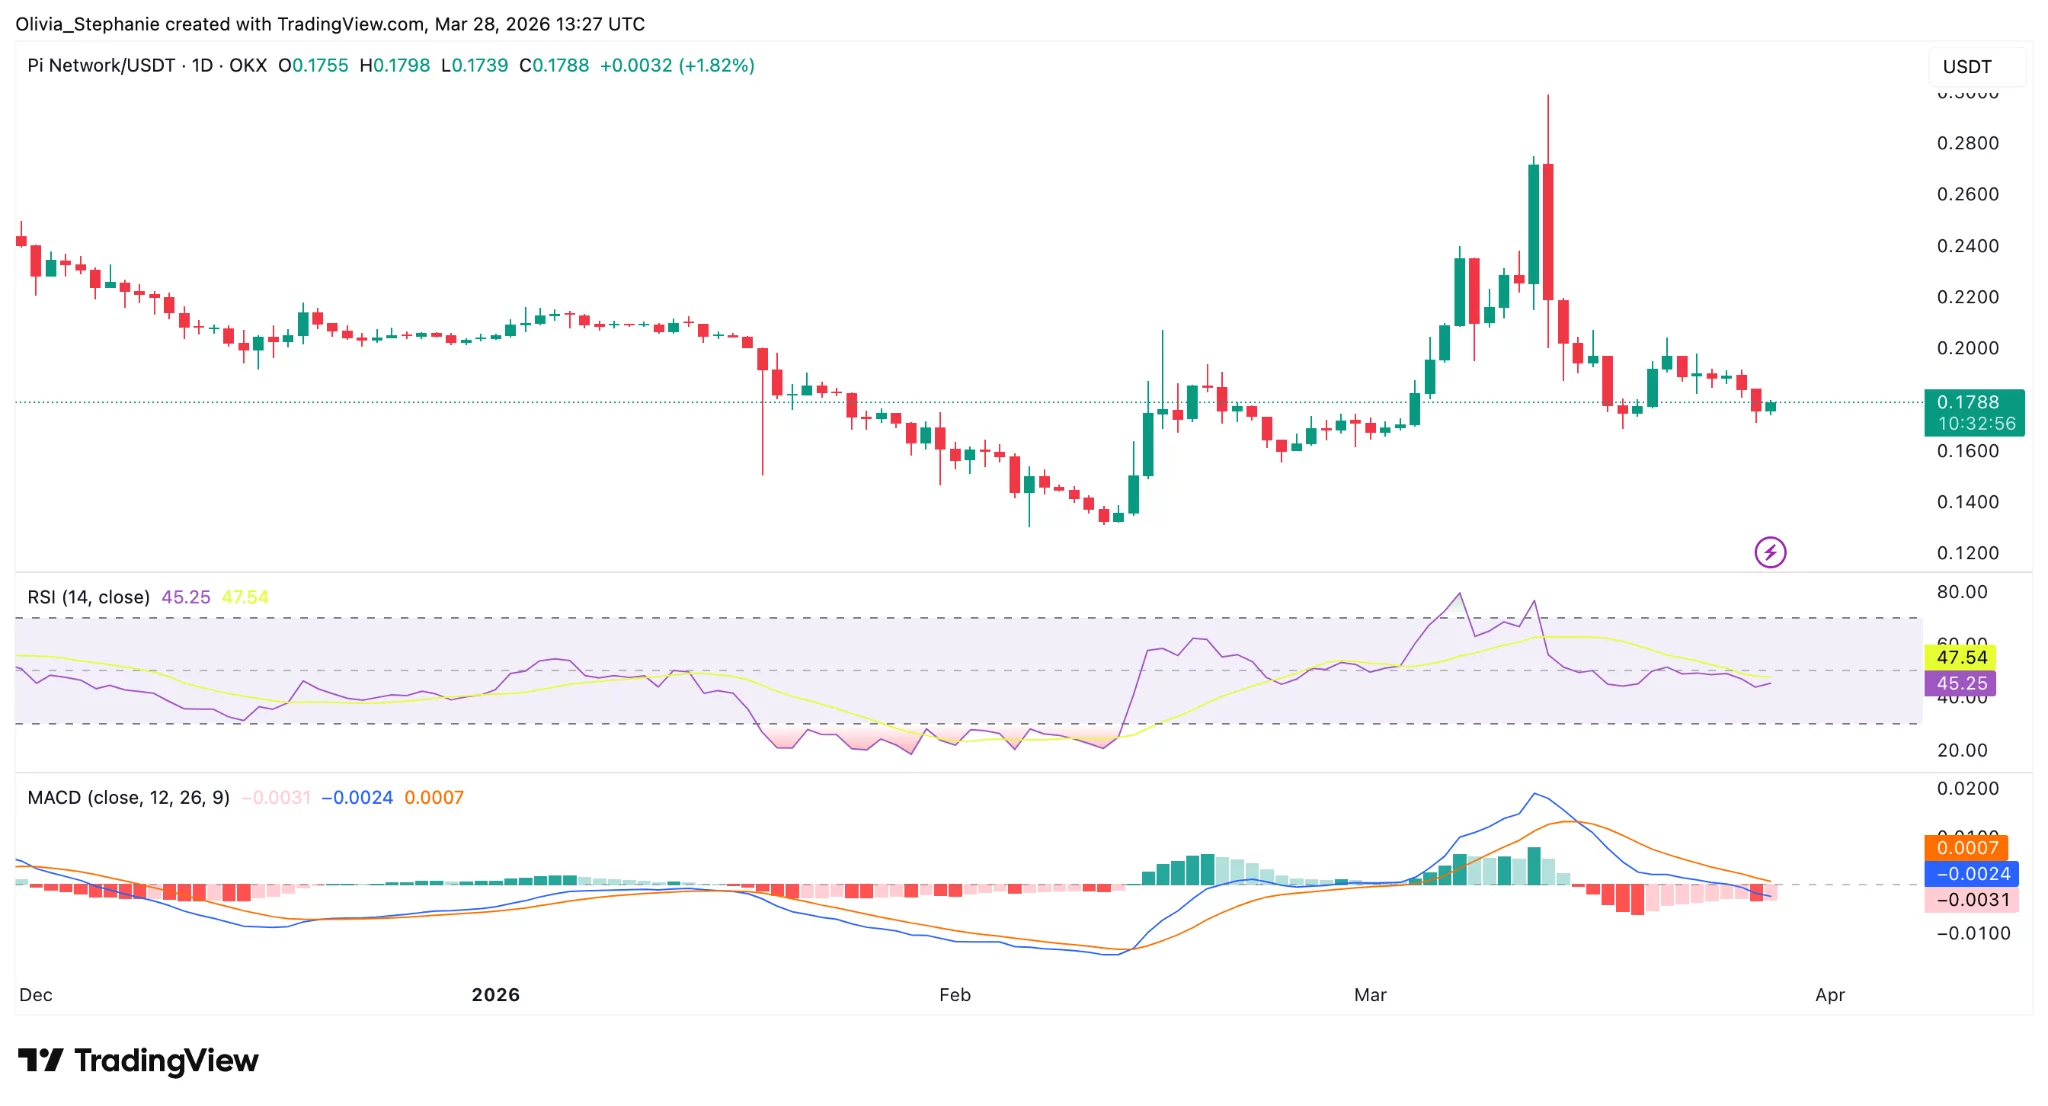
Daily chart indicators showed a soft bearish setup. The RSI stood at 45.29, below both the neutral 50 mark and its moving average of 47.54, which pointed to weak momentum without oversold conditions.
The MACD line remained below the signal line, while the negative histogram showed that sellers still held control, though downside pressure had started to ease.

Twenty One Capital, led by Jack Mallers, has emerged as the second-largest publicly traded Bitcoin treasury, overtaking competitors after MARA reduced its holdings.
While the BTC leaderboard is being reshaped, investors are hell-bent on finding the next crypto to explode, with DeepSnitch AI (DSNT) stealing the spotlight.
So far, the project has proven to be highly profitable among other altcoins set to explode, raising over $2.6 million and up more than 220% to $0.04669.
Already tagged the next 100x crypto, there is optimism among investors about a potential 1000x rally as its deadline draws near.

Twenty One Capital rises to second-largest public Bitcoin holder after major MARA sell-off
Twenty One Capital, led by Jack Mallers, has become the second-largest publicly traded Bitcoin treasury firm. This comes after MARA Holdings offloaded a substantial portion of its Bitcoin reserves, reshaping the leaderboard among corporate BTC holders. The newly established treasury firm now controls 43,514 BTC.
Meanwhile, MARA reportedly sold around 15,133 BTC, worth $1.1 billion, throughout March 2026. Behind Twenty One Capital, Metaplanet now stands as another major player, holding an estimated 35,100 BTC.
Next crypto to explode: DeepSnitch AI presale final week fuels 1000x projections as investors grow optimistic
Since DeepSnitch AI entered its final week, the project has taken over headlines. No other presale is drawing investors like this. With the project already being dubbed the next crypto to explode, the rush is only growing.
With DeepSnitch AI’s utility, traders have been able to rise above volatility and navigate the market with confidence. They can identify and avoid scams, scan for promising opportunities, and get a complete breakdown of any token’s history, all from one streamlined dashboard.
That kind of utility is rare in crypto presales. But DeepSnitch AI isn’t just a presale; it’s becoming the go-to tool for traders. That shift fuels massive adoption, which in turn drives significant price surges and long-term growth.
To start enjoying these benefits before the token hits public trading, now is the time to join. Once the presale ends, DeepSnitch AI will list on Uniswap, with other exchanges likely to follow.
If you’re aiming for a potential 1000x boost to your portfolio, this is the last chance.
Monero records 4% monthly decline as volatility hits the altcoin market
Monero saw a pullback in March amid bearish conditions across altcoins. On March 2, XMR traded at $352, but by March 26, it had fallen to $324, a 4% decline over the period.
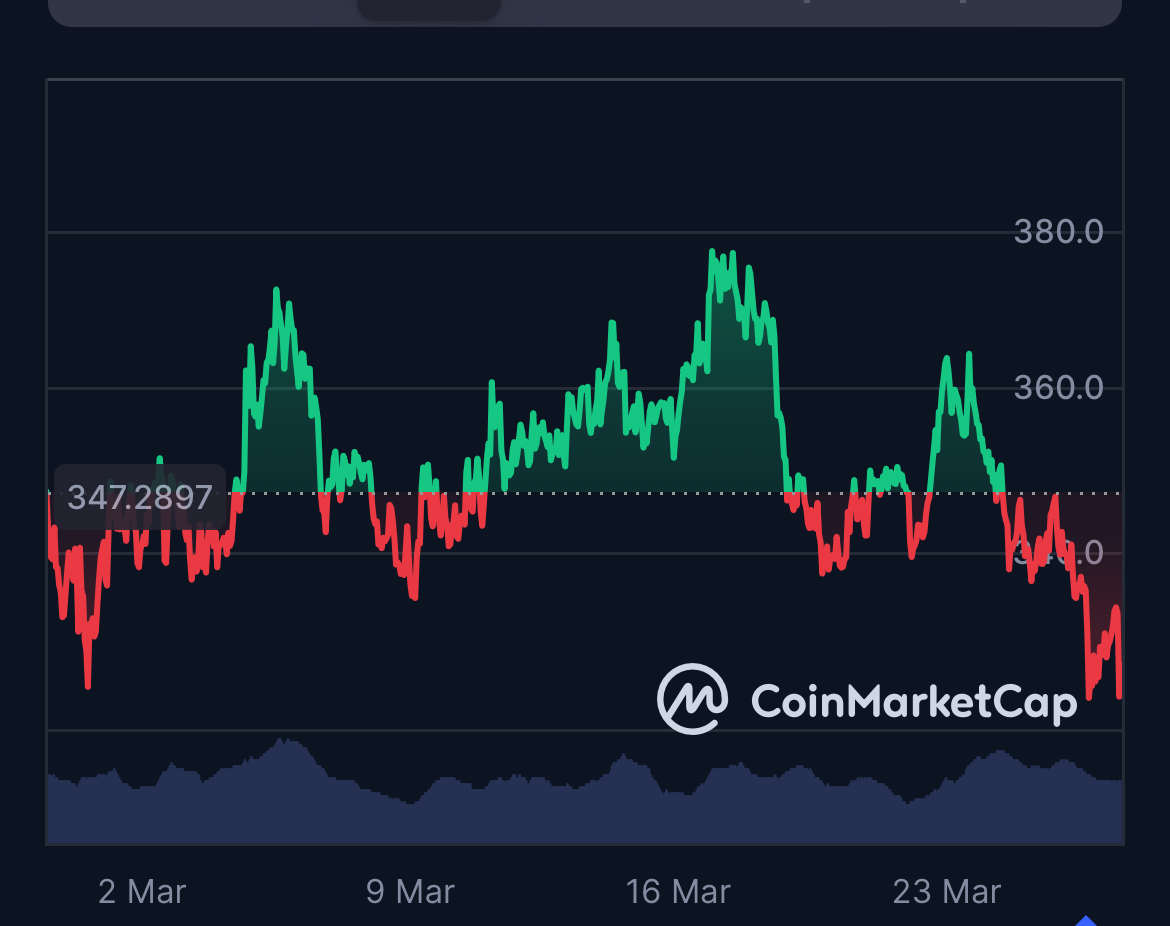
This decline stems from investors rotating out of privacy assets and into more stable DeFi and AI options. However, while Monero is not the top name on the next crypto to explode list, it could see a recovery if the market’s focus shifts back to privacy.
XRP struggles below key levels as $2 breakout hopes face delay
XRP has dropped in price over the last few weeks, with a $2 target taking much longer to reach. The token was $1.45 on March 2, but by March 27, it had slipped to $1.33.
Recent market data show XRP hovering near $1.35 after repeated sell-offs, a level it has been trying to break above for some time.
Conclusion
The DeepSnitch AI presale has taken over the headlines, even amid market volatility. With only a few days to go, this is the only window left to enjoy the exponential gains of what could be the next crypto to explode.
DeepSnitch AI also offers amazing bonuses as a presale incentive for investors. For instance, a $5,000 buy would give 107,090 DSNT tokens. When the 50% bonus code (DSNTVIP50) is applied, the total rises to 160,635 DSNT tokens.
To join the next crypto to explode, visit the DeepSnitch AI website and follow them on X and Telegram for updates.
FAQs
Why is DeepSnitch AI recognized as the next crypto to explode?
DeepSnitch AI is projected as the next crypto to explode because of its huge growth potential and impressive utility. This projection is also fueled by the massive buzz around its March 31 presale deadline.
Can XRP hit $5 this cycle?
The possibility of XRP hitting $5 is not far-fetched, but it depends on market sentiment moving forward. However, instead of living in uncertainty, many are already migrating to DeepSnitch AI for high price action.
What happens after the DeepSnitch AI presale?
After the DeepSnitch AI presale, the token would begin trading on Uniswap. Also, investors who staked and participated in the bonus offers would have seven days to claim bonuses and tokens.
Disclaimer: This is a Press Release provided by a third party who is responsible for the content. Please conduct your own research before taking any action based on the content.
Crypto World
Where Is Bitcoin’s Bottom After a 53% Decline? On-Chain Data and Historical Cycles Have the Answer

TLDR:
- Bitcoin has dropped 53% from its October 2025 peak, trading near $66,000 as of late March 2026.
- Historical bear cycles saw drawdowns of 77–84%, placing the current 53% decline short of prior lows.
- New whale cost basis at $82,800 creates heavy overhead resistance, making sustained recovery structurally difficult.
- The macro support floor sits at $54,300, with a key cluster between $55,900 and $58,900 as the bottom zone.
Bitcoin is down 53% from its peak, raising urgent questions about cycle positioning. As of late March 2026, BTC trades near $66,000, having fallen sharply from its October 2025 high.
On-chain data, whale cost basis levels, and historical drawdown patterns now form the basis of serious cycle analysis.
The evidence points to a market still navigating overhead resistance, with macro support sitting well below current prices.
Historical Cycles Place the 53% Drop in Context
A 53% decline from peak sounds severe, but history tells a more measured story. The 2017–18 bear market saw Bitcoin drop 84% from its high.
The 2021–22 cycle produced a 77% drawdown before a floor formed. By those standards, the current 53% correction has not yet reached the depths that prior cycles demanded.
That context does not rule out further downside. Historically, the 40–70% drawdown range has remained active deep into bear phases.
A move toward the $58,000–$55,000 zone would push the drawdown closer to 55–56%, which still falls within the historical range without triggering alarm. Markets rarely bottom before the majority of participants exhaust their confidence.
On-chain analyst Burak Kesmeci noted that key whale cost basis levels tell a clear structural story. New whales, defined as holders with coins younger than 155 days, carry a cost basis of $82,800.
With BTC near $66,000, this group sits in significant unrealized loss. Recovery becomes structurally difficult when a major holder cohort remains underwater at levels far above current price.
Key Levels That Will Determine Where the Bottom Forms
The Short-Term Holder cost map as of March 26 confirms the overhead picture. The STH Realized Price overall stands at $86,900.
The 1M–3M cohort sits at $82,600, the 3M–6M cohort at $96,000, and the 365-day SMA at $97,700. Every major cost cluster remains well above current price, functioning as resistance rather than support.
The nearest overhead level to watch is the STH 1W–1M cost basis at $70,100. A weekly close above that level would mark the first real structural progress.
However, it remains far from resolving the broader wall of supply sitting between $82,600 and $97,700. Without a close above $86,900, those bands stay active as resistance.
On the downside, two levels form a meaningful support cluster. The Binance User Deposit Address sits at $58,900, and Miner Whale cost basis falls at $55,900.
Below those, the macro support floor based on the Realized Price rests at $54,300. That $54,000–$58,000 range represents the most credible bottoming zone if selling pressure persists through current levels.

Bluey at Disneyland: What to Know and What Else Is Coming to Disney Parks in 2026 and Beyond
West Lothian school’s uniform shop hands over cheques to charities

WTO members bypass opposition to introduce world’s first baseline digital trade rules


-
 NewsBeat3 days ago
Manchester United reach agreement with Casemiro over contract clause amid transfer speculation
-

 News Videos3 days ago
Parliament publishes latest register of MPs’ financial interests
-

 Crypto World7 days ago
Best Crypto to Buy Now: Strategy Just Spent $1.57 Billion on Bitcoin During Fear While Early Investors Quietly Enter Pepeto for 150x Potential
-

 Crypto World7 days ago
Bitcoin Price News: Bhutan Sells $72 Million in BTC Under Fiscal Pressure, but the Smart Money Entering Pepeto Sees What the Market Does Not
-

 Sports5 days ago
Remo Stars and Kano Pillars Strengthen Survival Hopes in NPFL
-

 Sports5 days ago
Gary Kirsten Accuses Pakistan Cricket Board Of ‘Interference’, Mohsin Naqvi Responds
-

 Business6 days ago
No Winner in March 21 Drawing as Prize Rolls to $133 Million for Next
-

 Tech6 days ago
Give Your Phone a Huge (and Free) Upgrade by Switching to Another Keyboard
-

 Tech6 days ago
AI enters the chat: New Seattle dating app relies on tech to facilitate meaningful human connections
-

 News Videos5 days ago
Ch 9 Financial Management Part 1 | Detailed One Shot | Class 12 Business Studies Boards 2026
-

 Tech7 days ago
Today’s NYT Connections Hints, Answers for March 22 #1015
-

 Business2 days ago
Instagram, YouTube Found Responsible for Teen’s Mental Health Struggle in Historic Ruling
-

 Business6 days ago
Will Duke Basketball Win It All? Duke Basketball Enters Second Round as Third Favorite to Claim NCAA Title
-

 Sports5 days ago
2026 Kentucky Derby horses, odds, futures, preview, date: Expert who hit 12 Derby-Oaks Doubles enters picks
-

 NewsBeat17 hours ago
The Story hosts event on Durham’s historic registers
-
 Entertainment5 days ago
Cynthia Bailey Dishes on ‘RHOA’ Season 17, Discusses Kandi
-

 Tech5 days ago
Samsung will soon let you control smart home devices from your car’s dashboard
-
 NewsBeat6 days ago
Update on Wisbech river crash as search for teenage boy enters fifth day
-
 NewsBeat3 days ago
Tesco is selling new Cadbury Dairy Milk bar and people can’t wait to try it
-

 Tech7 days ago
SteamOS update adds support for Steam Machine and other non-Valve hardware
You must be logged in to post a comment Login