Crypto World
Intel Analysis: Attempt to Hold Above the Profile Following a False Trend Breakout

On 8 September, Northland Securities upgraded Intel to Outperform with a price target of $120, citing a shortage of server processors, progress in the company’s business turnaround and potential benefits from its involvement in the Terafab project with Tesla and SpaceX. On the same day, reports emerged that Intel was planning to raise processor prices by around 10% from October amid rising costs and limited supply across the supply chain. The combination of higher prices and a positive rating revision is helping to sustain investor interest in Intel shares against the backdrop of strong performance across the semiconductor sector.
Intel Technical Analysis

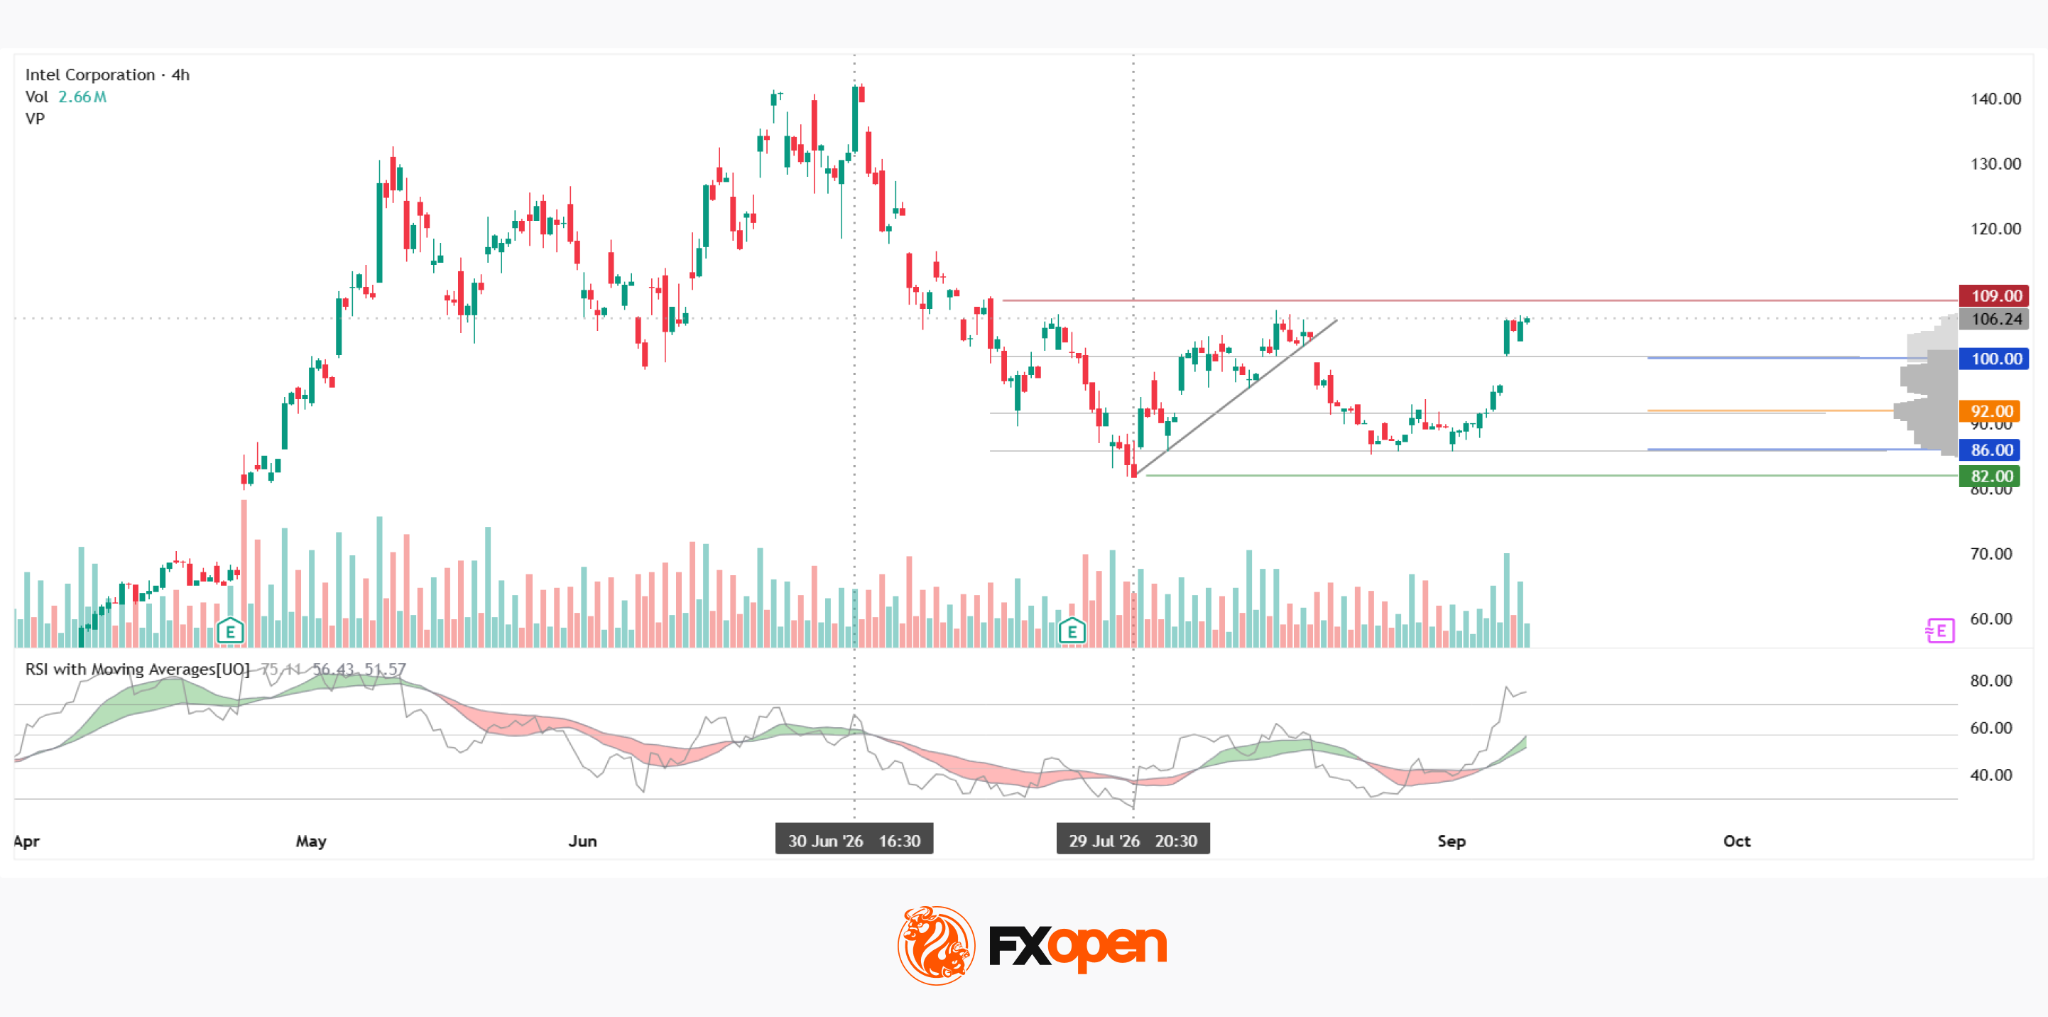
From 30 June to 29 July, a short-term trend formed on the INTC four-hour chart. Following a decline, the market corrected higher, with the rebound forming an ascending trendline. The price subsequently broke below this trendline, but the attempted breakout was not confirmed by the RSI + MAs indicator. As a result, the price reversed direction and quickly moved through the current market profile, breaking above its upper boundary at $100.00 and is now attempting to establish itself above this level.
It is worth noting that the red resistance level at $109.00 is relatively close to the current price, while the RSI + MAs indicator currently stands at 75, 56 and 51. The RSI has already entered overbought territory, while the moving averages have yet to leave the neutral zone, making the current breakout attempt look questionable. If the market produces another false breakout, a return into the market profile could bring several important levels into play, including the Point of Control (POC) at $92.00 and the lower boundary of the profile at $86.00. Below this level, and relatively close to it, lies the green support level around $82.00.
Key Takeaways
The RSI being in overbought territory while the moving averages remain in the neutral zone casts doubt on a potential breakout of the profile. The short distance to the red resistance level could also strengthen the current resistance zone. Investor reaction to the planned price increase in October could provide an additional factor influencing the stock’s price action.
Buy and sell stocks of the world’s biggest publicly-listed companies with CFDs on FXOpen’s trading platform. Open your FXOpen account now or learn more about trading share CFDs with FXOpen.
This article represents the opinion of the Companies operating under the FXOpen brand only. It is not to be construed as an offer, solicitation, or recommendation with respect to products and services provided by the Companies operating under the FXOpen brand, nor is it to be considered financial advice.
You must be logged in to post a comment Login