
Crypto World
Investors need to brace for higher-for-longer interest rates after Middle East conflict shocks oil market


Since the Iran war began, the market narrative has been simple: the oil spike, inflationary impulse and wider market volatility will be temporary and die down once the conflict halts, allowing central banks to grease the economy and markets with easy money, as they have consistently done post-2008.
But there is a counter view that says scars from the Iran war will persist for long in the form of a structurally elevated global inflation floor. This could impact returns across all asset classes, including stocks, crypto and bonds.
The answer to that lies in the biggest takeaway from the Iran war: energy markets are fragile, and major economies are exposed to oil price spikes and energy supply disruptions.
For decades, several countries, including major economies, relied on global energy supply chains, price-driven markets, and comparative advantage. That model worked, but it has now crumbled amid the latest disruption in the Strait of Hormuz, which has led to massive energy shortages across the world, including in major economies like India, Japan and South Korea. If the conflict drags on, eventually countries like China, which have sizeable reserves, could suffer too, including the supposedly energy-independent U.S.
The result: Going forward, every nation is likely to make energy independence and security central to its national security strategy.
According to Energy Market Expert Anas Alhajji, this trend will trigger rapid de-globalisation of energy markets, prioritising control over cost and breeding sticky inflation.
“Once that mindset takes hold, global energy markets will never return to the old model of open, price-driven, largely commercial trade. Instead, capitalist economies—historically reliant on market efficiency, global supply chains, and comparative advantage—will increasingly mirror the Chinese approach: heavy state direction, strategic stockpiling, vertical integration, subsidies for domestic champions, and prioritization of self-reliance/control over pure cost minimization,” he said in an explainer on X.
He added that most nations lack China’s centralized supply chain, industrial base, and decision-making, which could result in slower innovation, fragmented markets, and higher costs.
“The result: higher costs, slower innovation in some areas, fragmented markets, and reduced overall efficiency for Western-style economies, all in the name of ‘security.’ Energy stops being just another commodity; it becomes a geopolitical weapon and a domestic fortress,” he noted.
In other words, the impact of the Iran war goes beyond the short-term oil price volatility.
There are already signs of widespread fallout, affecting everything from fertilisers and food production to industrial production and perhaps even chipmaking and the semiconductor industry, as the disruption in the Hormuz Strait chokes off supplies of helium and sulfur, which are crucial to chipmaking.
On top of that, the UN has already warned of higher food prices worldwide.
Impact on assets
All this means is that central banks may no longer have the room they once had to turn on the liquidity tap quickly to support the economy and asset prices.
From 2008 to 2021, the global consumer price index (CPI) or inflation rate averaged under 3% (briefly rising to 8% in 2022, only to fall back to 3% in 2024), according to data source St. Louis Fed. This allowed central banks, including the Fed, BOJ and others, to pursue ultra-easy monetary policies that set interest rates at or below zero, and pump liquidity via aggressive bond buying or quantitative easing, fueling epic gains across all markets. Bitcoin, for one, went from a single-digit dollar-denominated price in 2011 to $126,000 in October last year.
But with an expected structurally higher inflation floor, that paradigm shifts. Central banks can no longer assume they can always cut rates to drive growth. Liquidity could be more constrained, capping returns across asset classes.
The message is clear: Investors should brace for a world where inflation is sticky, monetary policy is less accommodative, and market volatility is the new normal.


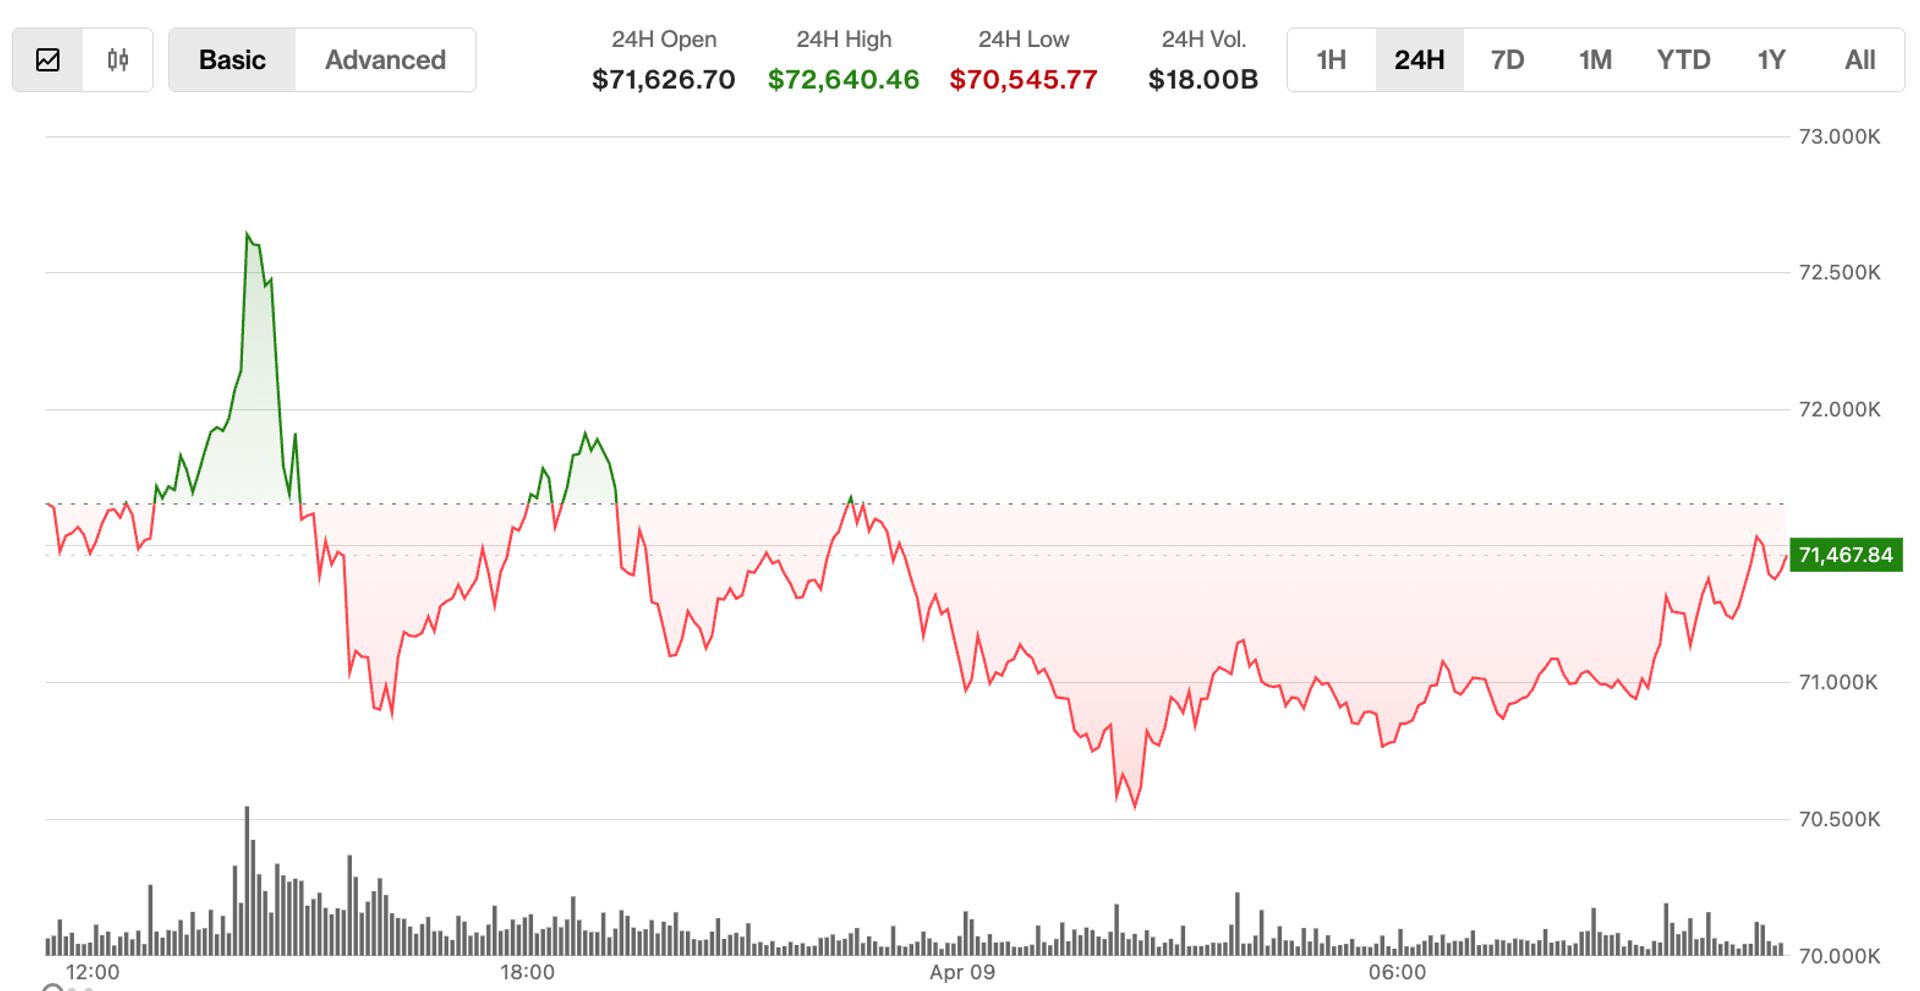
The crypto market remains pinned just below its early-February ceiling, with bitcoin hovering at $71,200 and ether (ETH) trading at $2,185. The sideways crawl comes despite a risk-on boost from the recent US-Iran ceasefire, leaving analysts sharply divided on the next leg.
Bloomberg’s Mike McGlone said this week that BTC needs to reclaim $75,000 or risk a meltdown to $10,000. Fundstrat Tom Lee has taken a contrasting view, claiming that the “bottom is in” on Wednesday, although it’s worth noting that his fund holds $10.4 billion worth of ETH.
BTC is up by around 0.3% since midnight UTC while ETH is flat having outperformed the broader market on Wednesday, and while BTC has posted a modest gain, all eyes remain on whether this range-bound stability is a launchpad or a trap.
Derivatives positioning
- Bitcoin’s futures open interest (OI) has increased to 726,000 BTC, a one-week high, bouncing sharply from 693,000 BTC over the weekend. The tally has increased by over 1% in the past 24 hours, a sign of continued capital inflows despite spot price’s stalled ascent.
- BTC’s 24-hour cumulative volume delta (CVD) remains positive for the second straight day and perpetual funding rates hover just above zero. These datasets, coupled with OI increase, suggests a persistent bias for bullish plays.
- OI in ether, XRP and solana futures has also increased by 1% to 2%. However, CVD and funding rates for these tokens are slightly negative, which suggests growing demand for bearish bets.
- CVD readings for top meme coins like DOGE and SHIB remain negative – a signal some see as constructive for the broader market, as heavy bullish positioning in speculative tokens is often viewed as a sign of excess froth.
- Bitcoin and ether volatility indices continue to decline in a sign of market calm. 10x Research said the market is pricing just 2.5% swing in either direction on the back of Friday’s inflation data.
- On Deribit, BTC and ETH continue to show a mild bias for put options, which offer downside protection, although its much weaker than a week ago. Speaking of flows, the $80,000 bitcoin call has seen the biggest increase in number of open positions in the past 24 hours followed by the $82,000 call.
Token talk
- The altcoin market continued to impress on Thursday with the likes of MANA and AERO rising by 6% apiece, while decentralized finance (DeFi) tokens MORPHO and PENDLE rose by 3.7% and 2.7% respectively since midnight UTC.
- It’s worth noting that MANA’s move comes alongside a 25% increase in open interest, suggesting the move was backed by leverage as opposed to spot buying.
- The CoinDesk Computing Select Index (CPUS) and CoinDesk Smart Contract Platform Select Capped Index (SCPXC) were the best performing benchmarks on Thursday, posting gains between 0.4% and 0.5% while the broader CoinDesk 100 (CD100) is unchanged.
- Traders will be keeping a close on on whether bitcoin can break above $75,000 and establish a level of support, which would likely lead to a period of capital rotation into altcoins, many of which are still oversold following a selloff in February and subsequent period of consolidation.


The United States Treasury Secretary Scott Bessent has urged Congress to pass the CLARITY Act without further delay, as Senate floor time is limited.
Summary
- Scott Bessent has urged Congress to pass the CLARITY Act quickly, warning that limited Senate floor time could stall progress.
- Debate over stablecoin yields has delayed the bill with banks warning of lending risks.
In an op-ed for The Wall Street Journal, Bessent stressed the importance of the legislation, especially as crypto use was rising across the United States. He highlighted that the crypto market had reached $3 trillion and that nearly one in six Americans now hold digital assets.
“To preserve it and rise to the challenge before us, Congress must pass the Clarity Act. Senate floor time is scarce, and now is the time to act,” he wrote.
Since passing in the House of Representatives in July last year, progress around the CLARITY Act has been delayed in the Senate as industry participants and bankers debated over how stablecoin yields should be treated.
Proponents of stablecoin yield argue that without such incentives, there would be reduced user participation and slower innovation. Bankers, meanwhile, are concerned that the practice could draw deposits away from traditional institutions and impact lending capacity.
White House economists have challenged these concerns in a recent report, where they assessed the impact on traditional lending. The economists found that banning yields on stablecoins could result in an $800 million annual welfare loss for users.
On the other hand, banks would see total US bank lending increase by only $2.1 billion, or just 0.02% of the $12 trillion market.
U.S. President Donald Trump has also backed the legislation, warning that delays risk pushing innovation to China and other jurisdictions.
He also accused banks of trying to hold the CLARITY Act “hostage” and undercut what he described as a “powerful Crypto Agenda.”


Disclosure: This article does not represent investment advice. The content and materials featured on this page are for educational purposes only.
Crypto gifting emerges as new trend blending digital assets with real-world experiences.
Summary
- Custom crypto gifts are gaining popularity by turning digital assets into tangible items that build identity and connection
- Personalized physical gifts like mugs, apparel, and coins offer utility, sentiment, and long-term value
- Demand grows for crypto-themed collectibles and wearables as users seek unique, meaningful gift options
In the era of information technology, the world of cryptocurrency is becoming more alluring with its own charm and possibilities. As people exchange and create value in the form of digital assets, the emotional power of crypto gifts is not replaceable.
The fusion of crypto and physical gifts is a sure way to please a gift recipient and make real the connection between the virtual and physical worlds.
Why custom physical gifts work better
Creating a tangible connection to the crypto world
Many of us experience crypto spaces in the virtual, intangible realm of our screens only. Custom physical gifts are a way to bridge that gap by making digital elements tangible. Bitcoin personalized keychains or Ethereum T-shirts, for instance, can help it to build real emotional connections that boost a sense of identity and community.
Personalization and uniqueness
One of the finest benefits of custom physical gifts is the level of personalization, which ensures that someone can give something that meets the personal needs or tastes of the gift recipient. When a gift is personalized, the recipient’s favorite crypto details can be added. Such a present is unique not only in design, but it also shows that someone cares for their loved ones, and the recipient feels truly appreciated and respected.
Practical use and long-term value
Unlike virtual gifts, bespoke physical gifts can be used in daily life. A crypto mug or hat, for instance, is utilitarian and fashionable. Certain products like custom lapel pins and coins can also be collectible and increase in value over time, allowing the owner to have instant use and long-term sentimental and investment value.
Types of custom physical gifts
Custom gifts can be categorized based on purpose and style to better match different recipient needs:
Everyday Practical Items
Mugs
The classic mug is an everyday essential. A custom mug with crypto designs or symbols is functional and thoughtful.
Personalized Keychains
Personalized Keychains are mini space-capable items that can be carried around to show love for crypto and blockchain. They can be made out of metal or plastic, and they can have different shapes. The products can be engraved with crypto symbols and messages, in case someone wants to have a permanent and discreet reminder of the world of crypto.
Stickers
Stickers are versatile, and they can be stuck to laptops, phones, notebooks, and much more. They tend to be popular with younger crypto fans, and are fairly cheap to mass customize, hence really good for community events or promotions.
Wearable and Display Items
Hats
Custom hats like baseball caps or beanies can include embroidered or printed crypto logos and catchphrases. Practical for sun or warmth protection, they also allow us to express ourselves through fashion.
Clothing
Important for everyday life, the likes of T-shirts and hoodies – or jackets – can be personalized with designs and wording. These comfortable and multifaceted pieces allow recipients to take daily life with a touch of crypto culture, or simply appeal to the fashion-savvy.
Socks
While it is niche, custom socks are practical and can even have someone’s crypto token icons, a simple meme, or the recipient’s favorite color.
Cufflinks
Perfect for professionals and detail-oriented receivers, cufflinks may be made of metal with engraved crypto logos, simple blockchain designs, or even a recipient’s initials. They work well with dress clothes while making a subtle statement about crypto interest, fusing usefulness and sophistication.
Collectible and decorative items
Custom lapel pins
Custom lapel pins come with collectible value and can be engraved with the recipient’s name, a wallet address abbreviation, or important dates. Custom lapel pins may be added to articles of clothing or backpacks, or they can be collected in albums or frames as mementos of crypto coin memories.
Custom Coins
Custom Coins make great keepsakes. A coin with crypto-related designs can commemorate notable occasions in the crypto world.
Medals
Ideal for community recognition, event prizes, or individual accomplishments. Custom medals can be engraved with award titles, recipient names, and crypto-themed designs. Together with sophisticated packaging, they recognize accomplishment and build enduring crypto memories.
Neon sign
A Neon sign is a one-off decoration item. A neon sign will perfectly complement any home or office environment. With crypto logos or patterns, or words, neon signs bring a colorful mood that best shows the charm of the crypto world.
How to choose the right crypto gift
Choose Based on Recipient Type
Levels of interest people have in cryptocurrency influences cryptocurrency gifting. Beginners in cryptocurrency can be gifted functional and easy-to-understand items that can be used in everyday life, like mugs or keychains with cryptocurrency logos, which help them to slowly understand the cryptocurrency area and bring it into their everyday lives.
For experienced investors or developers, a collectible or unique token of affection is ideal. These can be custom lapel pins or luxury items that speak to their identity and accomplishments.
Choose based on usage scenario
Take into account the usage environment of the recipient who will be using or wearing the gift. If the recipient is working in an office, they can always be delighted with an office-friendly gift like cryptographically themed notebooks or mugs.
For the one who likes to attend the crypto meetings or clubs, get them items that let them do so more, such as customizable t-shirts, hats, pins, and help them stand out.
If they’re a household fan, choose a gift that doubles as a collector’s item and is household-friendly, like a neon sign for a cozy corner, giving them yet another one of those unique tools they get to play with whenever they transform their own living space.
Choose based on budget
Crypto gift shopping should also consider the budget. Various personalized physical gifts keep changing their prices, be it stickers that cost a few dollars or precious metal commemorative coins that are worth thousands of dollars. For tight budgets, a practical little gift can still be a memorable one; for heftier budgets, luxurious wearable accessories or collectibles can provide a stronger buzz of delight and value.
Conclusion
As the world of crypto keeps on growing, physical custom gifts provide a novel and heartfelt way to show affection and support for the culture surrounding crypto. As they bridge the digital world by catering to personal tastes and providing practical and long-term utility, these gifts are gaining recognition in the crypto community.
Whether as birthday presents, holiday gifts, or collector’s items, these customized crypto gifts work as a connection between the virtual and real worlds, capturing feelings and financial worth. They’re more than just a gift – they’re experiences that bring the crypto universe to life, make it unforgettable, and personal.
Disclosure: This content is provided by a third party. Neither crypto.news nor the author of this article endorses any product mentioned on this page. Users should conduct their own research before taking any action related to the company.


Dubai’s Virtual Assets Regulatory Authority has published a detailed guidance document detailing how token issuers should operate.
Summary
- VARA has published detailed guidance clarifying how virtual assets should be structured, disclosed, and distributed in Dubai.
- The framework defines three issuance categories and assigns clear responsibilities to issuers and licensed intermediaries.
- Stablecoins and asset-referenced tokens now face specific requirements on reserves, disclosures, and investor protections.
Rather than introducing new legislation, the document interprets VARA’s existing Virtual Asset Issuance Rulebook, offering clearer direction on how different types of tokens should be handled in practice.
The update comes as the regulator continues to refine its bespoke framework for digital assets, distancing itself from jurisdictions that rely on traditional securities or payments laws to govern token launches.
Classifications based on risks
At the core of the guidance is a three-part classification system that separates token issuances based on their structure and risk profile.
Category 1 covers fiat-referenced and asset-referenced virtual assets, including stablecoins and RWA-style tokens, while Category 2 applies to issuances that must be distributed through VARA-licensed intermediaries. A third group carves out exempt virtual assets with limited functionality, reducing compliance burdens for simpler use cases.
Each pathway comes with clearly defined responsibilities. In Category 2 issuances, licensed distributors are tasked with conducting due diligence and ensuring ongoing compliance, placing accountability not just on issuers but also on entities involved in distribution. The framework moves away from treating all tokens as uniform products, instead aligning oversight with how each asset functions in the market.
The framework includes specific provisions for stablecoins and asset-referenced tokens, setting expectations around reserve assets, redemption rights, and legal structuring.
Speaking to crypto media, Ruben Bombardi, general counsel at Virtual Assets Regulatory Authority, said the regime offers “greater regulatory clarity,” as many virtual assets do not map neatly onto existing categories.
Bombardi said the framework is designed to support “informed decision-making” by improving how risks and asset characteristics are disclosed to users.
The update builds on a series of recent moves by the regulator to expand its rulebook in line with market activity. Earlier this month, VARA expanded its framework for exchanges to cover crypto derivatives.
Brent crude futures dropped 19.24% on April 8 after the US-Iran ceasefire removed the war premium from oil price in a single session. Then violations, and a loaded threat from Trump, pulled it 8.45% back up.
The whiplash created the widest two-day range since the conflict began in February. Meanwhile, a hidden bullish divergence on the daily chart and a short-covering pattern in open interest suggest the bounce may have more room to run. Whether oil price reclaims $100 or rolls back toward $90 depends on which force wins between diplomacy and escalation.
A 19% Drop, an 8% Bounce, and a President Who Says the Guns Stay Loaded
Brent crude futures fell from roughly $111 on April 7 to a low of $90.34 on April 8, a 19.24% single-day decline triggered by the Pakistan-brokered US-Iran ceasefire. The market priced in an end to the Strait of Hormuz disruption within hours.
That pricing lasted less than a day. Gulf nations reported attacks during the first 24 hours of the truce, and Iran attached conditions to its commitment to reopen the strait. Oil price responded immediately, bouncing 8.45% from the low as the ceasefire’s credibility crumbled.
Then Trump weighed in. Late on April 8, the President posted on Truth Social that all US military assets, including ships, aircraft, and personnel, will remain in place around Iran until a final agreement is fully complied with. He added that if compliance fails, the response would come back “bigger, and better, and stronger than anyone has ever seen before.”
Beneath the geopolitical whiplash, the daily chart carries a technical signal. Between March 10 and April 8, Brent crude made a higher low while the Relative Strength Index (RSI), a momentum indicator measuring the speed of price changes, made a lower low. This is a hidden bullish divergence, a signal that the underlying uptrend may continue despite the surface-level chaos.
Open interest tells a similar story. Since late March, open interest has been declining during price rallies, a pattern consistent with short covering rather than fresh buying. The previous rallies between March 2-9 and March 19 onward both coincided with falling open interest. The current bounce fits the same template.
The technical signals lean bullish. But technical signals in a war-driven market need confirmation from positioning data. The options market provides that next layer.
BNO Options Still Lean Bullish but Hedging Activity Rises
The United States Brent Oil Fund (BNO) put-call ratio, which compares bearish put options to bullish call options, shows that bulls still dominate but with slightly less conviction than before the crash.
On April 6, before the ceasefire, the volume ratio sat at 0.15 and the open interest ratio at 0.29. Both readings were extremely bullish, meaning call activity outpaced puts by a wide margin. By April 8, after the crash and bounce, the volume ratio had doubled to 0.32 while the open interest ratio edged down to 0.27.
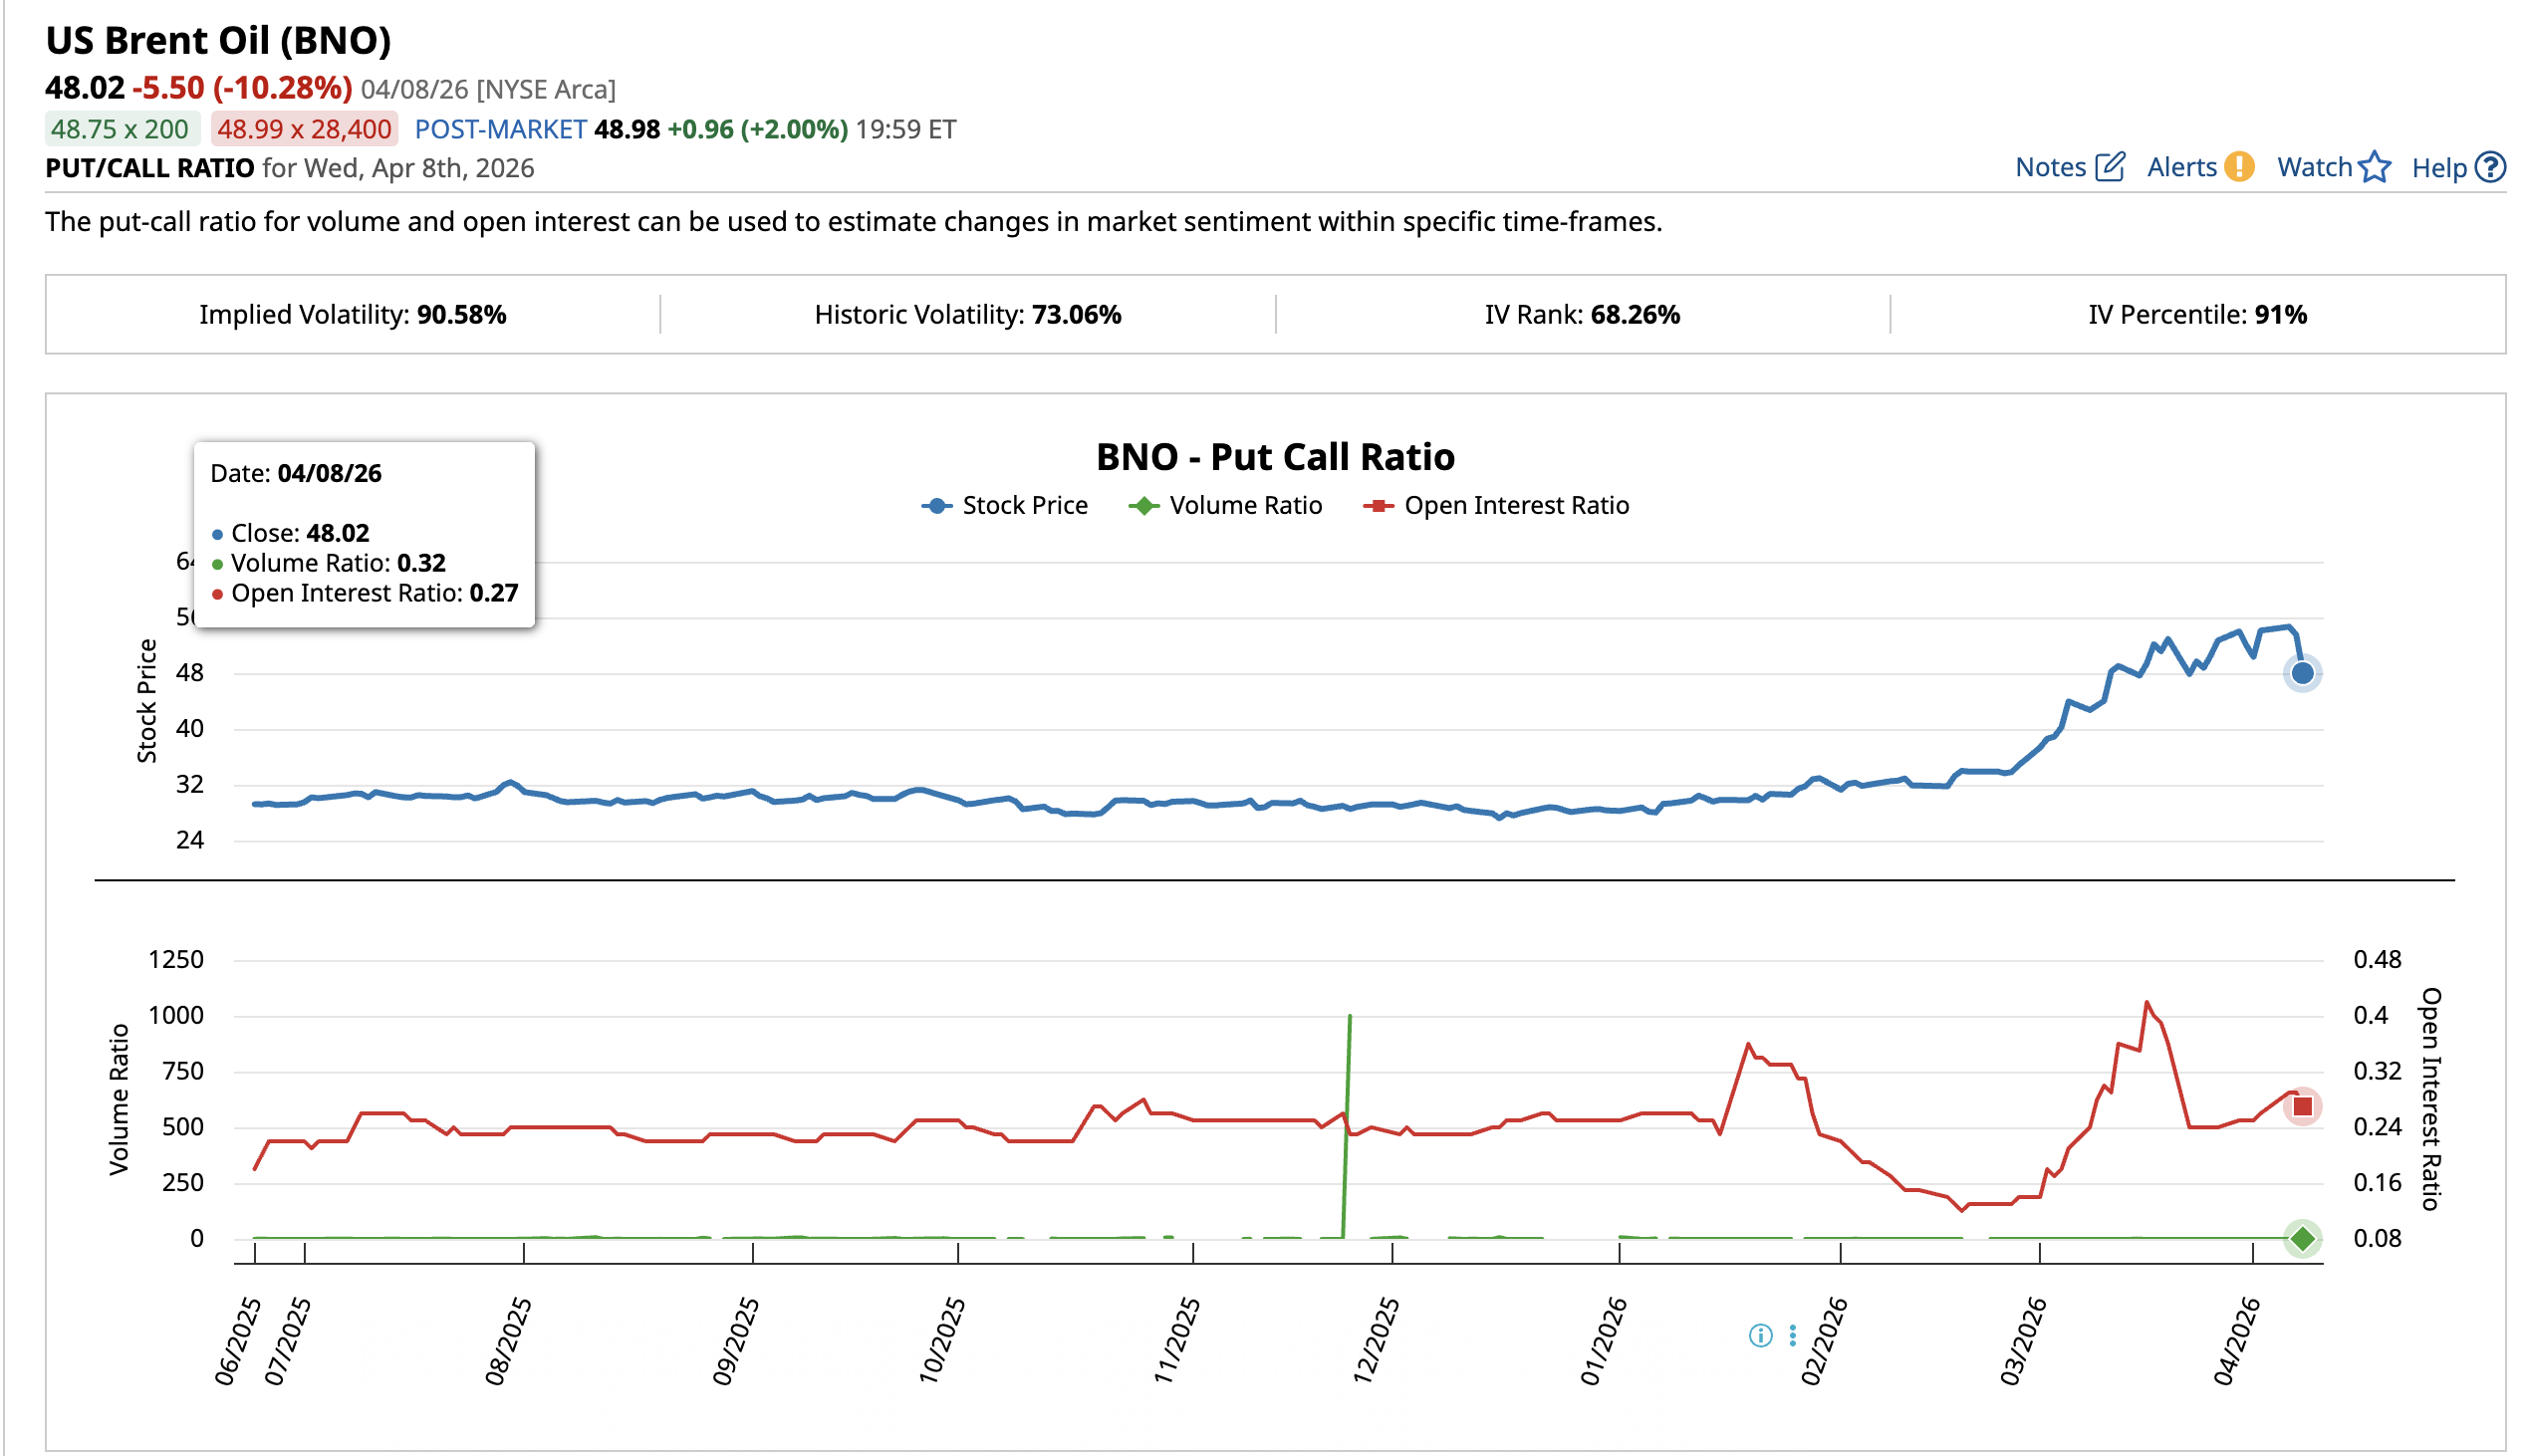
The doubling of the volume ratio suggests some traders added hedges via puts after the 19% drop. However, 0.32 remains well below 1.0, meaning calls still dominate puts by roughly 3 to 1. The open interest ratio dipping from 0.29 to 0.27 also hints that some long positions may have been liquidated during the crash.
Implied volatility sits at 90.58% with an IV percentile of 91%, meaning options are pricing in more turbulence ahead. The market expects more large moves. The direction of those moves depends on whether the ceasefire holds or fractures further.
With the RSI divergence, short covering, and options positioning all leaning bullish, the oil price chart becomes the final decider.
Oil Price Levels That Determine the Next Move
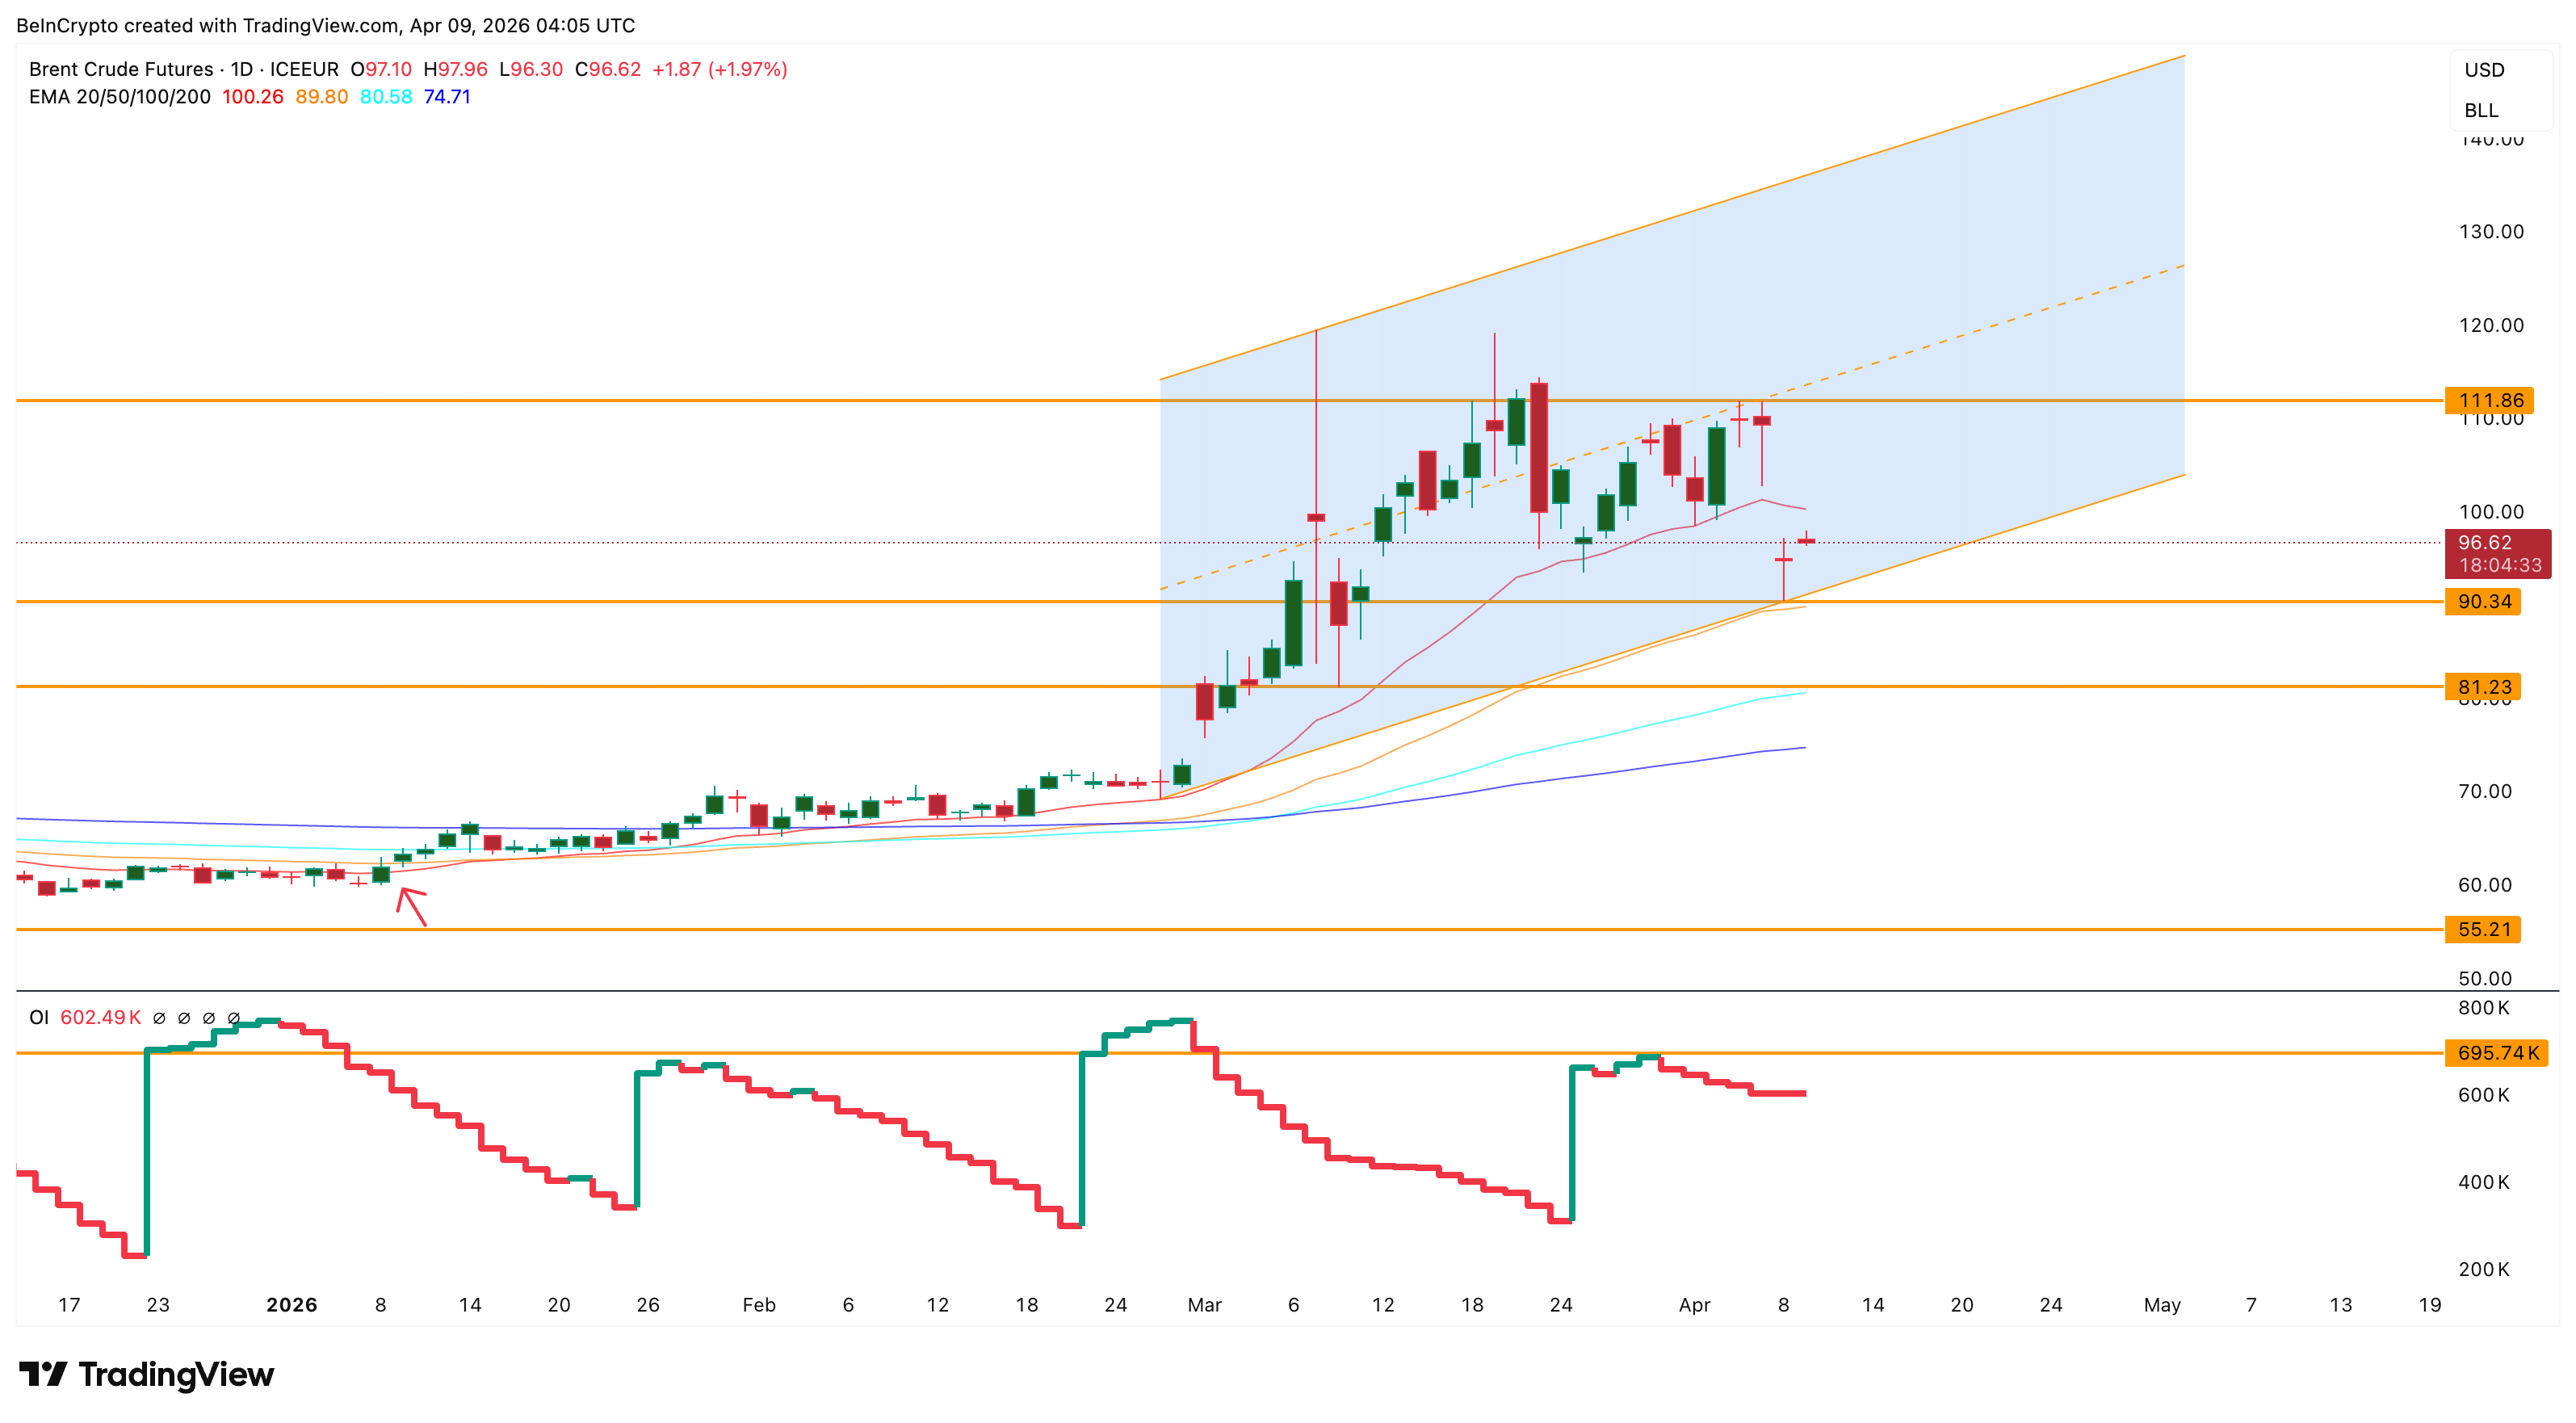
Brent crude trades at $96.86 inside an ascending channel that has been intact since late February. The April 8 crash touched the lower trendline near $90.34 and the 50-day EMA at $89.81. Both held. The channel survived its deepest test since formation.
The key level on the upside is $100.45 at the 0.382 Fibonacci level. This zone aligns closely with the 20-day EMA at $100.29. The last time oil price properly reclaimed the 20-day EMA was January 8, and the rally that followed did not lose steam until the ceasefire announcement. A daily close above $100.45 would signal that the bounce has graduated from short covering to renewed trend strength and could push prices toward $112.34 at the 0.618 level and $120.82 at the 0.786 level.
On the downside, $93.08 at the 0.236 level is the first support. Below that, $90.34 at the April 8 low is the floor. A break below $90 would take Brent outside the ascending channel, turning the structure from bullish to neutral. That would expose $81.18.
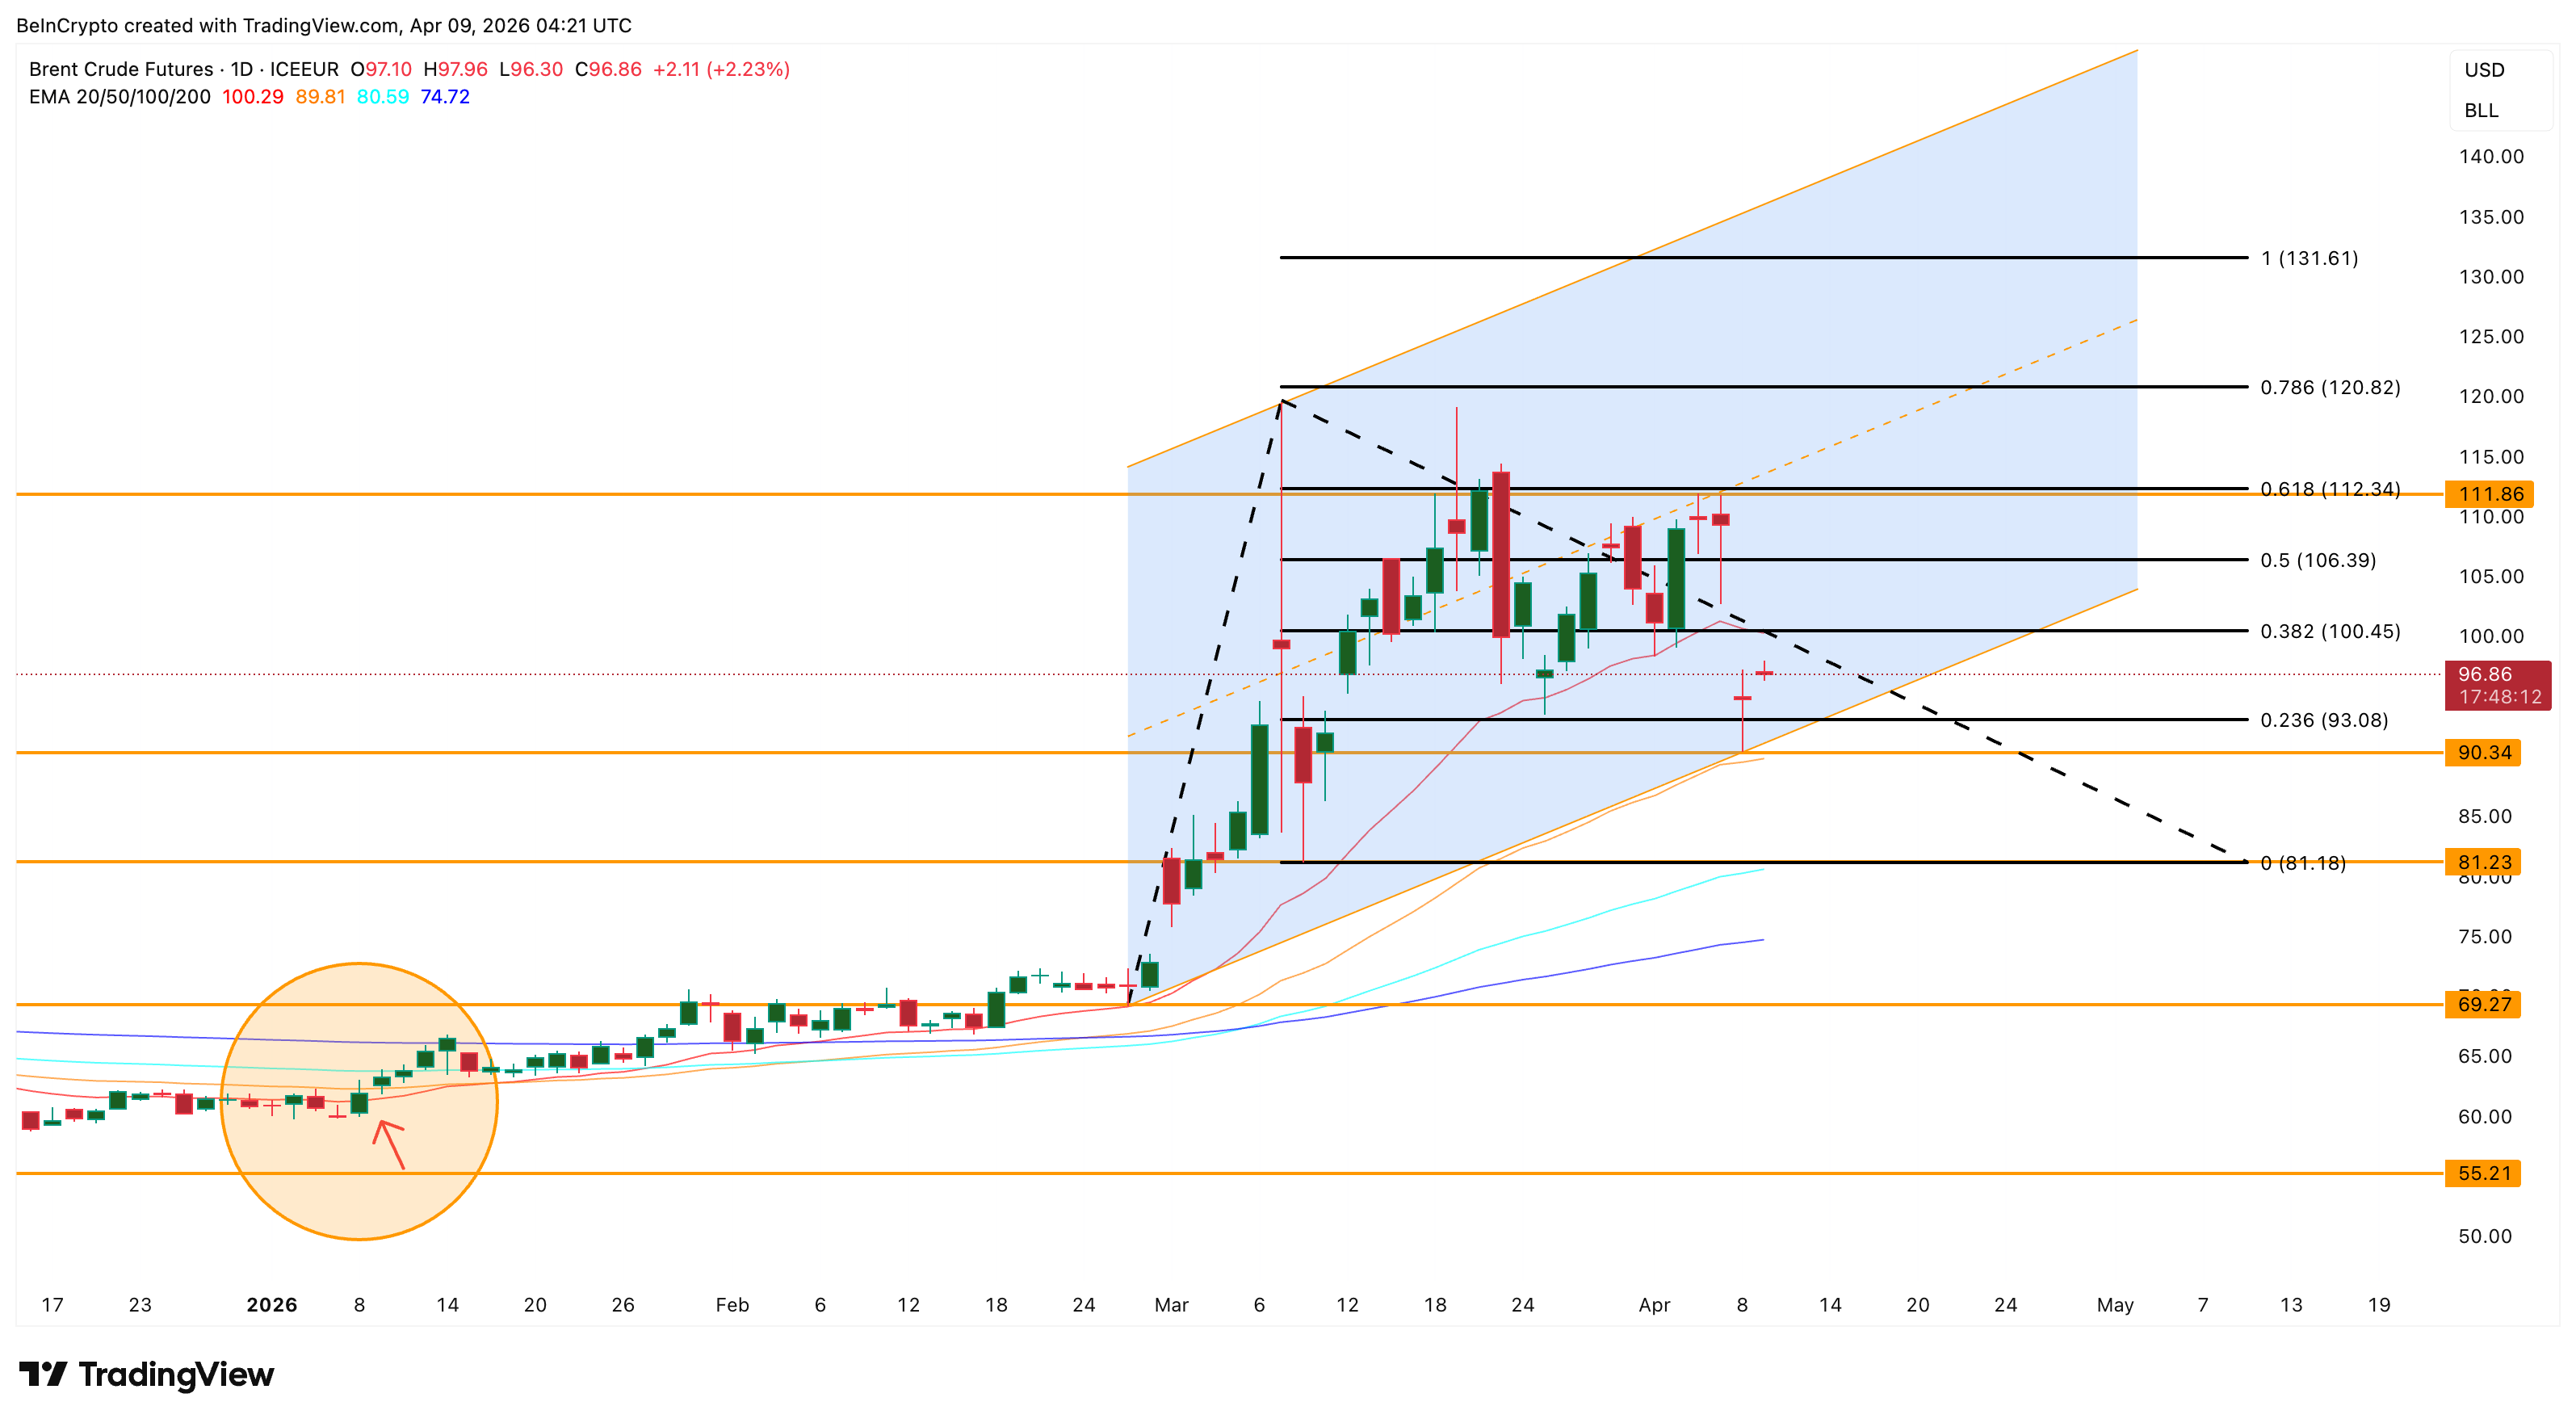
The broader implications extend beyond oil. If Brent reclaims $100 and pushes higher, the petrodollar effect strengthens as oil-importing nations need more dollars to pay for crude. A stronger dollar would pressure gold, silver, and risk assets including crypto. If oil falls below $90 on a successful ceasefire, the reverse could play out.
$100.45 separates a 20-day EMA reclaim with a path back toward $112.34 from a failed bounce that retests $90 and the channel’s lower boundary.
The post Trump Reloads as Oil Price Claws Back From a 19% Ceasefire Crash appeared first on BeInCrypto.


Strategy’s (MSTR) perpetual preferred stock “Stretch” (STRC) traded roughly $333 million in volume on Wednesday, marking its seventh highest daily volume since debuting in July 2025.
Despite the heavy activity, STRC remained tightly anchored around its $100 par value throughout the session. This stability prompted executive chairman Michael Saylor to remark, “one penny of volatility, $330 million of liquidity, closed at par.”
STRC is designed to function as a short-duration, high-yield credit instrument, offering an 11.5% annual dividend paid monthly. Its structure incentivises trading close to par, allowing Strategy to efficiently utilise its at the market (ATM) issuance program to raise capital for additional bitcoin purchases.
The company may have acquired more than 2,000 BTC on Wednesday via the STRC ATM, according to STRC.live estimates.
The broader objective of STRC is to deliver double-digit returns with minimal price volatility, effectively combining income generation with capital stability.
In pre-market trading, Strategy shares were slightly lower at around $127, while STRC continued to trade at par near $100.
Six Swiss banks have joined forces with Swiss Stablecoin AG to test a Swiss franc-pegged stablecoin. UBS, PostFinance, Sygnum, Raiffeisen, Zürcher Kantonalbank, and BCV announced the initiative on April 8.
The sandbox runs on Ethereum using ERC-20 and will operate throughout 2026.
No Regulated CHF Stablecoin Exists Yet
Stablecoins have grown rapidly in international importance, but the market remains dominated by USD-pegged tokens like USDT and USDC. Switzerland currently lacks a regulated Swiss franc stablecoin with broad application. The sandbox aims to address that gap.
The participating institutions will test selected use cases in a controlled live environment with defined safeguards, including transaction limits and a restricted participant pool. Swiss Stablecoin AG provides the technical infrastructure for issuing the stablecoin.
Two Systemically Important Banks Involved
The consortium includes two of Switzerland’s four systemically important banks: UBS and the Raiffeisen Group. The combination of traditional banking institutions like UBS and Raiffeisen alongside digital-first players like Sygnum signals that Switzerland’s financial establishment is taking stablecoin infrastructure seriously.
Several participants are not new to tokenized finance. UBS, BCV, Raiffeisen Switzerland, and Zürcher Kantonalbank already participated in the Swiss National Bank’s Project Helvetia pilot, which tested wholesale CBDC on six Digital Exchange for settlement. The new sandbox is a private stablecoin test rather than a central bank project, but the operational experience carries over.
Stablecoin Sandbox Open to Additional Participants
The sandbox remains open to other interested banks, companies, and institutions. This positions the project as a framework that could expand rather than a closed pilot. The focus is on building a Swiss ecosystem for digital money, developing capabilities in digital payments, and gaining practical insights for the industry.
The initiative follows similar efforts in Europe. A consortium of 12 banks, including BBVA, ING, and UniCredit, announced Qivalis, a digital euro stablecoin set to launch in the second half of 2026. A separate group of 10 banks, including Bank of America, Deutsche Bank, Goldman Sachs, and UBS, is also exploring stablecoin issuance.
What This Means for Switzerland
The sandbox represents Switzerland’s largest multi-bank collaboration on digital finance infrastructure. While MiCA-compliant Swiss franc stablecoins like AllUnity’s CHFAU already exist, the Swiss banking consortium aims at the institutional settlement layer.
The test runs through 2026. A sandbox interim report is expected in the second half of the year. For the broader market, access terms and specific use cases remain undisclosed. For banks and tokenization platforms watching the Swiss stablecoin infrastructure, this is the first multi-bank live test of its kind in the country.
The post 6 Swiss Banks Launch Swiss Franc (CHF) Stablecoin Sandbox appeared first on BeInCrypto.
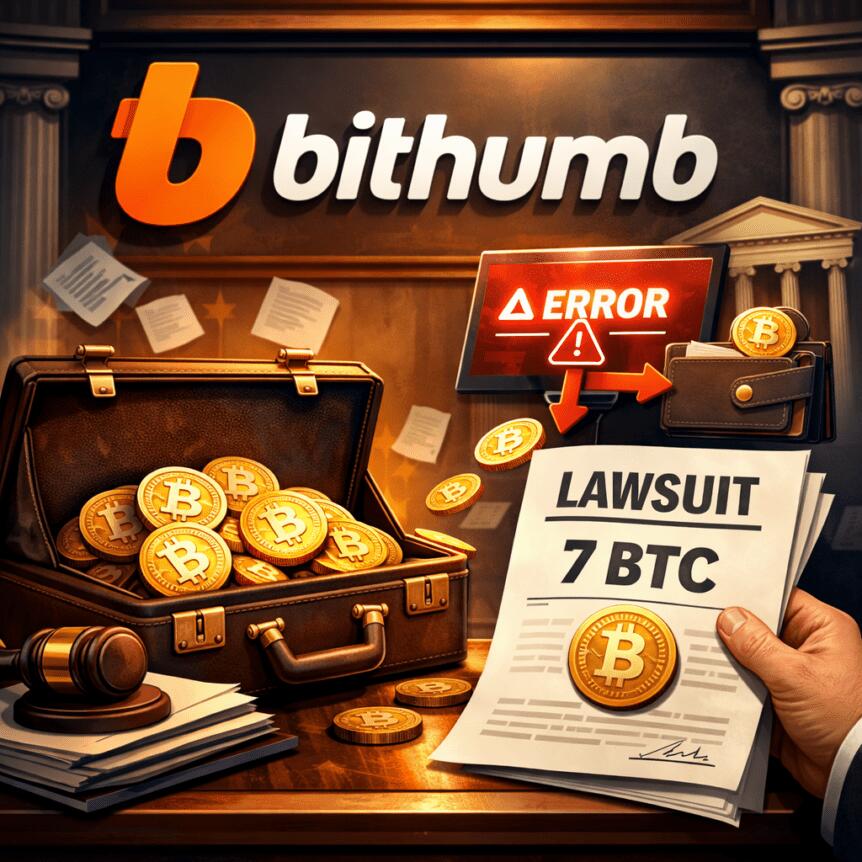
South Korean crypto exchange Bithumb has filed for a provisional attachment to freeze assets tied to users who have yet to return 7 BTC that remain missing after a February payout error, a move aimed at supporting a civil lawsuit to recover the funds. The court-backed measure was reported by Chosun Biz on Thursday and marks the latest chapter in a highly visible post-mortem of the incident.
On February 6, the exchange intended to distribute a total of 620,000 won ($420) to 249 event winners. Instead, a system input error sent out 620,000 BTC, briefly valuing the mistaken transfers at roughly 62 trillion won ($42 billion). Bithumb reversed the transactions within minutes, but a portion of the funds had already moved, prompting the recovery effort that continues to this day.
Following the incident, Bithumb announced it had recovered 99.7% of the funds on the same day. The remaining 0.3%, or 1,788 BTC, had already been sold, with the company covering that shortfall from its reserves. As of the latest reporting, the exchange has been contacting affected users individually and recouping most of the proceeds from those sales, though a small number of recipients have refused to return the balance, arguing they are not responsible for the erroneous transfers, according to Chosun Biz’s account.
Cointelegraph reached out to Bithumb for comment but did not receive an immediate response at the time of publication.
Key takeaways
- The provisional attachment targets users who have not returned 7 BTC missing from a February payout error that briefly distributed 620,000 BTC.
- The incident involved a mistaken transfer valued at about 62 trillion won ($42 billion) after an input error in the payout process.
- Bithumb says it recovered 99.7% of the funds on the same day; 1,788 BTC were sold, with reserves used to cover the remaining shortfall.
- Some recipients have refused to return the remaining funds, but South Korean law generally treats mistaken transfers as unjust enrichment and expects return of the assets.
- Regulators have moved quickly to tighten controls, with the Financial Services Commission ordering exchanges to reconcile ledgers with actual holdings every five minutes after the incident.
Provisional measures and the legal path forward
The filing for provisional attachment underscores Bithumb’s intent to press claims ahead of a civil case. By freezing assets tied to non-compliant recipients, the exchange aims to secure a path to full recovery while the broader dispute unfolds in court. The approach reflects a cautious, rule-driven stance common in asset recovery efforts involving mistaken transfers, where the balance between user rights and corporate accountability is tested in real time.
From rapid reversal to regulatory tightening
The February payout debacle prompted broader scrutiny beyond the immediate recovery efforts. In response, South Korea’s Financial Services Commission ordered exchanges to reconcile their internal ledgers with actual holdings at five-minute intervals to accelerate detection of discrepancies and prevent delays in addressing errors. Earlier assessments had found that three of the five major domestic exchanges performed reconciliations on a daily cadence, creating a potential lag between misentries and corrective action.
The rapid regulatory nudge comes as the industry continues to digitize, complicate, and democratize access to crypto markets in a densely regulated environment. While the Bithumb incident centered on a single promotional payout, the reforms are framed as systemic safeguards to minimize spillover risk across exchanges and users alike.
What readers should watch next
Market participants and retail users will want to monitor the court’s handling of the provisional attachment and any subsequent rulings on the remaining unreturned funds. The case could shape how exchanges structure payout processes, how aggressively they pursue mistaken transfers, and how the legal framework delineates responsibility when automated systems misfire. In the near term, observers should also track how the five-minute reconciliation rule influences incident responses and the speed at which authorities and firms close gaps in asset verification and recovery.

TLDR:
- Oceanus and HashKey signed an MOU to deploy stablecoin settlement across Asian trade finance corridors.
- The partnership integrates AI-driven ODIN platform with regulated infrastructure to improve settlement efficiency.
- Stablecoin settlement enables faster, secure transactions for commodity trades including seafood, meats, and wines.
- The initiative targets the $2.5 trillion trade finance gap affecting SMEs in global markets.
Stablecoin settlement is advancing into global trade finance as Oceanus Group Limited and HashKey Group formalize a strategic partnership.
The two firms signed a Memorandum of Understanding to deploy regulated infrastructure across Asian trade corridors.
The collaboration aims to reduce inefficiencies in cross-border transactions while addressing the persistent funding shortfall affecting small and medium enterprises engaged in commodity trade.
Building Infrastructure for Trade Finance Efficiency
The agreement is executed through Oceanus Digital Intelligence Network Pte. Ltd and HashKey Technology Services Pte Ltd.
Both entities will integrate their platforms to enable stablecoin settlement across commodity transactions. This structure is designed to support faster settlement cycles and reduce counterparty risks in international trade flows.
Oceanus is transitioning from its origins in aquaculture into a technology-focused enterprise. Its ODIN platform uses artificial intelligence to manage trade finance workflows.
By enabling stablecoin-based payments, ODIN connects buyers and sellers through a unified digital system that supports compliance requirements.
Adrian Teo, CEO of ODIN, stated that the partnership marks a shift in Oceanus’s strategic direction. He said it moves beyond a conventional vendor relationship into a peer-level collaboration. He added that Oceanus is strengthening how food trade operates through digital asset integration.
HashKey will serve as the institutional settlement layer within the partnership. Its regulated infrastructure is expected to provide the necessary safeguards for digital asset transactions.
This setup allows stablecoin settlement to function within established financial frameworks while maintaining operational reliability.
Expanding Stablecoin Use in Real-World Asset Markets
The initiative focuses on deploying digital assets into real-world asset transactions. Commodity trades involving seafood, meats, and wines are included in early use cases. These trades demonstrate how stablecoin settlement can handle high-value transactions in traditional industries.
Oceanus is adopting compliant processes to accept and issue payments in stablecoins globally. This transition supports faster settlements compared to conventional banking channels. As a result, trading partners can operate with improved efficiency and reduced transaction delays.
Jason Tay, Managing Director at HashKey Technology Services Pte Ltd, described the partnership as part of a broader strategy.
He stated that HashKey is working to connect traditional finance systems with digital asset infrastructure. He also noted that regulated settlement rails are necessary for institutional adoption.
He added that the collaboration enables stablecoin capital to move into real-world trade environments. This approach supports broader financial access while maintaining security standards.
Through this structure, stablecoin settlement is positioned as a functional tool for modern trade finance systems.


Hyperliquid is bleeding again. Allegedly, a cluster of coordinated crypto wallets drove FARTCOIN up by 20% on Hyperliquid in under four hours, then weaponized the platform’s own liquidation mechanics against it. How much did Hyperliquid’s liquidity vault actually lose, and is the platform structurally vulnerable to this playbook?
On-chain data flagged two linked wallets that accumulated an eight-figure notional long position in FARTCOIN over several hours, pushing the price sharply higher as liquidity thinned, forcing Hyperliquid liquidity provider vault (HLP), which acts as a counterparty of last resort, to absorb the opposing side.
The coordinated traders then triggered or allowed liquidations on their own long positions, activating the Hyperliquid auto-deleveraging (ADL) mechanism. Combined PnL from the maneuver: +$1.3 million. The same wallets were previously linked to a similar squeeze on XPL, suggesting a repeating pattern.
The incident lands while questions about Hyperliquid’s structural design remain unresolved, and as the broader memecoin market continues showing signs of coordinated manipulation activity across multiple platforms.
Discover: The best crypto to diversify your portfolio with
Can FARTCOIN Crypto Recover After Hyperliquid Incident?
FARTCOIN’s engineered pump notwithstanding, the token’s longer-term chart tells a grimmer story. The coin peaked at $2.48 in January 2025 and has shed approximately 93% of its value since, trading near $0.17 as of today. The 20% Hyperliquid spike represents a blip against that decline.
Volume context matters here. FARTCOIN trades in a thin market, exactly why the coordinated Hyperliquid long allegation was effective in the first place. Thin order books mean outsized price reactions to relatively modest capital flows, making the token a recurring target for manipulation that has defined the 2025 memecoin landscape.
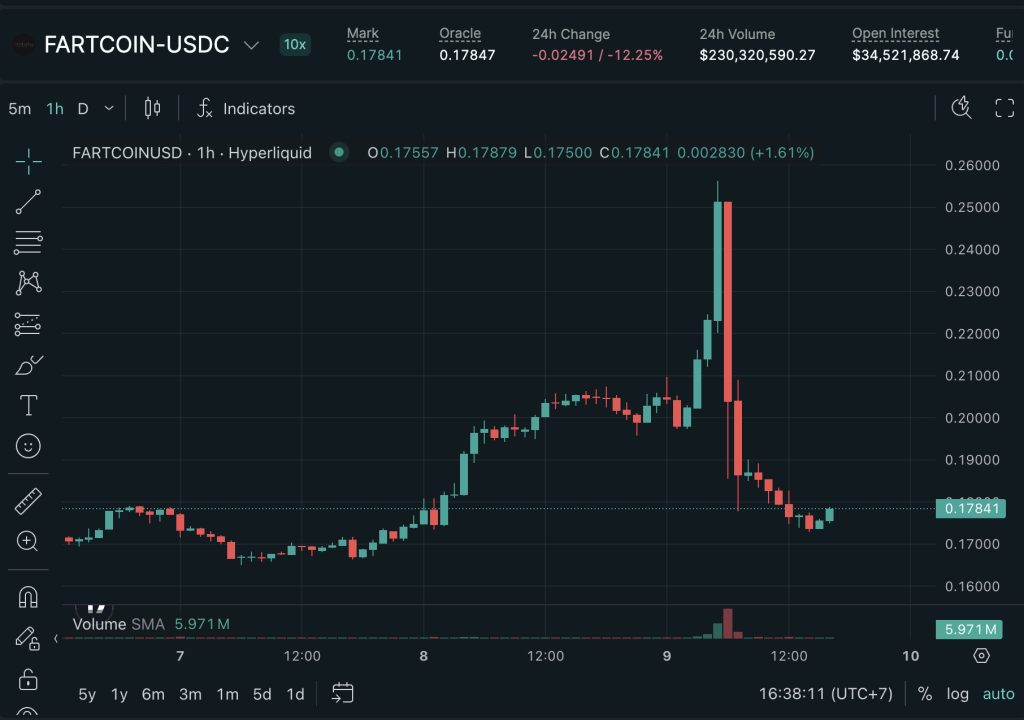
For Fartcoin itself, immediate resistance sits near the $0.20–$0.22 range, which previously acted as support through Q4 2025 before the breakdown. Below the current price, $0.12 represents the next identifiable demand zone. Moving averages are stacked bearishly and are sloping downward, with price trading well beneath both.
Discover: The best pre-launch token sales
Maxi Doge Targets Early Mover Upside as Memecoins Flash Manipulation Risk
FARTCOIN’s chart raises an uncomfortable reality for late participants: by the time a memecoin is being used as a vehicle for eight-figure coordinated squeezes, the asymmetric upside has long since transferred to early holders.
Chasing the spike is the trade that funds other people’s PnL. The rotation play and finding the next leveraged memecoin narrative before it prints are where the real edge lies. Maxi Doge ($MAXI) is positioning directly inside that thesis. The ERC-20 token frames itself around a 1000x leverage trading culture, embodying the bull market grind.
Current presale price sits at $0.00028, with just under $5 million raised to date. Staking also offers a huge 60% APY for early participants. Features include holder-only trading competitions with leaderboard rewards, a Maxi Fund treasury for liquidity and partnership deployment, and meme-first marketing built around gym-bro humor that travels well on social.
Research Maxi Doge before the presale price moves.
The post Fartcoin Crypto Pump and Dump Hurts Hyperliquid: Coordinated $1.3 Million Drain? appeared first on Cryptonews.

Suddenly, Streeting thinks public opinion matters – but only when it comes to the BMA
Toulon Golf releases new ’86 inspired Small Batch Columbus putter

AMD finally puts a price tag on the Ryzen 9 9950X3D2 and it’s hefty

Why Israel is blocking foreign journalists from entering

Bitcoin: We’re Entering The Most Dangerous Phase

Alan Cumming Brands Baftas Ceremony A ‘Triggering S**tshow’

MCP Financial Markets Analysis Tool (Google ADK). From Market data to Agentic Report

How Much Real Money Has FNAF Earned?

During my financial aid interview, the advisor pulled up my father’s name and asked if he knew I was
-

 NewsBeat7 days ago
Steven Gerrard disagrees with Gary Neville over ‘shock’ Chelsea and Arsenal claim | Football
-

 Business6 days ago
No Jackpot Winner and $194 Million Prize Rolls Over
-

 Fashion6 days ago
Weekend Open Thread: Spanx – Corporette.com
-

 Business5 days ago
Expert Picks for Every Need
-

 Business3 days ago
Three Gulf funds agree to back Paramount’s $81 billion takeover of Warner, WSJ reports
-

 Sports5 days ago
India men’s 4x400m and mixed 4x100m relay teams register big progress | Other Sports News
-

 Tech2 days ago
How Long Can You Drive With Expired Registration? What Florida Law Says
-
Business4 days ago
No Jackpot Winner, Prize to Climb to $231 Million
-

 Fashion3 days ago
Massimo Dutti Offers Inspiration for Your Summer Mood Board
-

 Tech7 days ago
Commonwealth Fusion Systems leans on magnets for near-term revenue
-

 Fashion2 days ago
Let’s Discuss: DEI in 2026
-
Politics6 days ago
Wings Over Scotland | The quality of mercy
-

 Business4 days ago
Akebia Therapeutics, Inc. (AKBA) Discusses Pipeline Progress and Strategic Focus on Kidney Disease Treatments at R&D Day – Slideshow
-

 Fashion6 days ago
Statement Sunglasses: The Accessory Shaping Modern Fashion
-

 Crypto World21 hours ago
Bitcoin recovers as US and Iran Agree a Ceasefire Deal
-

 Politics6 days ago
East Jerusalem Palestinian families eviction orders
-

 Fashion7 days ago
Thursday’s Workwear Report: Merino Wool Blend Short-Sleeved Sweater
-

 Sports7 days ago
Which German players will make final cut?
-

 Fashion6 days ago
For Love & Lemons’ Spring 2026 Line is for the Romantics
-

 Politics6 days ago
Why so many children are now classified as ‘disabled’
You must be logged in to post a comment Login