
Crypto World
Is $2.7 Billion Whale Selling the Last Shakeout for Ethereum?
Ethereum continues to trade sideways as uncertainty weighs on the broader crypto market. The altcoin king has struggled to regain decisive bullish momentum.
While the current structure suggests potential bottom formation, large holders appear to be making aggressive moves.
Ethereum Whales Selling Has Not Stopped
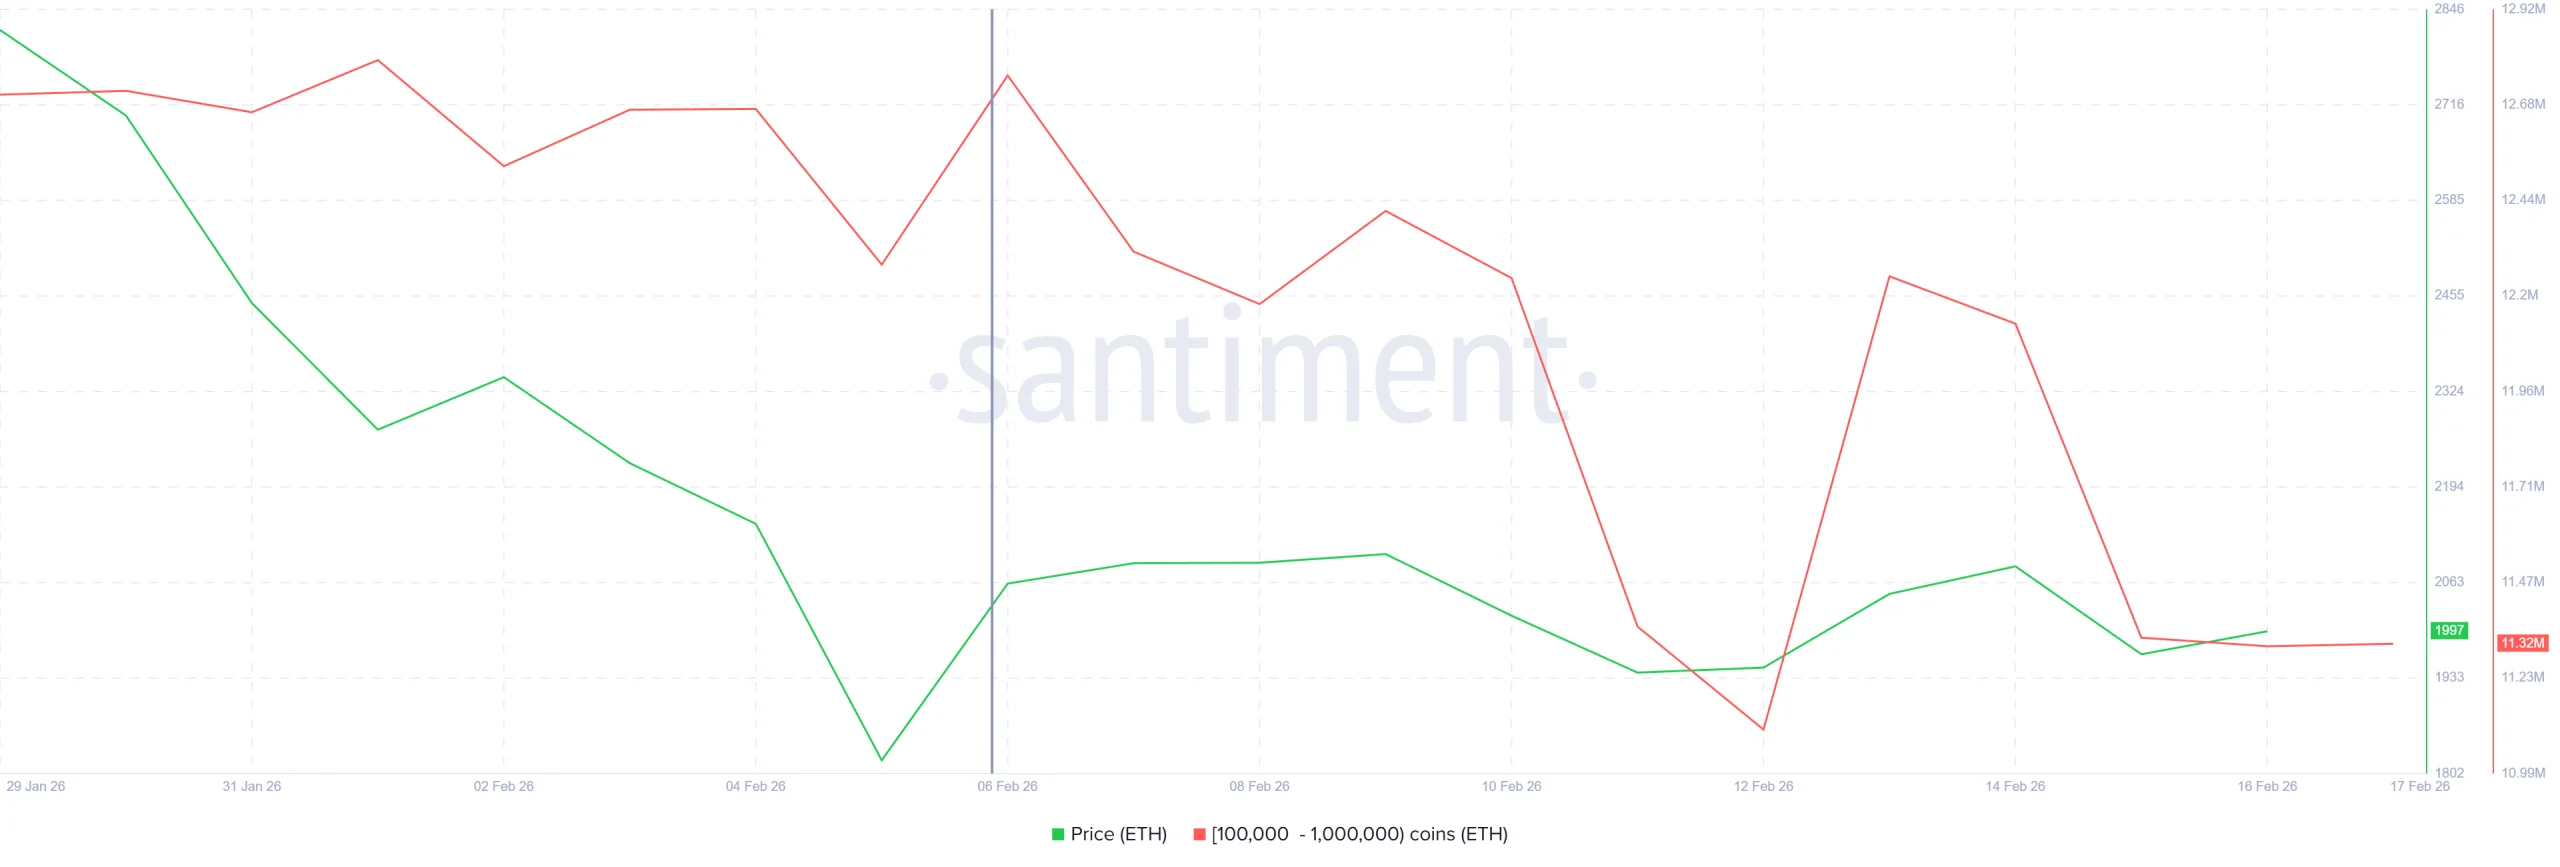
Ethereum whales have demonstrated erratic behavior in recent sessions. Sharp accumulation phases have been followed by equally aggressive distribution. This volatility signals uncertainty among high-capital participants.
Over the past two weeks, addresses holding between 100,000 and 1 million ETH have sold approximately 1.43 million ETH. At current valuations, that equals roughly $2.7 billion. Such large-scale distribution significantly impacts liquidity conditions.
Want more token insights like this? Sign up for Editor Harsh Notariya’s Daily Crypto Newsletter here.

This level of selling often reflects late-cycle stress rather than early panic. Historically, heavy whale exits tend to occur near capitulation phases. Large holders sometimes reduce exposure before the broader acceptance of a market bottom. These episodes frequently precede structural reversals once selling pressure exhausts.
Ethereum Bottom Signals Strengthen
On-chain data provides additional context. The Net Unrealized Profit and Loss, or NUPL, indicator shows Ethereum in the capitulation zone. This reading indicates that average holders face substantial unrealized losses.
In prior cycles, similar NUPL conditions preceded meaningful reversals. However, Ethereum typically remains in this zone for extended periods. Capitulation does not imply immediate recovery.
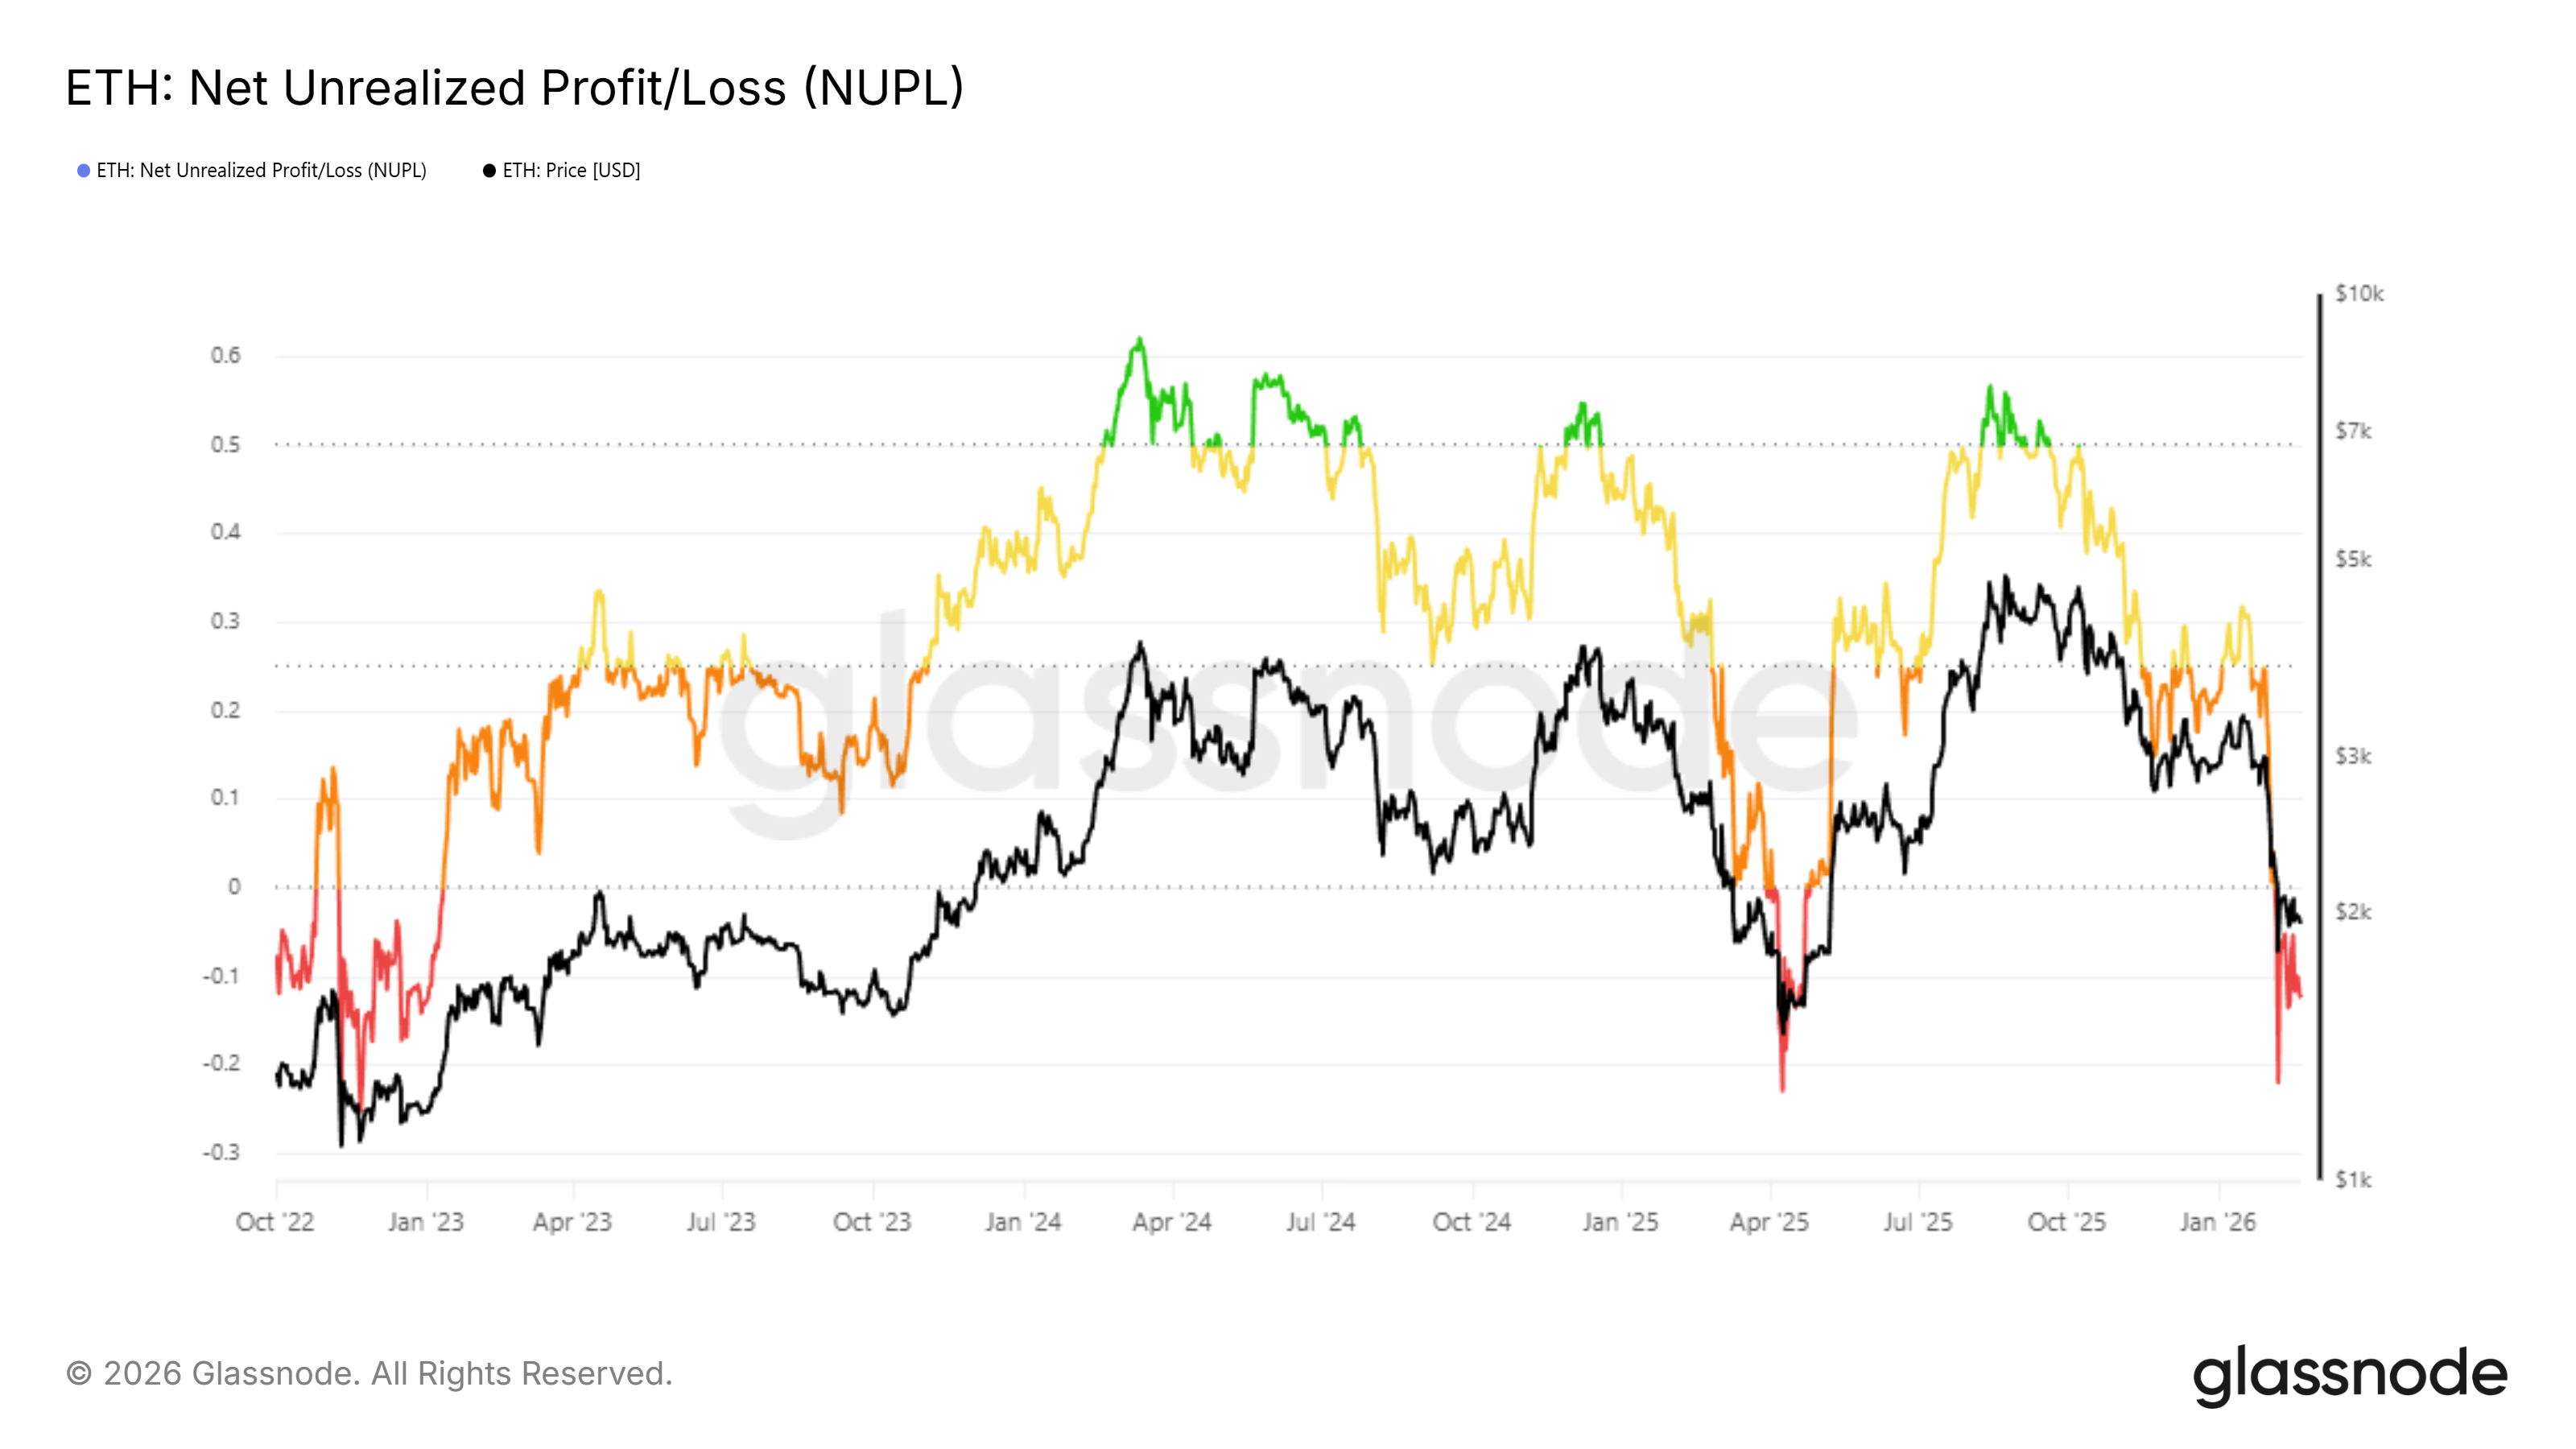
Sustained time in the capitulation band often reduces speculative selling. As weaker hands exit positions, remaining holders tend to exhibit stronger conviction. Gradual stabilization in NUPL readings can signal diminishing downside momentum before recovery begins.
The Pi Cycle Top Indicator also supports a potential ETH bottoming narrative. This metric tracks the relationship between short-term and long-term moving averages. Historically, convergence signals overheating near cycle tops.
Conversely, extreme divergence between these averages often aligns with cyclical bottoms. Current readings show meaningful separation between the two curves. Similar divergence patterns previously marked recovery zones.
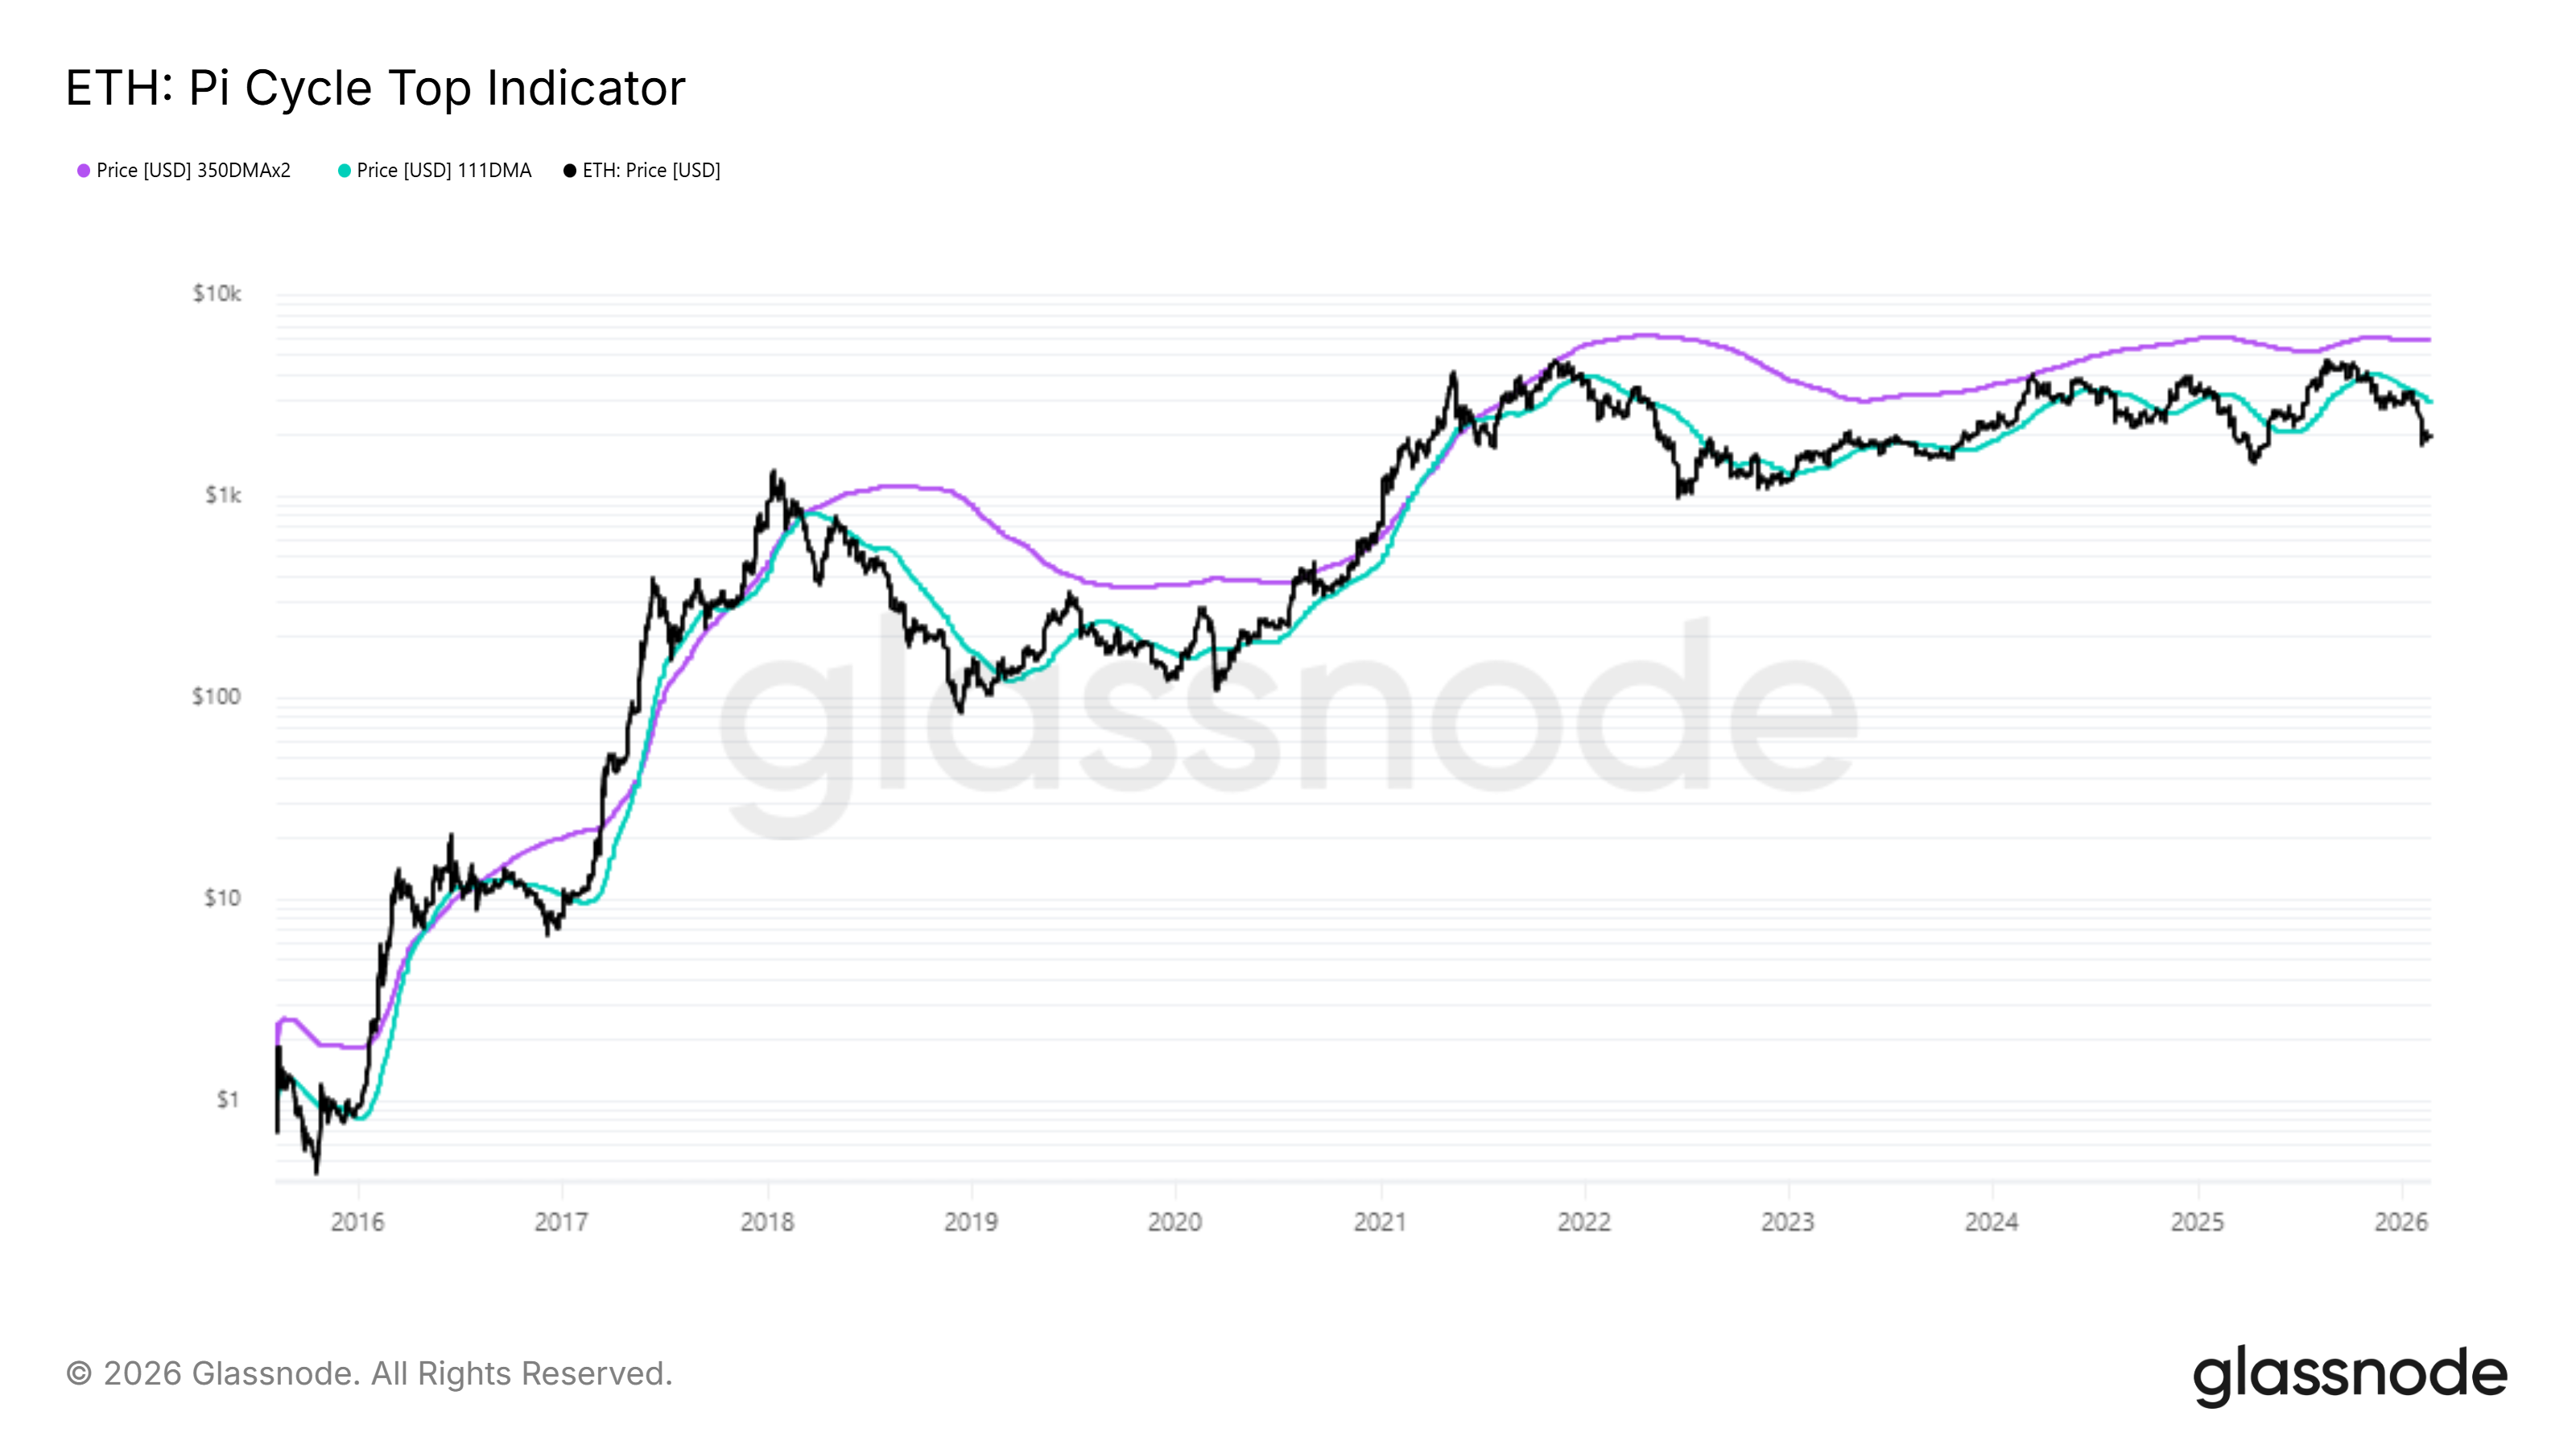
Historical instances demonstrate that widening gaps preceded upward reversals. Although timing remains uncertain, this structural setup aligns with late-stage correction behavior. Combined with capitulation metrics, the data suggests Ethereum may be approaching stabilization rather than early bear expansion.
ETH Price Holds Above Support
Ethereum trades at $1,960 at the time of writing. The asset has consistently held above the $1,928 support level despite whale distribution. This zone remains technically significant in maintaining short-term structure.
Although overall sentiment remains cautious, underlying demand has prevented a sharper breakdown. Buyers appear willing to accumulate near perceived value levels. Sustained support may enable Ethereum to challenge the $2,027 resistance. Clearing $2,108 would confirm a breakout from consolidation.
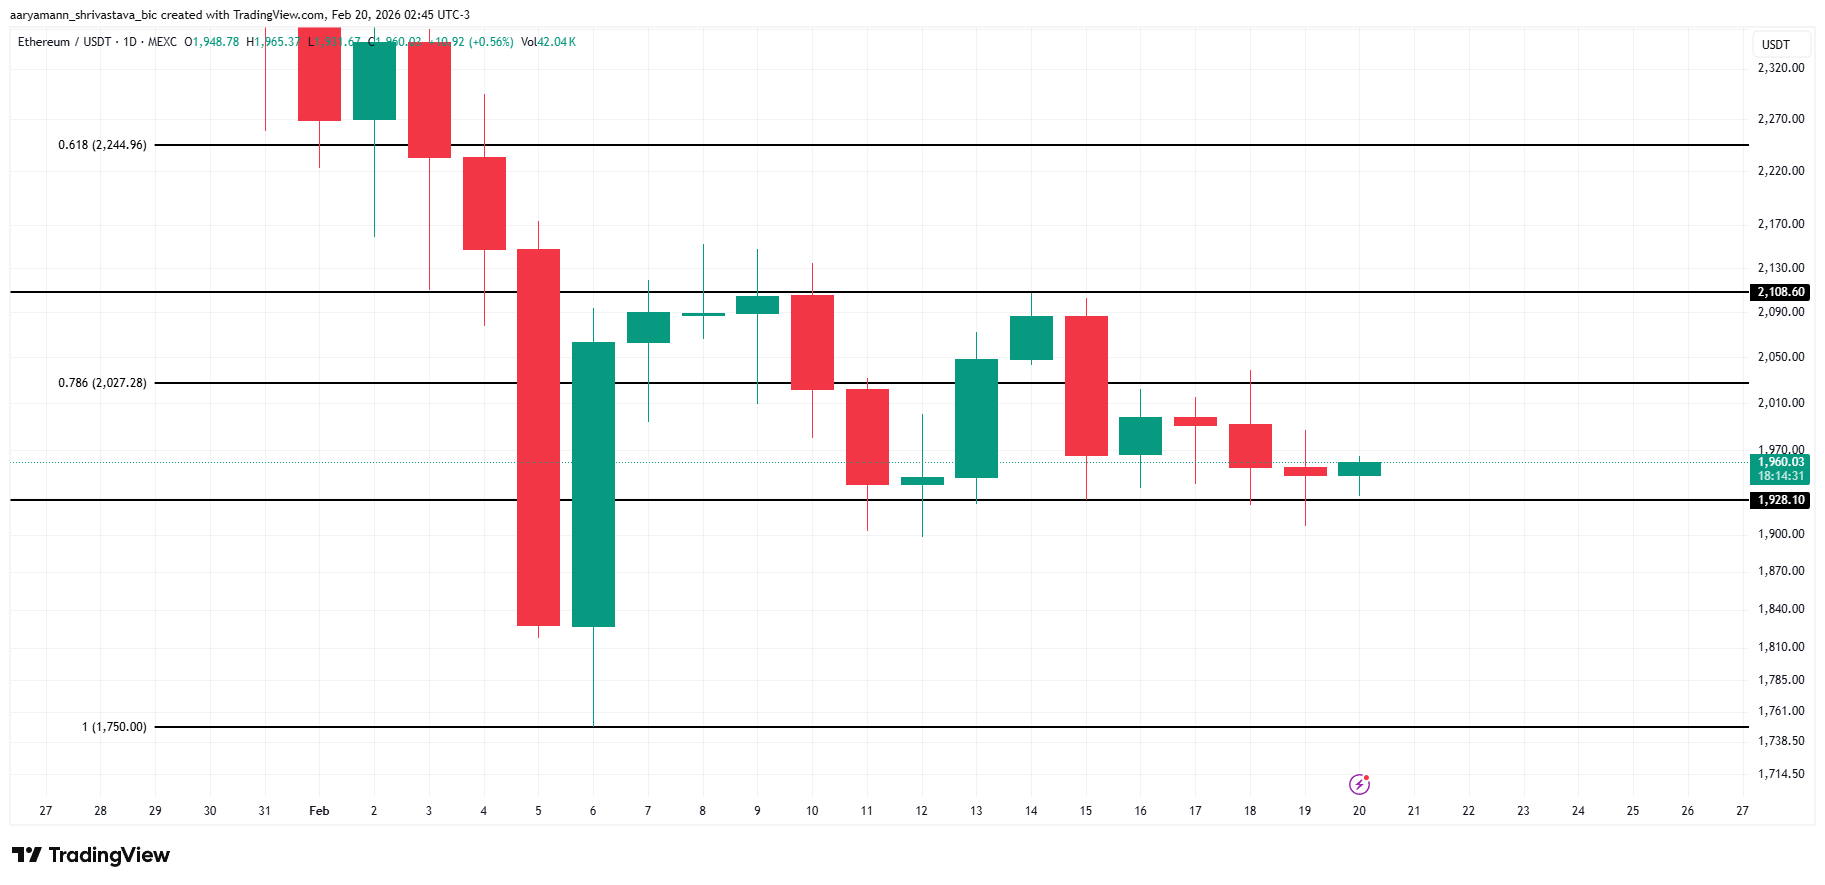
However, downside risks cannot be ignored. If bearish momentum intensifies, Ethereum could lose $1,928 support. A breakdown may expose $1,820 as the next potential floor. Continued weakness could extend toward $1,750, invalidating the near-term bullish thesis.


XRP Ledger Chosen to Be the Research Framework
XRP Ledger will be used as the fundamental blockchain platform in the study. In addition, it will discuss how the network assists in payment processing in various markets. In this way, the firms would assess the technical performance under actual conditions. The companies explained that the project does not imply the immediate product rollout, but it will seek to collect technical and regulatory experience to be used in the future. Therefore, the research will guide long-term infrastructure planning.
Japan and South Korea are still working on creating stablecoin and blockchain laws. As a result, there are differences between two systems that should be analyzed in detail. The paper will examine compliance standards in the two jurisdictions. In the study, the researchers will evaluate what blockchain is doing with existing payment infrastructure. It will also compare compatibility with current banking and remittance systems. This will help to ensure that the solutions that will be developed in the future can work within the set frameworks.
The two companies will consider transaction flows and operating models. Therefore, the work will touch upon the stability and performance of the system under real conditions. In addition, it will also analyze some of the risks that may be associated with blockchain-based payments. The project identifies a number of areas of focus on which to analyze. It will look at the issues in the business environment and institutional differences between the two nations. Also, it will determine technical and operational obstacles that influence adoption.
Payments Under Evaluation Use Cases
The companies will consider the real-life uses of blockchain in payments. Therefore, they seek to find feasible applications of cross-border remittances. This will assist in laying down the future implementation directions. This research follows Ripple as it keeps on expanding partnerships with the global payment networks. Furthermore, South Korea has seen more currency being traded on local exchanges, indicating a growth of the stablecoin activity in the country. Such developments give a background to current research. The collaborative research creates a framework for analysing blockchain payments in two regulated markets. In addition, it assists in the planning of cross-border financial infrastructure in the future.


South Korea extradites alleged drug boss Park Wang‑yeol and prepares a blockchain forensics push to trace at least 6.8b won in Bitcoin‑linked drug proceeds.
Summary
- South Korea has extradited alleged drug kingpin Park Wang-yeol from the Philippines and placed him under a joint drug crime task force.
- Investigators will scrutinize Bitcoin wallet activity to trace at least 6.8 billion won (about $5 million) in confirmed proceeds and search for far larger hidden assets.
- The case showcases how Korean law enforcement now leans on blockchain forensics to unwind complex, cross-border narcotics networks.
South Korean authorities have taken custody of alleged “drug lord” Park Wang‑yeol, extradited from a Philippine prison where he was serving a 60‑year sentence for the 2016 “sugarcane field” triple homicide, to face new narcotics and money‑laundering charges at home. Reuters reported that Park, believed to be 47, is suspected of running a drug trafficking ring from inside his Philippine cell, coordinating shipments of “large quantities” of methamphetamine and other narcotics into South Korea via encrypted apps. According to Korean media summaries cited by outlets including the Dong‑A Ilbo, officials estimate he oversaw a monthly drug business worth roughly 30 billion won (around $22 million), turning prison into a command center rather than a constraint.
The Korean Drug Crime Joint Investigation Headquarters — a consolidated task force of prosecutors and police — has made clear that tracing Park’s financial footprint will rely heavily on on‑chain analysis of Bitcoin wallets believed to have received drug proceeds. While confirmed criminal takings in the current indictment stand at roughly 6.8 billion won (just over $5 million), investigators told domestic media they suspect the true scale of assets moved through crypto wallets between November 2019 and July 2024 is “several times larger.
Reporting from Chosun Ilbo details how Park allegedly directed accomplices in Korea to sell drugs sourced from abroad — including at least 4.9 kilograms of methamphetamine and thousands of ecstasy and ketamine doses — then funneled profits through digital channels rather than traditional banking rails. The task force has identified more than 200 accomplices across roles such as suppliers, smugglers and street dealers, underlining the networked nature of the operation and the need for tools that can map complex flows of funds.
South Korea has quietly built one of the more aggressive crypto‑crime enforcement programs in Asia, deploying specialist units that routinely use blockchain analytics platforms to deanonymize wallets and claw back illicit proceeds. A 2024 briefing from Blockchain Intelligence Group noted that Seoul’s joint investigation division recovered roughly 163.87 billion won (about $121 million) in crypto‑linked criminal proceeds in a single year, relying on tools that “identify clusters of wallets,” “track the flow of funds” and link addresses to real‑world entities.
Recent cases underscore both the potential and pitfalls of this approach: DL News reported in February that prosecutors managed to recover $22 million worth of Bitcoin that had effectively gone “missing” in an earlier phishing investigation, even as separate lapses saw police mismanage and temporarily lose more than $1.4 million in seized BTC. In that context, the Park Wang‑yeol probe is emerging as a showcase for how far Korean authorities can push on‑chain forensics to pierce one of the country’s most notorious narcotics empires — and whether they can do so while tightening their own controls over seized digital assets.
Hyperliquid (HYPE) price trades near $35.60 on April 3, carrying a 13% monthly gain that masks an 8% decline over the past seven days.
On the surface, the monthly performance looks strong for a market under pressure. However, the 8-hour chart is forming a bearish reversal pattern, institutional money flow is diverging from price, and the platform’s own financial metrics show a sharp deterioration in capital commitment. The bounce currently underway may extend further before the structure breaks, but the weight of evidence points toward eventual weakness.
An Inverse Cup Forms as Big Money Quietly Exits
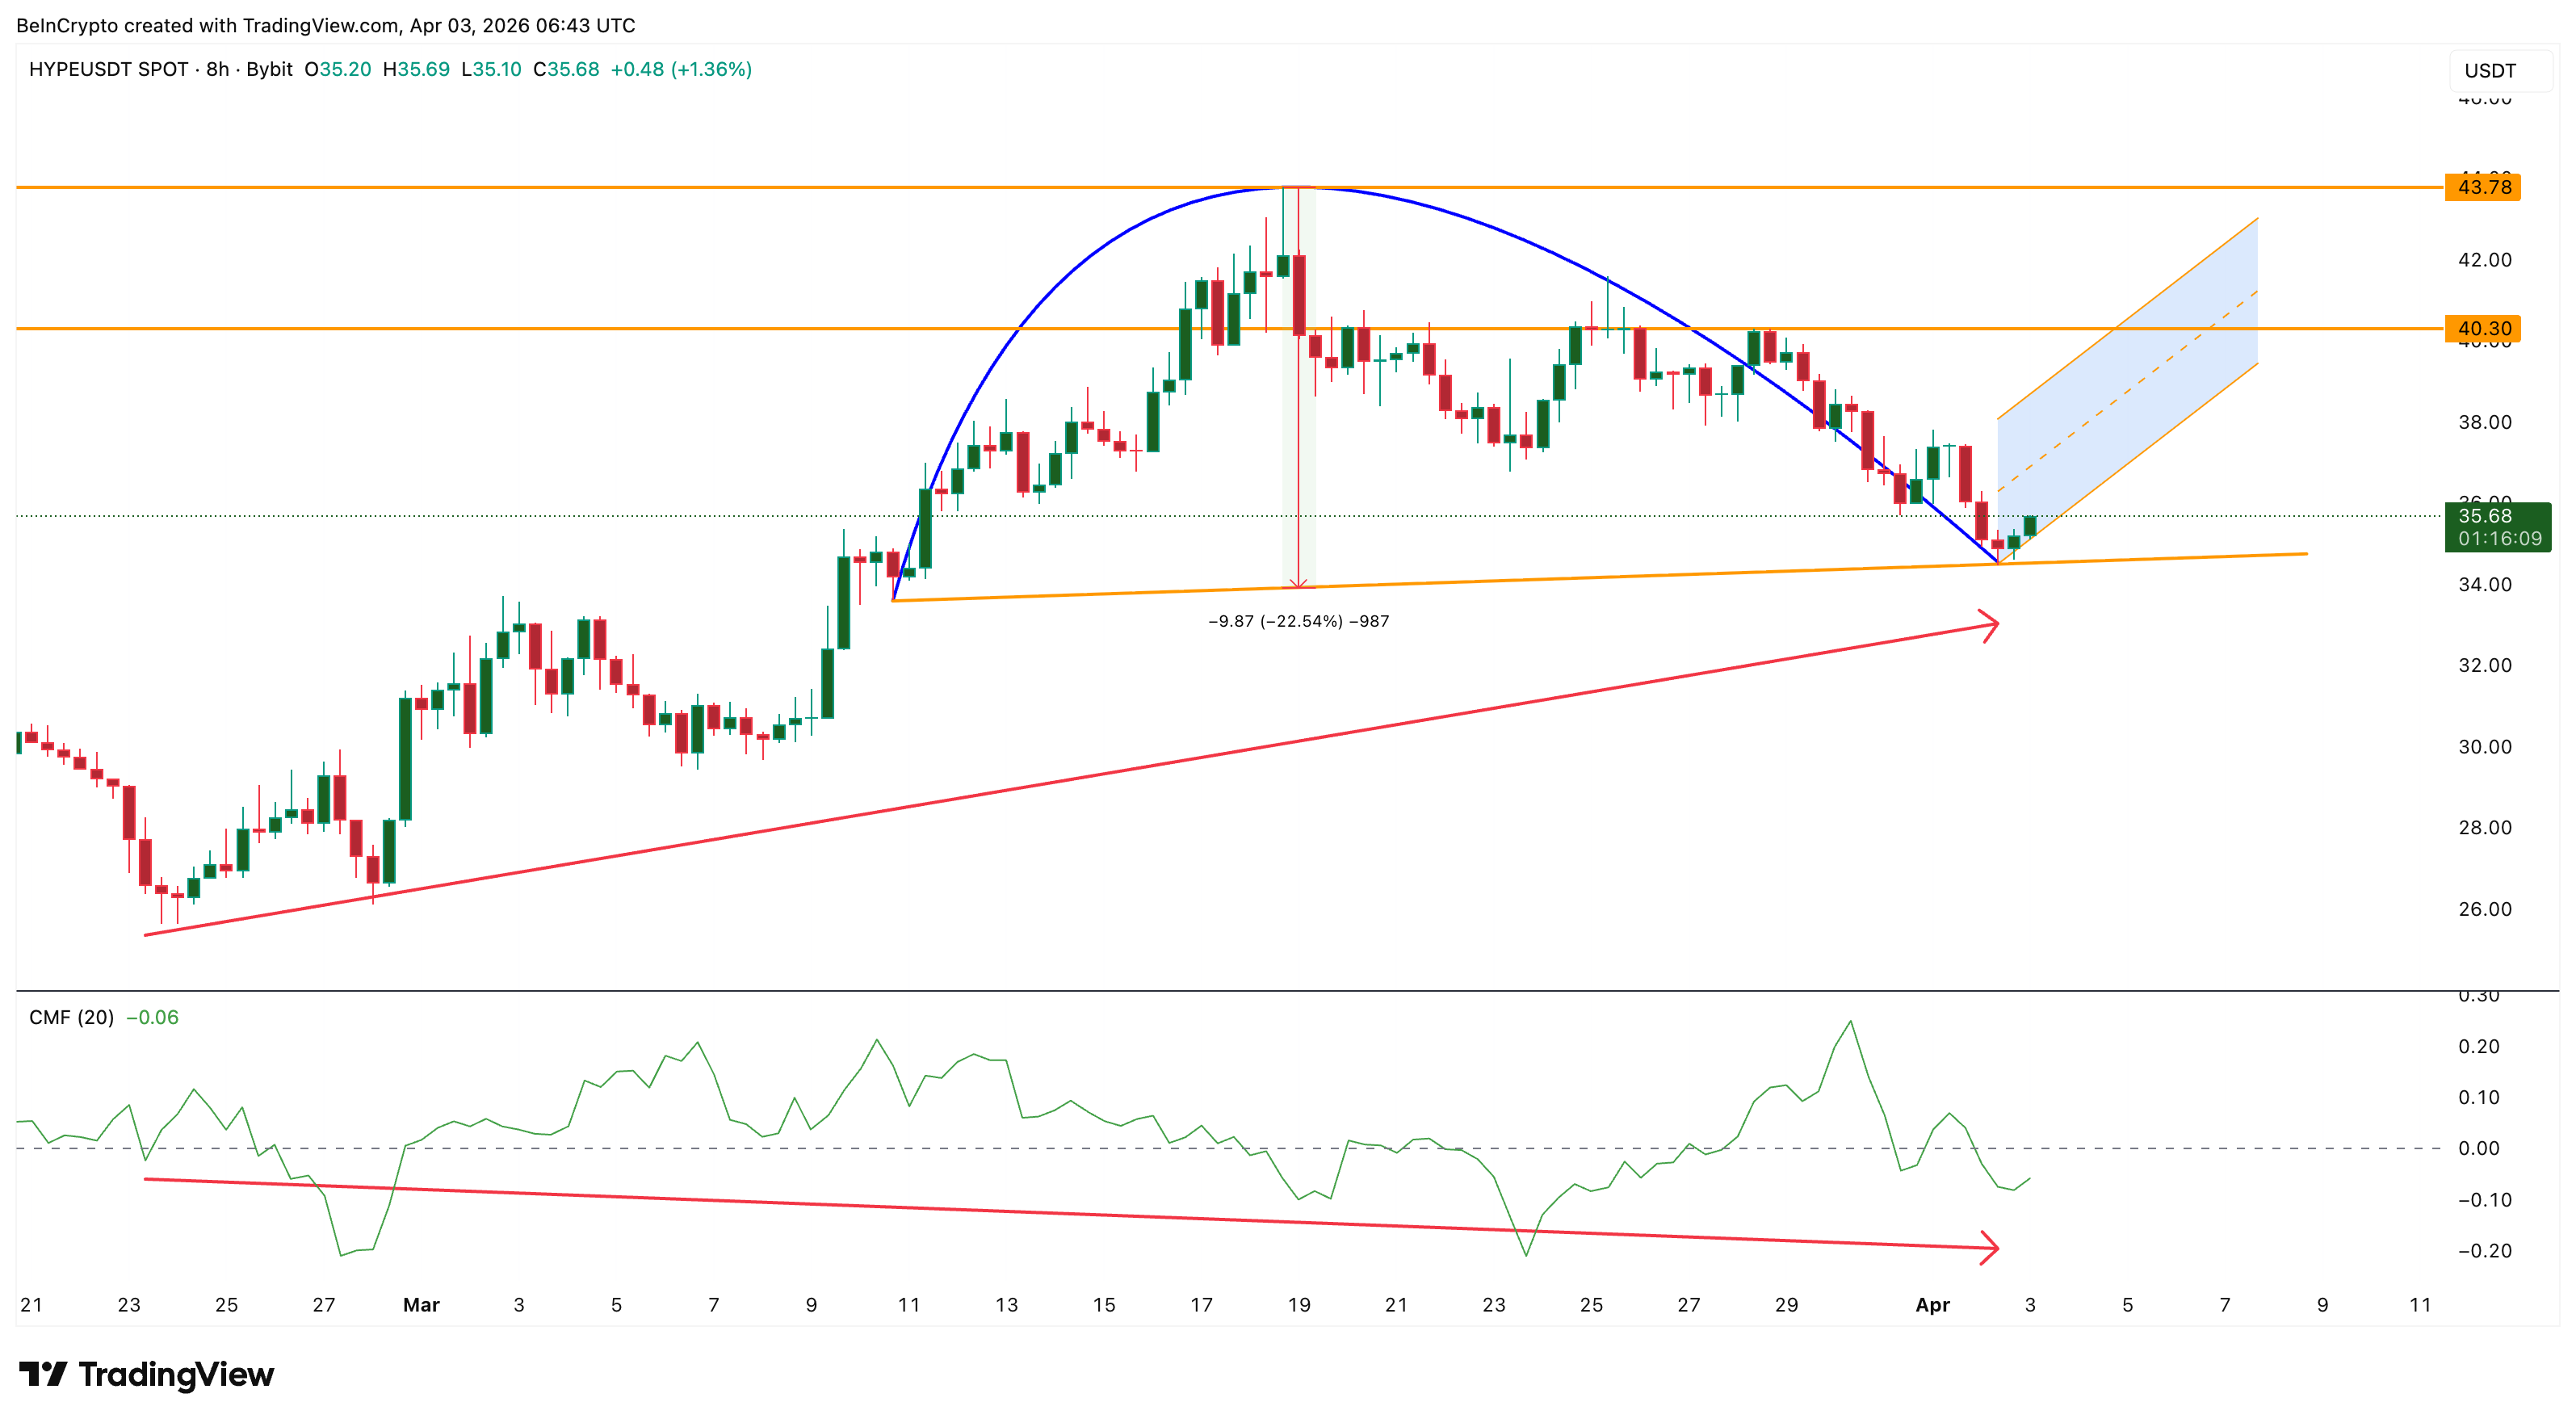
Since March 10, Hyperliquid price has been tracing an inverse cup and handle pattern on the 8-hour chart, a bearish reversal structure. The current bounce is forming what closely resembles the handle, a smaller upward drift within a narrowing channel before a potential breakdown.
The handle remains intact as long as HYPE stays below $40.30. A confirmed break below the neckline would activate the pattern’s measured move, projecting approximately 22% downside from the neckline.
Chaikin Money Flow (CMF), a proxy for institutional buying and selling pressure, confirms the weakness behind the pattern. Since late February, while HYPE price trended higher, CMF trended lower, deepening into negative territory at -0.06. That bearish divergence indicates that large participants have been reducing exposure throughout the rally.
The on-chain data from Dune Analytics possibly explains why. Hyperliquid’s USDC-based assets under management (AUM) on Arbitrum peaked at $4.02 billion around mid-September 2025. By March 30, 2026, that figure had dropped to $1.85 billion, a 54% decline. USDC net flow, which measures the difference between deposits and withdrawals, remains in negative territory, meaning more stablecoins are leaving the platform than entering.
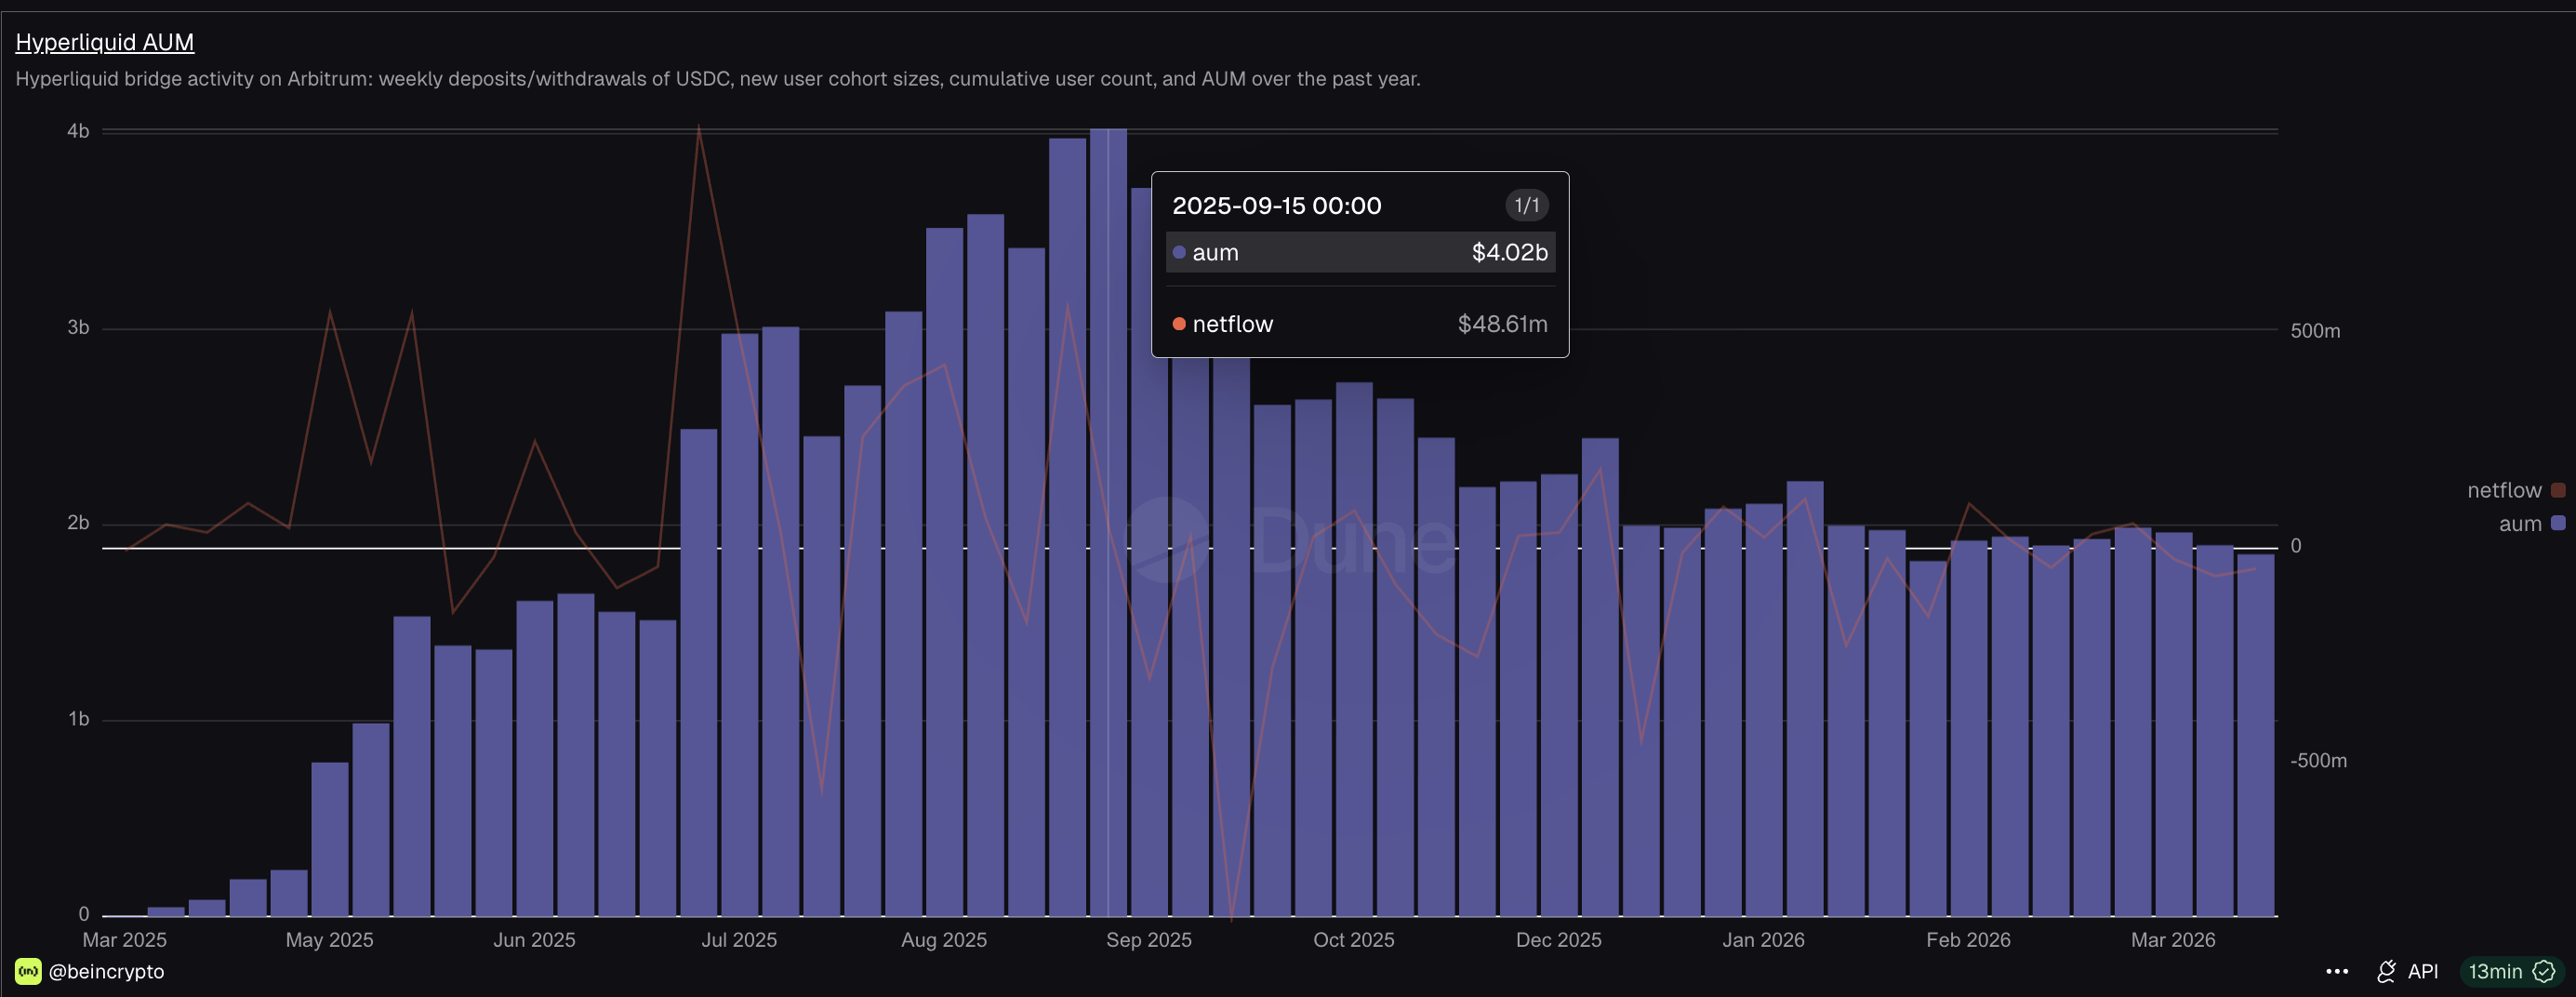
The AUM decline reflects a broader DeFi capital contraction. Total DEX spot volume across all platforms fell to $155 billion in March 2026, its lowest level since September 2024.
As a derivatives-focused platform with spot offering too, Hyperliquid allows traders to generate outsized volume through leverage with relatively small USDC deposits.
When capital commitment shrinks at the platform level while price rises, the rally lacks the financial foundation to sustain itself. The liquidation map now determines whether the bounce extends before the pattern resolves.
Liquidation Imbalance Could Fuel a Bounce Before the Break
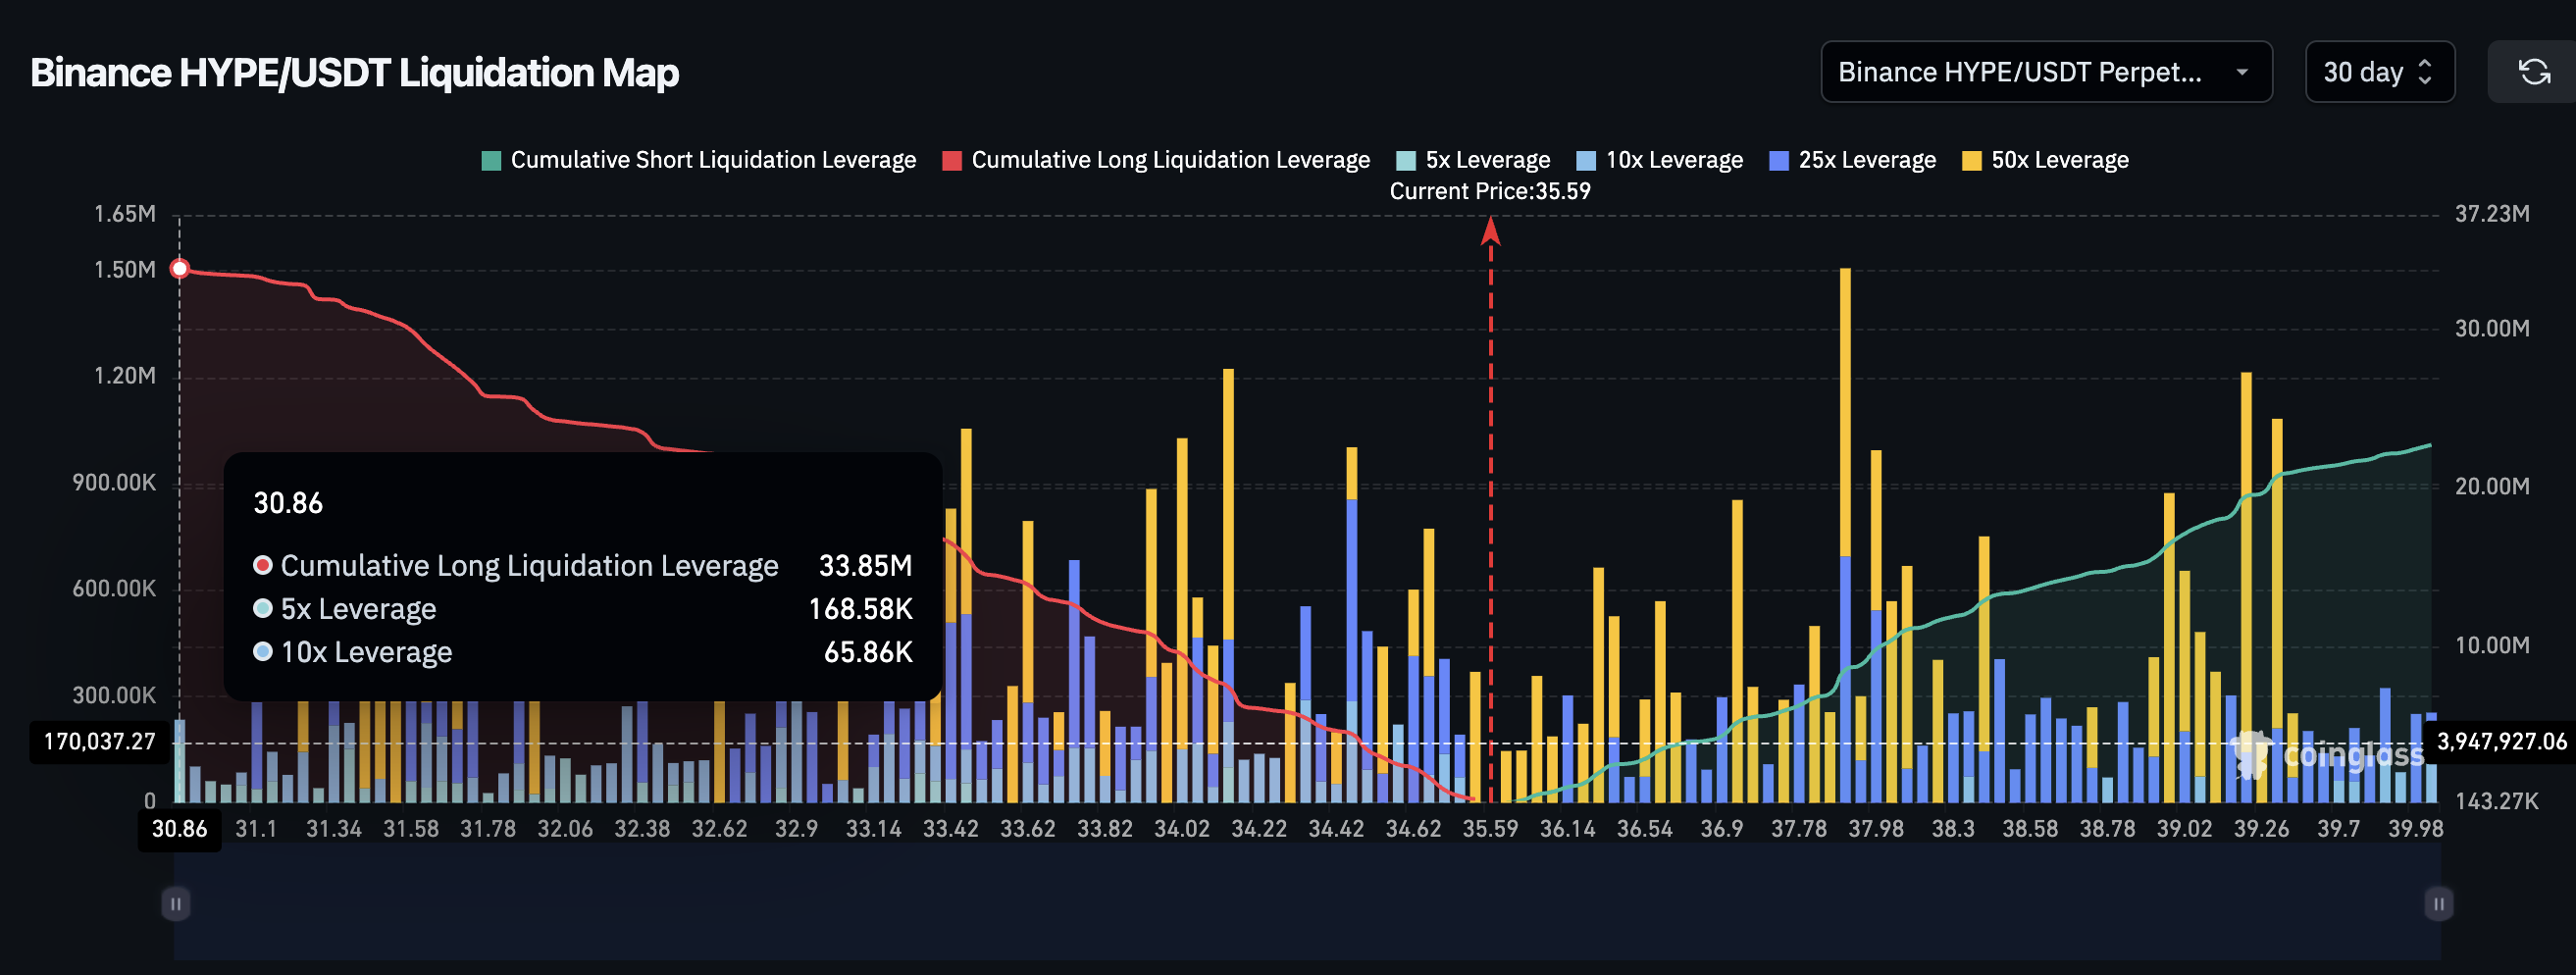
The Binance HYPE/USDT liquidation map adds an important layer that complicates the bearish timeline. Over the past seven days, the HYPE liquidation picture is heavily skewed toward shorts. Cumulative short liquidation leverage stands at $23.92 million, while long liquidation leverage sits at just $7.92 million. That roughly 75% tilt toward shorts means even a modest upward price move could trigger a cascade of forced short closures, temporarily pushing Hyperliquid price higher.
This short-heavy 7-day positioning likely exists because the past week’s 8% decline already flushed most of the recent long positions through liquidations. What remains are new shorts betting on continued weakness.
Want more token insights like this? Sign up for Editor Harsh Notariya’s Daily Crypto Newsletter here.
However, the 30-day liquidation map flips the picture. Over that timeframe, cumulative long leverage is $33.85 million against $22.73 million in shorts.
The roughly 30% tilt toward longs means the broader positioning still favors upside bets. If the bounce driven by 7-day short squeezes fails to reclaim key levels and price resumes its decline, those 30-day long positions become vulnerable. A move toward the neckline at $34.13 could trigger both the pattern breakdown and a fresh wave of long liquidations, accelerating the sell-off.

The liquidation data therefore supports a scenario where the handle extends higher on short-term short squeezes before the broader structure breaks down under the weight of long-biased leverage and declining capital flows.
Hyperliquid Price Levels That Decide the Pattern
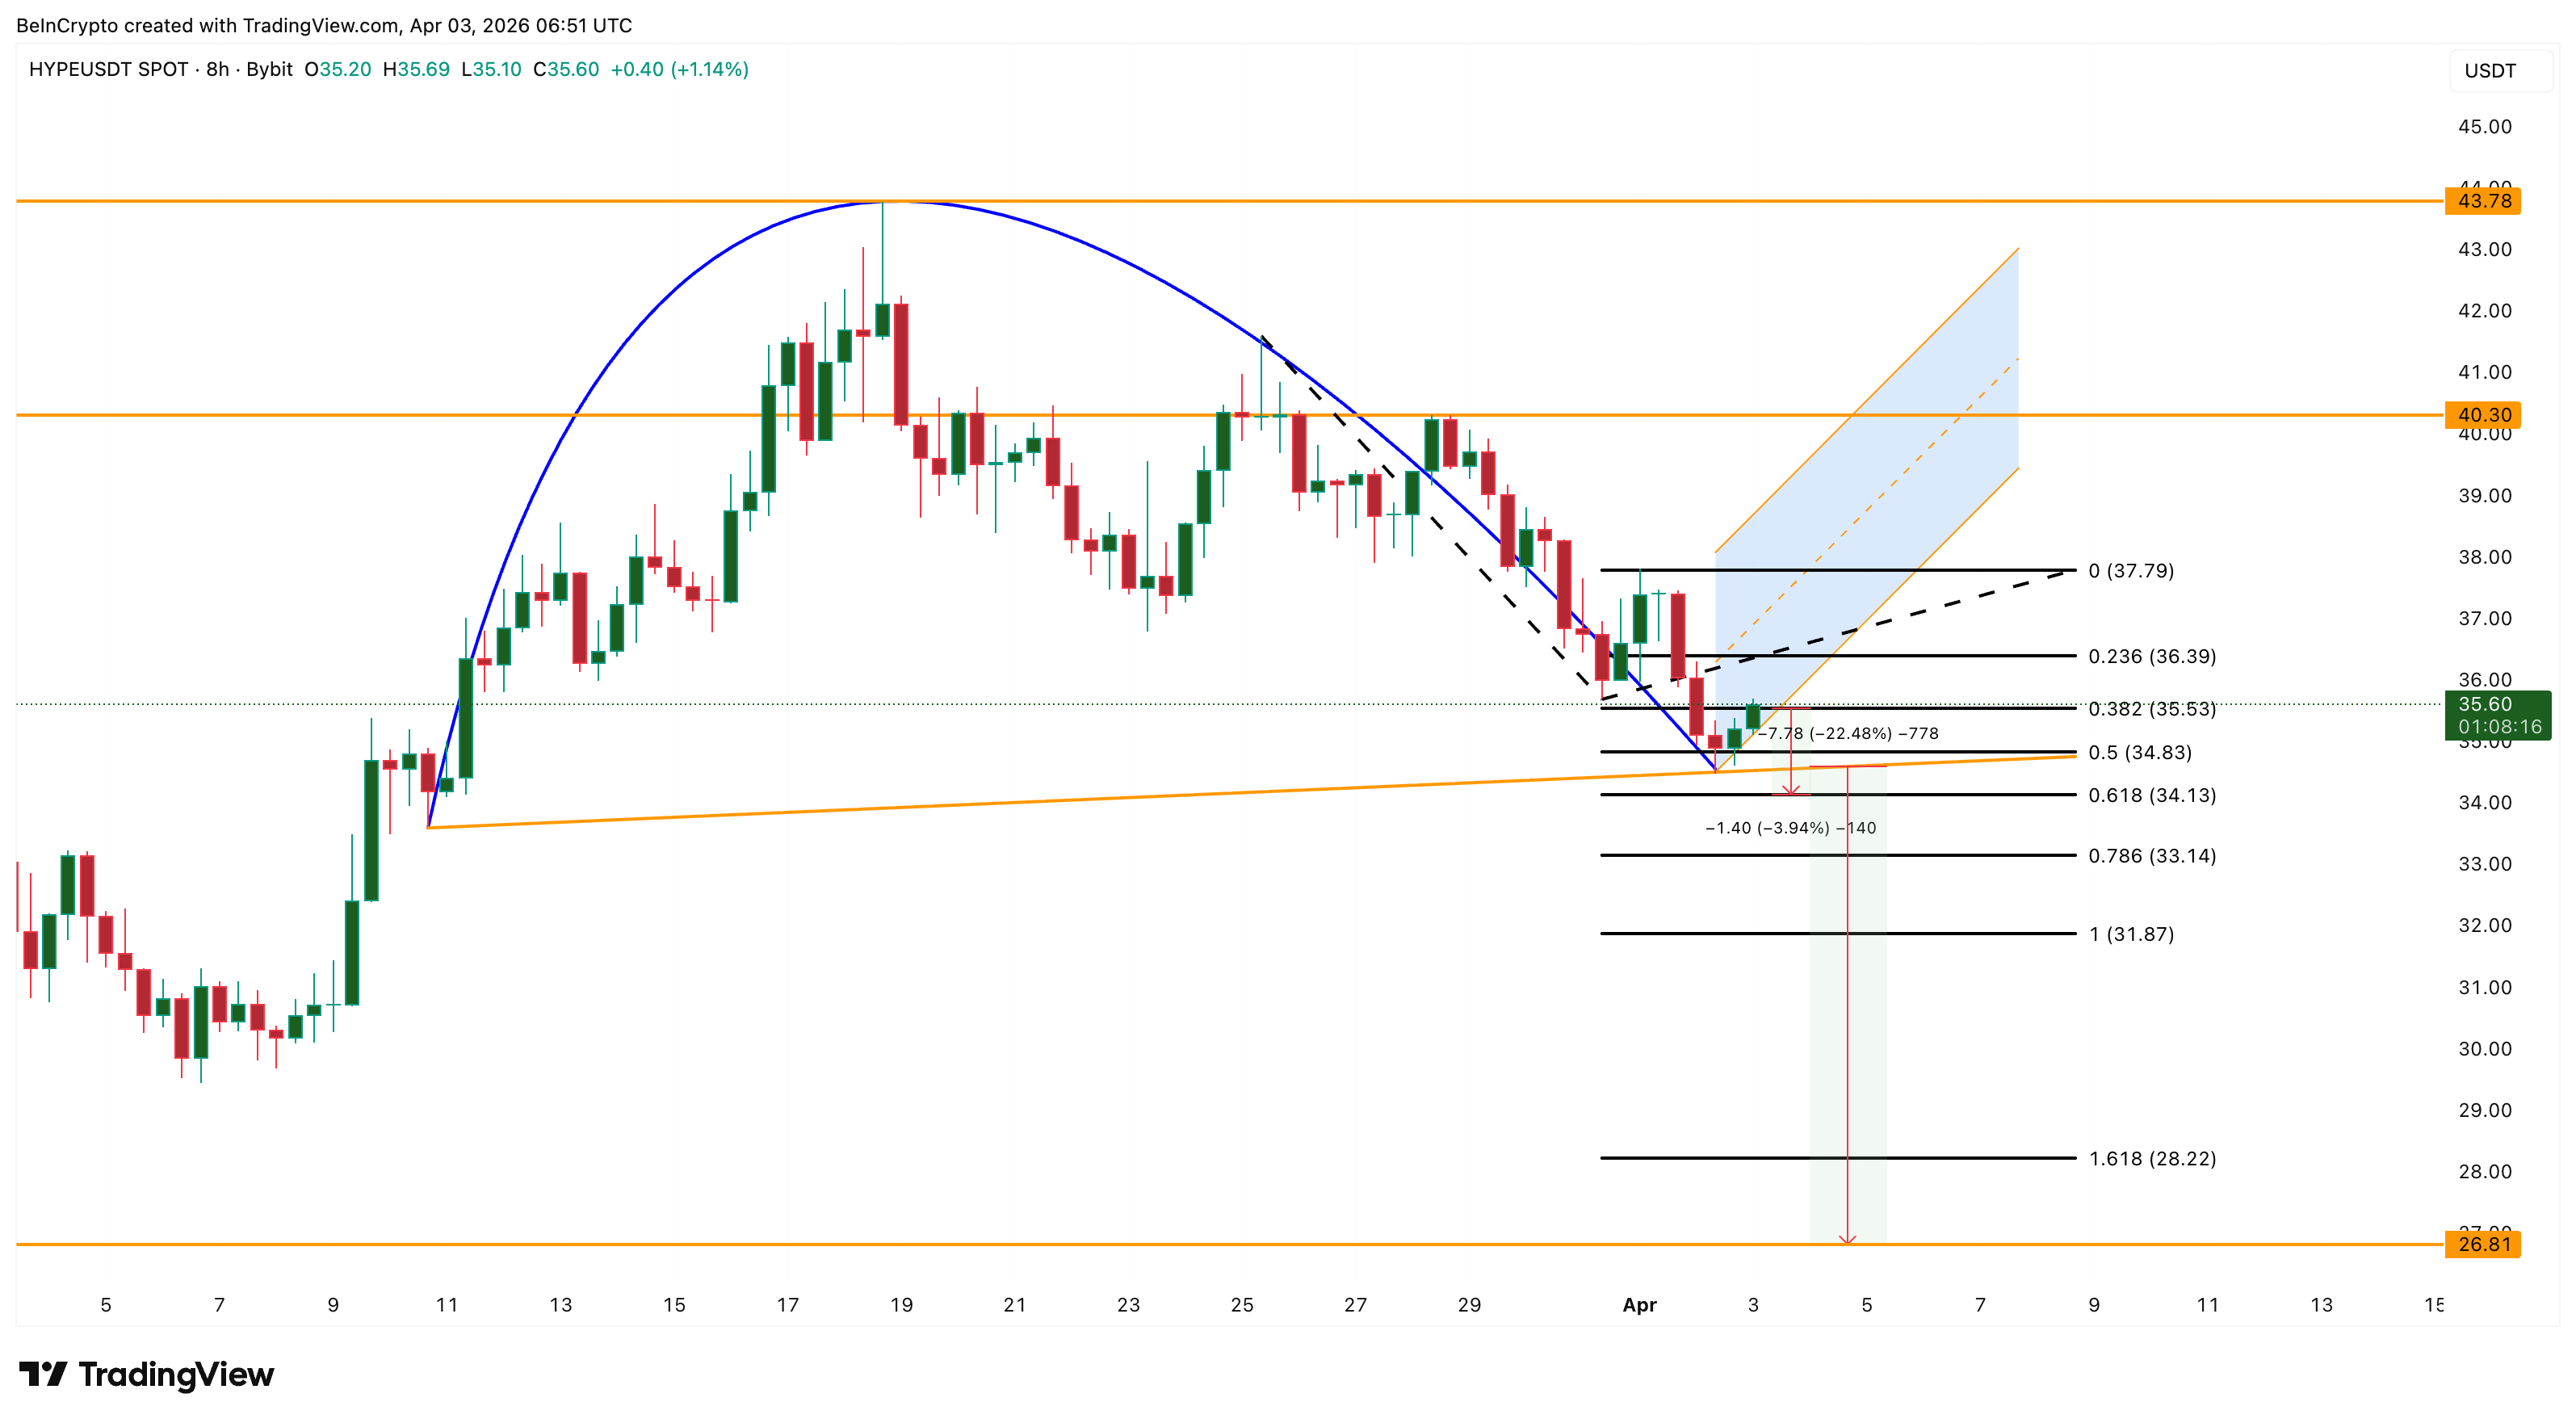
The 8-hour chart with Fibonacci levels frames the path for Hyperliquid price from here. HYPE currently trades at $35.60, sitting between the 0.382 Fib at $35.53 and the 0.236 Fib at $36.39.
For the bounce to gain meaningful traction, HYPE needs to clear $36.39 first, followed by $37.79. A move above $40.30 would weaken the inverse cup and handle structure, and reclaiming $43.78 would invalidate the pattern entirely.
On the downside, $34.83 acts as the immediate floor. A close below $34.13 confirms the neckline break and activates the measured move, projecting a 22% decline that could take HYPE price toward $26.81.
Between $34.13 and $26.81, interim support sits at $33.14, $31.87 and $28.22.
Inverse cup and handle patterns do not always complete. The short-heavy 7-day liquidation setup could produce a squeeze that pushes price above the handle, delaying or invalidating the breakdown. However, the combination of falling CMF, shrinking AUM, negative USDC flows, and a long-biased 30-day leverage structure all suggest the bounce is more likely a pause than a reversal.
A close below $34.13 separates a temporary squeeze-driven bounce from a pattern-confirmed decline toward $26.81. But reclaiming $40.30 would be the first evidence of near-term strength.
The post Hyperliquid Price Rallied 13% but the Money Underneath Tells Another Story appeared first on BeInCrypto.


Nasdaq-listed Bitcoin miner Riot Platforms sold 3,778 BTC in the first quarter of 2026, generating roughly $289.5 million in net proceeds.
Riot Platforms, a major publicly traded Bitcoin mining company listed on Nasdaq, sold 3,778 BTC during Q1 2026, netting approximately $289.5 million in proceeds. The sale represents a significant reduction in the miner’s Bitcoin holdings and marks a notable shift in the company’s position management strategy.
The move aligns with broader selling activity across the Bitcoin mining sector. Multiple publicly traded miners have collectively sold more than 15,000 BTC in recent months, signaling increased liquidation pressure within the industry.
Sources: Riot Platforms
This article was generated automatically by The Defiant’s AI news system from publicly available sources.


A lawyer who helped Kalshi win a key court fight against the federal government now helps the federal government protect Kalshi from state attorneys general.
Yaakov Roth, a former Jones Day white shoe lawyer who represented Kalshi in the landmark KalshiEX v. Commodity Futures Trading Commission (CFTC) case, appeared by name on federal complaints filed yesterday against Illinois, Arizona, and Connecticut.
His current title is now Principal Deputy Assistant Attorney General, Department of Justice (DOJ) Civil Division. These federal lawsuits argue that state gambling laws should have little jurisdiction over prediction markets due to the CFTC’s oversight.
In essence, the suits are attempts by the CFTC to protect Kalshi from state-level actions.
Roth joined the DOJ in February 2025. He had already secured a pivotal victory in late 2024 when the DC Circuit denied the CFTC’s emergency stay against Kalshi’s event contracts contingent on US elections. In January 2025, Roth argued the full appeal, then joined DOJ. The CFTC later dropped its appeal against Kalshi in May 2025 in a victory for Roth.
The Biden-era CFTC disapproved of Kalshi’s proposed congressional control election contracts in 2023. Kalshi then sued the CFTC, challenging that decision. By May 2025, the Trump-era CFTC voluntarily dropped the commissioners’ appeal.
Now at the US government’s DOJ instead of Kalshi’s law firm Jones Day, Roth has been found on a team on the other side of the “v.” (versus) separator in lawsuit titles involving Kalshi.
The Kalshi-government lawyer pipeline
Roth is not the only former Kalshi lawyer to land a government job.
Eliezer Mishory, Kalshi’s former General Counsel lawyer, stepped down in March 2025 to take a DOGE-linked role at the SEC, where his title is Senior Advisor to the Chairman.
Mishory previously worked at the CFTC under Brian Quintenz.
Read more: Are Polymarket and Kalshi decentralized?
Quintenz, a former CFTC commissioner, has sat on Kalshi’s board since 2021.
Trump nominated Quintenz as Chairman of the CFTC in February 2025. However, his nomination was withdrawn in September 2025 amid mounting concerns, such as documents obtained by Freedom of Information Act (FOIA) requests revealing his incoming staff seeking CFTC information about Kalshi’s competitors or the Winklevoss twins lobbying Trump directly against his candidacy.
Kalshi also has another strong connection to the White House via Donald Trump’s son, Donald Trump Jr. He has served as an advisor to Kalshi and as an advisory board member of Polymarket; additionally, he is an investor in Polymarket through a venture capital firm, 1789 Capital.
The federal government that sued Kalshi now cushions it from states
Kalshi CEO Tarek Mansour celebrated Roth’s DOJ appointment on LinkedIn. “Without Yaakov Roth’s legal guidance and leadership, prediction markets in America wouldn’t be where they are today,” Mansour wrote. He called Roth “arguably one of the best appellate litigators in the country” and added, “We couldn’t be more excited for him and his next journey at the DOJ.”
Indeed.
The three state-level lawsuits involve cease-and-desist letters to Kalshi, Polymarket, and other prediction market operators.
Arizona went furthest. It filed 20 criminal charges against Kalshi in March 2026, including four counts of election wagering.
CFTC Chairman Michael Selig, a Trump appointee, declared in February that the agency would “no longer sit idly by” while states challenged its authority. His Innovation Advisory Committee includes executives from Kalshi, Polymarket, FanDuel, and DraftKings. Its 35 members are almost entirely industry executives.
Sports betting accounted for the majority of Kalshi’s trading volume in recent months. The company reported over $1 billion in Super Bowl trading volume alone. States call those trading contracts gambling. The Trump administration calls them non-gambling derivatives or prediction markets; specifically, it considers them commodity event contracts.
The question is probably not whether the revolving door between Kalshi and federal agencies spins. It is whether any lawyer, or anyone, plans to stop it.
Got a tip? Send us an email securely via Protos Leaks. For more informed news, follow us on X, Bluesky, and Google News, or subscribe to our YouTube channel.


AI launchpad Clanker’s new ecosystem fund will recycle most protocol fees on Base into CLANKER buybacks, grants, and infra for Farcaster’s creator community.
Summary
- AI launchpad Clanker, now owned by Neynar via its acquisition of Farcaster, has launched the Clanker Ecosystem Fund to recycle protocol fees back into builders.
- The fund has already deployed $8 million to buy 14% of the CLANKER supply, with future fees earmarked for infrastructure and community initiatives across Clanker and Farcaster.
- Clanker has generated over $50 million in cumulative protocol fees on Base since late 2024, cementing it as one of the highest‑earning SocialFi primitives.
AI‑driven token launchpad Clanker has unveiled the Clanker Ecosystem Fund (CEF), committing to redirect a significant share of protocol fees to creators, infrastructure teams and communities building on Clanker and Farcaster. Neynar, which is acquiring decentralized social protocol Farcaster and its associated assets, now controls Clanker’s contracts and treasury, with Farcaster co‑founder Dan Romero saying the package “adds even stronger commercial returns” thanks to Clanker’s fee machine on Base. Operated as an autonomous AI launchpad on Coinbase’s Base network, Clanker has already generated more than $50 million in cumulative protocol fees since its late‑2024 launch, according to KuCoin and BingX research.
In its latest update, Farcaster disclosed that “$8 million has already been used to purchase 14% of CLANKER,” effectively converting a chunk of past protocol fees into long‑term exposure to the launchpad’s native asset and its community. That build on earlier commitments laid out when Farcaster first acquired Clanker in October 2025, where the team pledged that “two‑thirds (2/3) of the current and future fees in the Clanker ecosystem will be allocated to purchase and redeem tokens $CLANKER,” while around 7% of supply was locked in one‑sided liquidity to deepen markets.
Farcaster summarized the model on X by noting that Clanker had already used “two‑thirds of the protocol fees generated in the previous day to purchase approximately $65,000 worth of CLANKER tokens,” with the remaining third held in USDC for tax obligations, and said the buyback process would be automated over time. According to KuCoin’s coverage of the protocol, Clanker’s fee engine is powered by a 1% transaction fee on tokens it deploys, with 40% of that going to token creators and 60% to the protocol—funds that CEF will now recycle into grants, infrastructure and additional buybacks.
Clanker runs as an AI agent embedded in the Farcaster social graph, allowing users to mint and list ERC‑20 tokens on Uniswap V3 simply by tagging the bot in a cast, which then handles minting, WETH pairing and LP token locking until 2100. KuCoin and BingX both highlight that this model has turned Clanker into a “yield‑generating machine for the Base network,” with weekly protocol fees recently surpassing $8 million on record weeks and daily token launches pushing toward 13,000.
As Neynar absorbs Farcaster’s infrastructure and Clanker’s revenue stream, analysts at outlets such as Bankless argue the deal effectively makes Neynar a core economic node for Base‑native SocialFi, even as Merkle Manufactory returns roughly $180 million in raised capital to investors. Within that context, CEF’s decision to route tens of millions of dollars in protocol cash flow back into creators and infra looks less like a marketing stunt and more like an attempt to hard‑wire “real yield” and long‑term loyalty into one of Base’s most profitable—and most copy‑pasted—AI launchpad designs.
President Trump’s April 1 address on the Iran war promised two to three more weeks of intense military strikes, reversing a two-day stock market relief rally and sending oil above $110 per barrel.
The speech divided US stocks into clear winners and losers. BeInCrypto analysts identified three stocks where the impact was most visible. The list includes one energy name riding the war premium higher.
The list also has two oil-dependent companies whose recoveries were cut short within hours. The selection is based on price reaction, chart structure, and the degree to which each business model directly connects to sustained oil prices.
APA Corporation (NASDAQ: APA)
APA Corporation (APA) is among the US stocks that have benefited most directly from the Iran conflict. As a pure-play oil and gas exploration and production (E&P) company, every dollar increase in crude flows almost directly to APA’s bottom line.
Trump’s pledge to continue strikes and his threat to target Iran’s energy infrastructure signal sustained supply disruption, which supports elevated crude prices for the foreseeable future.
The daily chart shows that APA has rallied approximately 96% since early January, forming a clear pole-and-bull-flag pattern. Since March 30, prices have consolidated inside a flag.
Chaikin Money Flow (CMF), a proxy for institutional buying and selling pressure, has been consistently making higher highs throughout the rally, currently reading 0.18.
That persistent institutional inflow confirms that big money is backing the move rather than fading it.

On April 2, APA’s share price peaked at $43.93 but failed to break the upper trendline of the flag. A clean close above $43.98 would confirm the breakout and target $49.80 initially, followed by $55.63 and $65.06 on the extended projection.
However, a break below $40.38 would end the flag prematurely, though a full invalidation of the bullish structure would require a move below $31.56.
Carnival Corporation (NYSE: CCL)
Carnival Corporation (CCL) sits on the opposite end of the oil price chain. As the world’s largest cruise operator, fuel represents one of its highest variable costs.
Rising oil compresses margins directly, while sustained geopolitical uncertainty dampens consumer willingness to book voyages, creating a double headwind that few sectors absorb as severely.
Since peaking at $34.05 on February 6, Carnival stock has been trading inside a bearish descending channel on the daily chart. It fell approximately 10% over the past month as oil prices climbed.
A bullish divergence had been forming from mid-November to late March, in which the price made a lower low while the Relative Strength Index (RSI), a momentum oscillator, made a higher low.
That divergence suggested weakening sell-side momentum and triggered a bounce as de-escalation hopes lifted markets earlier in the week.
Trump’s speech reversed the setup. The bounce stalled, and prices fell 3.54% on April 2 as the two-to-three-week war extension reignited fears of prolonged $110 oil.
The bullish divergence technically remains intact, meaning a recovery is still possible if de-escalation resurfaces. However, the path of least resistance points lower as long as oil stays elevated.
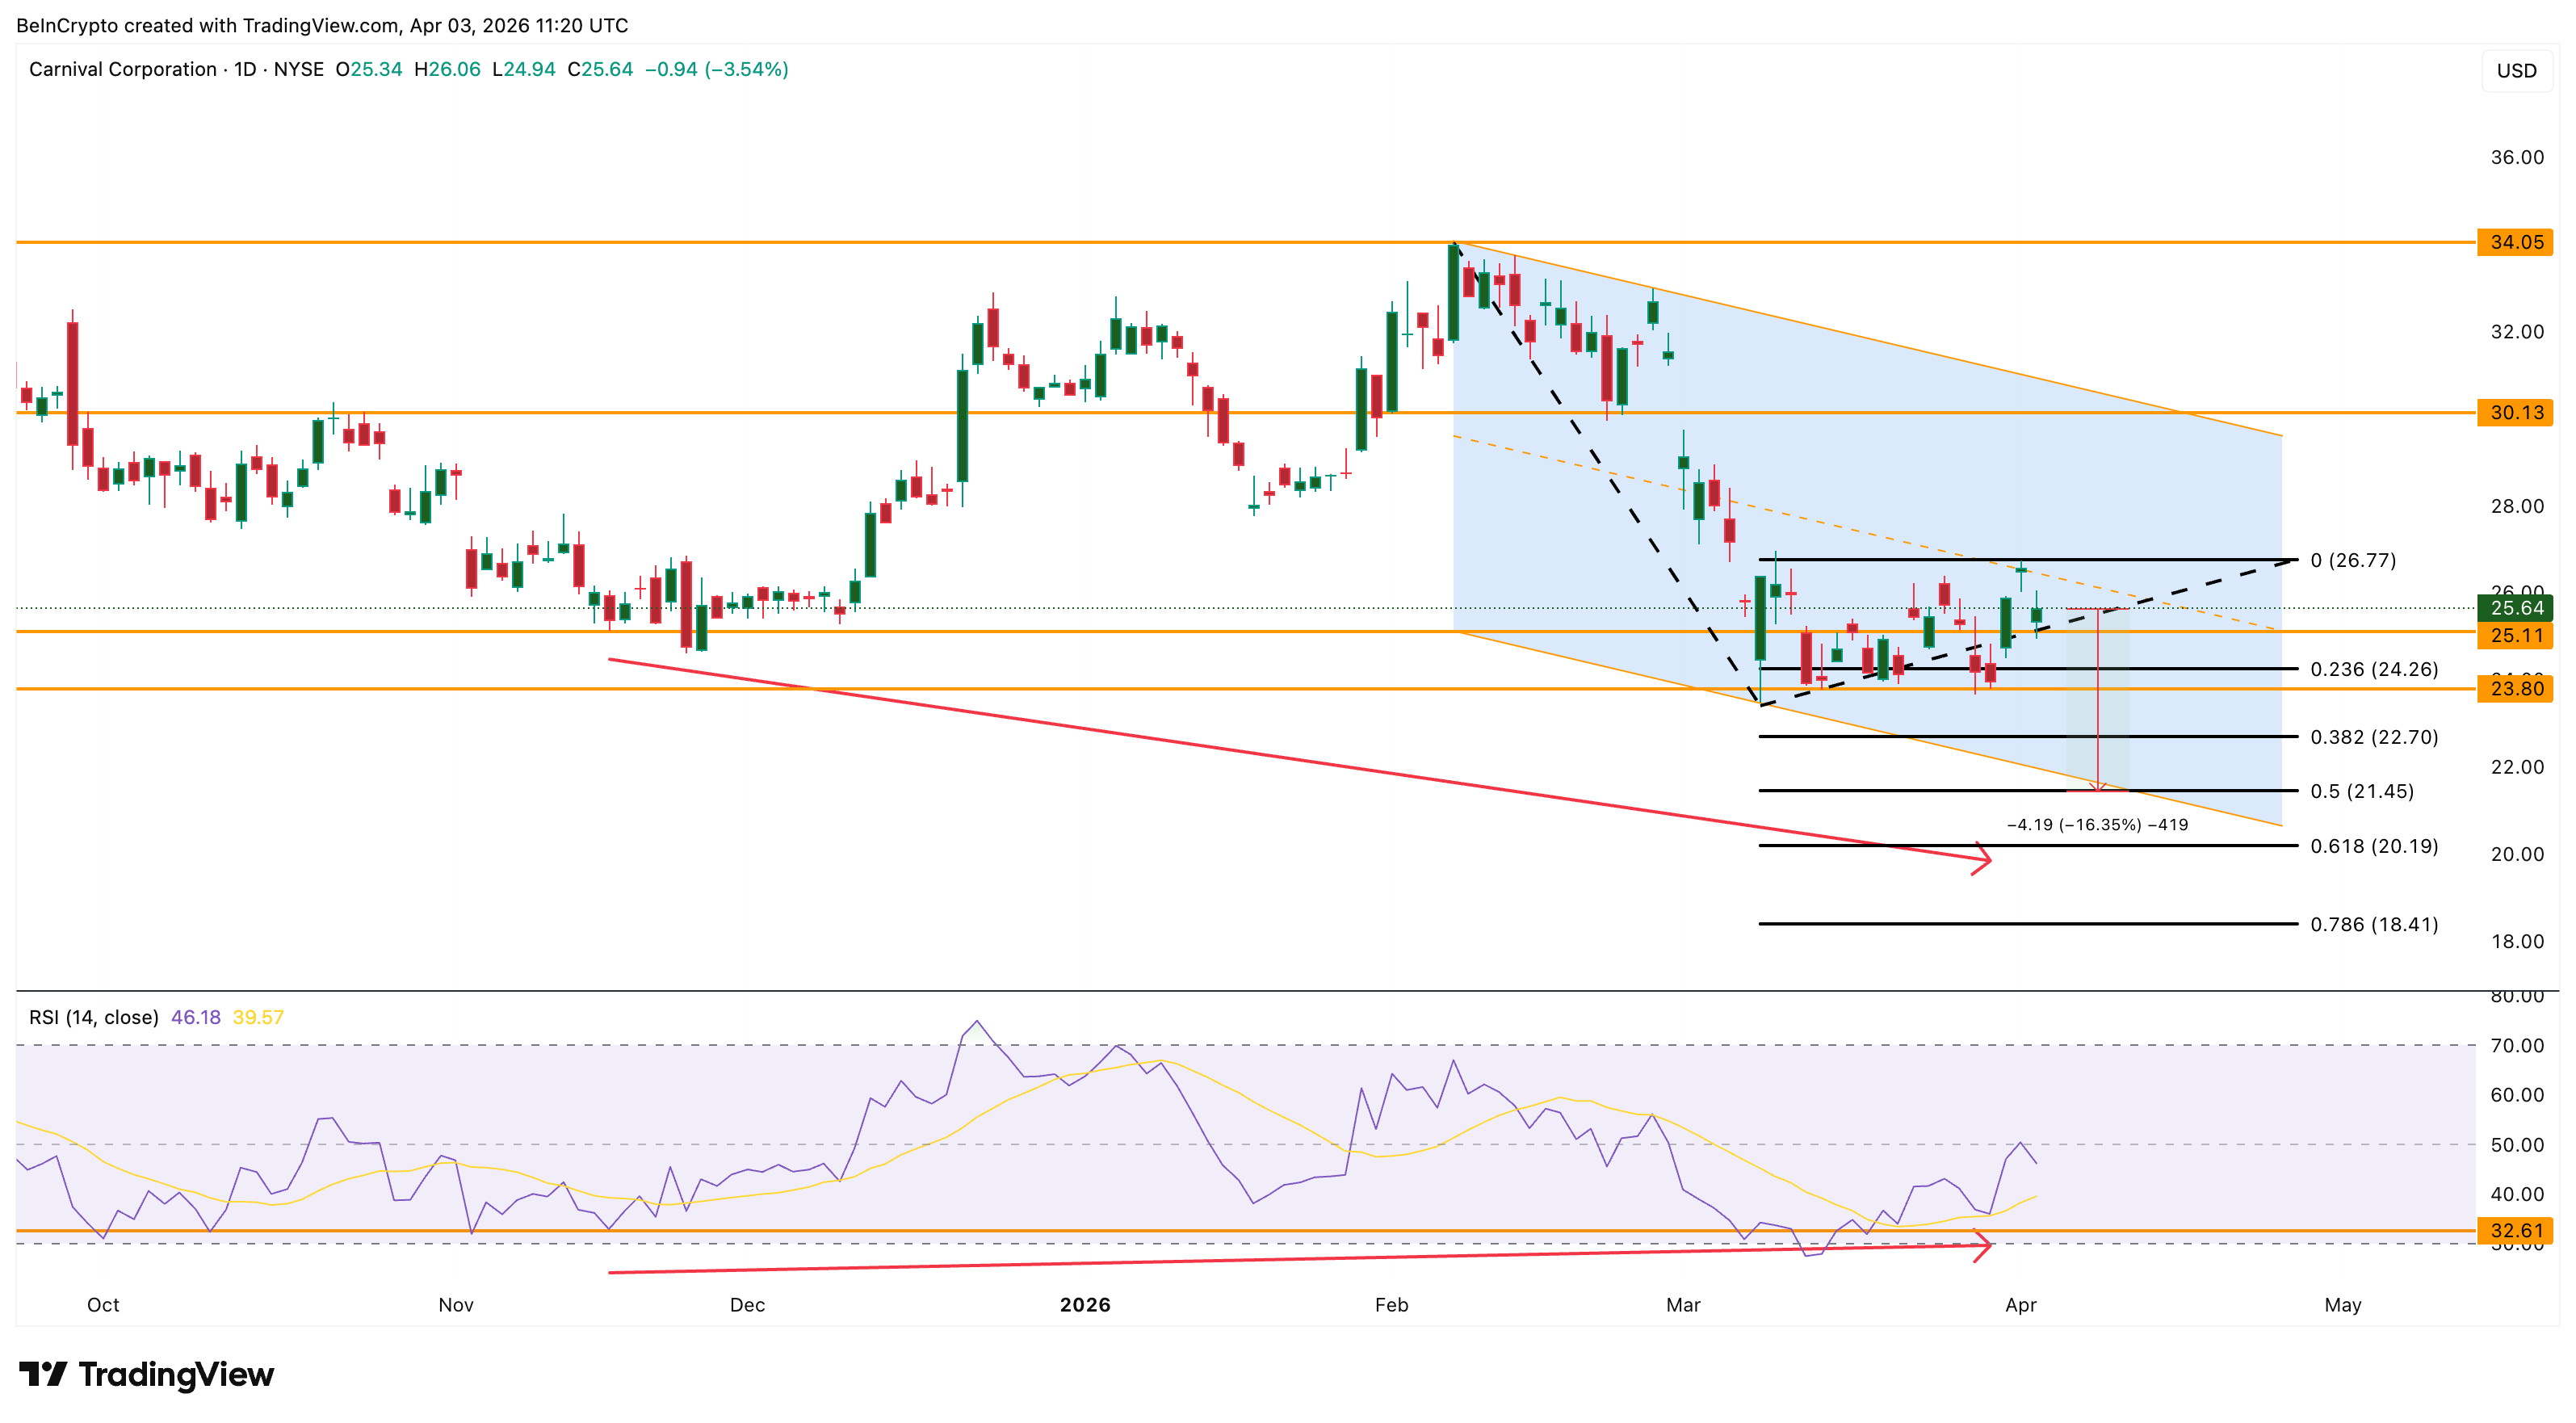
A move above $26.77 would begin to shift momentum, with $30.13 as the level that turns the structure neutral. On the downside, $23.80 acts as immediate support.
A break below $21.45 would confirm a pattern breakdown and open the path toward $20.19 and $18.41.
United Airlines Holdings (NASDAQ: UAL)
United Airlines Holdings (UAL) experienced perhaps the most dramatic whiplash among US stocks this week. Jet fuel typically accounts for 25-35% of an airline’s operating expenses, making airline stocks among the most oil-sensitive equities in the market.
When oil rises, margins compress immediately because airlines cannot pass fuel costs to passengers fast enough through surcharges.
Between March 27 and April 1, UAL’s share price surged 14%. De-escalation hopes pushed oil lower and lifted the entire travel sector. That rally brought the price back above the 20-day Exponential Moving Average (EMA), a short-term trend indicator that gives greater weight to recent price action, at $93.71.
Trump’s speech erased the recovery. UAL fell approximately 8% from its April 1 high, closing at $92.21 on April 2, a 3% daily loss. The drop pushed the stock back below the 20-day EMA, which matters because the last time UAL reclaimed it on February 3, it preceded a 9% rally. Losing it now removes that short-term floor.
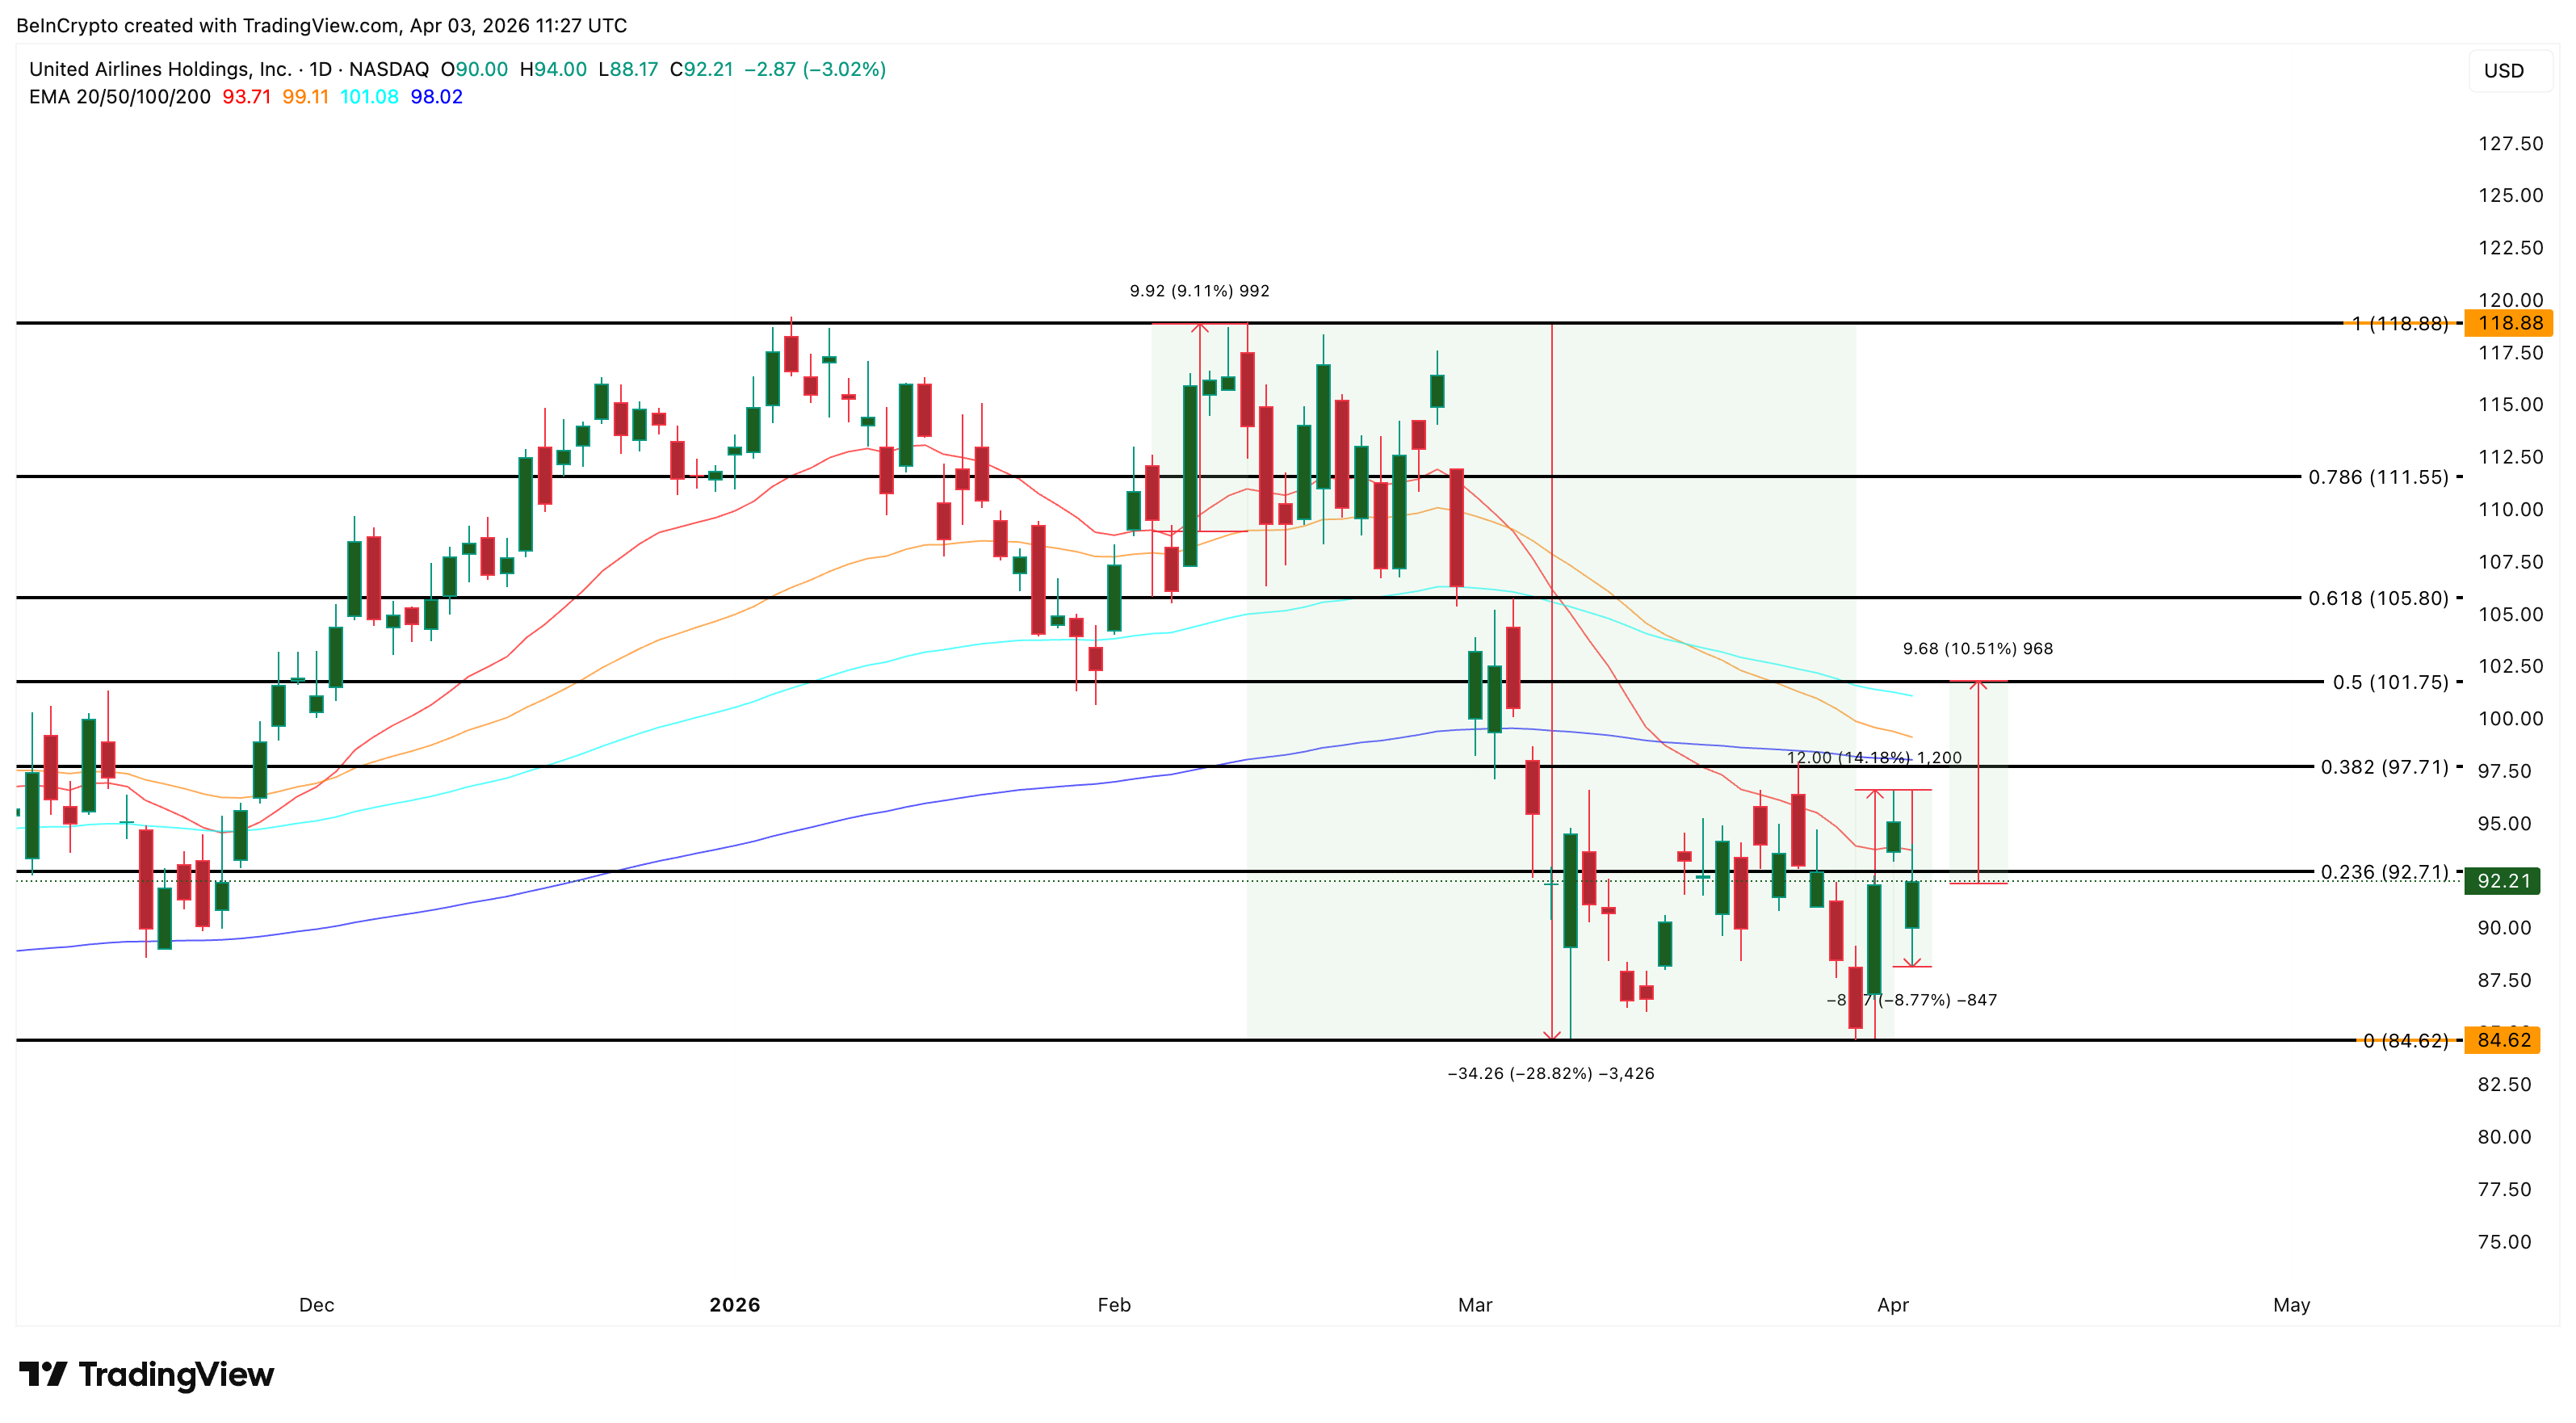
The broader damage is substantial. Since early February, UAL has fallen 28%. Right from $118.88 to its March 30 low of $84.62. The dip was driven entirely by oil-related margin fears.
If markets reopen on Monday with positive developments, reclaiming $93.71 would restore the 20-day EMA floor.
Above that, $97.71 and $101 become the next targets, with $101.75 aligning closely with the 50-day and 100-day EMAs. A move above $101.75 would place UAL above every major moving average for the first time since early February.
However, if oil stays above $110 and the war timeline extends, $84.62 remains the floor. A break below that level exposes deeper downside.
The post 3 US Stocks Heavily Affected by Trump’s Iran Speech This Week appeared first on BeInCrypto.
Decentralized email platform Dmail Network has announced it will shut down after five years of operation, citing escalating infrastructure costs, weak monetization, failed fundraising efforts, and limited token utility. The company said it will gradually cease all services starting May 15, and urged users to export their data before then, as all nodes will be shut down afterward, rendering emails and accounts inaccessible.
Positioning itself as a Web3 communication tool built around wallet-based email, encrypted messaging, and on-chain notifications, Dmail had aimed to demonstrate that decentralized infrastructure could scale with user demand. In January 2025, Dmail’s profile among AI DApps surged; DappRadar ranked the project second in that category for the month, reporting 4.9 million unique active wallets. Despite the early momentum, Dmail’s founders say expanding operational costs outpaced monetization and investment, ultimately undermining the project’s sustainability.
Key takeaways
- In its shutdown notice, Dmail Network says it will begin winding down services on May 15, with all nodes going offline thereafter, effectively ending access to emails and accounts on the platform.
- Infrastructure costs—covering bandwidth, storage, and compute—consumed a growing share of the budget as the user base expanded, while the project failed to identify a scalable paid model or monetization path.
- Funding rounds failed to materialize, acquisitions fell through, and staff departures left the team unable to maintain critical infrastructure or push a viable economic model.
- The project’s token never achieved a clear, scalable use case, and its economic design did not establish a self-sustaining loop; the token price subsequently hit an all-time low.
- Tonight’s news sits within a broader pattern of Web3 project closures, reflecting a challenging environment for infrastructure-heavy, user-reliant services.
Escalating costs vs. decentralized promises
At the heart of Dmail’s exit lie the economics of running a decentralized communication platform at scale. The shutdown notice emphasizes that bandwidth, storage, and computing resources form the majority of operating expenses, costs that grow as more users come online. While decentralization can reduce reliance on centralized servers, it does not eliminate the physical requirements of delivering reliable, globally accessible services. The company notes that despite exploring various monetization avenues, it could not secure a business model that users were willing to support at scale.
The experience underscores a recurring tension in the space: the ambition to offer censorship-resistant, privacy-preserving communications often collides with the costs of maintaining robust infrastructure and a sustainable economic engine. Even with strong early user engagement, especially for crypto-native applications that rely on on-chain primitives or specialized services, the path to profitability remains uncertain without durable monetization or external capital cycles.
Funding headwinds and the token narrative
Dmail’s leadership pinpoints financing challenges as a critical contributor to the shutdown. Multiple fundraising rounds did not close, and strategic acquisitions that might have bolstered the platform’s capital runway did not come to fruition. When coupled with ongoing staff churn and the resulting strain on maintenance capabilities, the project’s ability to keep its infrastructure online deteriorated over time.
Compounding the financial strain was the token’s performance, which failed to translate into a compelling, large-scale use case. The project’s native token did not establish a durable economic design that could support a self-sustaining ecosystem, according to the shutdown note. After the announcement, the token price retraced to all-time lows, with data from CoinGecko showing a slide to about $0.0002067 per token. This dynamic mirrors a broader market pattern where tokenomics and real utility struggle to align with high operational costs and user expectations.
Context within a challenging Web3 landscape
Dmail’s exit comes amid a wave of closures that illustrates the current fragility of some Web3 native services, particularly those that depend on sustained infrastructure beyond simple software deployments. Earlier in March, DAO tooling platform Tally announced a wind-down, citing a lack of a viable market for its products. A week later, Balancer Labs reported shutting down parts of its protocol four months after a major exploit drained more than $100 million. While each case has its own specifics, the trend underscores a critical point for builders in this space: without a durable path to revenue and resilience against funding cycles and security incidents, even technically innovative projects can struggle to endure.
For users, developers, and investors, Dmail’s experience reinforces the importance of aligning decentralization promises with practical, scalable economics. It also highlights the need for clear exit strategies and data portability when services decide to wind down, ensuring users can preserve important communications and records before shutdowns take effect.
In sharing its decision, Dmail urged users to export data ahead of May 15, and suggested that anyone relying on the service prepare for discontinuation of access as the network’s nodes go offline. For observers, the episode serves as a reminder that the most ambitious technical visions must be matched by disciplined business models and sustainable funding paths if they are to endure in a competitive crypto ecosystem.
Looking ahead, readers will want to monitor how remaining Web3 communication projects address the dual pressures of infrastructure costs and monetization. Will new models emerge that better balance decentralization with long-term sustainability? And how will the broader market’s appetite for funding, partnerships, and user growth shape the next generation of crypto-enabled communication tools?
Crypto World
Taiwan Semiconductor (TSM) Stock: March Revenue Report Set to Test AI Supply Chain Limits

Key Takeaways
- March 2026 revenue data from TSMC drops April 10, offering critical insight into whether supply can match AI chip demand
- Revenue surged 37% year-over-year in January; February posted 22% YoY growth but fell 21% month-over-month due to seasonal patterns
- Broadcom has publicly identified TSMC’s production capacity as a constraint limiting AI hardware rollouts
- Taiwan’s energy dependence—importing roughly 95% of its supply—faces new threats from Middle East instability affecting the Strait of Hormuz
- The chipmaker is scaling its U.S. presence with a massive $165 billion Arizona buildout featuring 12 fabrication and packaging facilities
Taiwan Semiconductor Manufacturing (TSM) stands at a critical juncture. The company’s March 2026 monthly sales figures, scheduled for release on April 10, will provide investors with crucial visibility into the health of AI semiconductor demand.
Taiwan Semiconductor Manufacturing Company Limited, TSM
This upcoming data release carries extra weight because it will reveal whether TSMC can translate explosive AI chip orders into actual production output. That question has grown increasingly complex in recent weeks.
For the better part of a year, the investment thesis around chip stocks has been straightforward: AI demand climbs, revenues climb with it. But that clean narrative is starting to fracture. Manufacturing bottlenecks and international tensions are now sharing the spotlight with order books.
TSMC commands approximately 72% of the worldwide contract chipmaking market, positioning it as the indispensable partner in the AI semiconductor ecosystem. Nvidia, Apple, and numerous other tech giants rely on TSMC’s cutting-edge manufacturing capabilities.
Recent financial performance has been robust. January 2026 sales climbed 37% compared to the prior year. February showed a 22% year-over-year increase, though monthly revenue declined 21% from January—a predictable seasonal dip rather than a warning sign.
Taken together, the first two months of 2026 demonstrated nearly 30% year-over-year revenue expansion. That momentum sets high expectations for the March figures.
Production Constraints Emerge as Primary Challenge
Broadcom hasn’t minced words: TSMC’s manufacturing capacity is creating a genuine constraint. As cloud providers and major corporations shift from AI pilots to production-scale implementations, the flood of chip orders is bumping against the physical limits of TSMC’s fabrication facilities.
This capacity squeeze is now intersecting with heightened international instability. Tensions involving Iran have interrupted energy shipments through the Strait of Hormuz—a vital passage responsible for roughly 20% of worldwide petroleum and liquefied natural gas transport.
Taiwan relies on imports for approximately 95% of its energy needs, with natural gas accounting for about 48% of the island’s power generation mix. Any interruption to fuel deliveries creates immediate production risk for semiconductor manufacturing operations.
Compounding these challenges, a global helium shortage continues to intensify. Helium plays a critical role in chip production processes, and reduced supplies create another headwind for output volumes.
Massive U.S. Expansion Gains Momentum
On the capital investment front, TSMC is accelerating its American footprint. The company has expanded its Arizona commitment to $165 billion, outlining plans for a dozen wafer fabrication and chip packaging plants.
Capital spending for 2026 is forecast between $52 billion and $56 billion, fueled primarily by the expensive transition to advanced N2 process technology and the company’s worldwide facility expansion strategy.
Production costs in the United States run two to three times higher than comparable operations in Taiwan. Nevertheless, Taiwanese equipment and material suppliers are pressing forward—processing work visas, building local teams, and committing to long-term contracts despite compressed profit margins in the short term.
Supply chain partners who moved early are offering premium compensation packages to secure skilled workers, wagering that future production volumes will justify today’s elevated investment.
The April 10 revenue announcement will serve as the first significant indicator of whether TSMC’s manufacturing infrastructure can maintain pace with order flow—and whether the substantial Arizona investment is beginning to generate returns.


Binance told the Senate its transaction volume with four major Iranian exchanges did not exceed $110,000 last year. Reporting from Fortune and the New York Times traced $1.7 billion in flows from Binance-linked accounts to Iran-linked entities.
Senator Richard Blumenthal now is concerned that the exchange might have misled Congress about that.
In a follow-up letter to Binance co-chief executive (CEO) Richard Teng, Blumenthal expressed his concern that the exchange might have provided “misrepresentations or misleading information to the Subcommittee and to the public.”
Read more: Binance probed by DOJ files lawsuit against WSJ
The senator, the ranking Democrat on the Senate Permanent Subcommittee on Investigations, demands Binance produce documents justifying its prior March 6th response and its $110,000 claim.
The escalation follows weeks of reporting by Fortune’s Leo Schwartz and Ben Weiss, as well as the New York Times. Their investigations traced hundreds of millions in tether (USDT) from Binance accounts to wallets tied to Iran’s Islamic Revolutionary Guard Corps (IRGC) and the Houthis of Yemen.
Separately, Blumenthal’s original February 24 letter also inquired about payments to crew members of Russia’s sanctions-evading oil fleet.
The $110,000 claim versus $1.7 billion in flows
Binance dismissed the allegations on March 6 as “demonstrably false, unsupported by credible evidence, and defamatory in several material respects.”
The exchange said its direct transactions with four Iranian exchanges had fallen to no more than $110,000 across the year. Binance highlighted its proactive work against two intermediaries, Hexa Whale and Blessed Trust, to limit “indirect exposure to wallet addresses with potential ties to Iran.”
Blumenthal’s new letter questions that corporate framing.
He asks about Fortune’s reporting of a VIP account registered to a 79-year-old Chinese resident moving $439 million in USDT from Binance to an outside wallet. That wallet forwarded most of those funds to Entity A, an intermediary cluster that Fortune identified as Iran-linked. Entity A allegedly has a financial connection with Nobitex, for example, Iran’s largest crypto exchange, as well as IRGC and Houthi wallets.
A second Chinese VIP, an ostensibly 38-year-old woman, allegedly moved nearly $200 million through the same pipeline. Reporters also flagged the possibility that both accounts could have been accessed from the same device.
Worse, Blumenthal’s letter notes that the New York Times reported that Binance labeled some of these accounts with manual instructions, “Don’t block. Internal accounts.”
One Iranian national who sent crypto fees directly to Entity A had appeared in a United Nations Security Council report on smuggling for Iran and North Korea.
Senator gives Binance two weeks to respond
Blumenthal’s letter lays out a timeline of allegations. Binance, the senator says, took two months to respond to law enforcement on Hexa Whale, then took another two months to remove the entity. Blessed Trust, even worse, allegedly lasted at least five months as a Binance vendor despite warnings about its alleged terrorist financing.
The senator now demands exact dates. When did these entities open Binance accounts, start transfers, receive flags from Binance staff, and become subjects of suspicious activity reports to US law enforcement? The senator also asks whether Binance has “removed, weakened, or relaxed any compliance policies” since January 2025.
The letter marks the third major escalation about Binance this year. Blumenthal’s February 24 inquiry called Binance a “repeat offender.” Previously, 11 Senate Democrats urged the Treasury and DOJ to investigate. The Wall Street Journal reported that the DOJ opened a probe into Iran’s use of Binance to evade sanctions.
Binance, meanwhile, has sued the Wall Street Journal for defamation.
The political backdrop makes the compliance issues conspicuous.
President Trump pardoned Binance founder Changpeng Zhao (CZ) in October 2025 after his guilty plea to Bank Secrecy Act violations. The SEC also voluntarily dismissed its Binance lawsuit in 2025.
Binance then became what Blumenthal called a “vital engine” for World Liberty Financial, the Trump family’s crypto venture. Blumenthal’s February letter noted that the vast majority of WLFI’s USD1 stablecoin sat within Binance accounts.
Abu Dhabi’s MGX settled a $2 billion Binance investment through that USD1 stablecoin.
The price of BNB, the token that Binance issued, is down 31% year to date. Binance equity is not publicly traded.
Blumenthal gave Binance CEO Teng until April 14 to respond.
Got a tip? Send us an email securely via Protos Leaks. For more informed news, follow us on X, Bluesky, and Google News, or subscribe to our YouTube channel.

Europe’s cyber agency blames hacking gangs for massive data breach and leak

NORMA Group SE (NOEJF) Q4 2025 Earnings Call Transcript

SBI Ripple Asia Partners with DSRV to Research XRP Payments


-

 NewsBeat7 days ago
The Story hosts event on Durham’s historic registers
-

 NewsBeat21 hours ago
Steven Gerrard disagrees with Gary Neville over ‘shock’ Chelsea and Arsenal claim | Football
-

 Sports7 days ago
Sweet Sixteen Game Thread: Tide vs Michigan
-
Entertainment4 days ago
Fans slam 'heartbreaking' Barbie Dream Fest convention debacle with 'cardboard cutout' experience
-

 Business16 hours ago
No Jackpot Winner and $194 Million Prize Rolls Over
-

 Crypto World2 days ago
Gold Price Prediction: Worst Month in 17 Years fo Save Haven Rock
-
 Entertainment6 days ago
Lana Del Rey Celebrates Her Husband’s 51st Birthday In New Post
-

 Tech5 days ago
The Pixel 10a doesn’t have a camera bump, and it’s great
-
Crypto World3 days ago
Dems press CFTC, ethics board on prediction-market insider trades
-

 Sports3 days ago
Tallest college basketball player ever, standing at 7-foot-9, entering transfer portal
-

 Tech4 days ago
Avatar Legends: The Fighting Game comes out in July and it looks pretty slick
-

 Tech3 days ago
EE TV is using AI to help you find something to watch
-

 Fashion5 days ago
Amazon Sundays: Soft Spring Layers
-

 Business2 days ago
Login and Checkout Issues Spark Merchant Frustration
-

 Fashion7 days ago
When Evening Dressing Gets Colorful for Spring
-

 Tech5 days ago
Elon Musk’s last co-founder reportedly leaves xAI
-

 Tech3 days ago
How to back up your iPhone & iPad to your Mac before something goes wrong
-

 Tech4 days ago
Apple will hide your email address from apps and websites, but not cops
-

 Crypto World4 days ago
U.S. rule change may open trillions in 401(k) funds to crypto
-

 Politics4 days ago
Should Trump Be Scared Strait?
You must be logged in to post a comment Login