

Crypto World
Is Model Valid in 2026?

Bitcoin (CRYPTO: BTC) (BTC) has flashed a bottom signal that mirrors a setup from 2023, just ahead of a roughly 130% surge in 2024. Yet the current environment differs in meaningful ways. Liquidity conditions, ETF inflows, and macro data are shaping how the next phase could unfold, suggesting that the path forward may diverge from the last cycle even as the same price-pattern signals draw attention from traders and analysts.
Key takeaways
- Bitcoin has logged 25 consecutive days in an “extreme high risk” zone, the longest streak on record, a pattern historically associated with late-stage drawdowns or the bottoming phase.
- Historically, a transition from high risk to lower risk has coincided with the start of a powerful bullish expansion, a thesis echoed by observers examining BTC’s interactions with supply in profit/loss metrics.
- Trader positioning appears discordant with an immediate uptrend; 30-day apparent demand has alternated between positive and negative, with selling pressure fading but not yet replaced by sustained buying.
- ETF flow dynamics add to a cautious backdrop: gold ETFs have surpassed spot Bitcoin ETF inflows on a 90-day rolling basis, while Bitcoin funds have posted negative flows over the same horizon.
- Inflation trends remain a constraint. Headline PCE is near 2.9% year over year, with core around 3.0% and core services considerably higher, signalingPersistent liquidity constraints that complicate a rapid liquidity-driven rally.
- Price projections for a near-term relief rally suggest a potential push toward the $70,000–$80,000 zone, but several seasoned analysts warn that any such move could meet renewed selling pressure within a broader bearish liquidity regime.
Tickers mentioned: $BTC
Sentiment: Neutral
Market context: The broader crypto environment is being shaped by liquidity dynamics, ETF flows, and macro data that influence risk appetite and the cadence of any recovery in Bitcoin’s price.
Why it matters
The technical signals around Bitcoin’s bottom attempt come at a moment when macro and micro factors are reconfiguring how cycles unfold. The 25-day stretch in an extreme high-risk zone raises questions about whether the market is forming a capitulation-driven trough or merely experiencing a protracted consolidation before buyers return. The interpretation hinges on whether risk-off liquidity persists and whether new inflows can materialize to sustain a move higher.
On-chain and market-to-spot dynamics are diverging in meaningful ways. The BTC price signal that previously helped catalyze a robust expansion has to contend with a backdrop where demand signals off-chain—such as ETF flows and macro liquidity—are not as supportive as they were in the prior rally. The divergence between demand signals and supply-side patterns matters for traders who rely on a confluence of indicators to validate a bottom and confirm upside traction.
Several market observers emphasize that the current regime may not replicate the conditions that preceded the 2024 surge. For instance, a few analysts highlight the role of on-chain supply metrics in bottoming phases, noting that BTC’s interaction with supply held by different market cohorts has historically aligned with pivotal inflection points. Yet the macro environment—with inflation not decisively cooling and liquidity expansions not broad-based—could stretch any relief rally’s durability. This tension between on-chain indicators and macro liquidity creates a nuanced landscape for risk assets and for investors evaluating the risk/reward of new positions.
What to watch next
- Monitor Bitcoin’s price action around the 45,000 level as a reference point for potential support, with attention to whether downside risk resumes toward historical floors near 30,000 and 16,000.
- Track ETF and fund flows related to both gold and Bitcoin on a 90-day basis to gauge whether risk-off capital is gravitating toward traditional assets or remaining skeptical of crypto exposure.
- Watch inflation data releases, including personal consumption expenditures (PCE) and related Fed commentary, to assess whether liquidity conditions remain constrained or begin to loosen modestly.
- Observe changes in on-chain demand indicators, including the BTC supply in profit/loss and the so-called demand-from-whales metrics, to determine whether buyers are stepping in with conviction or merely testing the bid.
- Follow macro risk sentiment and regulatory developments that could influence dollar liquidity and the propensity of market participants to reallocate capital into risk assets like cryptocurrencies.
Sources & verification
- Swissblock: analysis noting Bitcoin’s 25 consecutive days in an extreme high-risk zone and its historical associations with bottoms.
- Michael van de Poppe (X/Twitter): BTC vs supply in profit/loss chart showing price interaction with bottoming-phase levels.
- RugaResearch: observations that 30-day apparent demand has oscillated between positive and negative, with selling pressure fading but without a sustained buying surge.
- Ecoinometrics: notes on inflation trends (PCE near 2.9% YoY, core near 3.0%, core services above 3.4%) and the durability of deflationary or accommodative regimes.
- Bold.report: ETF flow data indicating gold ETFs have surpassed spot Bitcoin ETF inflows on a 90-day rolling basis, with Bitcoin funds posting negative flows over the same period.
- Willy Woo: Bitcoin Flow Model commentary highlighting that near-term relief rallies may face selling pressure in a bear-dominated liquidity regime.
Bitcoin’s next inflection point: market structure and macro backdrop
Bitcoin (CRYPTO: BTC) (BTC) now sits at a crossroads where the pattern that preceded the 2024 rally could re-emerge, but only if the macro and liquidity narratives align in a favorable way. The most visible signal is the extended period spent in an extreme high-risk zone—the longest since such measurements began—an indicator that historically cycles through a capitulation move before a durable bottom forms. The question that market participants are asking is whether this time is different enough for supply-demand dynamics to tip in the bulls’ favor without the support of broad-based liquidity growth.
Supportive observations from on-chain analytics insist on a careful distinction between bottoming signals and the sustainability of a new upcycle. The BTC price has often traced major bottoms with a concurrent rebalancing of risk appetite among large holders; this rebalancing can occur even when the broader market weighs macro headwinds. In this context, the BTC price’s interaction with the supply held by different groups—retail, retail-scale whales, and long-term holders—becomes a focal point for predicting whether a new phase of accumulation could take hold.
Yet the market narrative remains cautious. ETF and commodity flows tell a story of a risk-off tilt that sometimes moves capital away from crypto toward traditional stores of value. The outperformance of gold ETFs relative to spot Bitcoin funds over the last quarter underscores a broader investor preference for assets perceived as less volatile or less correlated with the crypto cycle. Inflation remains a factor; headline PCE around 2.9% year over year and core measures near 3% imply that the Federal Reserve’s policy path could keep liquidity conditions constrained for longer than during prior upswings. While a relief rally to the $70,000–$80,000 zone is possible, analysts warn that any such move could confront renewed selling pressure if liquidity does not broaden or if risk sentiment deteriorates again.
From a market-structure standpoint, those observing BTC’s price in relation to supply and demand markers point to two critical thresholds. The first is a near-term resistance cluster that has historically capped upside within bear markets, while the second is a set of longer-term supports near the mid-40,000s and lower, which could preserve the secular downtrend’s integrity if breached. The interaction between price and the “profit/loss” distribution of BTC supply remains a useful lens for anticipating when a bottom may actually give way to a durable move higher, rather than a brief, volatile bounce.
Ultimately, the evolving environment suggests a more nuanced cycle than the one seen in past bull runs. While the bottoming signal is a notable datapoint, the absence of a synchronized, broad-based liquidity recovery means any upside move could be shallow and susceptible to flash selling. Market participants will likely need to weigh the on-chain signals against macro and policy-driven liquidity contours, accepting that the next bullish expansion, if it arrives, may unfold with a slower cadence and with greater sensitivity to inflation data, interest-rate expectations, and regulatory developments.

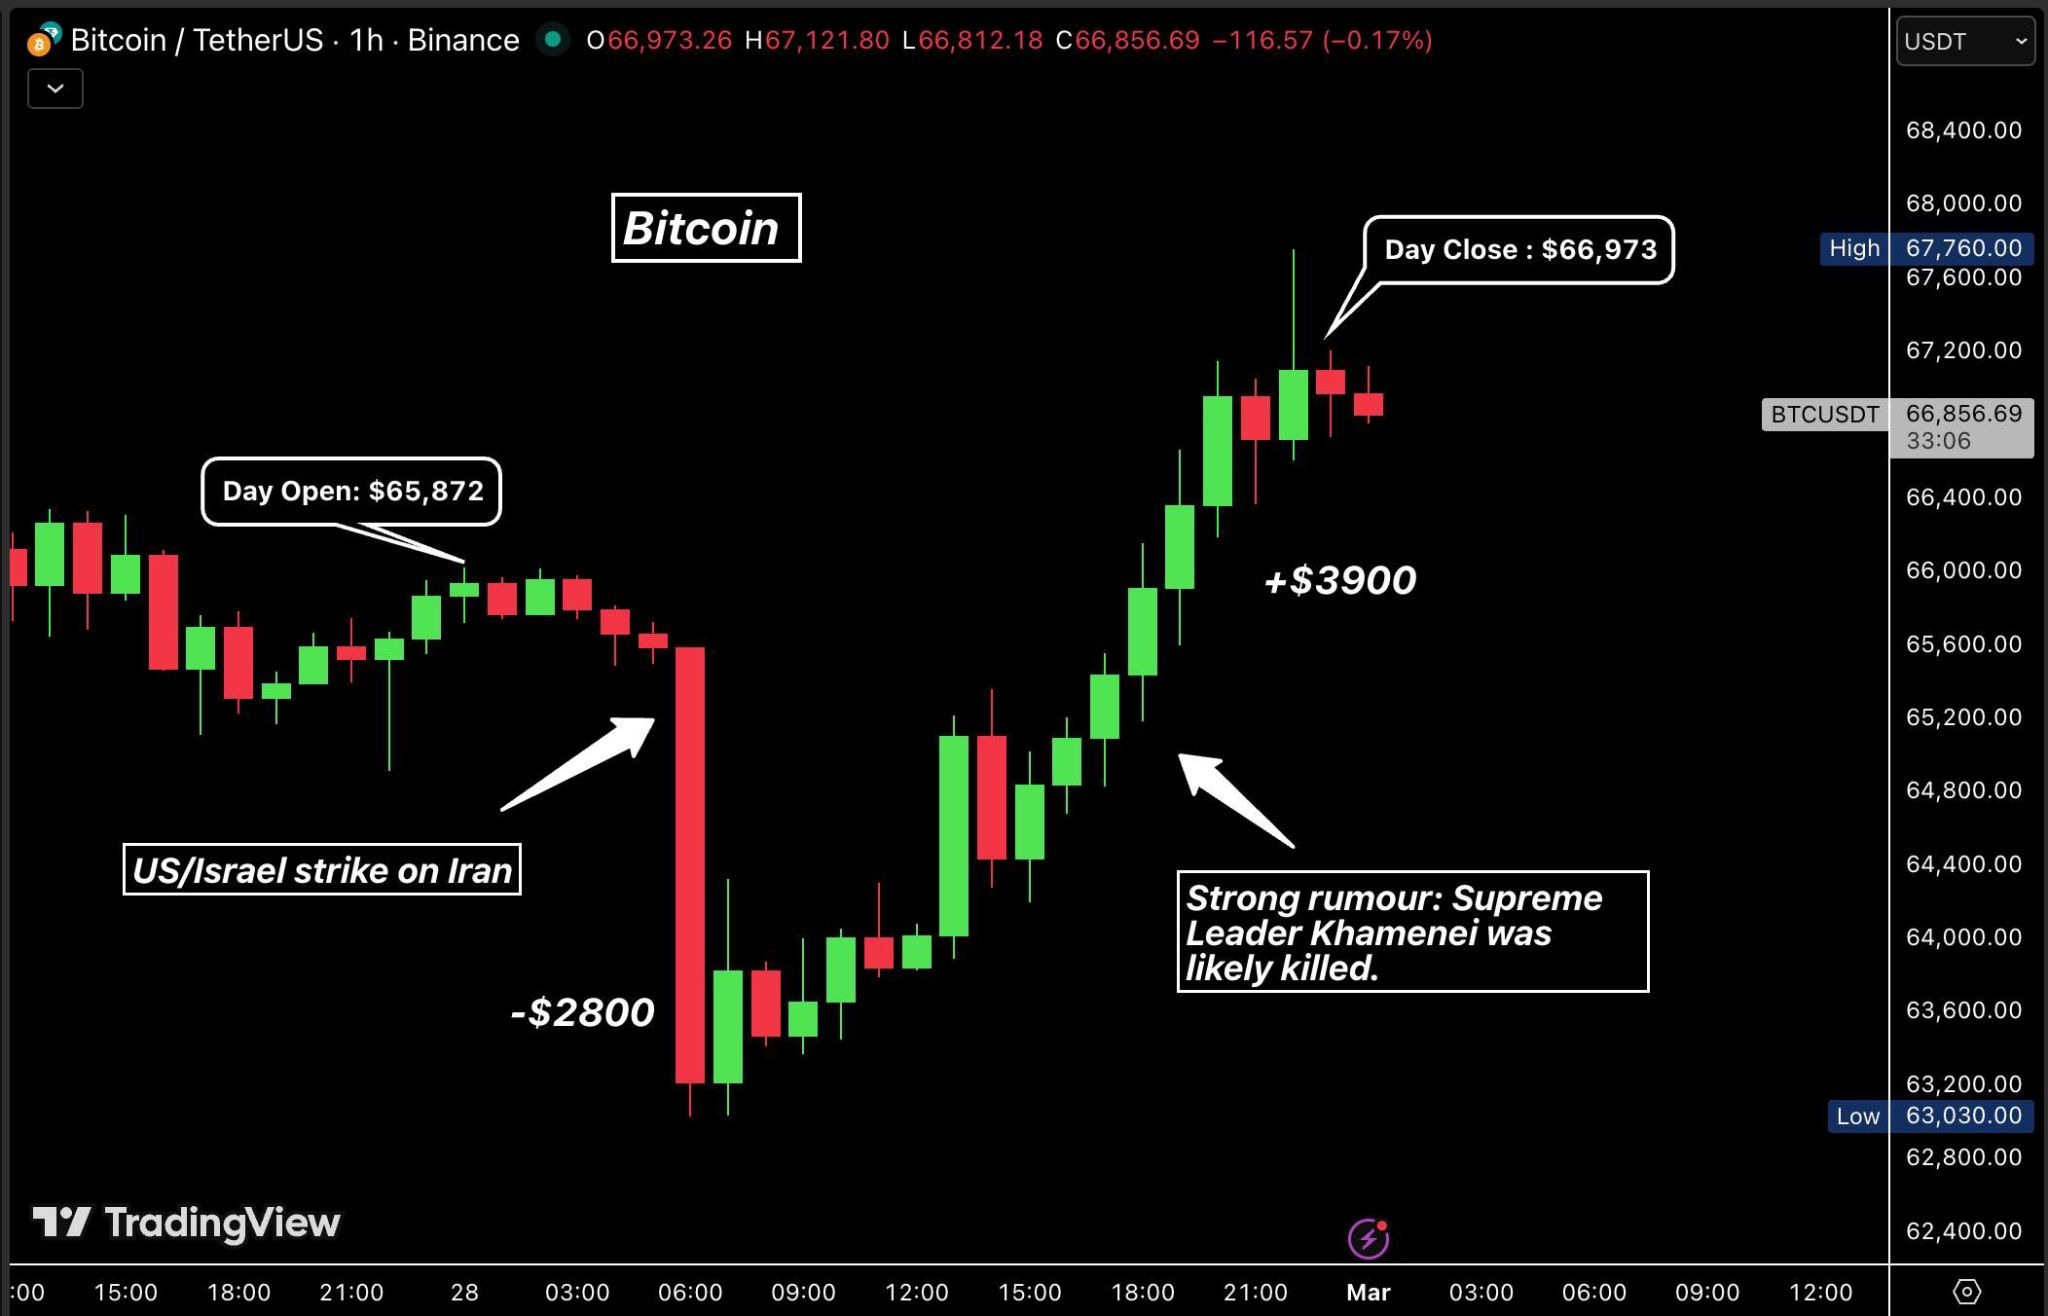
Bitcoin prices have recovered from a dip tied to geopolitical headlines, shifting sentiment in a market that has grown increasingly sensitive to macro risk events. In early Sunday trading, Bitcoin (CRYPTO: BTC) climbed toward the upper end of a recent range after yesterday’s volatility driven by reports of U.S.-and-Israel strikes on Iran. The asset had briefly touched a floor near $63,000 before a run higher helped recoup the losses in less than a day. By Sunday morning, price data circulated by TradingView placed BTC on Coinbase at about $68,200, signaling a relief rally as traders weighed the potential implications for risk assets in the near term. The bounce comes after a weekend that saw liquidity stress and rapid re-pricing as newsflow evolved.
The market’s day-long swing was notable not just for the price spike but for the underlying fragility it exposed. In the 24-hour window, roughly 157,000 traders were liquidated, translating to about $657 million in total liquidations, with a near-even split between leveraged long and short positions. The figure, tracked by CoinGlass, underscored the extent to which risk-on and risk-off trades collide in a geopolitical backdrop that has kept many participants on edge. While the move higher drew some relief, the overall liquidity environment remains sensitive to headlines, complicating calls about sustained momentum in the weeks ahead.
Key takeaways
- Bitcoin briefly surged to around $68,200 on Coinbase before a pullback left it near $67,350, continuing a three-week trading range around the $67k level.
- Over the past 24 hours, about 157,000 liquidations occurred, totaling roughly $657 million, with roughly equal shares of longs and shorts liquidated, per CoinGlass.
- Unverified but widely circulated reports of high-level leadership casualties in Iran fed sudden volatility, though the situation remained fluid as markets awaited official confirmation.
- February closed as Bitcoin’s third-worst February on record, with a decline close to 15%, marking one of the worst month-ends since 2013 and contributing to a difficult start to the year (Q1) for the asset.
- Analysts cautioned that de-escalation signs before the week’s opening could help sustain gains, though upside remains contingent on geopolitical clarity and macro risk sentiment.
Tickers mentioned: $BTC
Sentiment: Neutral
Price impact: Neutral. The bounce offset a steep intraday drop, but BTC remains within a tight, range-bound pattern rather than establishing a clear breakout.
Market context: The price action sits amid a broader backdrop of geopolitical risk and risk-off liquidity dynamics, with intraday moves driven by headlines as traders recalibrate exposure to macro and policy risks. Recent data show concentrated volatility around major news events, reinforcing a cautious stance among most market participants.
Why it matters
For traders, the brief rebound toward the mid-to-high $60k zone after a sharp decline emphasizes Bitcoin’s role as a potential haven within a high-risk environment, even as it remains tethered to overall risk sentiment. The rapid liquidations in a 24-hour period highlight how quickly leveraged positions can unwind when headlines shift, underscoring the importance of risk management and hedging in crypto portfolios. The episode also demonstrates that, despite episodic spikes, price action continues to reflect a balance between demand from allocators seeking a store of value and the pressure from macro and geopolitical headlines that can compress liquidity and amplify moves in either direction.
Analysts’ commentary around the potential for de-escalation to support further gains captures a common thread: Bitcoin’s near-term trajectory in this environment is highly contingent on the speed and visibility of political developments. One analyst noted that if conflict signals resolve ahead of the next market open, BTC could stabilize and potentially push higher. Others warned that any renewed escalation or uncertainty could quickly reverse the recent rebound, given the asset’s history of volatile responses to global tensions. In this context, the market’s probability distribution shifts with every fresh headline, making prudent risk management more important than ever for participants navigating this space.
Beyond geopolitics, Bitcoin’s February performance remains a cautionary signal. The asset finished the month down about 15%, marking its third-worst February in the data set and contributing to a challenging start to the year. This performance places Bitcoin on track for its worst first quarter since 2018, with losses approaching the mid-20% range year-to-date in a few scenarios. Such numbers reinforce that the cryptocurrency market is not immune to broader cyclicality and risk-off periods, even when episodic catalysts temporarily provide support. The data points to a market still digesting a period of elevated volatility, with traders weighing whether a more sustained recovery can emerge from macro normalization and improved liquidity conditions.
Against this backdrop, traders continue to monitor on-chain activity and liquidations as practical indicators of market risk appetite. The scale of recent liquidations suggests a broad reticence among highly leveraged participants, and it remains to be seen whether this sentiment translates into a more durable bid or gives way to renewed selling pressure if the geopolitical picture remains uncertain. The episode also highlights the constant tension between macro risk signals and crypto-specific fundamentals, where retail and institutional participants alike seek price discovery in a market characterized by 24/7 trading and near-instantaneous reaction to news flow.
What to watch next
- Any official statements or de-escalation signals from U.S. or allied authorities regarding Iran and the region, ahead of the next market open.
- Price action around key support and resistance levels near the current three-week range, with attention to whether BTC maintains momentum above or retreats below the mid-$60k zone.
- Changes in liquidity and funding rates on major exchange platforms as risk sentiment shifts in response to headlines and macro data releases.
- Updates on geopolitical developments, including any verification of leadership changes or military assessments, that could alter risk-on versus risk-off dynamics for crypto markets.
Sources & verification
- Bitcoin price data and range observations from Coinbase trading data and TradingView.
- Liquidation figures (157,000 traders; about $657 million total) reported by CoinGlass.
- BBC reporting on Iran’s leadership developments and attribution of events to the Iranian leadership.
- Public posts and commentary on the geopolitical situation, including statements on Truth Social by former U.S. President Donald Trump.
- Reported US-Israel air strikes on Iran as referenced in market commentary.
Bitcoin price moves amid geopolitical tensions and liquidity shifts
Bitcoin (CRYPTO: BTC) kept a close watch on news flow as markets absorbed headlines about U.S.-led strikes in the Middle East and the broader risk landscape. After a dip that briefly carried prices toward the low $60k region, BTC staged a partial recovery, briefly topping $68,200 on Coinbase before easing back. The rebound unfolded within a roughly three-week trading band centered near $67,000, illustrating the market’s struggle to establish a durable directional bias amid ongoing geopolitical uncertainty. The intraday swing, while dramatic, did not necessarily translate into a lasting breakout, and traders remained cautious about the asset’s medium-term trajectory.
From a risk-management perspective, the latest price action coincided with large liquidation activity. In the last 24 hours, data indicated around 157,000 liquidations totaling approximately $657 million—an amount that underscores how quickly highly leveraged positions can be unwound when volatility spikes. The liquidations appeared roughly evenly split between longs and shorts, suggesting a broad spectrum of market participants faced margin pressure regardless of their directional stance. These dynamics are emblematic of a market where liquidity can be episodically thin and sentiment-sensitive, particularly in the wake of geopolitical events and shifting macro cues.
The geopolitical narrative surrounding Iran added another layer of complexity. Reports from credible sources suggested that Ayatollah Khamenei, Iran’s Supreme Leader, had been killed in a Saturday operation, with subsequent coverage by outlets such as the BBC. Such claims, whether confirmed or refuted, tend to catalyze rapid price revision as traders reassess risk premia and potential spillover effects on regional stability. Notably, commentary from market observers emphasized that the trajectory of Bitcoin would likely hinge on whether the conflict shows signs of de-escalation before the market opens on Monday, a scenario that could preserve or extend the current gains. As one analyst noted on social media, the possibility of a peaceful trajectory could help Bitcoin maintain momentum, while renewed hostilities could precipitate renewed volatility.
Despite the back-and-forth, February’s performance looms large in the narrative surrounding BTC. The asset closed the month with a near-15% slide, marking its third-worst February on record and continuing a pattern of weak early-year performance. The broader implication is an ongoing risk-off phase that has persisted into 2026, with the question for market participants being whether a combination of de-risking, thin liquidity, and regulatory developments can eventually pave the way for a more sustained recovery. The data point toward a volatile environment where macro and geopolitical developments can overshadow even localized bullish catalysts, compelling traders to adopt disciplined risk controls and clear exit strategies.
As the market awaits more clarity, the path forward appears to be shaped by the interplay between conflict resolution signals and the crypto market’s own liquidity dynamics. The narrative remains unsettled, and the potential for further volatility persists as new information emerges. In this context, BTC’s price action will likely reflect not only technical support and resistance but also broader shifts in risk appetite, funding costs, and investors’ willingness to allocate capital to an asset class that remains highly sensitive to global developments. For now, the market seems to be testing the resilience of Bitcoin’s bid while staying vigilant for the next headline that could swing the balance.
Bitcoin prices have recovered from their dip following the US-Israeli air strikes on Iran and reports of the death of the Iranian Supreme Leader.
Bitcoin (BTC) prices reached $68,200 in early trading on Sunday morning on Coinbase, according to TradingView.
The asset has now recovered all losses from its dip to $63,000 on Saturday, adding $5,000 in less than 24 hours following the news that the United States and Israel had commenced air strikes on Iran.
BTC is currently trading back at Friday’s levels, around $67,350 at the time of writing, but remains within a three-week range-bound channel.
Over the past 24 hours, around 157,000 traders were liquidated, with total liquidations coming in at $657 million, roughly evenly split between leveraged longs and shorts, according to CoinGlass.
Iranian Supreme Leader Killed
Iran’s Supreme National Security Council said Ayatollah Khamenei was killed early Saturday morning at his office, reported the BBC.
US President Donald Trump described the hardline Islamist cleric as “one of the most evil people in history” on his social media platform, Truth Social.
“This is not only justice for the people of Iran, but for all great Americans, and those people from many countries throughout the world, that have been killed or mutilated by Khamenei and his gang of bloodthirsty thugs,” he said.
The commander-in-chief of the Islamic Revolutionary Guard Corps, Mohammad Pakpour, and the secretary of Iran’s Defense Council, Ali Shamkhani, were also killed in the US-Israel strikes.
Related: Bitcoin bottom fractal calls for 130% rally, but is the model valid in 2026?
“After news of Iran’s Supreme Leader Khamenei’s death, the market pumped because people are taking it as the end of the US-Iran war,” commented analyst Ash Crypto on Sunday.
“If this conflict shows signs of resolution before Monday’s open, I think Bitcoin can hold its gains and move higher,” he added.

Bitcoin’s third-worst February ever
Despite the recent gains, Bitcoin has just closed its third-worst February in history and only the fourth time since 2013 that the asset has ended the month in the red.
BTC shed just under 15% last month, but its worst February was in 2014 when it lost 31%, followed by 2025 when it fell 17.4%, according to CoinGlass.
The asset is also on track to close its worst-performing first quarter since 2018, having lost almost 23% so far since the beginning of the year.
Magazine: 6 massive challenges Bitcoin faces on the road to quantum security

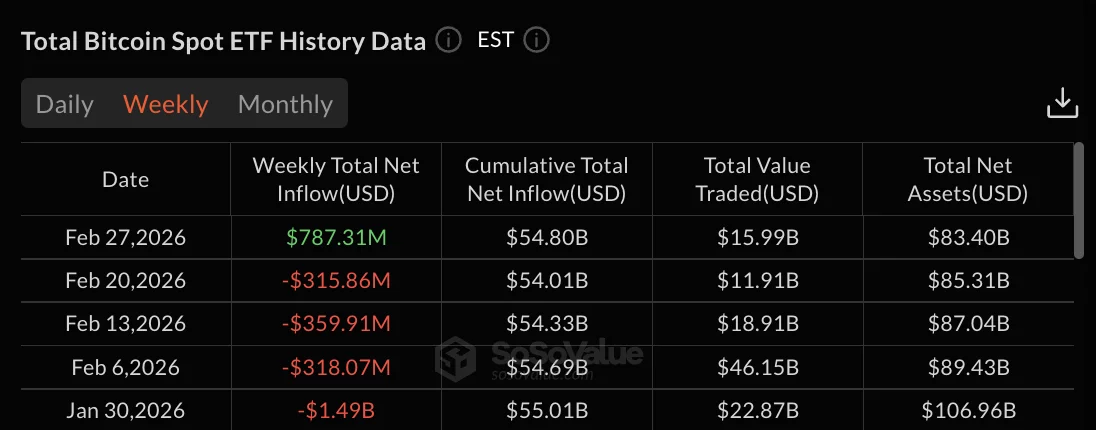
Bitcoin ETFs recorded $787.31 million in net inflows for the week ending February 27, reversing the prior week’s $315.86 million in outflows.
Summary
- Bitcoin ETFs posted $787M in weekly inflows, ending four red weeks.
- Three-day buying wave added $1.02B, led by a $506M peak day.
- Cumulative net inflows dipped slightly to $54.8B despite rebound.
The positive weekly flow came from three consecutive days of strong buying from February 24-26, totaling $1.02 billion, which offset outflows on February 23 and 27.
Bitcoin traded at $66,000 with gains of 1.7% over 24 hours following the weekly ETF reversal. The asset traded in a 24-hour range of $63,176 to $67,039.
Total net assets reached $83.40 billion while cumulative total net inflow stood at $54.80 billion.
Buying wave drives $1.02 billion in Bitcoin ETFs inflow
February 25 posted the week’s strongest single-day performance with $506.51 million in inflows.
February 26 added $254.46 million while February 24 contributed $257.71 million. The three-day streak brought $1.02 billion into Bitcoin ETF products.
February 23 recorded $203.82 million in outflows before the buying wave began. February 27 posted $27.55 million in redemptions, ending the three-day positive streak.
Weekly trading volume reached $15.99 billion for the period ending February 27, down from $22.87 billion during the week ending January 30.
Total net assets climbed from $85.31 billion on February 20 to $83.40 billion on February 27, showing a drop from the week’s peak despite positive flows.
Weekly reversal breaks four-week outflow streak
The $787.31 million weekly inflow was the first positive week since late January. The four prior weeks posted consecutive outflows.
That was $315.86 million for the week ending February 20, $359.91 million ending February 13, $318.07 million ending February 6, and $1.49 billion ending January 30.
The five-week outflow period from late January through mid-February totals approximately $2.48 billion before this week’s reversal.
Cumulative total net inflow fell from $55.01 billion on January 30 to $54.80 billion on February 27.
It took Polymarket less than 24 hours to turn a Middle Eastern war into a trading floor.
Since the U.S. and Israel launched strikes on Iran Saturday, the prediction market has seen a flood of new contracts covering everything from ceasefire timelines to whether the Iranian regime will collapse by June.
The speed and specificity of the markets is striking. Bettors aren’t just wagering on whether the conflict escalates, but pricing the week it ends, who replaces Khamenei, and whether U.S. ground forces enter Iran by March 7.

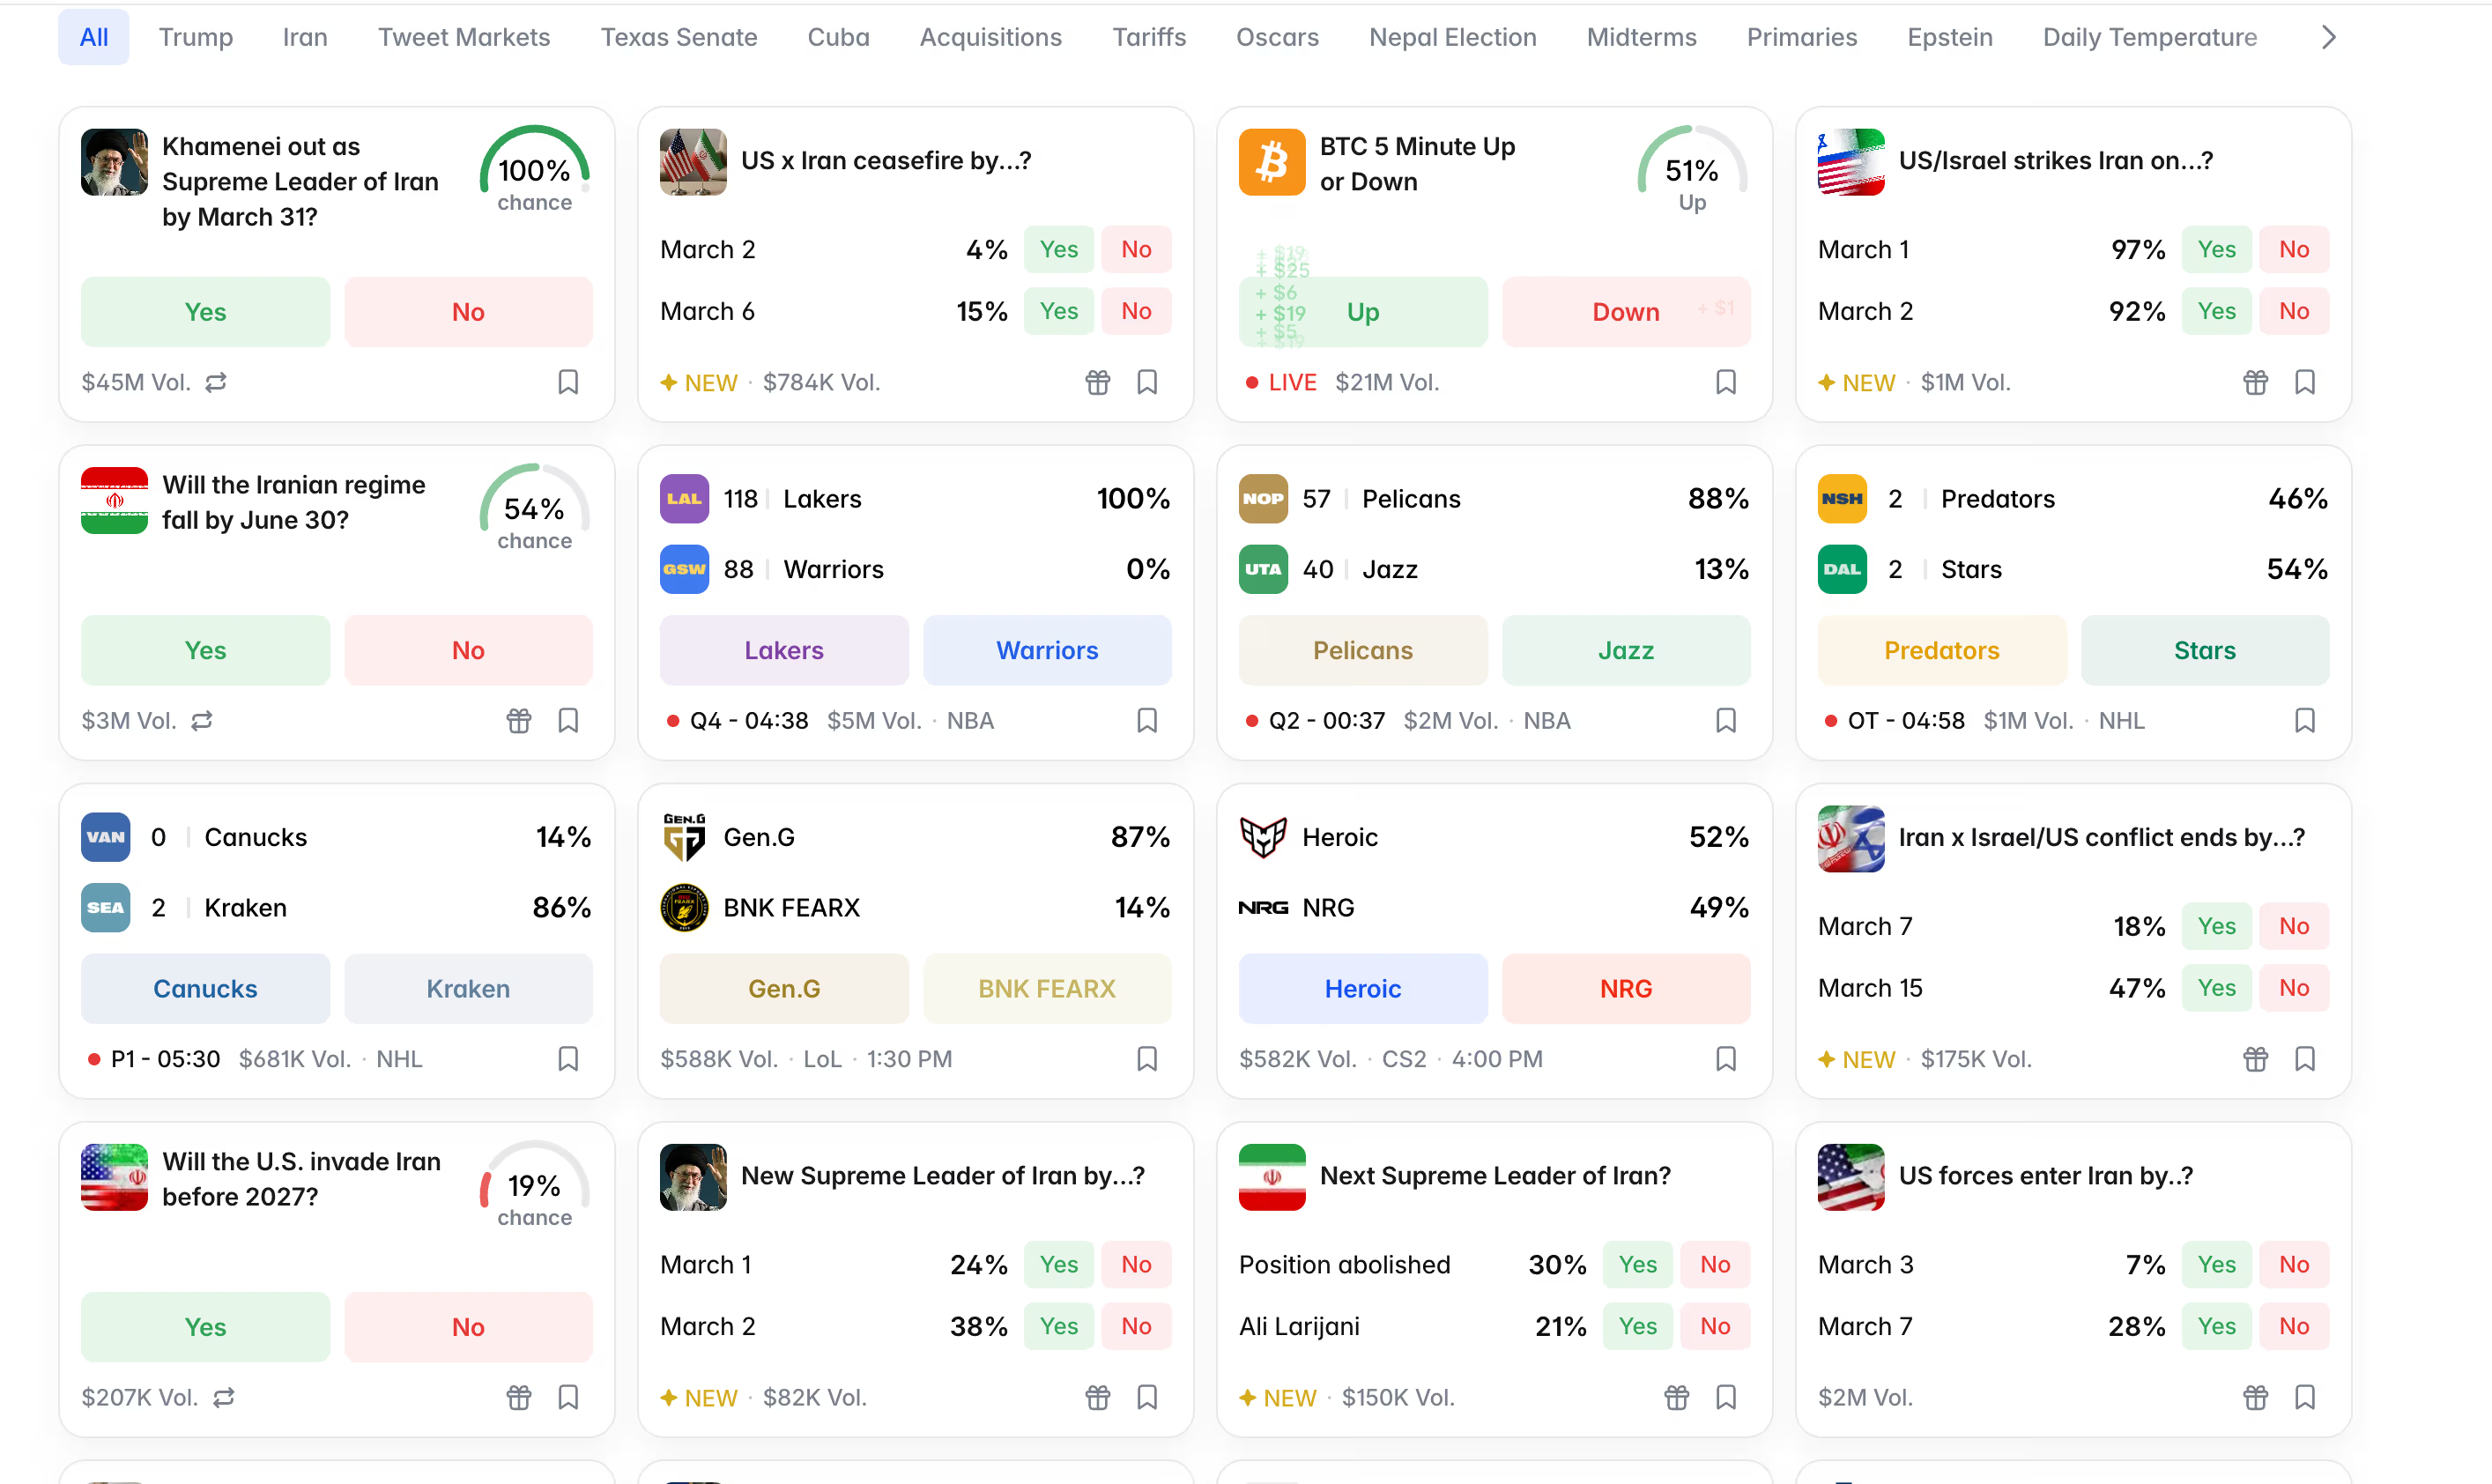
Polymarket’s largest completed market is “Khamenei out as Supreme Leader of Iran by March 31?” which resolved to 100% after Iranian state TV confirmed his death.
The contract pulled $45 million in volume, making it one of the most-traded geopolitical markets in the platform’s history. The top trader, an account called ‘Curseaaaaaaa,’ made $757,000 on a Yes bet. Four other traders each cleared six figures.

The chart on that market hovered between 25% and 50% through January and February as tensions built, then spiked vertically to 100% when confirmation came through.
Now the action has shifted to what comes next.
The ceasefire market gives just a 4% chance of a U.S.-Iran ceasefire by March 2 and 15% by March 6, but jumps to 61% by March 31 and 78% by April 30. Bettors are pricing a resolution within weeks, not months, consistent with bitcoin’s bounce to $68,000 on the same thesis.

“Will the Iranian regime fall by June 30?” sits at 54%, up sharply from the low-20s where it had traded for months. The “Next Supreme Leader of Iran” market gives a 30% chance to “position abolished” entirely, meaning bettors see nearly a one-in-three shot that the theocratic structure itself doesn’t survive. Ali Larijani, a former parliament speaker, leads the named candidates at 21%.
The ground invasion contracts are pulling real volume too. “Will the U.S. invade Iran before 2027?” trades at 19% with $207,000 in volume, while “US forces enter Iran by March 7” sits at 28% with $2 million traded.
What Polymarket is doing here is something traditional markets structurally cannot. Equity and oil futures don’t reopen until Sunday evening, but on Polymarket, anyone with a crypto wallet can take a position on Iranian regime change on a casual weekend and see real-time pricing from thousands of other participants doing the same thing.
But the most striking activity may have happened before the first missiles landed.
Onchain analytics firm Bubblemaps on Saturday identified six wallets that collectively netted $1.2 million in profit by betting on a U.S. strike on Iran by February 28, the exact day the strikes occurred.
Most of the wallets were funded within 24 hours of the attack, bet specifically on the Feb. 28 contract rather than broader timeframes, and purchased “yes” shares hours before the military operation began. The largest single wallet turned roughly $61,000 into over $493,000 in profit. A second netted approximately $120,000 from a $30,000 position.
The platform is aware of the optics, meanwhile.
Polymarket added a note to its Middle East markets on Sunday stating that “the promise of prediction markets is to harness the wisdom of the crowd to create accurate, unbiased forecasts for the most important events to society,” adding that after speaking with people directly affected by the attacks, it found that prediction markets “could give them the answers they needed in ways TV news and X could not.”

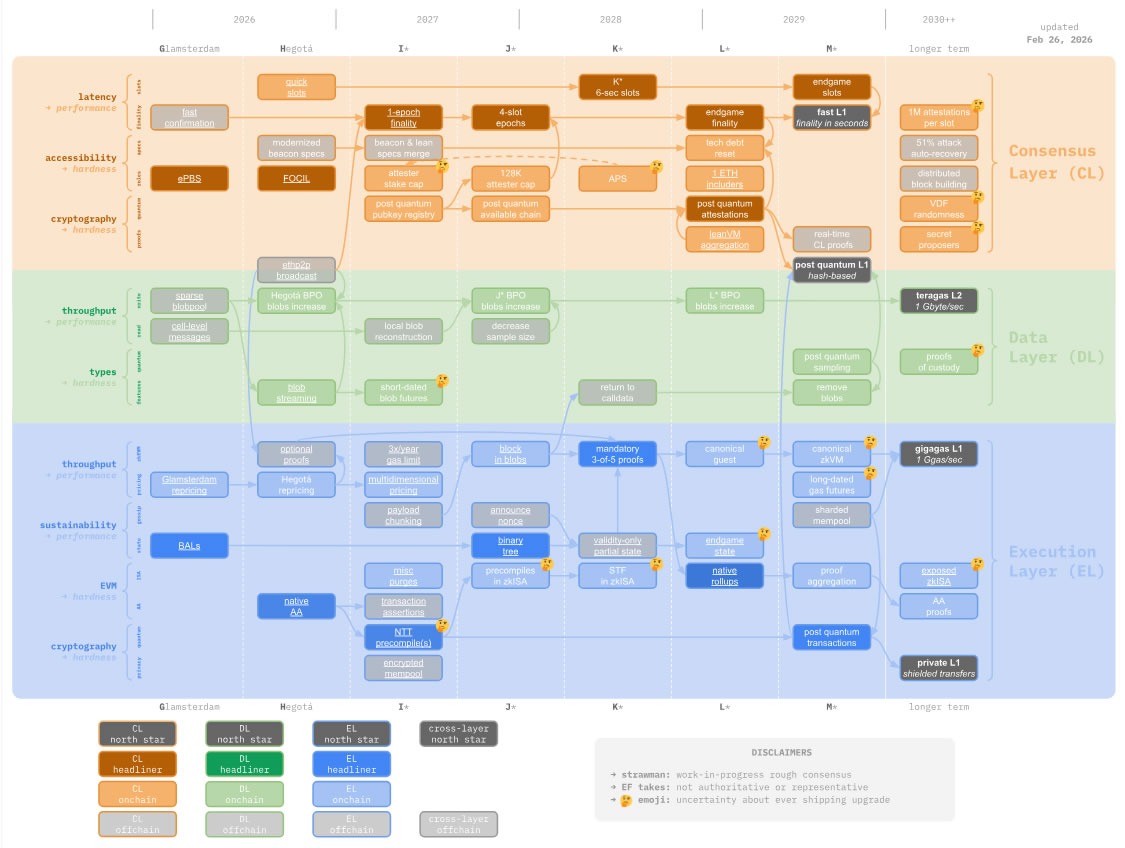
Ethereum (CRYPTO: ETH) is on track to roll out native account abstraction as part of the Hegota upgrade, with timing that insiders say could land within a year. Vitalik Buterin outlined that smart accounts—often described as account abstraction—will be delivered once EIP-8141, the omnibus proposal consolidating the remaining AA challenges, is deployed. The push marks a significant shift in how users interact with on-chain transactions, moving away from single-step operations toward a more modular, frame-based approach. The idea is to simplify user experiences, reduce reliance on external custodians, and preserve Ethereum’s core ethos of permissionless, censorship-resistant finance. The timeline and the scope of EIP-8141 place the project squarely in the crosshairs of developers and wallet builders seeking a more flexible, secure transaction model for the network and its users.
“We have been talking about account abstraction ever since early 2016,” Buterin said over the weekend, signaling that the long arc of research is now converging on a deployable design. The release would introduce a framework in which a transaction is not a single operation but a sequence of interlinked steps, or “frames,” that can reference one another and indicate who pays the gas or authorizes the sender. This framing enables a wide range of use cases, from multi-signature wallets to quantum-resistant security models, while keeping the pipeline of on-chain validation efficient and scalable.
“Finally, after over a decade of research and refinement of these techniques, this all looks possible to make happen within a year (Hegota fork).”
The core concept is meant to be as simple as possible while retaining broad generality. The frame-transaction architecture lays out an execution plan in which each frame contributes a piece of the final outcome, and each frame’s authorization can be bundled into a larger, privacy-preserving sequence. This design is not just about reducing the number of steps; it aims to enable sophisticated flows while maintaining a developer-friendly model that can be adopted by wallets, dApps, and infrastructure providers alike.
A core principle of cypherpunk Ethereum
At the heart of the proposal lies a rebalance of how validation and execution happen. Smart accounts, including multisig configurations, quantum-resistant wallets, or keys that can be changed over time, rely on a validation frame to verify signatures and authorize actions, followed by an execution frame that carries out the operation. The arrangement is intended to minimize the number of required intermediaries while maximizing what users can accomplish even if traditional infrastructure becomes unavailable. In practical terms, gas could be paid in non-ETH tokens through a paymaster contract, or via a specialized decentralized exchange that provides real-time Ether without intermediaries—an arrangement that aligns with Ethereum’s cypherpunk ethos of resilience and user sovereignty.
“Intermediary minimization is a core principle of non-ugly cypherpunk Ethereum: maximize what you can do even if all the world’s infrastructure except the Ethereum chain itself goes down.”
The design also speaks directly to the privacy dimension of on-chain activity. If the model is adopted widely, privacy-focused protocols could reduce or redefine their reliance on public broadcasting networks that have historically caused UX pain. Instead, a general-purpose public mempool could serve as a more flexible, scalable substrate for private transactions, potentially making privacy tools more practical for everyday users. In the long run, this could influence how privacy layers and wallets interact with the base chain, offering smoother, more interoperable experiences while preserving strong cryptographic guarantees.
Native account abstraction is expected to be delivered in the latter half of 2026 according to the Strawmap projection maintained by the Ethereum Foundation. The Strawmap estimates are widely watched because they reflect community expectations about when core features might land across the ecosystem, including developments around account abstraction and related scaling improvements. The projection underscores the sense that AA is moving from concept to implementation, with multiple development tracks converging around a unified upgrade path.
Quantum-resistant Ethereum in the pipeline
Buterin stressed that the AA framework could accommodate all existing accounts, enabling batch operations and transaction sponsorship while maintaining a consistent security model. In the same thread, he outlined a broader quantum resistance roadmap for Ethereum, identifying four critical areas: validator signatures, data storage, user account signatures, and zero-knowledge proofs. The emphasis on quantum safety reflects a growing consensus that post-quantum cryptography will be essential as computing capabilities evolve and adversaries potentially gain access to more powerful attack vectors.
On the scaling front, Buterin suggested that progress toward shorter slot times and faster finality could come progressively as part of a broader, longer-term roadmap for a faster, more efficient Ethereum. The roadmap envisions incremental improvements that reduce latency and increase throughput without compromising security, a balance that has long been a central challenge for the network’s developers.
As the discussion around quantum resistance evolves, the broader ecosystem is watching for practical implementations that could integrate with existing protocols. The quantum-resistance conversation complements the AA push by emphasizing stronger, future-proof cryptography that can withstand emerging threats while preserving user control and network performance. The combined trajectory—account abstraction paired with quantum-safe measures—signals a holistic approach to Ethereum’s evolution, one that seeks to marry user-centric design with durable security guarantees.
In private discussions and public threads, researchers have highlighted quantum resistance as a multi-faceted problem: it involves updating validator signatures, supporting larger data-collection capabilities for verification, ensuring robust user signatures, and deploying advanced zero-knowledge proofs that can operate efficiently in a post-quantum world. While these are technical milestones, they carry practical implications for wallet developers, validators, and users who expect faster, cheaper, and more private interactions on the network.
In sum, the push for account abstraction, reinforced by the EIP-8141 consolidation and a quantum-ready roadmap, marks a notable inflection point for Ethereum. The combination of frame-based transactions, gas sponsorship mechanisms, and privacy-oriented optimizations could redefine how users engage with decentralized applications, lowering barriers to entry while enhancing security and resilience. The community is watching closely as milestones move from theoretical proposals to real-world deployments, with the Strawmap timeline offering a rough guide to when broader AA features may begin to impact wallets, dApps, and users across the ecosystem.


Bitcoin jumped to $68,000 early Sunday, recovering nearly all of Saturday’s war-driven losses within hours of Iranian state TV confirming that Supreme Leader Ayatollah Ali Khamenei was killed in U.S. and Israeli airstrikes.
Khamenei held ultimate authority over Iran’s military, foreign policy, and nuclear program. Under Iran’s constitution, a temporary council of the president, head of the judiciary, and a Guardian Council jurist assumes leadership duties until the Assembly of Experts appoints a successor.
U.S. president Donald Trump, meanwhile, has urged Iranians to overthrow the regime, calling this “probably your only chance for generations.” Tehran has continued firing missiles at Israel, and Israeli strikes on Iran are ongoing. Whether a period of mourning affects military operations remains unclear.
Trump added U.S. attacks would continue for as long as necessary.
But bitcoin moved before any of those questions were answered. The $64,000 to $68,000 swing happened on thin Sunday liquidity, driven by a single headline. That’s a roughly $80 billion market cap move in hours.
The read across crypto and broader risk markets is that a leadership vacuum makes a ceasefire more likely than continued escalation, creating a swift flight to risk assets.
Oil and equity futures open later on Sunday, and monitoring their moves may tell whether the optimism holds or whether Sunday’s bounce gets faded the same way Wednesday’s push to $70,000 did.
Iran sits at the center of a region responsible for roughly a third of global crude exports. If markets interpret Khamenei’s death as raising the probability of regime destabilization or disruption to supply routes, energy prices could spike, pressuring global inflation expectations and tightening financial conditions. That would typically weigh on risk assets, including crypto.
However, if traders believe succession mechanisms will stabilize decision-making and avoid broader war, risk assets may continue to find support.
Ethereum account abstraction, or smart accounts, will be shipped with the Hegota upgrade “within a year,” said Vitalik Buterin on Saturday.
“We have been talking about account abstraction ever since early 2016,” said the Ethereum co-founder over the weekend.
He added that now, “we finally have EIP-8141, an omnibus that wraps up and solves every remaining problem that AA [account abstraction] was intended to address (plus more),” and it is slated for deployment this year.
“Finally, after over a decade of research and refinement of these techniques, this all looks possible to make happen within a year (Hegota fork).”
The core concept is “about as simple as you can get while still being highly general purpose,” using “frame transactions,” explained Buterin.
Instead of a transaction being a single operation, it becomes a sequence of “frames” that can reference each other’s data, and each frame can signal authorization of a sender or gas payer.
A core principle of cypherpunk Ethereum
Smart accounts with multi-signatures, quantum-resistant wallets, and accounts with changeable keys work by having a validation frame, which checks the signature and approves it, followed by an execution frame.
Paying gas in non-ETH tokens can be done via a “paymaster contract” or a special-purpose decentralized exchange that provides Ether (ETH) in real time, with no intermediaries required, which is a big deal for Ethereum’s ethos, said Vitalik.
“Intermediary minimization is a core principle of non-ugly cypherpunk Ethereum: maximize what you can do even if all the world’s infrastructure except the Ethereum chain itself goes down.”
Related: Vitalik Buterin outlines quantum resistance roadmap for Ethereum
Buterin explained that this was also a big deal for privacy protocol users, as it means they can completely remove “public broadcasters” that are the “source of massive UX pain” in privacy platforms such as Railgun and Tornado Cash, and replace them with a “general-purpose public mempool.”

Quantum-resistant Ethereum in the pipeline
All Ethereum accounts, including existing ones, can be put into the same framework and gain the ability to do batch operations and transaction sponsorship, he said.
The Ethereum co-founder posted his quantum resistance roadmap for Ethereum on Thursday, stating that the four areas of concern were validator signatures, data storage, user account signatures, and zero-knowledge proofs.
He also said that he expects to see “progressive decreases” of both slot time and finality time in the longer-term scaling roadmap.
Magazine: 6 massive challenges Bitcoin faces on the road to quantum security

Arbitrum price continues to weaken as ARB struggles to attract sustained investor demand. The token has failed to align with broader crypto market recoveries. Instead, it remains under pressure, extending a prolonged decline that has brought it dangerously close to its all-time low.
Investor support appears limited despite occasional short-lived rebounds. Broader market improvements have not translated into lasting gains for ARB. This divergence highlights fading conviction across multiple participant groups within the Arbitrum ecosystem.
Arbitrum Is Dominated By Volatile Holders
The Chaikin Money Flow indicator has dropped below the zero line, signaling net capital outflows. This reading reflects sustained selling pressure rather than healthy accumulation. Weak inflows suggest buyers lack confidence at current price levels.
ARB briefly spiked after forming a new all-time high earlier in the cycle. That move was largely driven by bottom buying activity. However, short-term holders quickly sold into strength. Their rapid distribution capped upside momentum and reinforced downside volatility.
Want more token insights like this? Sign up for Editor Harsh Notariya’s Daily Crypto Newsletter here.

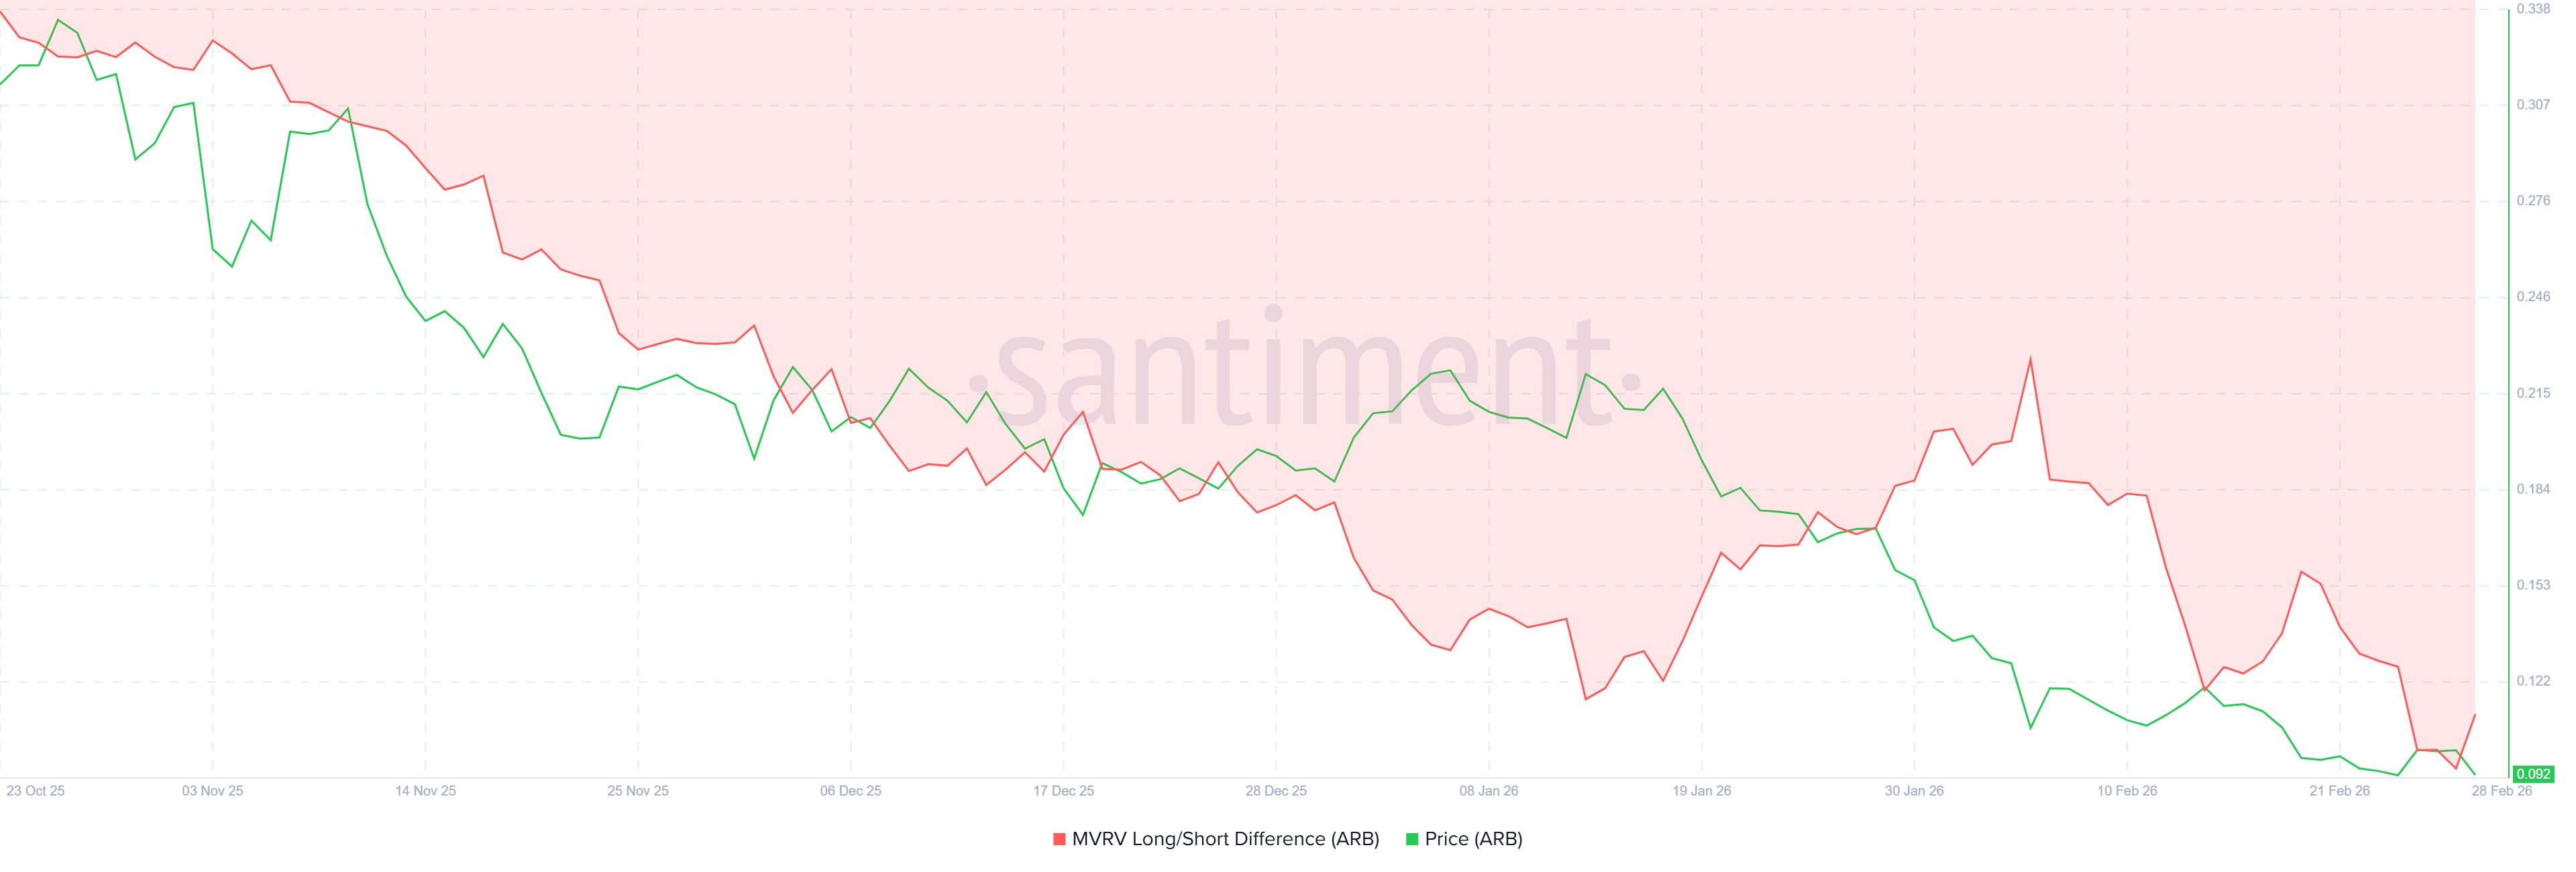
The MVRV Long/Short Difference metric shows that short-term holders currently dominate realized profits. This imbalance creates vulnerability for Arbitrum’s price stability. Short-term holders often exit positions quickly once profitability appears.
This behavior increases the risk of abrupt corrections. Today’s 8% drop reflects that dynamic. When profit-taking from short-term participants intensifies, the price can fall sharply without warning. Until long-term conviction strengthens, ARB remains exposed to sudden declines.
ARB Whales Aren’t Holding Back Either
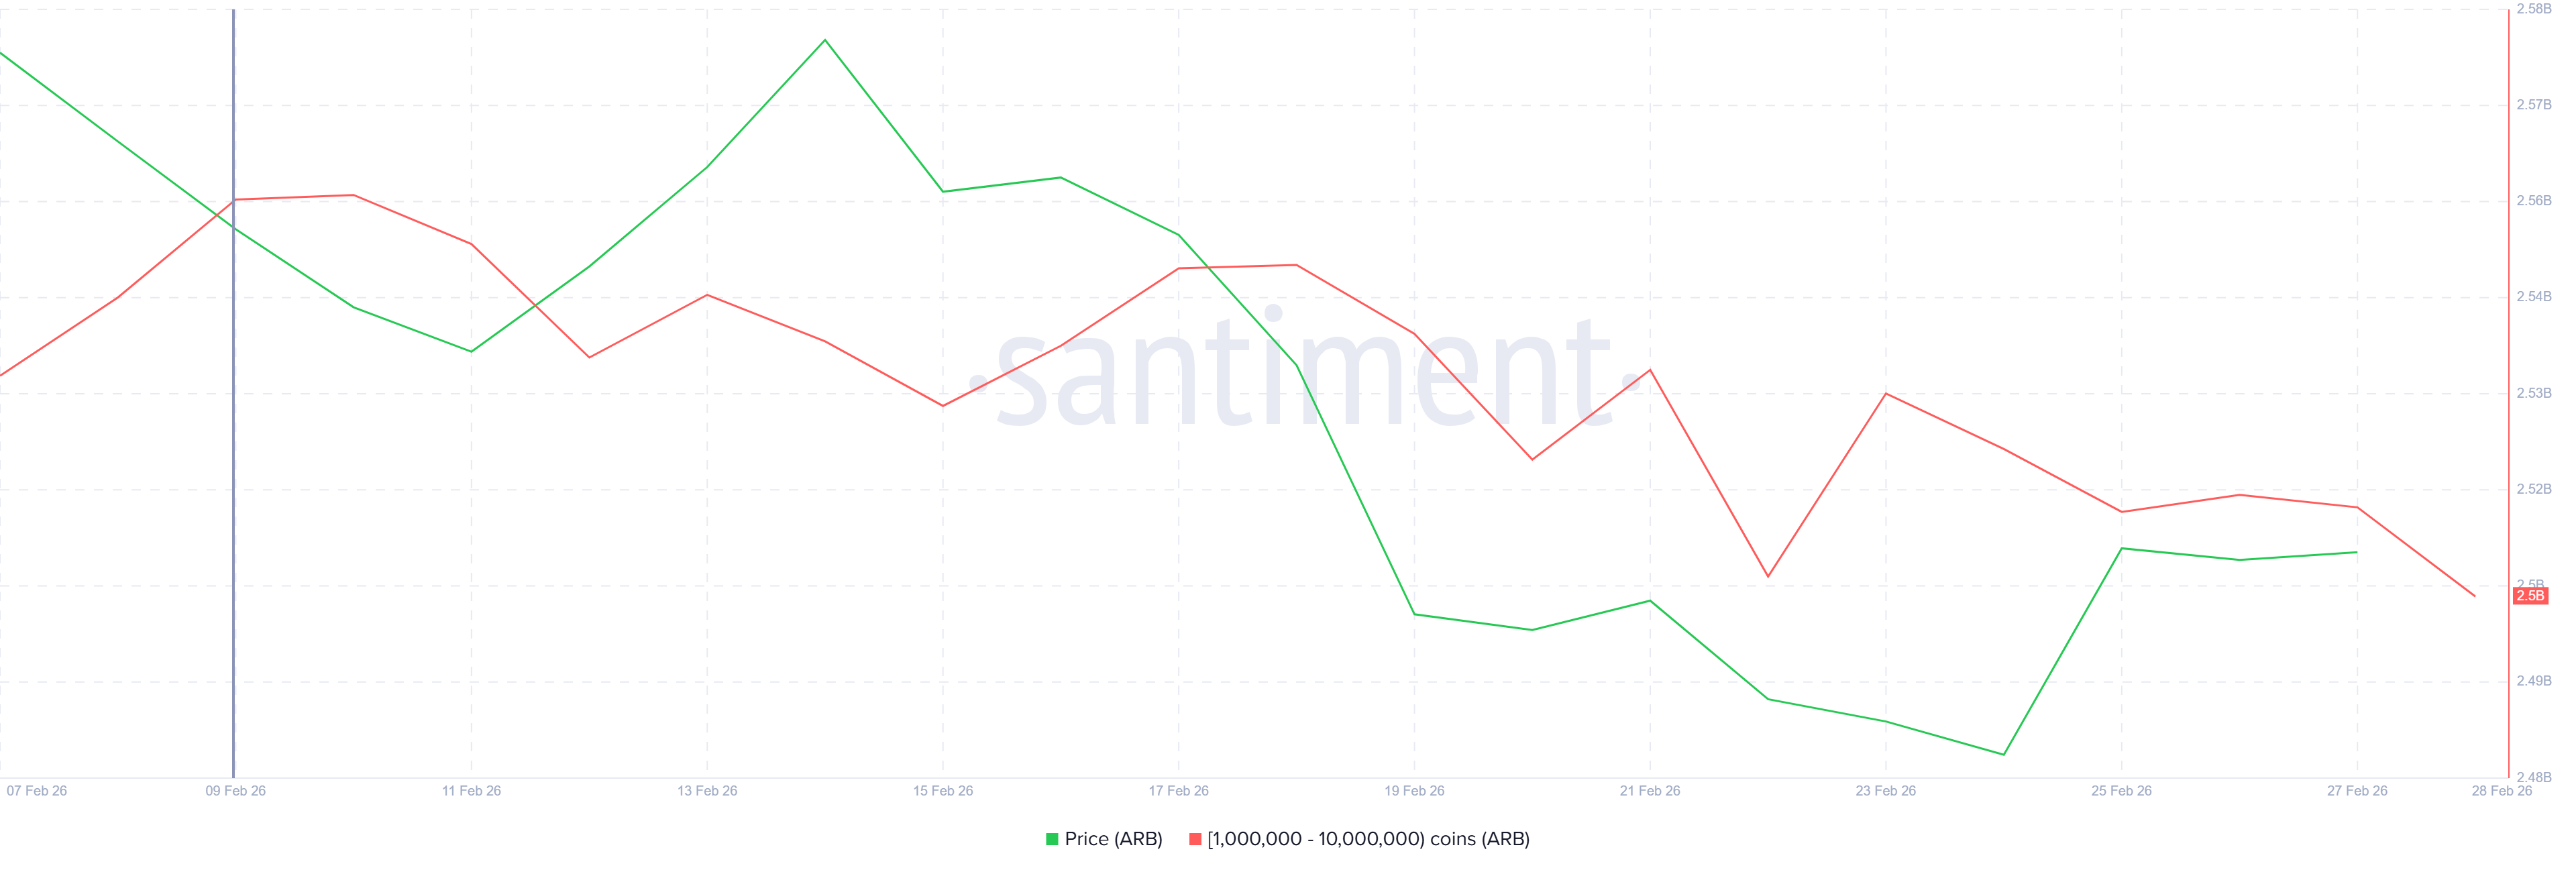
Whale activity adds further pressure to the outlook. Addresses holding between 1 million and 10 million ARB have sold more than 60 million tokens over the past three weeks. This distribution has been gradual rather than panic-driven.
Slow and consistent whale selling often signals waning confidence. Unlike emotional capitulation, steady distribution can suppress recovery attempts. Persistent supply entering the market reduces the probability of a strong rebound in the near term.
ARB Price Faces New All-Time Low
Arbitrum price is down 8% today, trading at $0.0921 at the time of writing. ARB failed to defend the $0.0994 support level. The breakdown triggered additional selling, accelerating downside momentum.
The next support lies at $0.0887, just above the all-time low of $0.0883. Given current indicators, a retest appears likely. A decisive break below this threshold could push ARB toward $0.0821, establishing a new cycle low.

Invalidating this bearish thesis requires a structural shift in sentiment. Investors must slow distribution and restore inflows. ARB needs to reclaim $0.0947 to stabilize short-term momentum. Flipping $0.0994 back into support would open a path toward $0.1060, signaling recovery strength.

The defense-policy arc surrounding artificial intelligence intensified after the U.S. Department of Defense branded Anthropic as a “supply chain risk,” effectively barring its AI models from defense contracting work. Anthropic’s chief executive, Dario Amodei, pushed back in a CBS News interview on Saturday, saying the company would not support mass domestic surveillance or fully autonomous weapons. He argued that such capabilities undermine core American rights and would cede decision-making on war to machines, a stance that clarifies where the company does and does not intend to operate within the government’s broader AI-use cases.
Key takeaways
- The Defense Department labeled Anthropic a “supply chain risk,” prohibiting its contractors from using Anthropic’s AI models in defense programs, a move Amodei described as unprecedented and punitive.
- Anthropic opposes uses of its AI for mass domestic surveillance and autonomous weapons, stressing that human oversight remains essential for wartime decisions.
- Amodei asserted support for other government use cases for Anthropic’s tech, but drew a firm line around privacy protections and governable warfare capabilities.
- Shortly after the Anthropic designation, rival OpenAI reportedly secured a DoD contract to deploy its AI models across military networks, signaling divergent vendor trajectories in the defense-AI space.
- The development spurred online backlash focused on privacy, civil liberties, and the governance of AI in national security, highlighting a broader debate about responsible AI deployment.
Tickers mentioned:
Sentiment: Neutral
Market context: The episode sits at the intersection of AI governance, defense procurement, and risk appetite among institutional tech providers amid ongoing policy debates.
Market context: National-security policy, privacy considerations, and the reliability of autonomous AI systems continue to shape how tech vendors and defense contractors interact with AI tools in sensitive environments, influencing broader technology and investment sentiment in adjacent sectors.
Why it matters
For the crypto and broader technology communities, the Anthropic episode underscores how policy, governance, and trust shape the adoption of advanced AI tools. If defense agencies tighten controls on specific suppliers, vendors may recalibrate product roadmaps, risk models, and compliance frameworks. The tension between expanding AI capabilities and safeguarding civil liberties resonates beyond defense contracts, influencing how institutional investors weigh exposure to AI-driven platforms, data-processing services, and cloud-native AI workloads used by finance, gaming, and digital-assets sectors.
Amodei’s insistence on guardrails reflects a broader demand for accountability and transparency in AI development. While the industry is racing to deploy more capable models, the conversation about what constitutes acceptable use—especially in surveillance and automated warfare—remains unsettled. This dynamic is not limited to U.S. policy; allied governments are scrutinizing similar questions, which could affect cross-border collaborations, licensing terms, and export controls. In crypto and blockchain ecosystems, where trust, privacy, and governance are already central concerns, any AI policy shift can ripple through on-chain analytics, automated compliance tooling, and decentralized identity applications.
From a market-structuring perspective, the juxtaposition of Anthropic’s stance with OpenAI’s contract win—reported shortly after the DoD announcement—illustrates how different vendors navigate the same regulatory terrain. The public discourse around these developments could influence how investors price risk related to AI-enabled technology providers and the vendors that supply critical infrastructure to government networks. The episode also highlights the role of media narratives in amplifying concerns about mass surveillance and civil liberties, which in turn can affect stakeholder sentiment and regulatory momentum around AI governance.
What to watch next
- Congressional active debate over AI guardrails and privacy protections, with potential legislation affecting domestic surveillance, weapons development, and export controls.
- DoD policy updates or procurement guidelines that clarify how AI suppliers are evaluated for national security risk and how substitutions or risk-mitigation measures are implemented.
- Public responses from Anthropic and OpenAI, detailing how each company plans to address government-use cases, compliance, and risk exposure.
- Moves by other defense contractors and AI vendors to secure or renegotiate DoD contracts, including any shifts in alliance-building with cloud providers and data-handling protocols.
- Broader investor and market reaction to AI governance developments, particularly in sectors reliant on data processing, cloud services, and machine-learning workloads.
Sources & verification
- Anthropic CEO Dario Amodei’s CBS News interview discussing his stance on mass surveillance and autonomous weapons: CBS News interview.
- Official statements around Anthropic being labeled a “Supply-Chain Risk to National Security” by DoD leadership, via public channels linked to DoD policy discussions and contemporaneous coverage: Pete Hegseth X post.
- OpenAI’s defense-contract developments and public discussions about deploying AI models across military networks, as reported by Cointelegraph: OpenAI defense contract coverage.
- Critiques focusing on AI-enabled mass surveillance and civil-liberties concerns referenced in coverage of the broader discourse: Bruce Schneier on AI surveillance.
Policy clash over AI suppliers reverberates through defense tech
Anthropic’s chief executive, Dario Amodei, voiced a clear line during a CBS News interview when asked about the government’s use of the company’s AI models. He described the Defense Department’s decision to deem Anthropic a “supply chain risk” as a historically unprecedented and punitive move, arguing that it reduces a contractor’s operational latitude in a way that could hamper innovation. The core of his objection is straightforward: while the U.S. government seeks to leverage AI across a spectrum of programs, certain applications—particularly mass surveillance and fully autonomous weapons—are off-limits for Anthropic’s technology, at least in its current form.
Amodei was careful to differentiate between acceptable and unacceptable uses. He emphasized that the company supports most government use cases for its AI models, provided those applications do not encroach on civil liberties or place too much decision-making authority in machines. His remarks underscore a crucial distinction in the AI policy debate: the line between enabling powerful automation for defense and preserving human control over potentially lethal outcomes. In his view, the latter principle is fundamental to American values and international norms.
The Defense Department’s labeling of Anthropic has been framed by Amodei as a litmus test for how the U.S. intends to regulate a rapidly evolving technology sector. He argued that current law has not kept pace with AI’s acceleration, calling on Congress to enact guardrails that would constrain the domestic use of AI for surveillance while ensuring that military systems retain a human-in-the-loop design where necessary. The idea of guardrails—intended to provide clear boundaries for developers and users—resonates across tech industries where risk management is a competitive differentiator.
Meanwhile, a contrasting development unfolded in the same week: OpenAI reportedly secured a Department of Defense contract to deploy its AI models across military networks. The timing fueled a broader debate about whether the U.S. government is embracing a multi-vendor approach to AI in defense or whether it’s steering contractors toward a preferred set of suppliers. The OpenAI announcement drew immediate attention, with Sam Altman posting a public statement on X, which added to the scrutiny around how AI tools will be integrated into national-security infrastructure. Critics quickly pointed to privacy and civil-liberties concerns, arguing that expanding surveillance-capable technology in the defense domain risks normalizing intrusive data practices.
Amid the public discourse, industry observers noted that the policy landscape is still unsettled. While some see opportunities for AI to streamline defense operations and improve decision cycles, others worry about overreach, lack of transparency, and the potential for misaligned incentives when commercial AI firms become integral to national-security ecosystems. The juxtaposition of Anthropic’s stance with OpenAI’s contract success serves as a microcosm of broader tensions in AI governance: how to balance innovation, security, and fundamental rights in a world where machine intelligence increasingly underpins critical functions. The story thus far suggests that the path forward will depend not only on technical breakthroughs but also on legislative clarity and regulatory pragmatism that align incentives across the public and private sectors.
As the policy conversation continues, stakeholders in the crypto world—where data privacy, compliance, and trust underpin many ecosystems—will be watching closely. The defense-AI tension reverberates through enterprise technology, cloud services, and analytics pipelines that crypto platforms rely on for risk management, compliance tooling, and real-time data processing. If guardrails emerge with explicit guardrails that constrain surveillance-related uses, the implications could cascade into how AI tools are marketed to regulated sectors, including finance and digital assets, potentially shaping the next wave of AI-enabled infrastructure and governance tools.
Key questions remain: Will Congress deliver concrete legislation that defines acceptable AI use in government programs? How will DoD procurement evolve in response to competing vendor strategies? And how will public sentiment shape corporate risk assessments for AI providers who operate in sensitive domains? The coming months are likely to reveal a more explicit framework for AI policing that could influence both public policy and private innovation, with consequences for developers, contractors, and users across the technology landscape.


After exploring fundraising and acquisition options, the teams concluded that no sustainable recovery path existed following the breach.
Solana-based DeFi aggregator, Step Finance, along with two other affiliate projects, SolanaFloor and Remora Markets, announced plans to shut down all operations with immediate effect.
The decision follows the aftermath of a major security incident earlier this year.
Hack, Halt, Shutdown
In a statement shared on X, the teams said the decision came after exploring multiple paths forward, including fundraising and acquisition discussions. However, none resulted in a viable solution after the hack that occurred in late January.
The incident involved an estimated $30 million in assets being drained from Step Finance’s wallets on the Solana network. Subsequent disclosures indicated that the breach stemmed from compromised devices belonging to members of the project’s executive team.
Access to these devices likely exposed private keys or enabled malware that interfered with internal transaction approval processes, which allowed attackers to initiate and approve malicious on-chain transactions. Once access was obtained, the attackers unstaked roughly 261,854 SOL and transferred the funds out of project-controlled wallets. This triggered an immediate market reaction that saw the STEP token fall by more than 80%.
Following detection of the exploit, the team halted certain components of the platform to limit further damage and later reported that approximately $4.7 million in Remora-related assets and other holdings were recovered. As part of the shutdown process, Step Finance said it is working on a buyback program for STEP token holders based on a snapshot taken prior to the incident, while Remora Markets is preparing a redemption process for rToken holders.
Over 200 Hack Incidents in 2025
The hack involving Step Finance ranked among the most expensive DeFi incidents in January 2026, amidst a broader rise in crypto-related losses over the past year. According to data from blockchain security firm PeckShield, scams and hacks drained more than $4.04 billion from users and platforms in 2025, which is an increase of almost 34% compared to 2024.
You may also like:
Of that total, $2.67 billion was attributed to hacks, while $1.37 billion originated from scams, as scam-related losses rose about 64% year-on-year.
PeckShield found a pivot from purely technical exploits toward targeted social engineering, often aimed at centralized entities and high-value individuals, thereby resulting in higher losses per incident. More than 200 hack cases were recorded during the year, excluding scams.
February stood out as the costliest month, driven by a $1.51 billion breach at Bybit.
Binance Free $600 (CryptoPotato Exclusive): Use this link to register a new account and receive $600 exclusive welcome offer on Binance (full details).
LIMITED OFFER for CryptoPotato readers at Bybit: Use this link to register and open a $500 FREE position on any coin!

Think Big: Funded Account lo, aur Financial Freedom ka rasta banao
Blackstone’s Schwarzman Took Home $1.2 Billion Last Year
Claressa Shields & Papoose React To Megan Thee Stallion’s Lyrics

Smart energy pays enters the US market, targeting scalable financial infrastructure

Why Israel is blocking foreign journalists from entering

Bitcoin: We’re Entering The Most Dangerous Phase
Think Big: Funded Account lo, aur Financial Freedom ka rasta banao

Cristiano Ronaldo’s financial journey reflects sustained excellence, discipline, and smart brand

Manchester City Financial Case: Potential Relegation and Major Premier League Fallout#shorts
-

 Sports5 days ago
Women’s college basketball rankings: Iowa reenters top 10, Auriemma makes history
-

 Fashion2 days ago
Weekend Open Thread: Iris Top
-

 Business4 days ago
True Citrus debuts functional drink mix collection
-

 Politics6 days ago
Nick Reiner Enters Plea In Deaths Of Parents Rob And Michele
-

 Politics2 days ago
ITV enters Gaza with IDF amid ongoing genocide
-

 Crypto World5 days ago
XRP price enters “dead zone” as Binance leverage hits lows
-
Sports1 day ago
The Vikings Need a Duck
-

 Business7 days ago
Mattel’s American Girl brand turns 40, dolls enter a new era
-

 Tech5 days ago
Unsurprisingly, Apple's board gets what it wants in 2026 shareholder meeting
-
 NewsBeat14 hours ago
Dubai flights cancelled as Brit told airspace closed ’10 minutes after boarding’
-

 Business7 days ago
Law enforcement kills armed man seeking to enter Trump’s Mar-a-Lago resort, officials say
-

 NewsBeat3 days ago
Cuba says its forces have killed four on US-registered speedboat | World News
-
 NewsBeat3 days ago
Manchester Central Mosque issues statement as it imposes new measures ‘with immediate effect’ after armed men enter
-
 NewsBeat19 hours ago
The empty pub on busy Cambridge road that has been boarded up for years
-

 Tech3 hours ago
Unihertz’s Titan 2 Elite Arrives Just as Physical Keyboards Refuse to Fade Away
-
 NewsBeat6 days ago
‘Hourly’ method from gastroenterologist ‘helps reduce air travel bloating’
-

 Tech7 days ago
Anthropic-Backed Group Enters NY-12 AI PAC Fight
-

 NewsBeat10 hours ago
Abusive parents will now be treated like sex offenders and placed on a ‘child cruelty register’ | News UK
-

 NewsBeat7 days ago
Armed man killed after entering secure perimeter of Mar-a-Lago, Secret Service says
-

 Politics7 days ago
Maine has a long track record of electing moderates. Enter Graham Platner.