
Crypto World
Is the Ethereum price crash over as network metrics surge?

Ethereum’s price crash continued its strong downward trend this week, reaching its lowest level since June 23 as the crypto market dive accelerated.
Summary
- Ethereum price continued its strong downward trend this week.
- The network’s transactions and active users have soared in the last 30 days.
- Technical analysis suggests that ETH price has more downside to go in the near term.
Ethereum (ETH) token dropped to a low of $2,180, down by over 54% from its highest level since August last year. This retreat has brought its market value to over $274 billion.
Ethereum has crashed despite the ongoing network and ecosystem boom as companies like Fidelity, JPMorgan, and Janus Henderson embrace its network for their tokenized assets.
Data compiled by Nansen shows that Ethereum’s network is firing on all cylinders. For example, the number of active addresses jumped by 45% in the last 30 days to over 15 million.
Another metric shows that the number of transactions jumped by 40% in the last 30 days to over 68 million, the highest level in years.
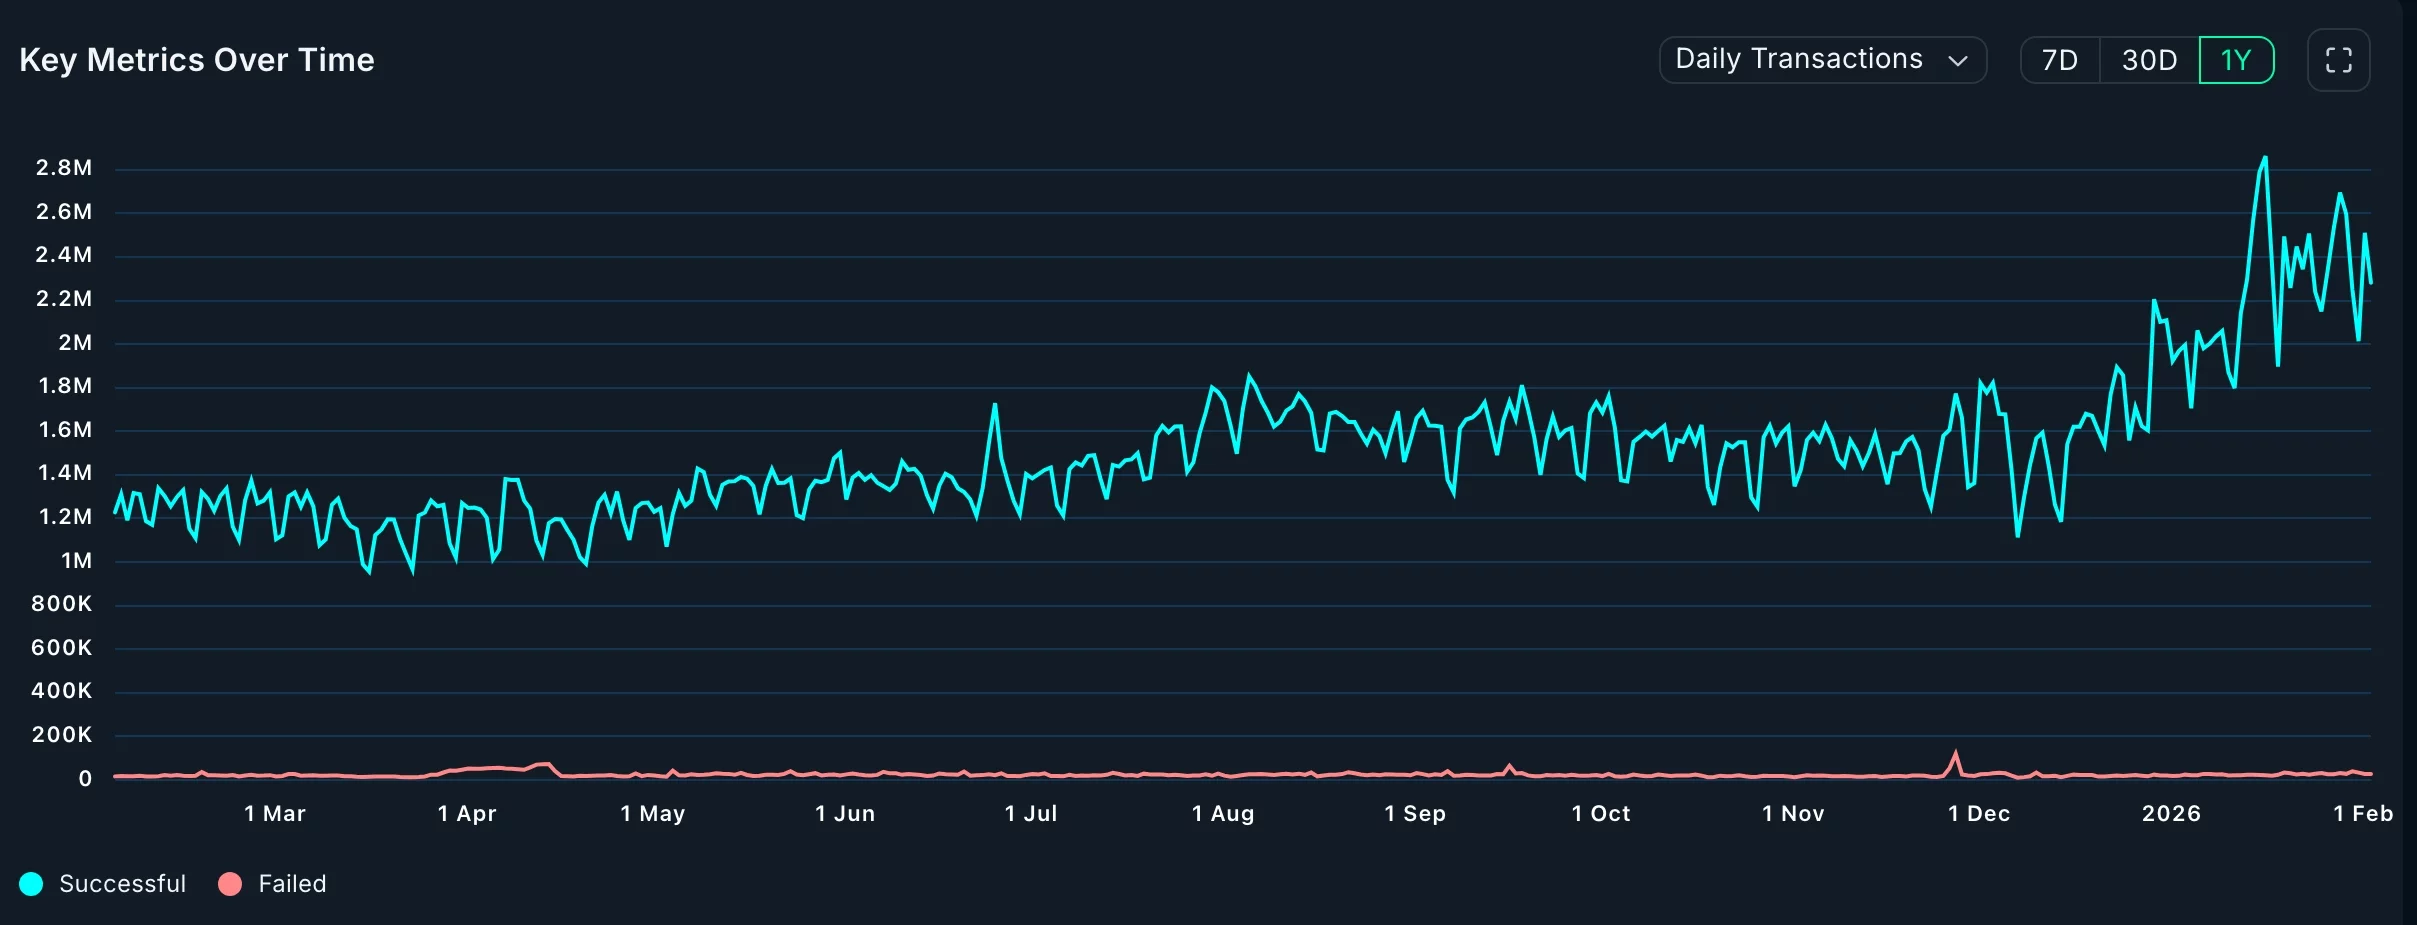
This growth has pushed its chain fees to over $15 million, up by 40% in the last 30 days. This growth occurred even as Ethereum transaction fees have continued to fall over the past few months.
More data show that Ethereum’s decentralized exchange network continued to rise in January, a trend that will likely continue in the coming weeks. Its DEX networks rose to over $52.8 billion in January from $49 billion in December last year. The most notable DEX networks are Uniswap, Curve Finance, Fluid, and Balancer.
Most importantly, Ethereum has become a major player in the real-world asset tokenization industry, with its distributed asset value rising by 15% over the last 30 days to over $14.4 billion. Its stablecoin market capitalization rose to over $165 billion.
Ethereum price technical analysis
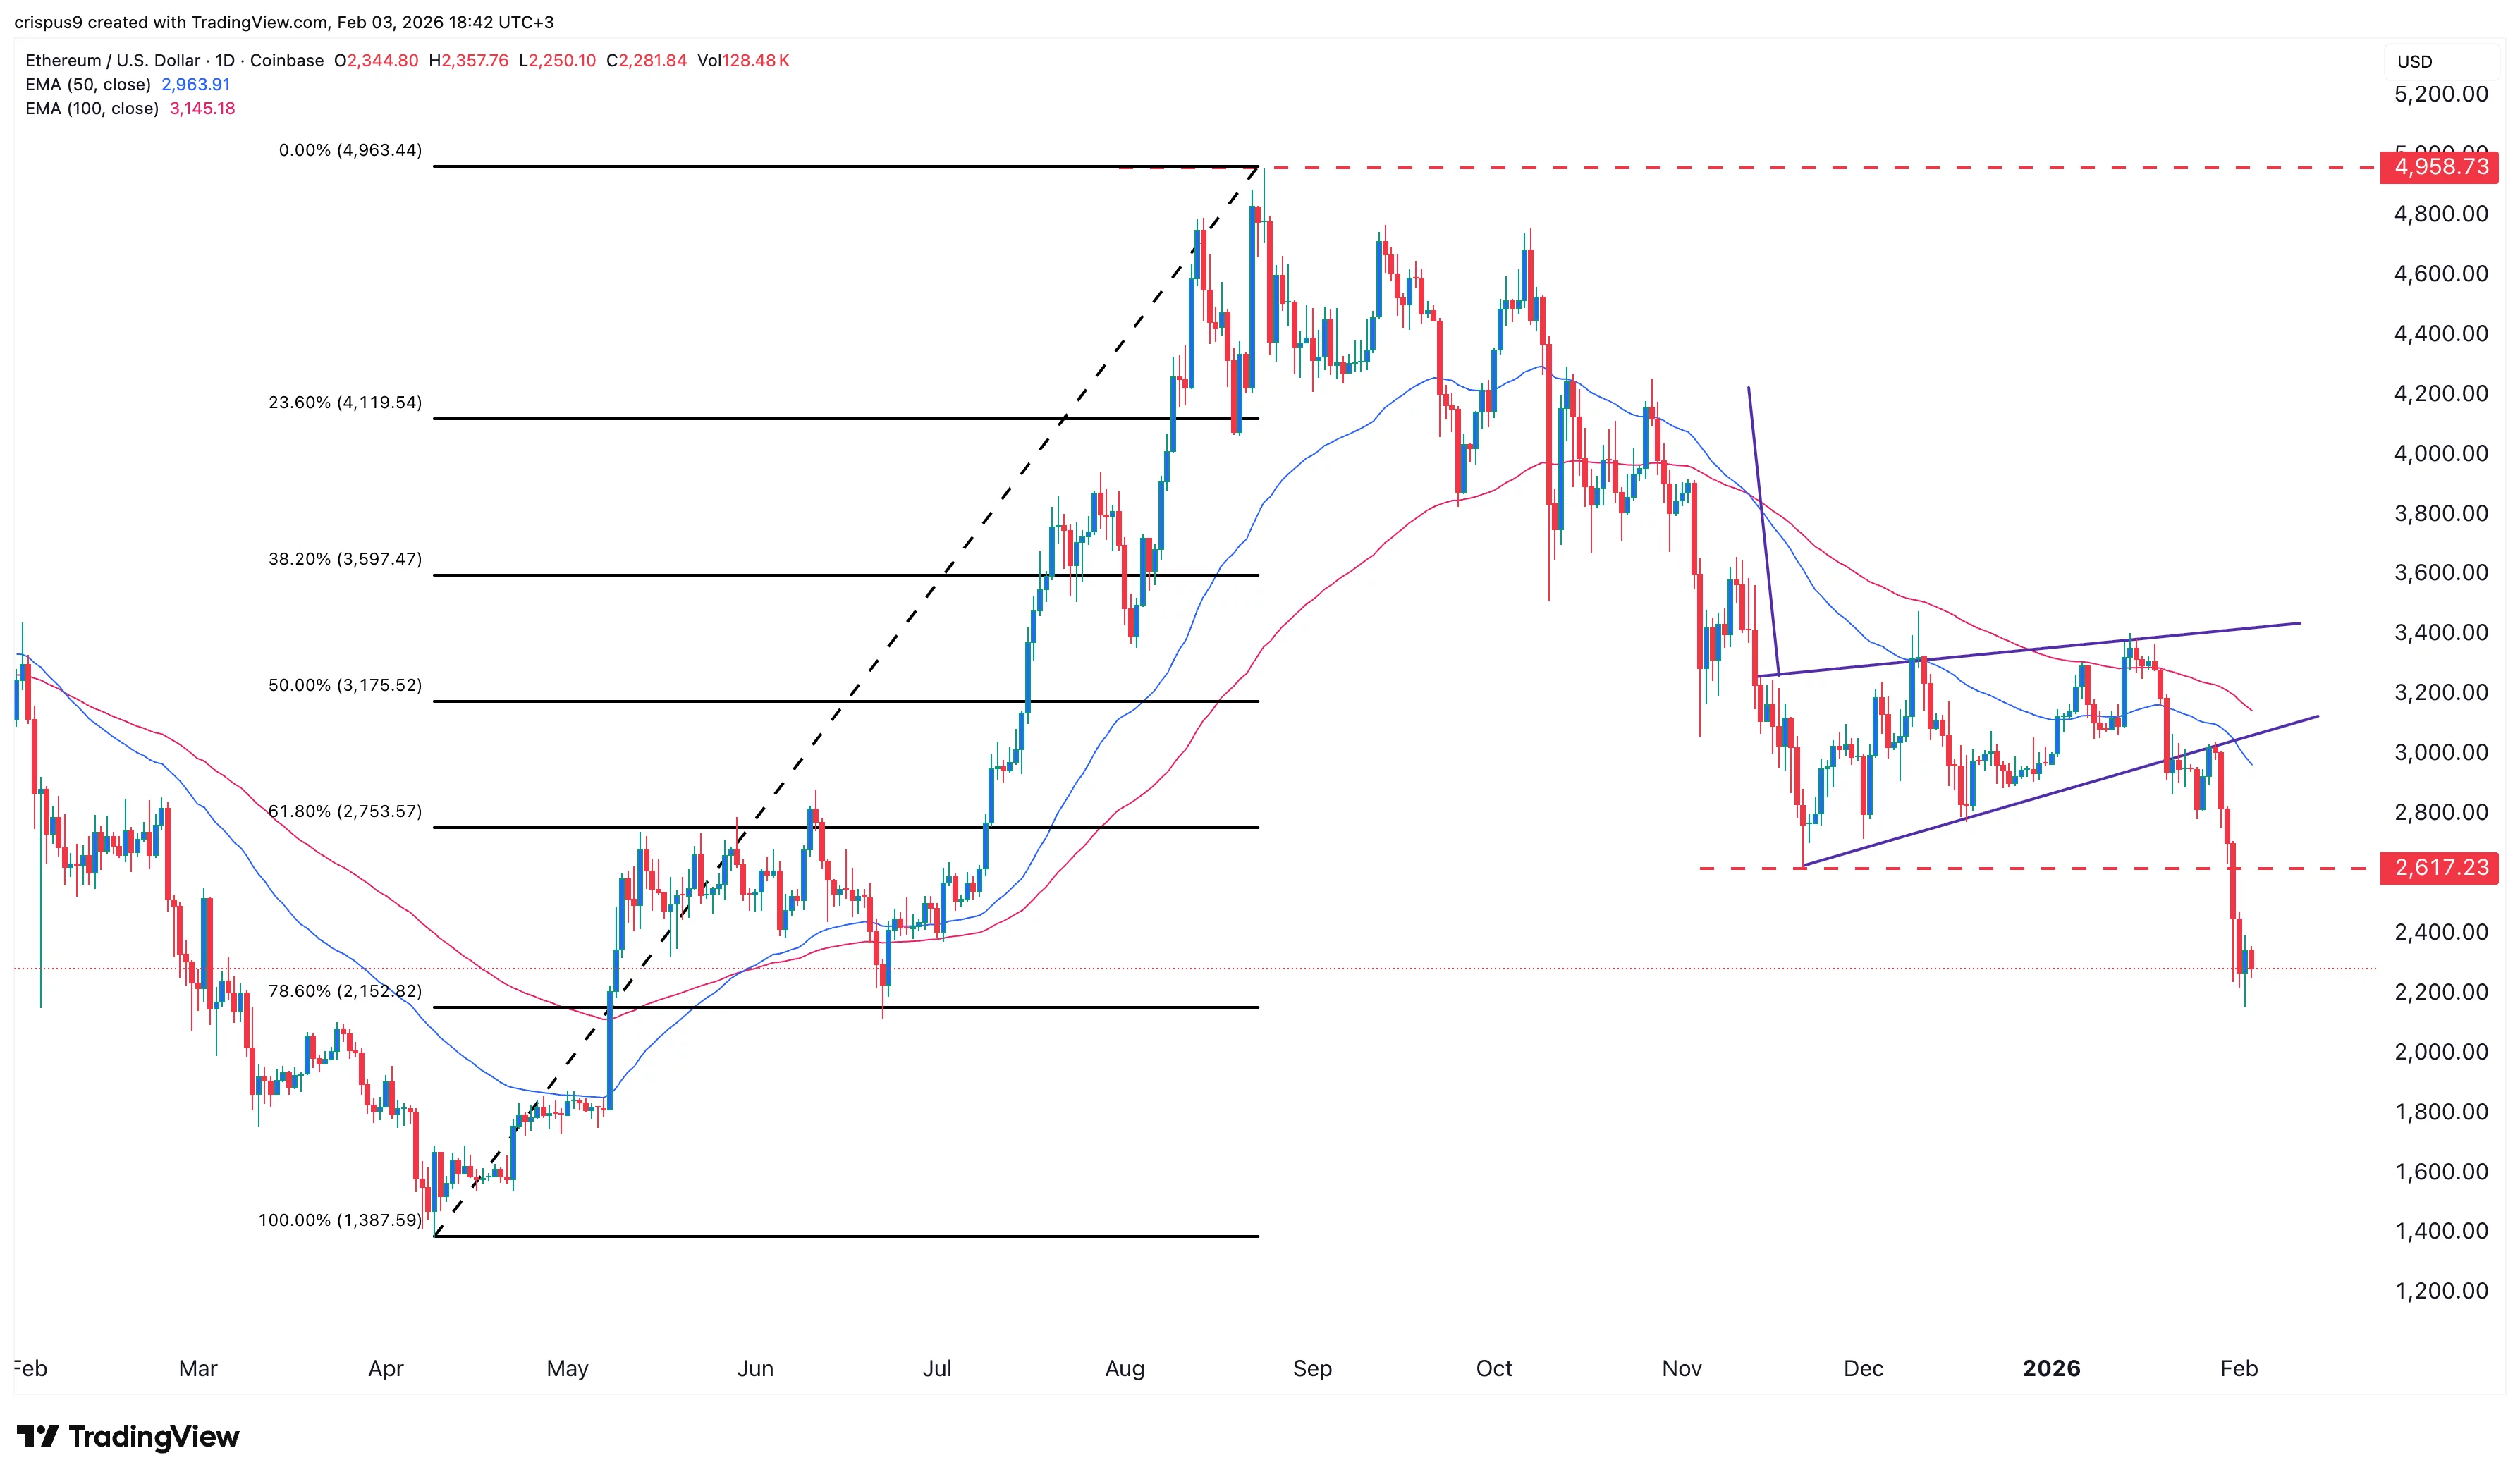
The daily timeframe chart shows that the ETH price has been in a strong downward trend in the past few weeks. It crashed recently after forming a bearish flag pattern, which consists of a vertical line and an ascending channel.
Ethereum price has dropped below the 61.8% Fibonacci Retracement level at $2,753. It moved below the 50-day moving average and Supertrend indicator.
ETH is forming a bearish pennant pattern, a common continuation pattern in technical analysis. It has also moved below the Supertrend indicator.
Therefore, the most likely Ethereum price prediction is bearish, with the next key support level being at $2,000.


Cantor Fitzgerald has donated $10 million to Fellowship PAC, a crypto-focused super PAC chaired by Tether’s U.S. head of government affairs Jesse Spiro, according to Federal Election Commission filings disclosed Wednesday.
The donation comes at a moment when the line between traditional finance and crypto lobbying capital is becoming hard to define.
The headline number is large enough to matter. Whether it buys the regulatory outcomes the industry wants – and on what timeline – is the harder question.
- Donor: Cantor Fitzgerald committed $10 million to Fellowship PAC, disclosed in February FEC filings.
- Total raised: Wednesday’s FEC filing revealed $11 million in total contributions, including donations from other sources alongside Cantor’s $10 million.
- PAC leadership: Fellowship PAC is chaired by Jesse Spiro, Tether’s U.S. head of government affairs, and was established in 2025.
- Anchorage Digital: The digital asset bank separately contributed $1 million to Fellowship PAC.
- Spending to date: Fellowship has deployed $3 million on advocacy advertising and $1.5 million backing three Republican candidates, including Kentucky Senate candidate Nate Morris and Georgia Representative Clay Fuller.
- Cantor-Tether history: Cantor Fitzgerald has served as custodian for Tether’s reserve assets since 2021, making this donation an extension of an already entrenched institutional relationship.
- Political context: Fellowship PAC secured over $100 million in funding commitments ahead of the prior election cycle, positioning itself alongside rivals Fairshake and Defend American Jobs.
- Watch: FEC filings through 2025 and 2026 for additional commitments toward Fellowship’s $100 million goal and candidate endorsement patterns ahead of pivotal congressional sessions on crypto regulation.
How the Cantor-Fellowship Donation Actually Works, and What $10 Million Buys in Washington
A super PAC operates without contribution limits from corporations or individuals, provided it does not coordinate directly with candidates.
Fellowship PAC uses that structure to back pro-crypto candidates in federal races and fund issue-advocacy advertising – the $3 million already spent on advocacy ads is the clearest example of the latter in action.
Cantor Fitzgerald’s involvement is not a new relationship dressed up as political altruism. The firm has custodied Tether’s reserve assets since 2021, putting it at the center of the world’s most systemically significant stablecoin operation.
When Howard Lutnick, then Cantor’s CEO, now U.S. Secretary of Commerce, faced Senate confirmation hearings, lawmakers pressed him specifically on those crypto ties and their implications for liquidity markets and counter-terrorism financing policy.
Lutnick has since exited day-to-day operations; Cantor is now run by his sons. The $10 million donation follows that transition, which makes it a cleaner read on institutional intent rather than one executive’s personal calculus.
The firm is making a deliberate bet that pro-crypto regulatory outcomes in Washington are worth funding at scale.
The legislative target is not abstract. Congress is actively debating frameworks covering stablecoins and digital asset market structure under the CLARITY Act, and PAC money of this magnitude is aimed squarely at shaping who sits in the seats where those votes happen.
Anchorage Digital’s concurrent $1 million contribution to Fellowship signals the same logic from the crypto-native banking side.

The bullish read is straightforward: a $10 million check from a firm of Cantor’s standing signals that TradFi has moved from cautious observation to active political investment.
That is not the same as regulatory clarity arriving on any particular schedule. PAC spending influences candidate selection and creates political goodwill, it does not write legislation or guarantee floor votes.
The post Cantor Fitzgerald Donates $10 Million to Crypto PAC Led by Tether Executive appeared first on Cryptonews.
Chiliz (CHZ) surged 14.7% in the past 24 hours on April 16, trading at $0.0429 with a market cap of $441.9 million, as a convergence of technical and on-chain signals suggests a renewed push toward the $0.050 resistance zone.
Price broke above both the 20 and 50-period daily moving averages for the first time since the January 2026 fakeout. On-chain data shows exchange inflows near six-month lows, reinforcing the case for organic demand.
Daily Structure Points to a Breakout Attempt
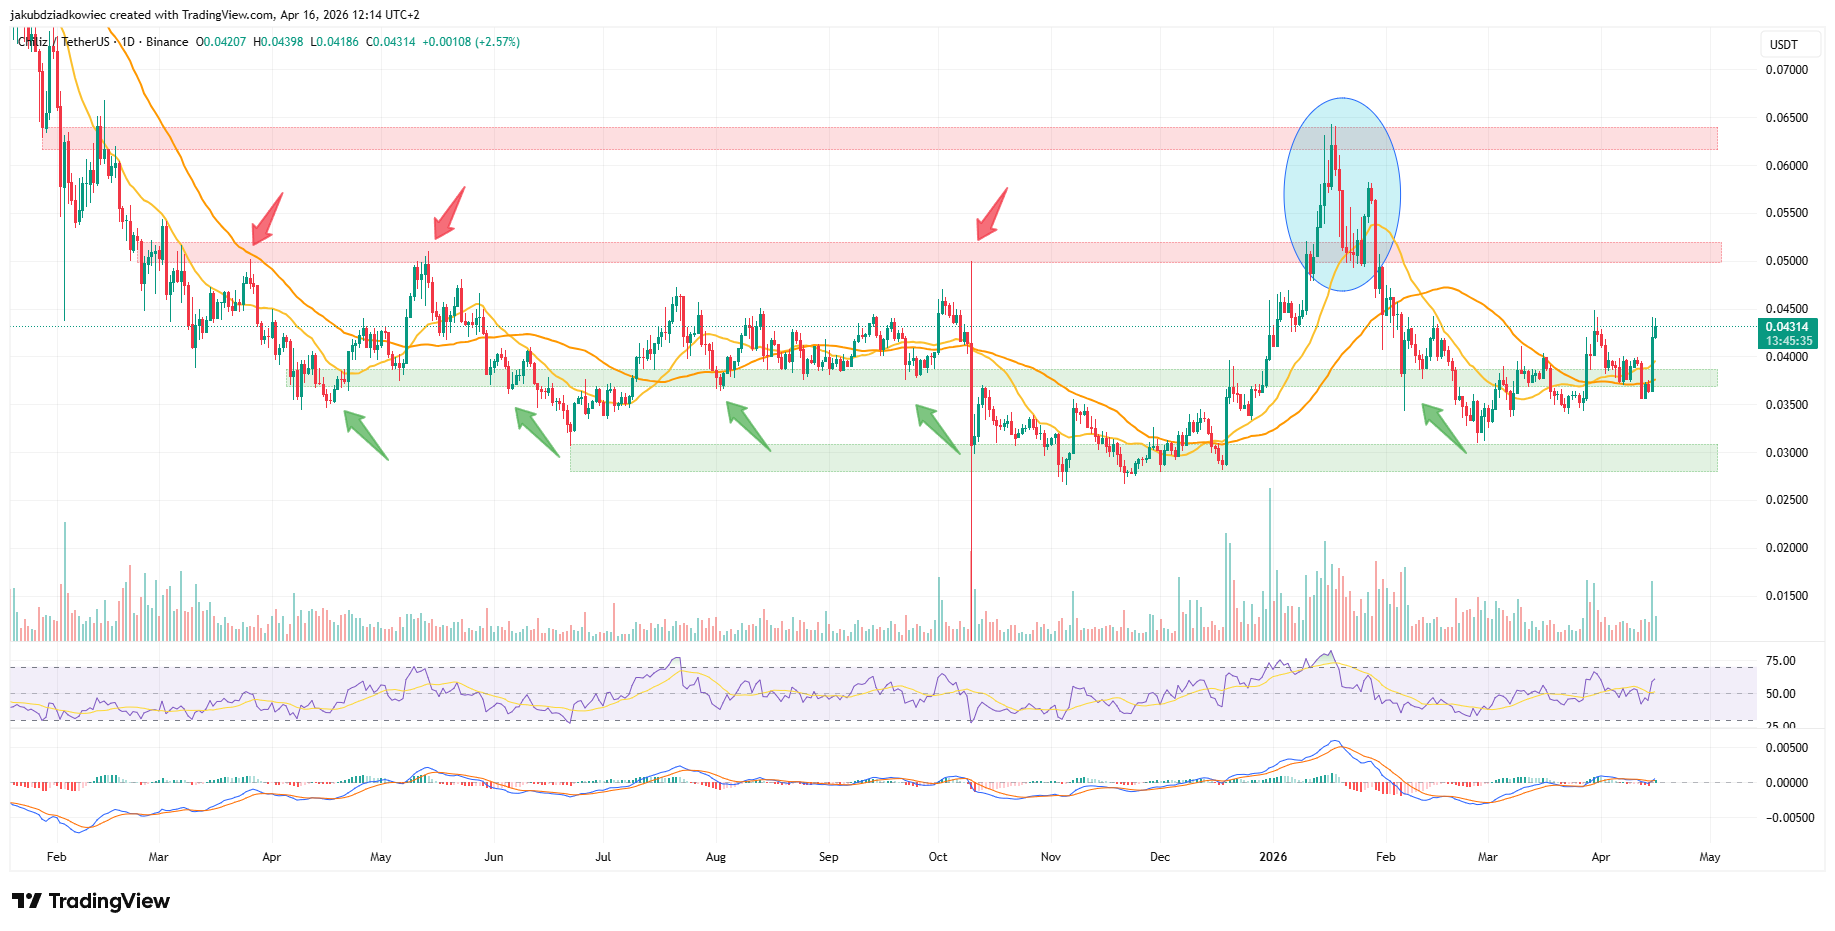
CHZ has been building a base since February 2025, forming two distinct zones that have repeatedly absorbed selling pressure. The deeper support sits between $0.028 and $0.030. A secondary zone between $0.036 and $0.038 held on four separate occasions since mid-2025, with each rebound marked by green arrows on the chart.
On the resistance side, the $0.050 to $0.052 band has rejected CHZ at least three times over the same period (red arrows). In January 2026, the price temporarily pushed into the $0.062 to $0.064 region. That move failed quickly and price pulled back sharply through both resistance levels, resetting conditions for a more measured attempt.

The April 16 daily candle closed at $0.04314, above both moving averages for the first time since the January peak (blue ellipse). Volume registered a notable spike alongside the close, ending a prolonged downtrend in trading activity.
The RSI is rising from neutral territory and has not yet reached overbought levels. The MACD histogram has turned positive, indicating that bullish momentum is accelerating on the daily timeframe.
Prior analysis of CHZ highlighted the difficulty of sustaining closes above these averages, making the current structure notable.
Four-Hour Channel Points to $0.046
The four-hour chart presents a parallel ascending channel dating back to February 19. Price has respected both the upper and lower bands as well as the midline throughout the pattern. Four distinct midline touches (blue circles) confirm its role as a dynamic pivot.
Chiliz is now trading above the midline at $0.04292. The upper band near $0.046 represents the next near-term target. A sustained close above that level would expose the $0.050 zone, which aligns directly with the daily resistance band. CHZ has previously required a confirmed daily close above $0.050 to sustain any move into the higher range.
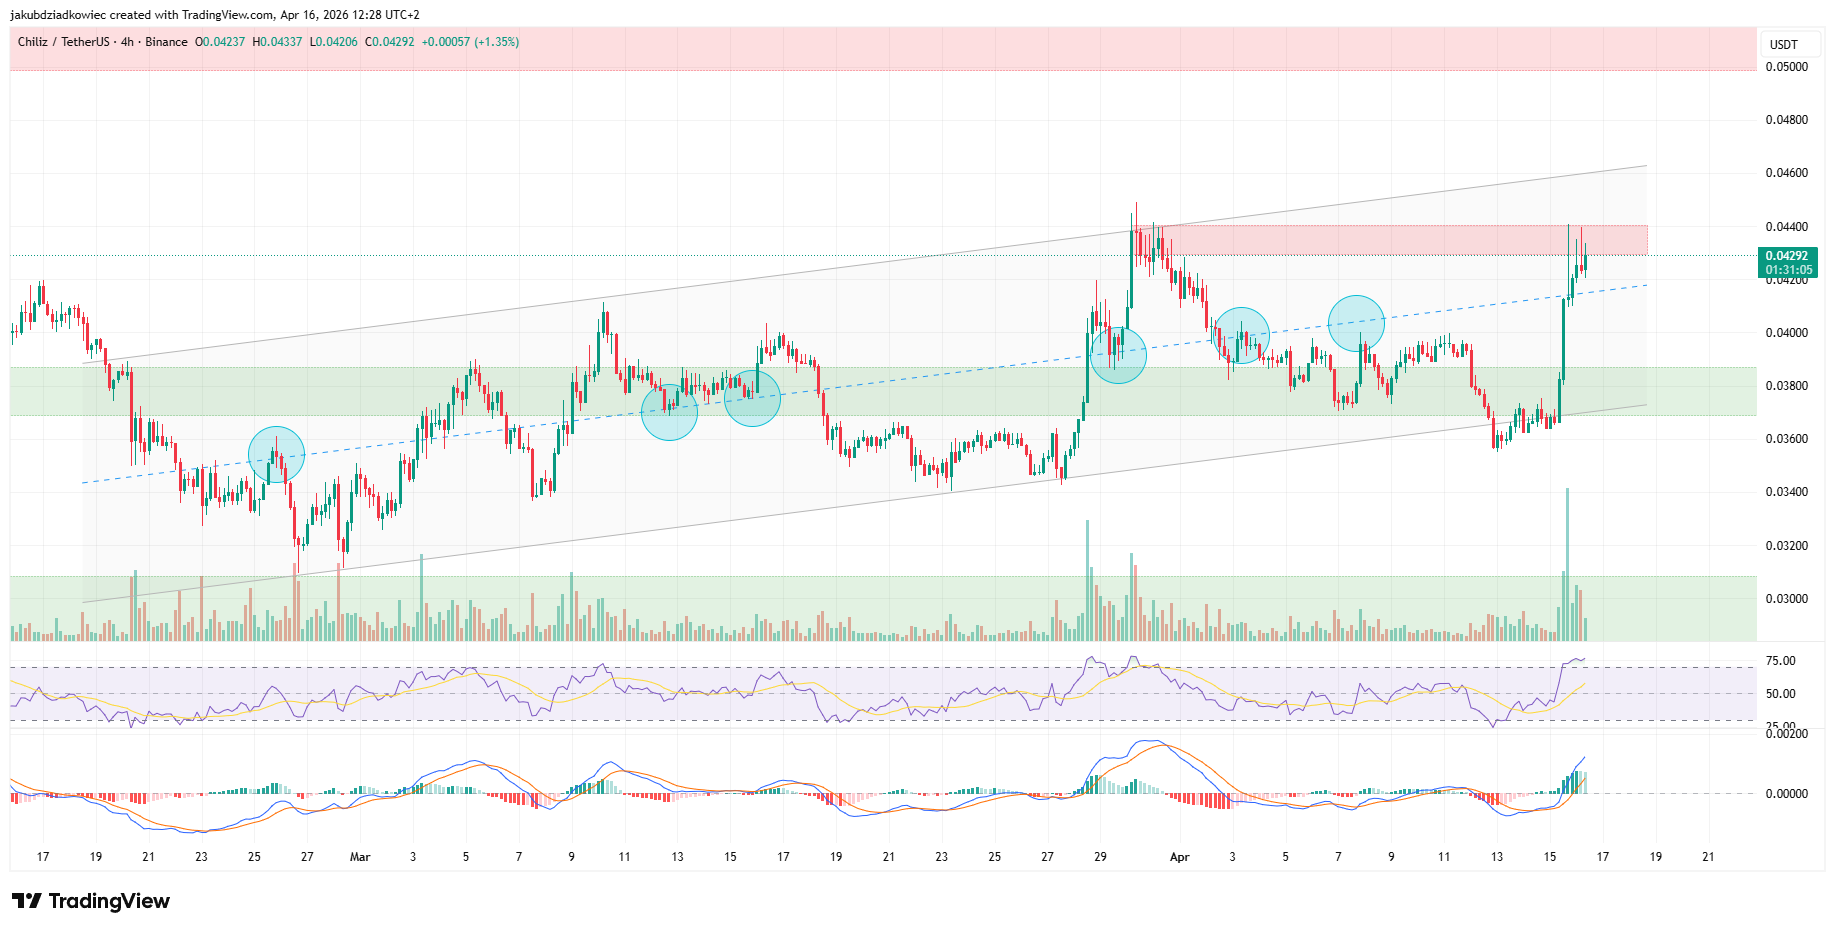
The four-hour RSI has climbed above 70, reflecting strong short-term momentum. The MACD remains positive but is beginning to lose steam, which may produce a brief consolidation before another leg higher.
A pullback toward the $0.036 to $0.038 zone would negate the current structure. There, the channel lower band converges with daily support to form a reinforced floor.
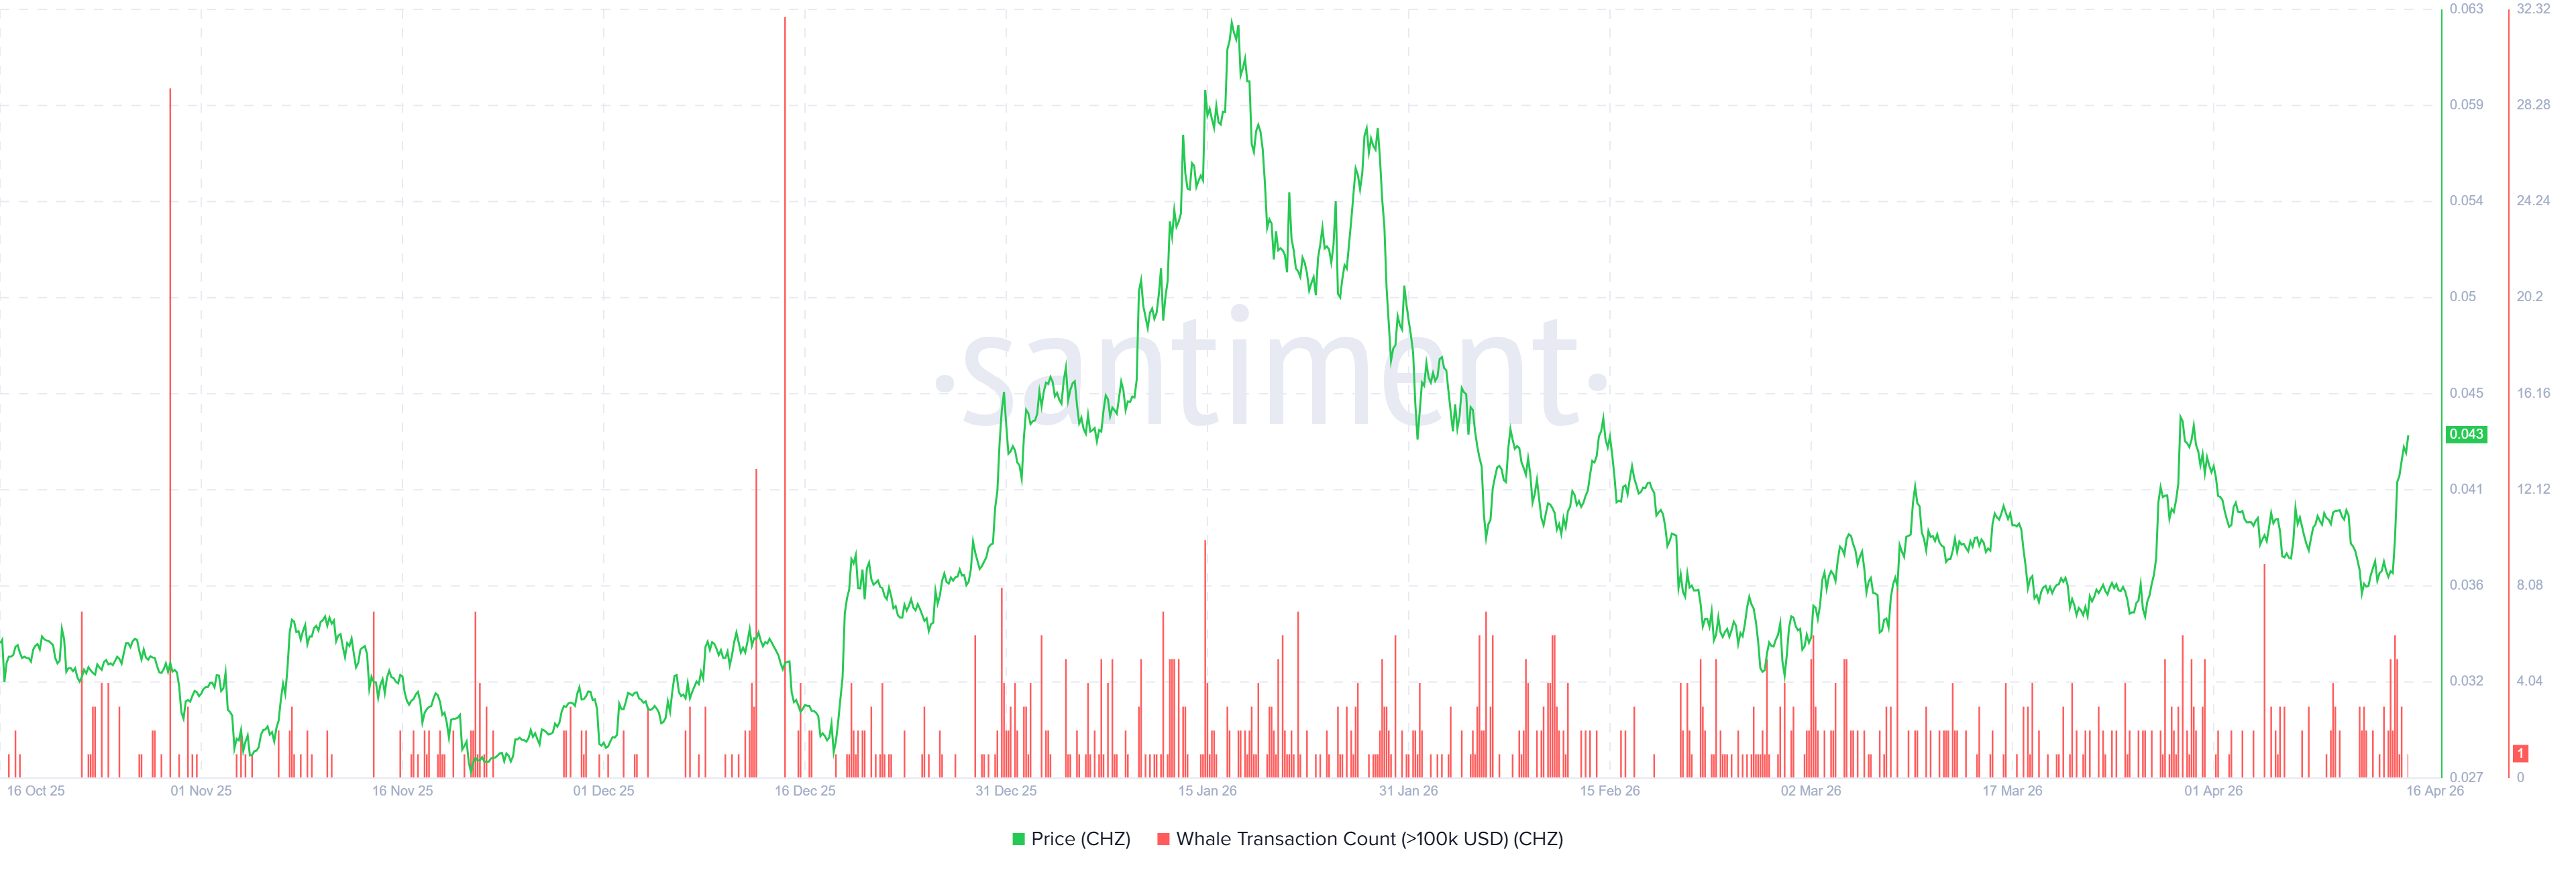
Chiliz Whale Activity and Low Inflow Support the Bullish Case
Santiment data shows that whale transaction count for CHZ, tracking transfers above $100,000, registered a modest uptick on April 16. The spike is small relative to the peaks recorded during the January 2026 rally and the December 2025 accumulation phase.
That context is constructive. It suggests large players are cautiously re-entering rather than aggressively positioning, a pattern that has historically preceded sustained moves. Prior rebounds driven by whale accumulation at similar structural support levels were followed by multi-week price advances.
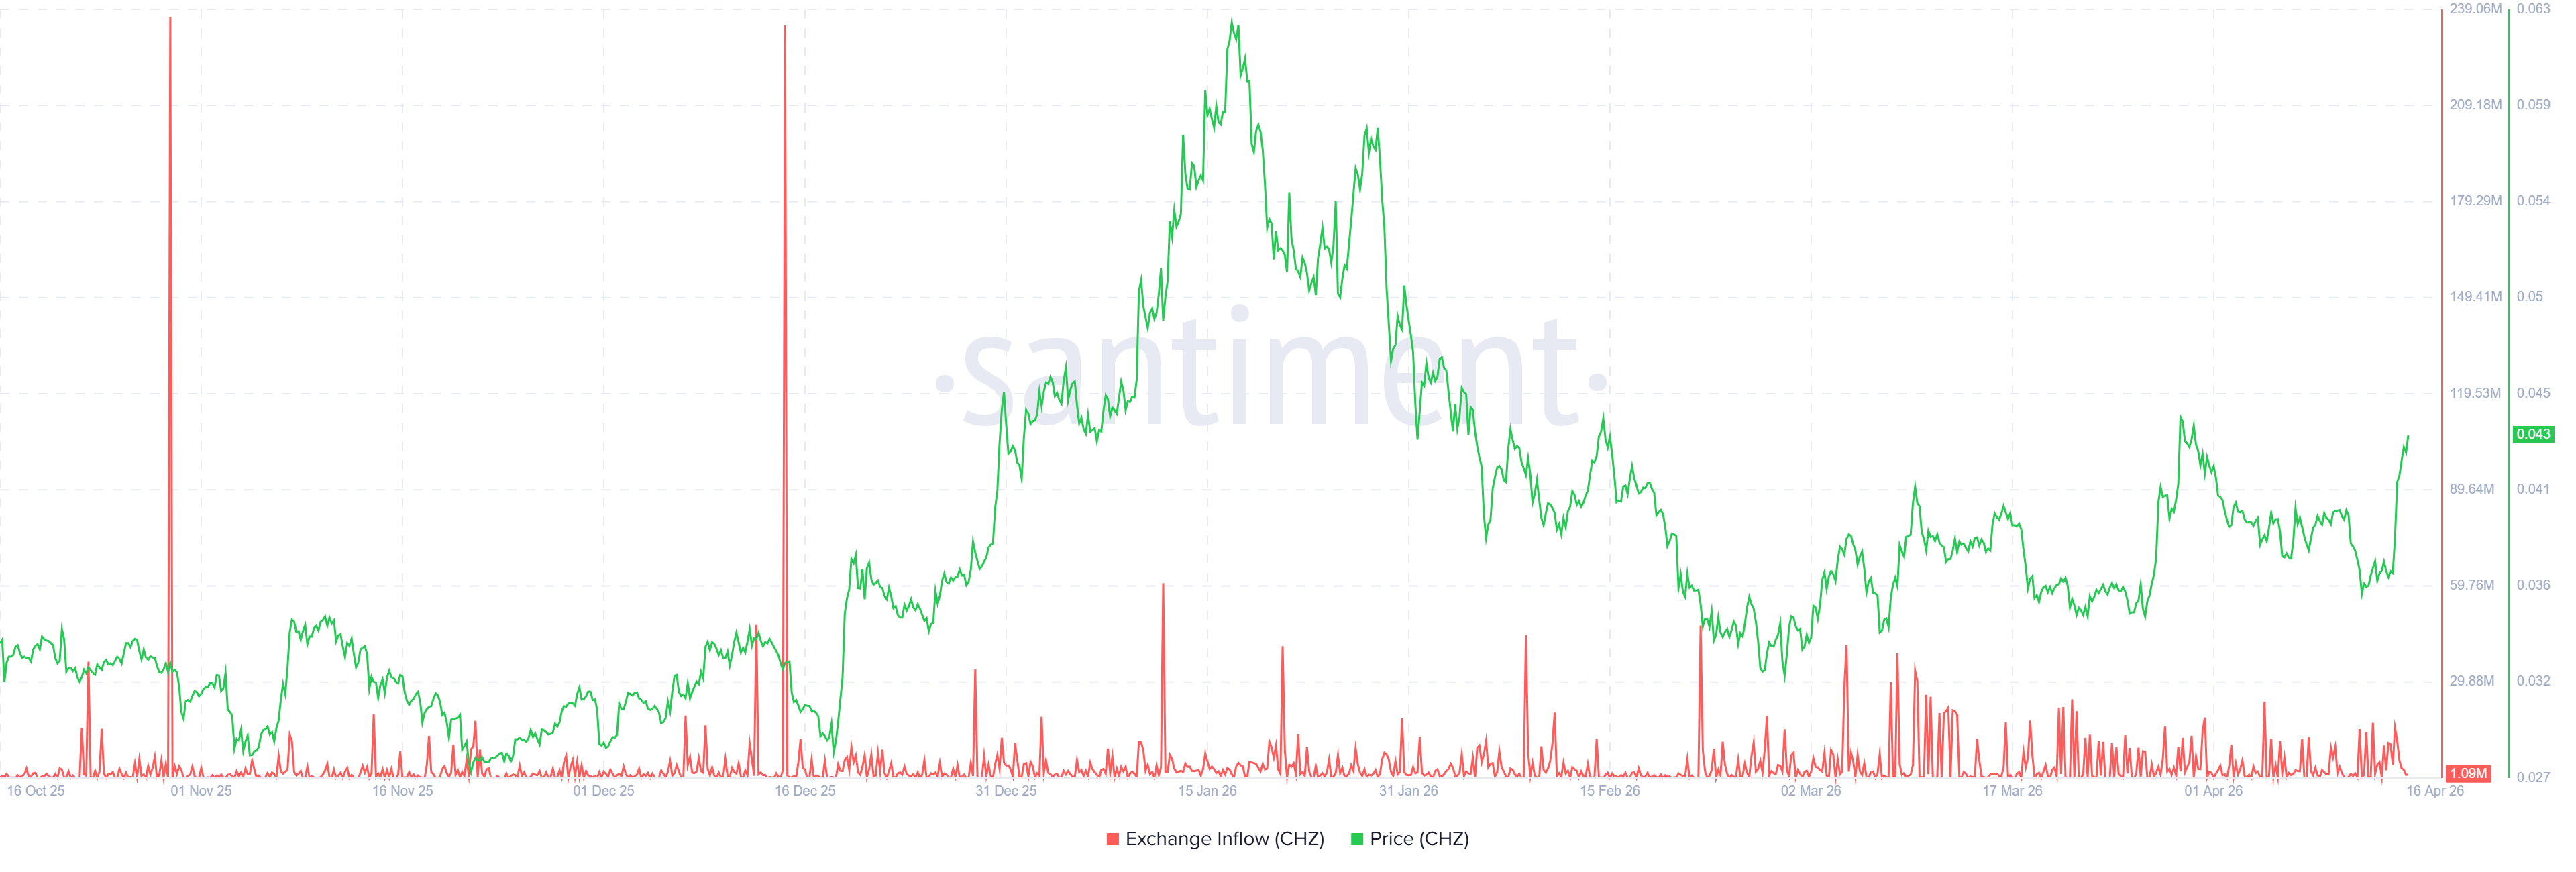
Exchange inflow data reinforces that reading. The current inflow stands at just 1.09 million CHZ, one of the lowest readings over the past six months. For comparison, spikes above 200 million CHZ were recorded in November and December 2025 during periods of heavy distribution.
Low exchange inflow indicates that holders are not moving assets to selling venues. That dynamic is consistent with organic accumulation rather than manufactured price movement, the kind of setup that preceded each of CHZ’s recoveries from the $0.036 to $0.038 support zone over the past year.
Chiliz may extend toward $0.046 in the near term, then test the $0.050 to $0.052 resistance band. A decisive daily close above $0.052 could open the path toward the $0.062 to $0.064 region last visited during the January fakeout.
A failure to hold $0.038 would shift the probability back toward the deeper $0.028 to $0.030 accumulation zone and suggest the current breakout attempt has run out of fuel.
The post Chiliz Eyes $0.05 as On-Chain Data and Parallel Channel Confirm Bullish Setup appeared first on BeInCrypto.
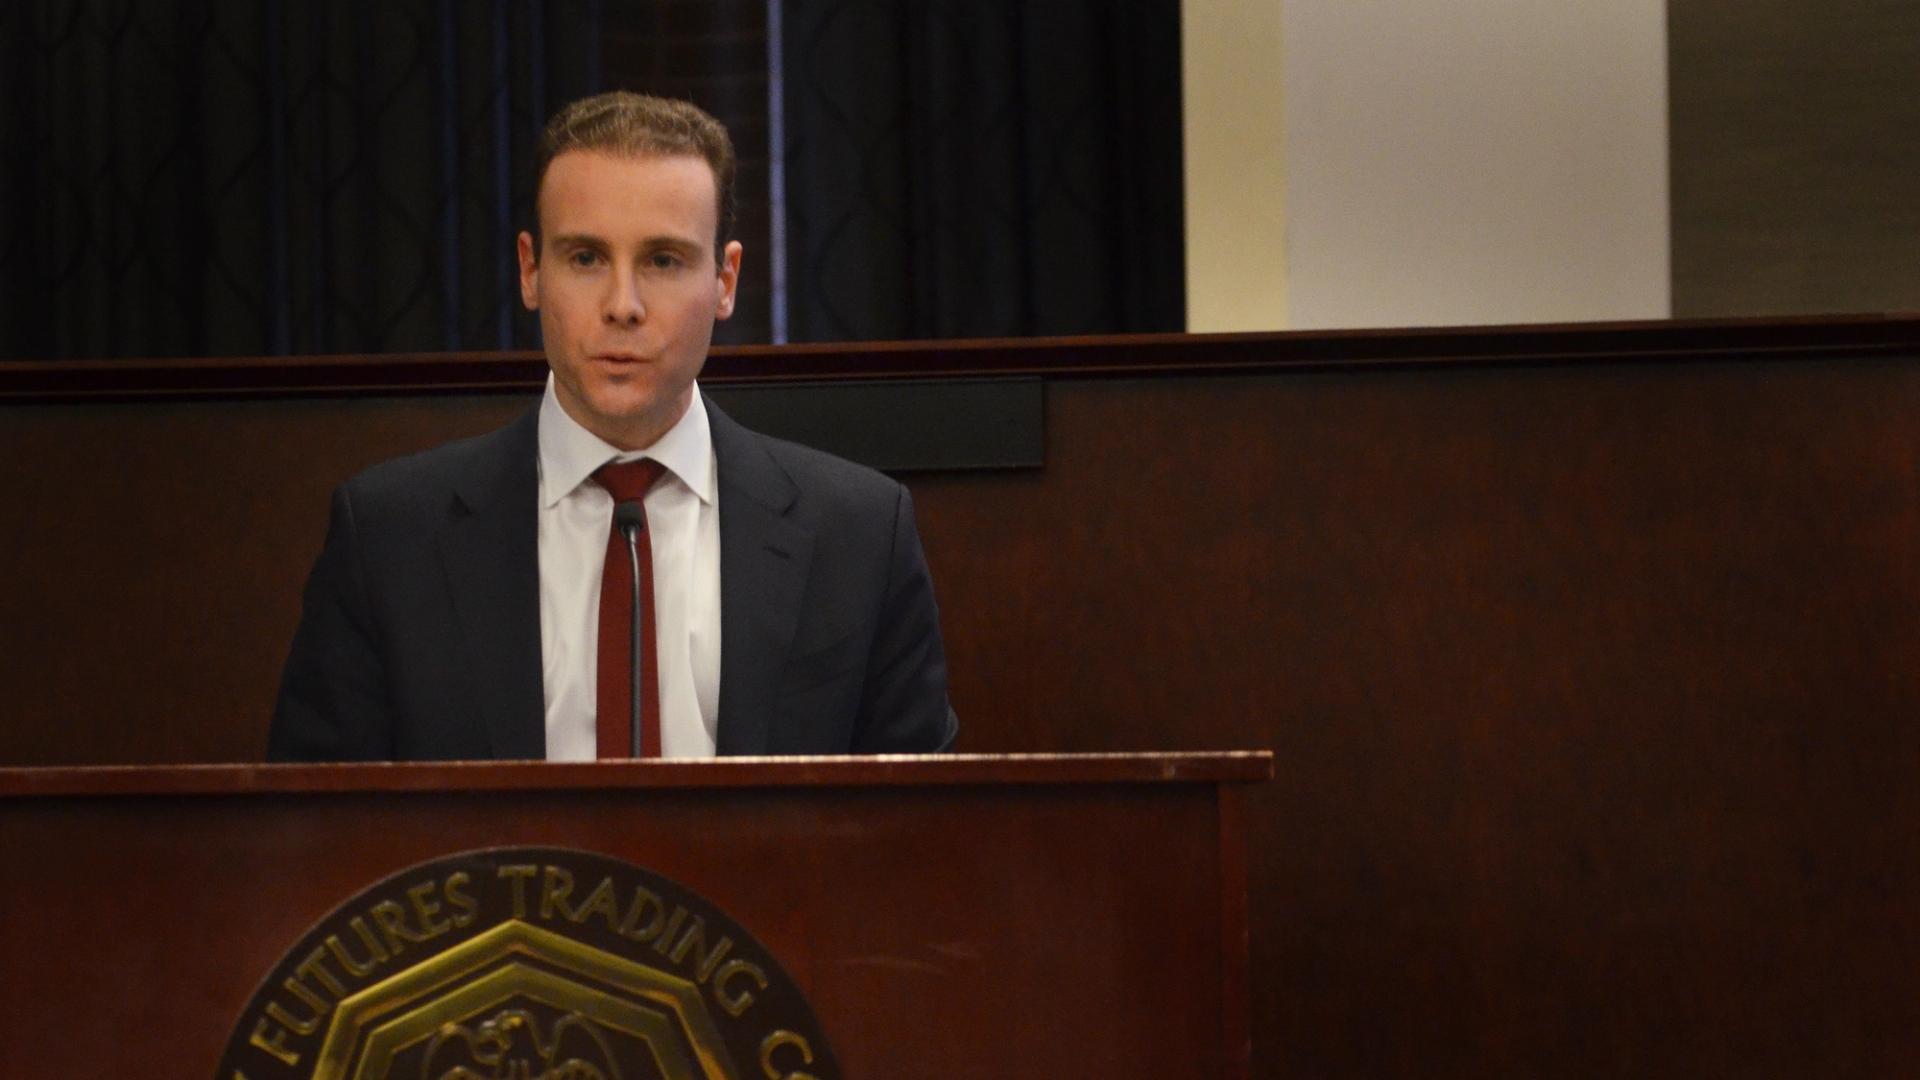

The U.S. Commodity Futures Trading Commission is leaning into artificial intelligence and automation as it faces massive new oversight responsibilities, according to congressional testimony from Chairman Mike Selig, even as his agency’s workforce has declined significantly under the administration of President Donald Trump.
About a quarter of the CFTC’s staff has left since 2025, under Trump’s demands that the federal workforce be cut significantly, according to agency records. But the CFTC is also being called upon to regulate new and rapidly growing arenas for cryptocurrency and the prediction markets.
“Tools such as AI are going to be very helpful in surveilling and bringing the investigations, and we’re incorporating that into various workflows,” Selig told lawmakers of the House Agriculture Committee at a Thursday hearing, citing widespread use of Microsoft’s Copilot AI tool as one productivity aid. When asked about the staff declines at his agency, Selig said, “we are running more efficiently and effectively.”
“We’re putting a lot on your plate with digital assets, and we’re obviously going down this path with prediction markets,” noted committee Chairman Glenn “GT” Thompson. He sought an assurance from the CFTC chief that if he finds himself “in a situation where you know the need for additional qualified staff emerges” that he’ll ask the panel for help.
“Absolutely,” Selig responded.
He asserted that proper enforcement of the markets is a “top priority” of his, though the CFTC budget request for next year asked for only three more enforcement staff to make 108 people — still about 23% shy of the 140 the division had in 2025.
The Digital Asset Market Clarity Act that the Senate continues to work on would elevate the CFTC into a central role over non-securities crypto trading, which would include transactions in leading assets such as bitcoin and Ethereum’s ether (ETH). The agency is also claiming a dominant legal jurisdiction over the prediction markets such as at leading firms Polymarket and Kalshi, which are rocketing from levels measured in the millions of dollars a year ago to multiple billions now.
Selig’s Democratic predecessor, former Chairman Rostin Behnam, had routinely argued that the agency would need more people to oversee crypto and didn’t have the resources to police the world as prediction markets spread in depth and in a virtually unlimited breadth of contract topics. During Selig’s brief tenure, the prediction markets have erupted in accusations of insider trading, a few of which have been addressed by the firms themselves. But the markets have drawn heavy scrutiny on certain trades around U.S. military actions and government statements that suggest small numbers of anonymous traders made significant money on correct bets, suggesting the potential for insider trading from people with government insight.
The chairman acknowledged “numerous investigations ongoing” in prediction markets, though he wouldn’t quantify a number or discuss their focus. He said the regulated platforms are the first line of defense against insider trading, fraud and market manipulation in the hundreds of new markets (binary event questions) that emerge every day on the platforms, while the CFTC itself is a second line of defense.
“We regularly reject contracts,” Selig noted. “We’re actively reviewing what’s out there,” he said, adding that his agency has a “zero tolerance” policy for illicit market activity.
“Anyone who engages in that behavior will face the full force of the law,” he said.
But Representative Angie Craig, the committee’s top Democrat, argued that “the agency’s workforce is stretched too thin,” especially considering the agency’s role as the “primary regulator of two of the fastest growing and most volatile markets.”
“We must give the CFTC the staff, the funding and the clear statutory authority it needs to do its job,” Craig said.
The personnel declines at the regulator includes the commission itself, which is supposed to have five members under the law — including two commissioners from the minority party — but which has been left by the White House as a solitary posting of Selig. The chairman was questioned repeatedly about that during the Thursday oversight hearing, including whether he’d proceed with major rules as a one-person commission.
“We cannot for the sake of the American people slow down our rulemaking,” he said, suggesting he’ll move alone on new regulations. The CFTC is pursuing a preliminary rule process to set up guardrails for U.S. prediction markets, and Selig has also pushed policy initiatives in crypto.
Read More: CFTC sues Illinois, Arizona, Connecticut over states’ sports prediction market efforts
Bitcoin trades below the profitability threshold for active holders, with early signs of BTC demand offering limited price support for now.
Bitcoin (BTC) hit range highs above $76,000 on Wednesday, but Glassnode analysts say data suggest that calling for the start of a new bull market is premature.
New capital inflows have stayed weak, with Bitcoin’s growth rate remaining negative across all 105 trading days in 2026, highlighting a gap between stable price action and limited new demand.
Bitcoin profitability signal remains unresolved
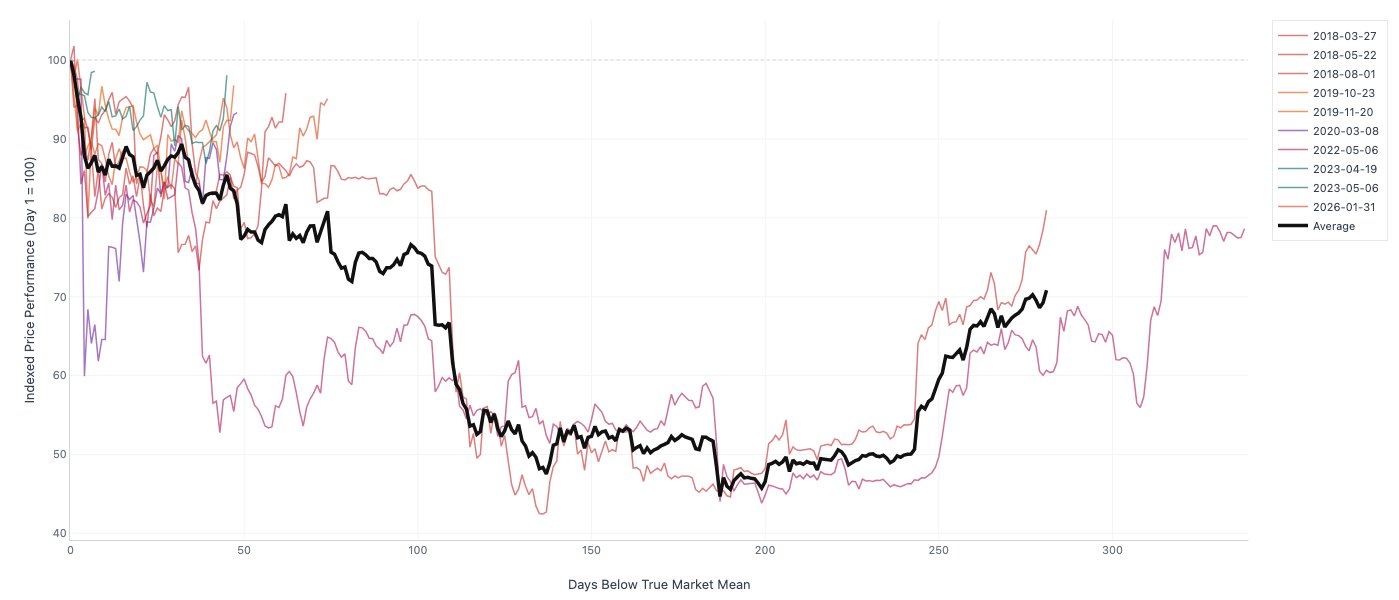
Glassnode analyst CryptoViz.art uses the true market mean (TMM) to estimate the average cost basis of active BTC investors. The metric divides investor capitalization by liveliness-adjusted circulating supply, filtering out inactive coins and the lost supply.
Bitcoin crossed below this level on Jan. 31 and has stayed there for 75 days. The move placed the average active holder in a loss position, with a peak drawdown of 20% and a current gap of about 5% below the entry level.

Historical comparisons show 10 similar breaks since 2016, with durations ranging from two days to over 11 months. The deepest drawdowns reached 57% during the 2018–2019 and 2022–2023 cycles, while the March 2020 event saw a 40% decline over 49 days. The analyst added,
“That said, 75 days is still early. The 2018 and 2022 episodes didn’t bottom until months 5-9. The signal isn’t “all clear” — it’s watch closely.”
Reclaiming the TMM, currently at $78,013, is key for active investors to return to profit, and it has aligned with momentum resets in earlier cycles.
Related: Adam Back says Bitcoin’s post-quantum shift may reveal true Satoshi stash
BTC capital outflows shape the price ceiling
Bitcoin researcher Axel Adler Jr. points to a steady outflow of capital from the BTC market. The 365-day growth rate of market cap relative to realized cap has remained negative for all 105 trading days in 2026, with the latest reading at -0.000652.

In simple terms, the market is not attracting enough new money to support higher prices.
The 30-day realized cap change shows the same trend. Only seven days saw positive inflows this year, all during a brief period in mid-January. Since Jan. 23, the metric has stayed negative, though it has improved slightly to -0.32% from early April lows near -0.54%.
Realized cap has also dropped to $1.08 trillion from $1.12 trillion since the start of the year, a 3.23% decline.
Adler Jr. said the recent improvement signals a slowdown in BTC outflows, not a bullish reversal. A meaningful shift would require both metrics to turn positive and hold above zero for a sustained period.

Related: Morgan Stanley’s Bitcoin fund overtakes WisdomTree after 6 trading days
This article is produced in accordance with Cointelegraph’s Editorial Policy and is intended for informational purposes only. It does not constitute investment advice or recommendations. All investments and trades carry risk; readers are encouraged to conduct independent research before making any decisions. Cointelegraph makes no guarantees regarding the accuracy or completeness of the information presented, including forward-looking statements, and will not be liable for any loss or damage arising from reliance on this content.


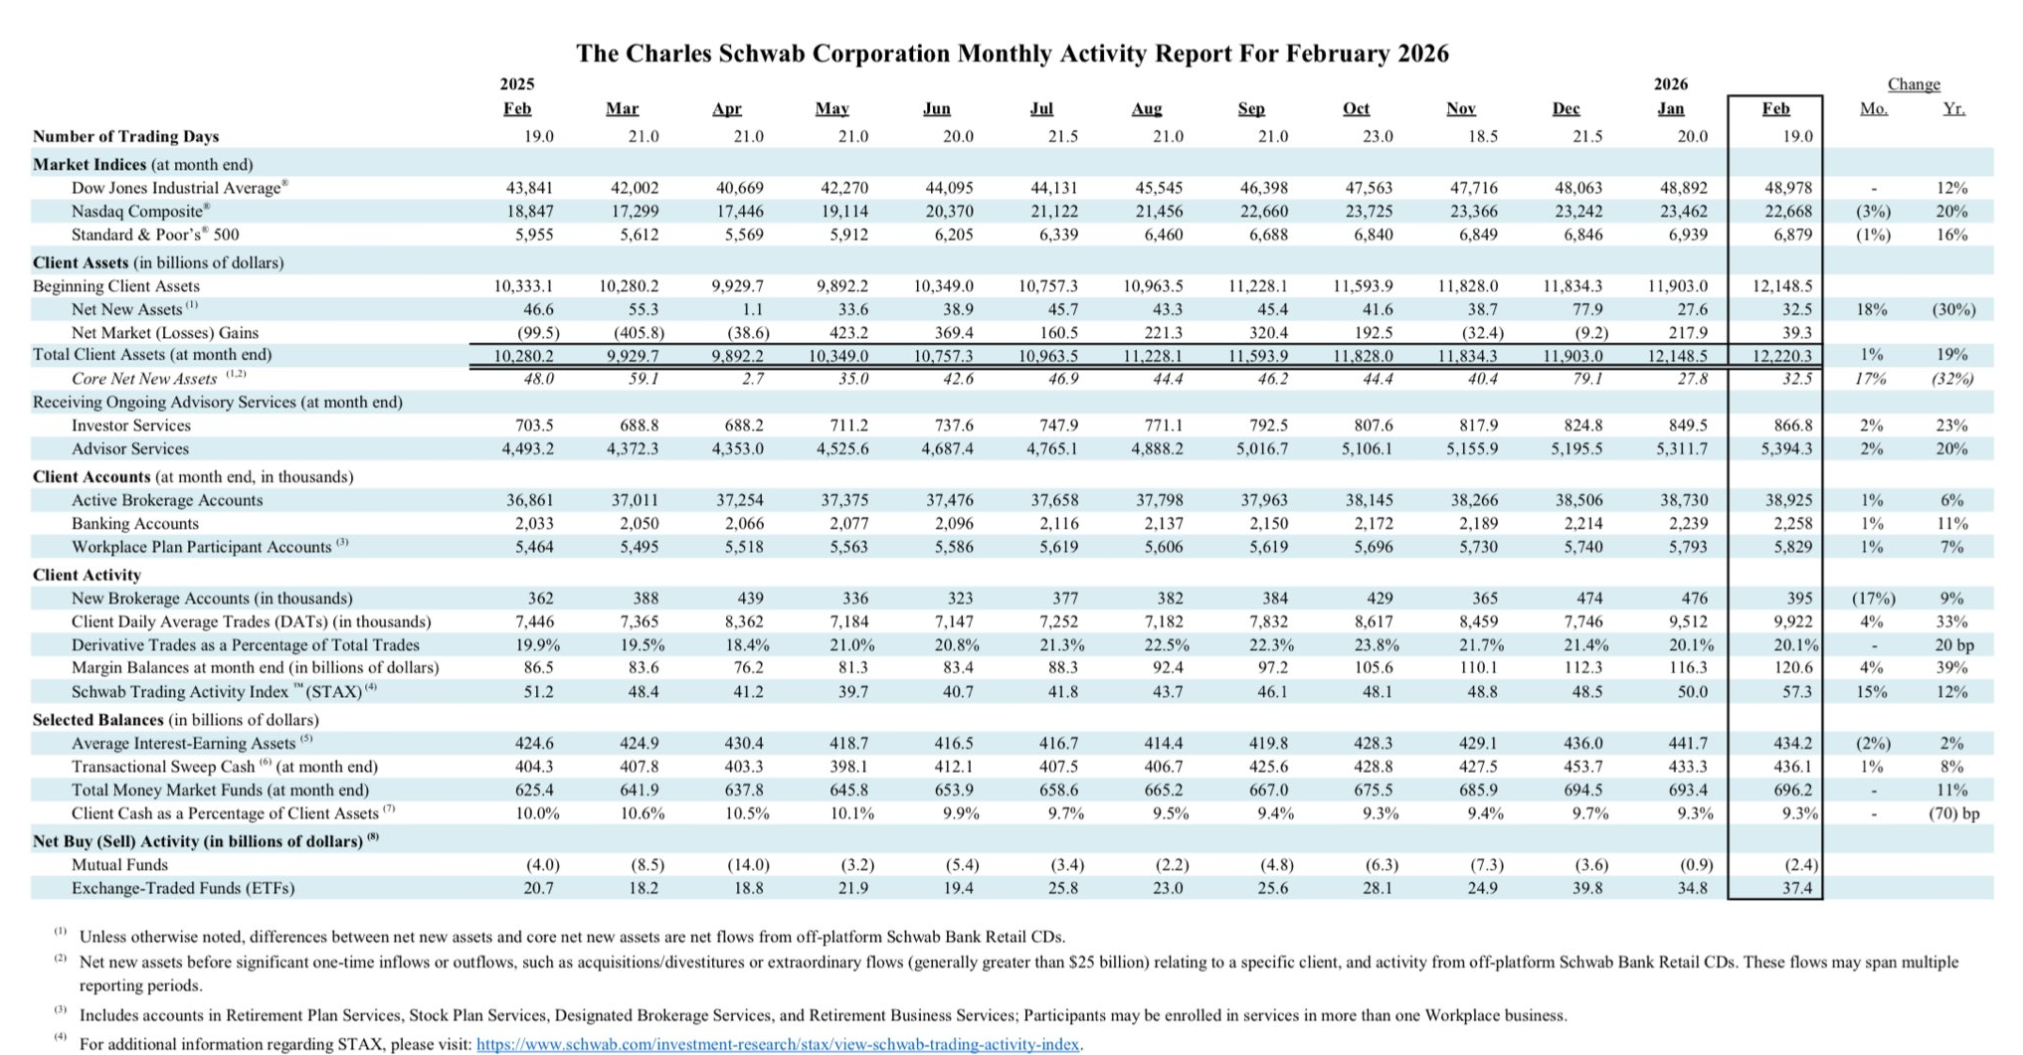
Charles Schwab, one of the largest US brokerage firms, will roll out spot cryptocurrency trading for retail clients in the coming weeks, starting with Bitcoin and Ether through a dedicated account linked to its brokerage platform.
According to Thursday’s announcement, the offering will allow clients to trade and view crypto alongside stocks and other assets across Schwab’s web, mobile and Thinkorswim platforms, with custody held by its banking unit and execution handled through a partnership with Paxos, a federally regulated trust company.
Schwab reported $12.22 trillion in total client assets as of February 2026, according to its latest filings, and operates as a brokerage providing trading, banking and wealth management services.
At launch, the service will support trading in the two biggest cryptocurrencies, Bitcoin (BTC) and Ether (ETH), at a fee of 75 basis points per transaction, with plans to add more cryptocurrencies and enable deposits and withdrawals over time.
At 75 bps, or 0.75%, Schwab’s fee places it above exchanges such as Kraken, where fees start around 0.25% to 0.40% and decline with volume, while broadly in line with Coinbase, where fees start at about 0.40% to 0.60% for lower-volume traders, according to information on those exchanges’ websites.
Clients will access the service through a separate crypto account, with assets held by Schwab’s banking subsidiary under a custodial model. The rollout will begin in phases over the coming weeks, initially limited to eligible US retail clients except residents of New York and Louisiana.
Schwab said the move expands its existing crypto offerings, which include exchange-traded products, futures and funds tied to digital assets. The company said its clients currently hold about 20% of spot crypto exchange-traded products, based on internal estimates.
Related: Binance adds spot trading guardrails to limit abnormal executions
Traditional financial firms expand crypto offerings
Traditional financial companies are expanding their crypto offerings across trading, exchange-traded funds (ETFs) and structured products.
On April 8, Morgan Stanley launched a spot Bitcoin ETF (MSBT) that recorded $30.6 million in inflows on its first day of NYSE Arca trading, marking its entry into the market for regulated crypto investment products. The fund website showed total net assets at $87.6 million as of April 15.
Also in April, Goldman Sachs filed with the US Securities and Exchange Commission to launch a Bitcoin-linked ETF designed to generate income through options strategies, offering indirect exposure to Bitcoin while aiming to limit volatility.
As traditional financial firms expand into crypto, crypto-native companies are moving in the opposite direction, pushing into traditional markets through tokenized equities.
In December, Coinbase introduced trading for equities and ETFs, while in February Kraken launched tokenized equity perpetual futures, offering leveraged exposure to US stocks, indexes and commodities.
Magazine: Forget stablecoin yield, how does the CLARITY Act treat DeFi?

Charles Schwab has begun a phased launch of spot Bitcoin (BTC) and Ethereum (ETH) trading, opening direct crypto access to its retail brokerage clients for the first time.
The product, called Schwab Crypto and operated by Charles Schwab Premier Bank, SSB, will roll out in stages starting in Q2 2026. An initial cohort of employees and early-access registrants will trade first before the platform opens to the firm’s broader client base.
Schwab Integrates Crypto Into Its Brokerage Ecosystem
Unlike standalone crypto exchanges, Schwab is embedding digital asset trading within its existing brokerage, banking, and research infrastructure.
Clients will access crypto alongside equities, ETFs, and fixed-income products through a single platform.
Pricing is set at 75 basis points per trade. Paxos provides the regulated custody, execution, and settlement infrastructure underpinning the service.
The regulated trust company already holds a federal banking charter from the Office of the Comptroller of the Currency.
The service will be available across all US states except New York and Louisiana, which have stricter crypto licensing frameworks.
Clients cannot deposit BTC or ETH from external wallets, and crypto holdings are not eligible for SIPC or FDIC insurance.
How Schwab’s Entry Reshapes the Retail Crypto Market
Schwab’s entry intensifies the battle for retail crypto investors. The firm manages approximately $12 trillion in client assets, giving it a built-in distribution advantage over crypto-native competitors like Robinhood and Coinbase.
Previously, Schwab offered digital asset exposure only through crypto-linked stocks, futures, and spot exchange-traded products.
The shift to direct spot trading reflects broader institutional momentum. US spot crypto ETFs drew nearly $670 million in net inflows on the first trading day of 2026 alone.
Regulatory tailwinds have also accelerated the timeline. The SEC rescinded Staff Accounting Bulletin 121 in January 2025, removing the requirement for custodians to record client crypto as balance-sheet liabilities.
The OCC followed in March 2025 by reaffirming that crypto custody and stablecoin activities are permissible for national banks.
Whether Schwab’s conservative pricing and trusted brand can draw crypto volume away from lower-cost platforms with broader token selection remains the central question heading into the second half of 2026.
The post $12 Trillion US Giant Charles Schwab Launches Spot Crypto Trading appeared first on BeInCrypto.


The SEC CLARITY Act roundtable convened in Washington today, April 16, bringing regulators and industry together for a public discussion on digital asset market structure as the Senate Banking Committee targets a late-April markup of the most consequential crypto bill the US has ever seen.
Summary
- The SEC is hosting a roundtable on digital asset market structure today, not a vote or markup, but a signal of where regulators stand before Congress acts on the CLARITY Act.
- The Senate Banking Committee is targeting a late-April markup, with Chair Tim Scott yet to set a firm date as of April 15, while Senator Lummis warns a miss means waiting until at least 2030.
- White House digital assets adviser Patrick Witt said a stablecoin yield compromise “appears to be holding firm,” resolving the central dispute that has stalled the bill twice this year.
The SEC CLARITY Act roundtable opened in Washington today as the US Securities and Exchange Commission convened a public forum on digital asset market structure, placing the bill’s trajectory on full display for the first time since the Senate returned from Easter recess on April 13. Today’s session is not a vote or formal markup, but the commissioners running it are the same ones who will implement the CLARITY Act once Congress passes it.
The Senate Banking Committee markup is targeted for the second half of April. Chair Tim Scott has not yet announced a date as of Wednesday evening.
The CLARITY Act would draw a statutory line between the Securities and Exchange Commission and the Commodity Futures Trading Commission, assigning digital commodities to the CFTC and leaving digital securities under SEC oversight. The House passed the bill 294 to 134 in July 2025 and the Senate Agriculture Committee cleared its version in January 2026, making this the most advanced crypto market structure bill in US history.
SEC Chair Paul Atkins has said publicly that the SEC and CFTC are operationally ready to implement the act the moment Congress passes it. Polymarket currently puts passage odds at 55%.
The Stablecoin Fight That Almost Killed the Bill
The central dispute holding up the legislation has been whether stablecoin issuers can pay yield to holders simply for holding their tokens. White House digital assets adviser Patrick Witt said the stablecoin yield compromise “appears to be holding firm,” describing it as a “must-have” for unlocking the remaining sticking points. The deal bans passive yield on stablecoin balances while permitting activity-linked rewards tied to payments and platform use, a structure that protects DeFi protocols while addressing banking industry concerns about deposit migration.
The bill has stalled twice in 2026 as House Republicans remain split over FISA reauthorization and budget reconciliation, consuming legislative bandwidth the CLARITY Act needs before midterm politics close the window entirely. Senator Cynthia Lummis wrote on X this month that this is “our last chance” until at least 2030 if Congress misses the May window.
What Passes Next Has Trillion-Dollar Stakes
JPMorgan analysts have called midyear passage a positive catalyst for digital assets. Standard Chartered estimated that an uncapped yield provision could redirect up to $500 billion in deposits out of the banking system, explaining the banking lobby’s resistance. A White House Council of Economic Advisers study countered that banning yield would increase total US bank lending by just $2.1 billion while imposing an $800 million welfare cost on households.
The bill must still clear the Senate Banking Committee, pass a full Senate floor vote requiring 60 votes, reconcile with the Agriculture Committee version and the House-passed text, and receive a presidential signature. Today’s roundtable does not shorten that path, but it signals regulators are aligned and waiting for lawmakers to act.

Key Highlights
- Shares of Onfolio Holdings (ONFO) climbed more than 150% Thursday following the announcement of a $100 million equity financing arrangement with an institutional backer.
- The proceeds are primarily designated for purchasing profitable online enterprises the firm considers underpriced.
- Some funding will be allocated to expanding Onfolio’s digital asset holdings.
- CEO Dominic Wells stated the organization dedicated 2025 to achieving profitability and is now prioritizing expansion.
- ONFO shares are trading near their 52-week high, positioned 182.9% above the 20-day moving average.
Shares of Onfolio Holdings (ONFO) skyrocketed Thursday after the firm revealed a $100 million equity financing arrangement with an institutional investor. The stock climbed over 149% to $1.66 during trading, approaching the upper boundary of its 52-week trading range between $0.46 and $1.95.
The financing agreement provides Onfolio with adaptable, on-demand capital that can be utilized at the company’s discretion. The arrangement carries no mandatory drawdown obligations.
The majority of proceeds will support working capital needs and business acquisitions. Onfolio plans to pursue profitable online operations it views as undervalued when managed traditionally but could flourish when integrated with AI-powered infrastructure.
A smaller allocation will support expanding the firm’s digital asset portfolio, which complements its operational holdings as part of an overarching value-creation approach.
CEO Dominic Wells was straightforward regarding the company’s position. “We dedicated 2025 to reaching profitability,” he explained. “Now we’re allocating capital toward expansion.”
Wells characterized the facility as enhanced flexibility rather than emergency funding. It complements an existing convertible note arrangement as part of what the organization describes as an expanding capital infrastructure.
AI-Driven Acquisition Strategy
Onfolio’s acquisition framework is deeply connected to its artificial intelligence services platform. Upon acquiring a business, the company integrates it with pre-existing AI systems covering content creation, marketing automation, data intelligence, and operational efficiency.
The firm describes this methodology as capital-efficient. It expands AI-generated revenue leveraging current advanced model infrastructure while avoiding substantial capital investment.
Wells noted that AI implementation is already progressing throughout its current portfolio. The business-to-business division is experiencing enhanced margins, while consumer-facing operations are benefiting from AI-driven data intelligence tools.
This analytics solution is being developed into a standalone service product for B2B customers, targeting both current clients and prospective accounts.
Technical Analysis and Trading Levels
ONFO was positioned 182.9% above its 20-day simple moving average and 188.2% beyond its 100-day SMA during the rally — representing a dramatic revaluation reflecting the stock’s rapid ascent.
The 20-day SMA currently trades above the 50-day SMA, indicating short-term positive momentum. Nevertheless, a death cross formation from November 2025 — when the 50-day crossed beneath the 200-day — continues to signal longer-term technical weakness.
The MACD indicator remains below its signal line with negative histogram readings, suggesting momentum could begin moderating despite the elevated price level.
Critical resistance exists at the $2.00 mark, where shares have previously encountered selling pressure. Immediate support is positioned around $1.50, a psychological price point that has traditionally attracted buying interest.
The organization submitted an 8-K filing with the SEC providing complete details regarding the financing arrangement.

Crypto World
Spartans.com Hits $1 Billion in Wagers as Chainlink and Avalanche Build Institutional Foundations

The online casino industry thought it understood scale. Spartans.com just redefined it entirely. A platform still in restricted beta, not yet open to the global public, recorded $1,000,000,000 in total wagers in its first 60 days. Legacy platforms spent years chasing that milestone. Spartans casino hit it before most people knew it existed.
Meanwhile, crypto markets are quietly building serious institutional momentum. Chainlink just upgraded its Data Streams infrastructure to feed real-time U.S. stock prices into DeFi, while Avalanche welcomed a brand new NYSE-listed spot ETF as daily transactions hit a 2026 high of 3.5 million.
Spartans.com Post Class Leading Numbers in Beta Stage
Most online casinos spend years building credibility. They acquire players slowly, establish their infrastructure gradually, and hope that volume follows reputation over time. Spartans.com skipped all of that. In just 60 days of restricted beta, February and March 2026, the platform recorded $1,000,000,000 in total wagers, captured $100,000,000 in deposits, generated $40,000,000 in Gross Gaming Revenue, and onboarded 27,000 first-time depositors. All before a single day of full global operation.
The number that makes those figures even more remarkable: Spartans casino is currently ranked the 14th largest crypto casino on earth. In beta. With global access still restricted. The August 1st worldwide launch has not happened yet, and the platform is already sitting inside the top 14 of a fiercely competitive global industry. The strategic target, becoming the world’s number one top crypto casino by the end of 2026, looks considerably less ambitious when framed against those pre-launch numbers.

The platform delivering these figures is built differently from the ground up. Near-instant withdrawals eliminate the friction legacy sites depend on. Uncapped betting limits invite the biggest action online. The $7,000,000 leaderboard, the largest in online casino history, with $5,000,000 for a single first-place winner, is running simultaneously with a $3,000,000 Mansory Koenigsegg Jesko giveaway. Grammy-winner Lil Baby and boxer Conor Benn are locked in as partners. And hardwired beneath all of it is the 33% CashRake system, automatically returning up to 33% of the house edge to the player on every wager. If this is what Spartans casino looks like as a top crypto casino before launch, August 1st changes everything.
Chainlink Feeds Wall Street’s Data Into DeFi
The Chainlink price tells a story of fundamentals and price action moving in opposite directions. LINK is trading near $8.80, down sharply from January 2026 highs near $14, yet the underlying network is generating approximately $75 million in annualised fees, securing over $28 trillion in total value, and processing $18 billion in monthly cross-chain volume through CCIP, up 62% year-over-year. JPMorgan and UBS are running live blockchain settlement pilots directly on Chainlink infrastructure, and an institutional consortium including Swift, Euroclear, and DTCC has adopted Chainlink oracles for corporate action workflows.

The most significant recent development came on April 12, when Chainlink upgraded its Data Streams infrastructure to provide near-real-time pricing for U.S. stocks and ETFs, directly bridging the $80 trillion equities market into DeFi. The Bitwise LINK ETF (CLNK), listed on NYSE Arca, has expanded availability to 401(k) retirement plans. The Chainlink price compression between $8.20 and $9.55 has created a historically tight Bollinger Band structure that analysts note typically precedes significant directional moves. Standard Chartered targets $15 by late 2026.
Avalanche Lands NYSE-Listed ETF as Transactions Hit 2026 Record
The AVAX price is trading near $9.33 with a key resistance battle forming around the $10 level, a ceiling that has capped every rally since January. The timing of the latest catalyst makes that level increasingly significant. On April 15, Bitwise launched its spot Avalanche ETF (BAVA) on the New York Stock Exchange with staking rewards included and a 0% sponsor fee on the first $500 million in assets. This follows VanEck’s AVAX ETF launched in January 2026, giving the asset two NYSE-listed institutional products within months of each other.

On-chain fundamentals are strengthening independently of price. Daily transactions hit a 2026 high of 3.5 million, while TVL across Avalanche’s DeFi ecosystem has approximately doubled since April 2025 to $2.1 billion. South Korean payment processor NHN KCP signed an MOU with Ava Labs to develop a payments-optimised Layer 1 blockchain targeting sub-second finality. CME Group confirmed AVAX futures contracts launching May 29. The AVAX price needs a confirmed close above $10 to break the descending triangle structure, analysts target $15 if it holds.
The Final Take
Chainlink is quietly becoming the data layer connecting Wall Street to every blockchain on earth, with institutional adoption accelerating even as the token price consolidates. Avalanche is landing NYSE-listed ETFs, record transaction volumes, and enterprise payment partnerships while holding above critical support. Both networks are building the kind of institutional infrastructure that takes years to be reflected in price. And sitting above all of trends in the online gaming space is Spartans.com, a platform that generated a billion dollars in wagers before its global doors even opened, ranked 14th in its industry before a single day of unrestricted operation. The $7,000,000 leaderboard is live. The August 1st launch is approaching. The pre-launch numbers already made the argument.

Find Out More About Spartans:
Website: https://spartans.com/
Instagram: https://www.instagram.com/spartans/
Twitter/X: https://x.com/SpartansBet
YouTube: https://www.youtube.com/@SpartansBet
Disclaimer: This is a Press Release provided by a third party who is responsible for the content. Please conduct your own research before taking any action based on the content.

NEAR Protocol’s largest Decentralized Finance (DeFi) hub, Rhea Finance, suffered a $7.6 million exploit after an attacker manipulated its oracle and validation layer.
Blockchain security firm CertiK flagged the incident, confirming that assets were drained across multiple tokens.
How the Rhea Finance Exploit Unfolded
The attacker deployed fake token contracts and created fresh liquidity pools on the protocol. These pools likely distorted price feeds, misleading the oracle into validating fraudulent transactions.
According to CertiK, at least $7.6 million was extracted from Rhea Finance. Stolen funds included USDC, USDT, Zcash (ZEC), and NEAR (NEAR).
Vadim Zacodil, an ex-NEAR core contributor, confirmed the figures and warned users to monitor the situation closely.
Withdrawals are currently halted as the team works to contain further damage.
“The attacker created fake token contracts and added liquidity in fresh pools, likely misleading the oracle and validation layer,” CertiK noted.
Why This Matters for NEAR DeFi
Rhea Finance holds a dominant position in the NEAR ecosystem. Formed in early 2025 through the merger of Ref Finance and Burrow Finance, it serves as the primary DEX and lending layer on the network.
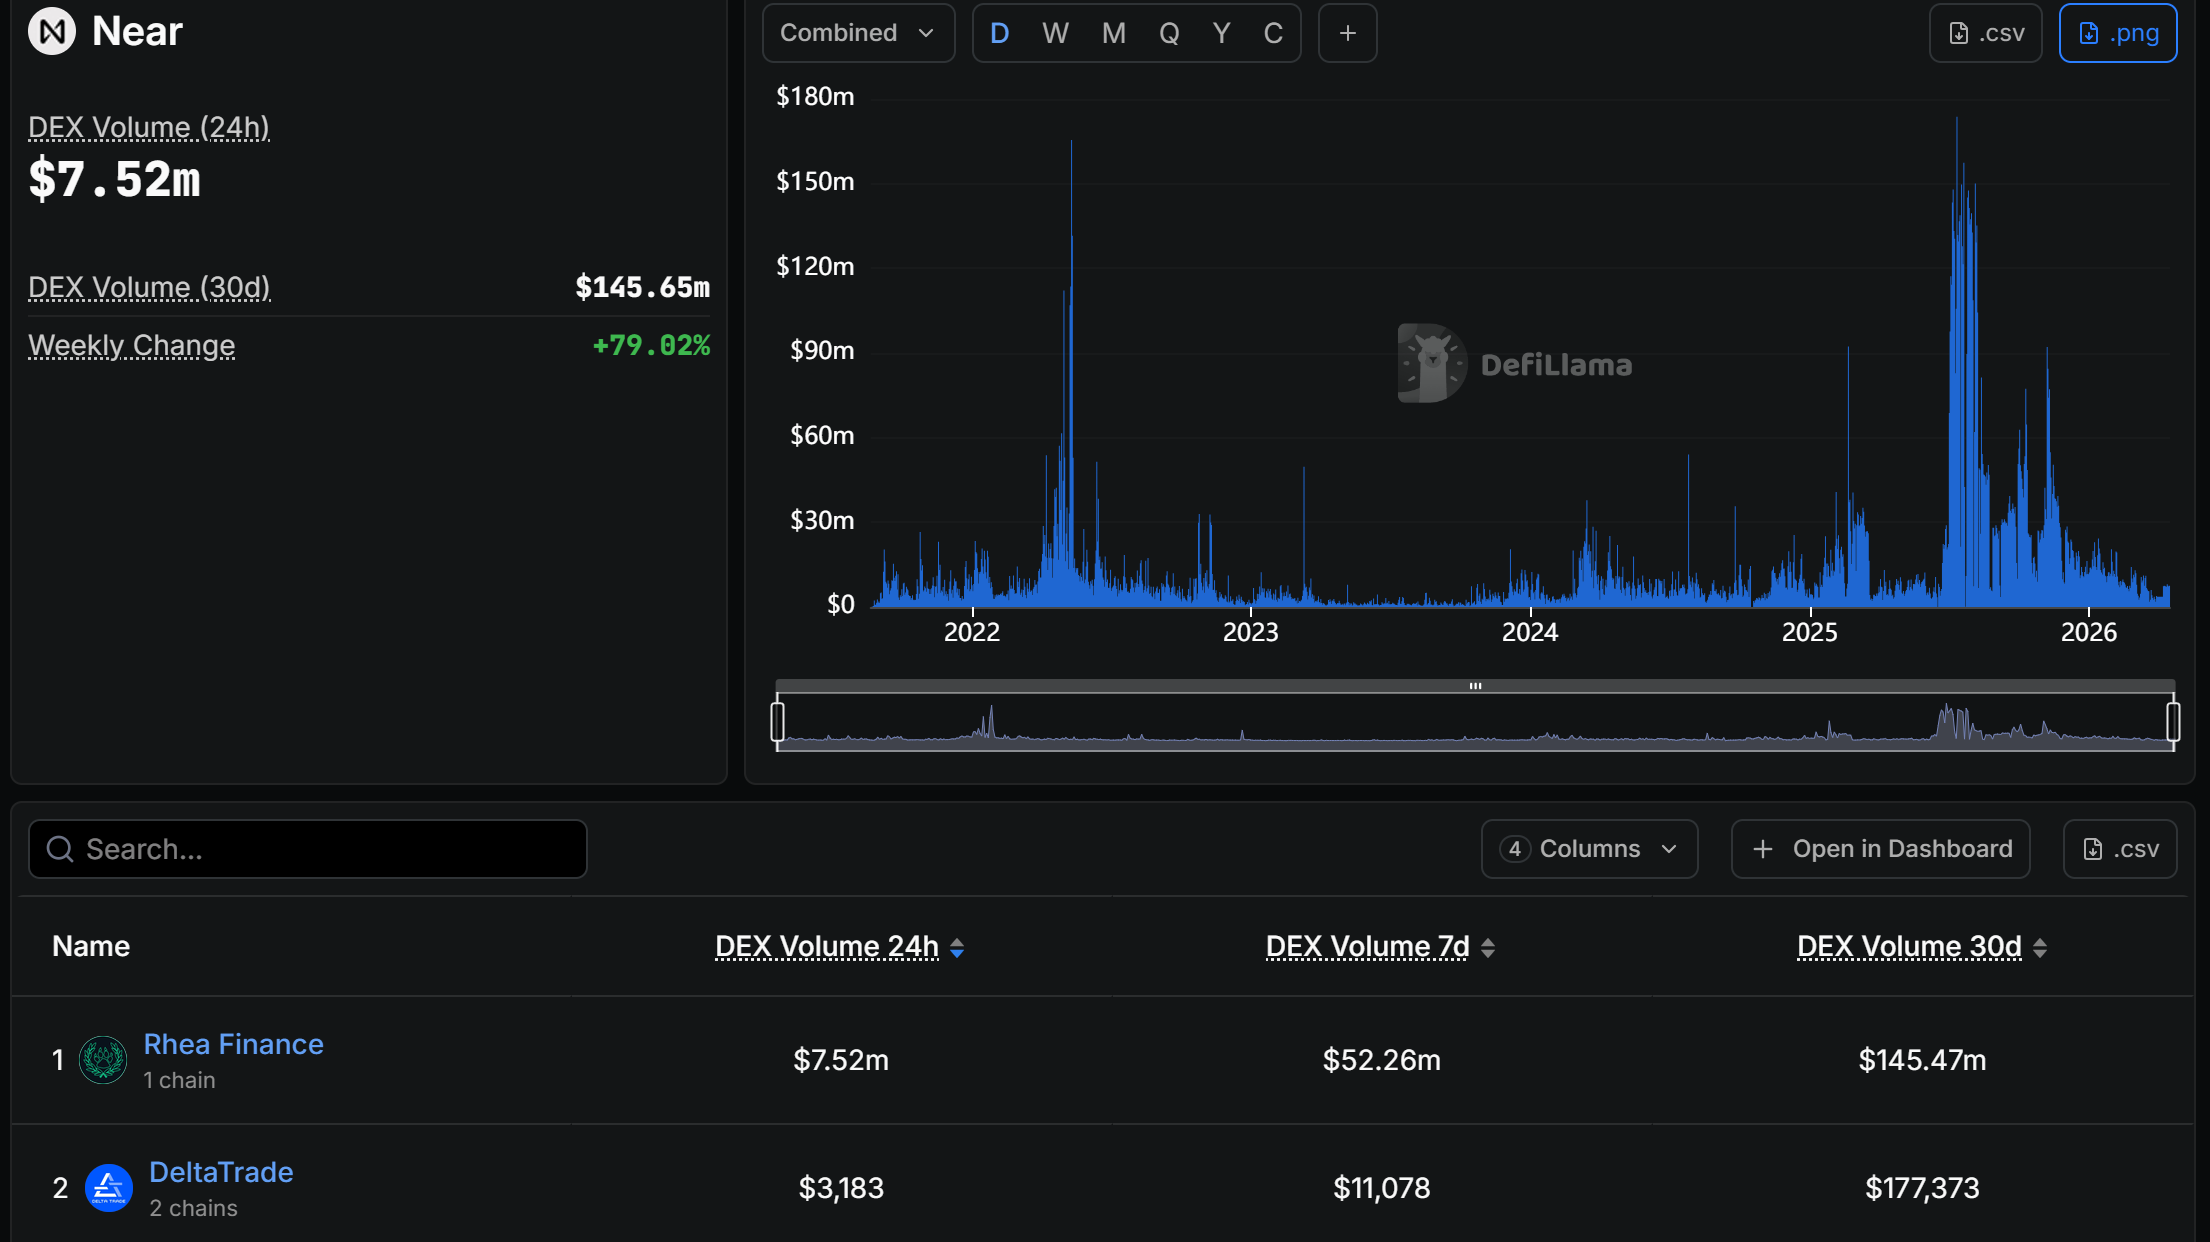
The protocol previously held over 95% of NEAR’s DeFi total value locked, making this exploit significant for the entire chain’s DeFi infrastructure.
Oracle manipulation remains one of the most persistent vulnerabilities in DeFi, with attackers repeatedly exploiting untested price feeds and thin liquidity.
The coming days will reveal the full scope of losses and whether Rhea Finance can secure affected user funds.
The post NEAR Protocol DeFi Hub Rhea Finance Loses $7.6 Million in Oracle Exploit appeared first on BeInCrypto.

Cantor Fitzgerald Donates $10 Million to Crypto PAC Led by Tether Executive

The Inappropriate Joke Hidden In Plain Sight In Classic Star Trek Episode

When Dry Cleaning Doesn’t Remove Odors: What Actually Works


-

 Politics6 days ago
US brings back mandatory military draft registration
-
 Sports6 days ago
Man United discover Nico Schlotterbeck transfer fee as defender reaches Dortmund agreement
-

 Fashion6 days ago
Weekend Open Thread: Veronica Beard
-

 Politics7 days ago
Malcolm In The Middle OG Turned Down ‘Buckets Of Money’ To Appear In Reboot
-

 Politics4 days ago
World Cup exit makes Italy enter crisis mode
-

 Business6 days ago
Tesla Model Y Tops China Auto Sales in March 2026 With 39,827 Registrations, Beating Cheaper EVs and Gas Cars
-

 Crypto World3 days ago
The SEC Conditionalises DeFi Platforms to Be Avoided for Broker Registration
-

 Crypto World3 days ago
SEC Signals Exemption for Crypto Interfaces From Broker Registration
-

 News Videos1 day ago
Secure crypto trading starts with an FIU-registered
-
 NewsBeat4 days ago
Pep Guardiola and Gary Neville agree over Arsenal title problem that benefits Man City
-

 Business5 days ago
Ireland Fuel Protests Enter Day 5 as Blockades Spark Shortages and Government Prepares Support Package
-

 Business6 days ago
OpenAI Halts Stargate UK Data Centre Project Over Energy Costs and Copyright Row
-

 Politics7 days ago
LBC Presenter Mocks Trump Over Iran War Failures
-

 Crypto World6 days ago
Federal judge blocks Arizona from bringing criminal charges against Kalshi
-

 NewsBeat2 days ago
Trump and Pope Leo: Behind their disagreement over Iran war
-

 Crypto World3 days ago
SEC Proposes Certain Crypto Interfaces Don’t Need to Register as Brokers
-
 NewsBeat4 days ago
JD Vance announces ‘no agreement’ with Iran over nuclear weapons fear
-

 Tech7 days ago
A version of Windows 10 released a decade ago is now eligible for additional security patches
-

 Business6 days ago
IMF retains floor for precautionary balances at SDR 20 billion
-

 Business6 days ago
Former Liverpool CEO eviscerates FIFA for World Cup ticket pricing
You must be logged in to post a comment Login