
Crypto World
Is XRP Price at Risk as Profit Taking Hits Monthly High?

XRP price continues to trade under a prolonged downtrend that has limited sustained upside for months. The altcoin has repeatedly failed to reclaim key resistance levels. While short-term sentiment shows mild improvement, the broader macro structure remains tilted toward caution.
Recent on-chain developments introduce a complex dynamic. Whale accumulation suggests confidence in a rebound. At the same time, profit-taking activity and weakening network growth highlight structural risks that could cap recovery attempts.
XRP Whales Are Buying
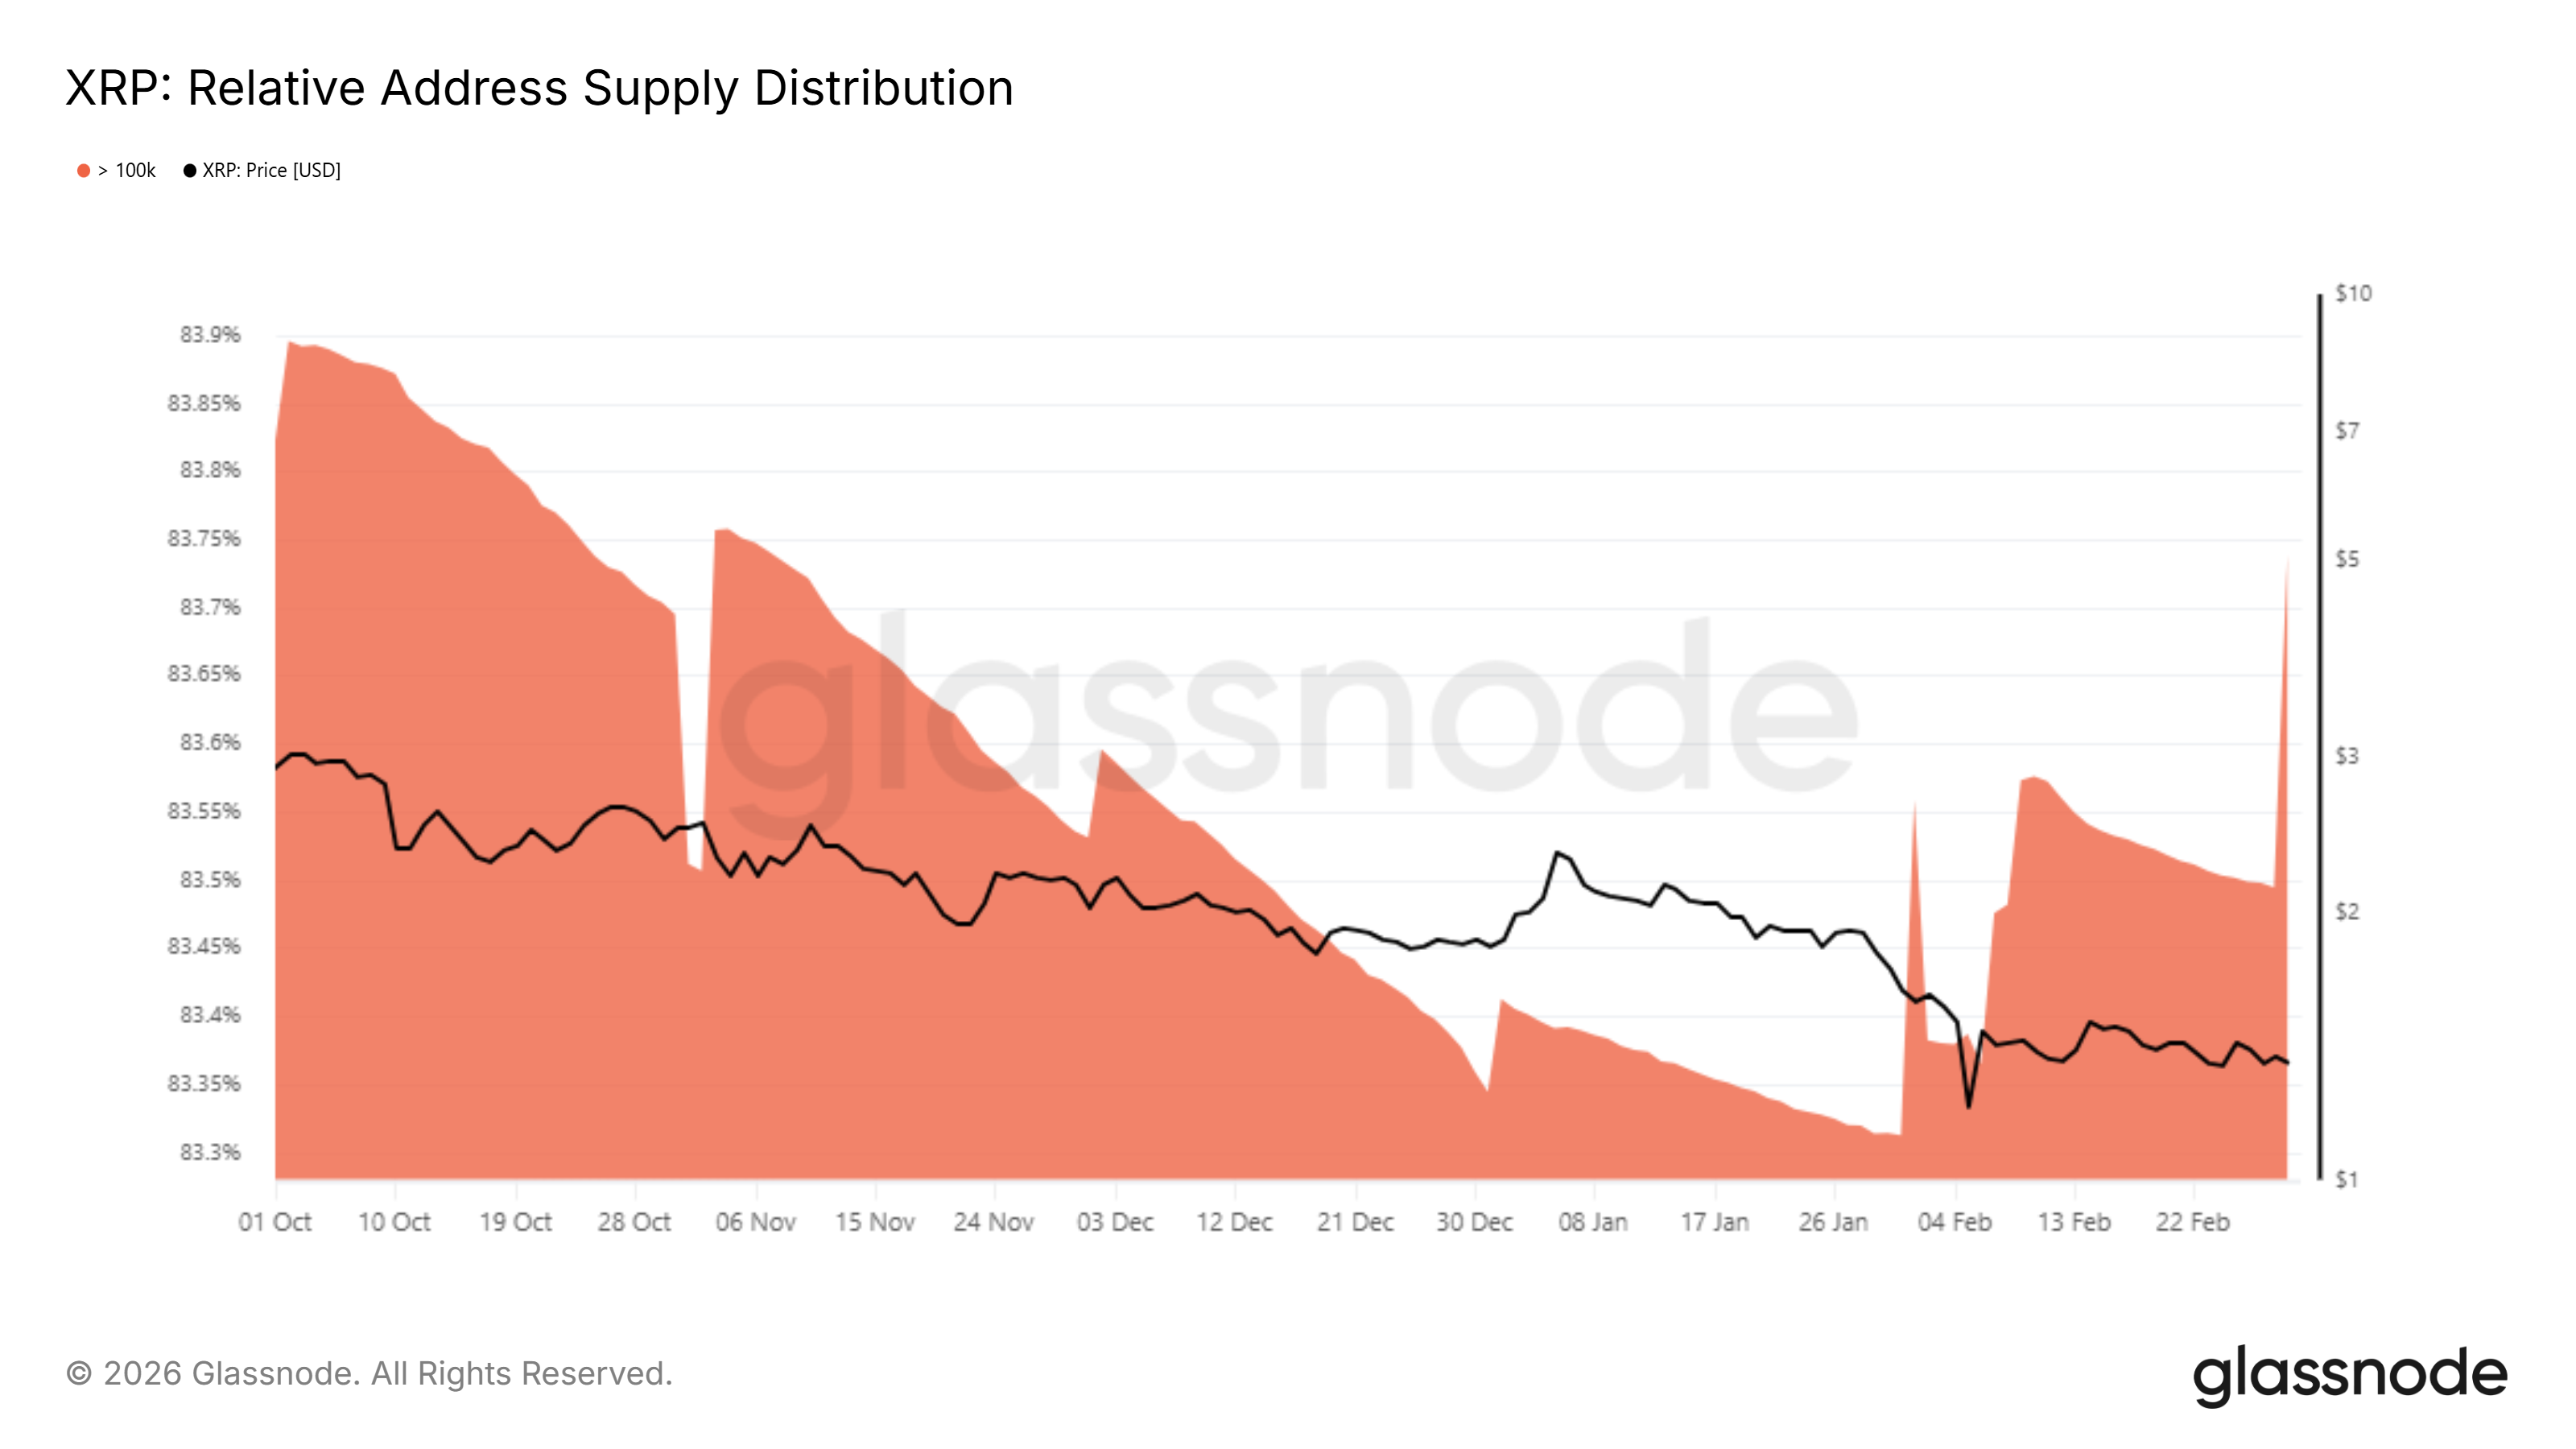
Large XRP holders appear committed to accumulation despite challenging market conditions. Throughout February, addresses holding more than 100,000 XRP increased their collective ownership. These wallets now control 83.7% of the total XRP supply.
This concentration indicates strong conviction among high-capital participants. Whales often accumulate during consolidation phases to position for future upside. Their buying suggests expectations of price recovery rather than imminent distribution. Sustained accumulation can reduce circulating supply and stabilize volatility.
Want more token insights like this? Sign up for Editor Harsh Notariya’s Daily Crypto Newsletter here.
Bearish Signals Appear
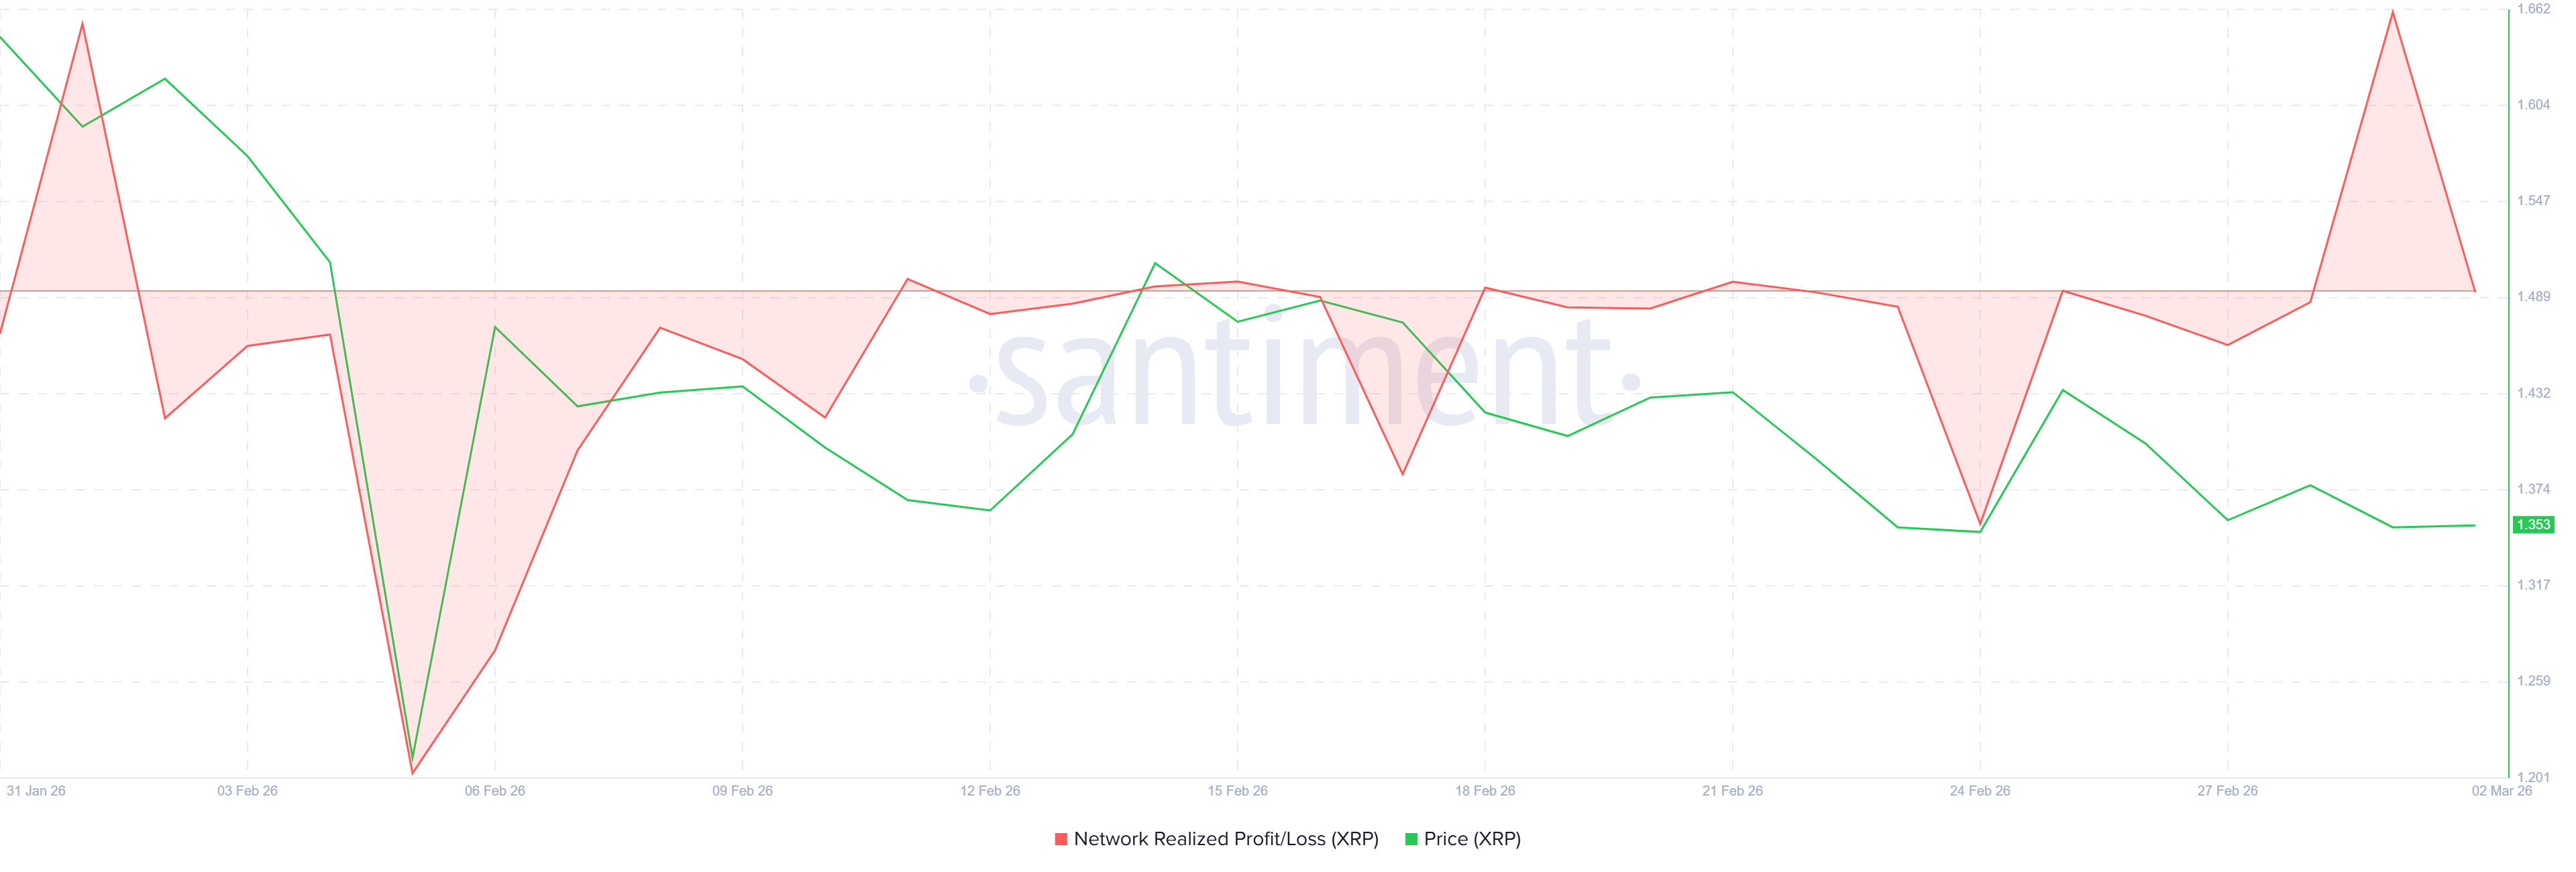
However, early signs of profit-taking are emerging on-chain. The network realized a profit and loss metric surged to $207 million over the past 24 hours. This marks the first significant wave of profit booking in nearly a month.
While moderate profit realization is healthy for market structure, accelerated selling could undermine bullish setups. If short-term gains motivate broader distribution, XRP’s recovery may stall. Monitoring realized profit trends will be critical for assessing sustained upside potential.
New address momentum paints a more cautious macro picture. This indicator compares monthly (red) new address growth against yearly (blue) trends. When monthly growth falls below yearly averages, it signals contraction in network activity.
Since early December 2025, XRP’s monthly new address growth has remained below yearly levels. This divergence reflects declining on-chain engagement and reduced network utilization. Weak onboarding often correlates with slower capital inflows.
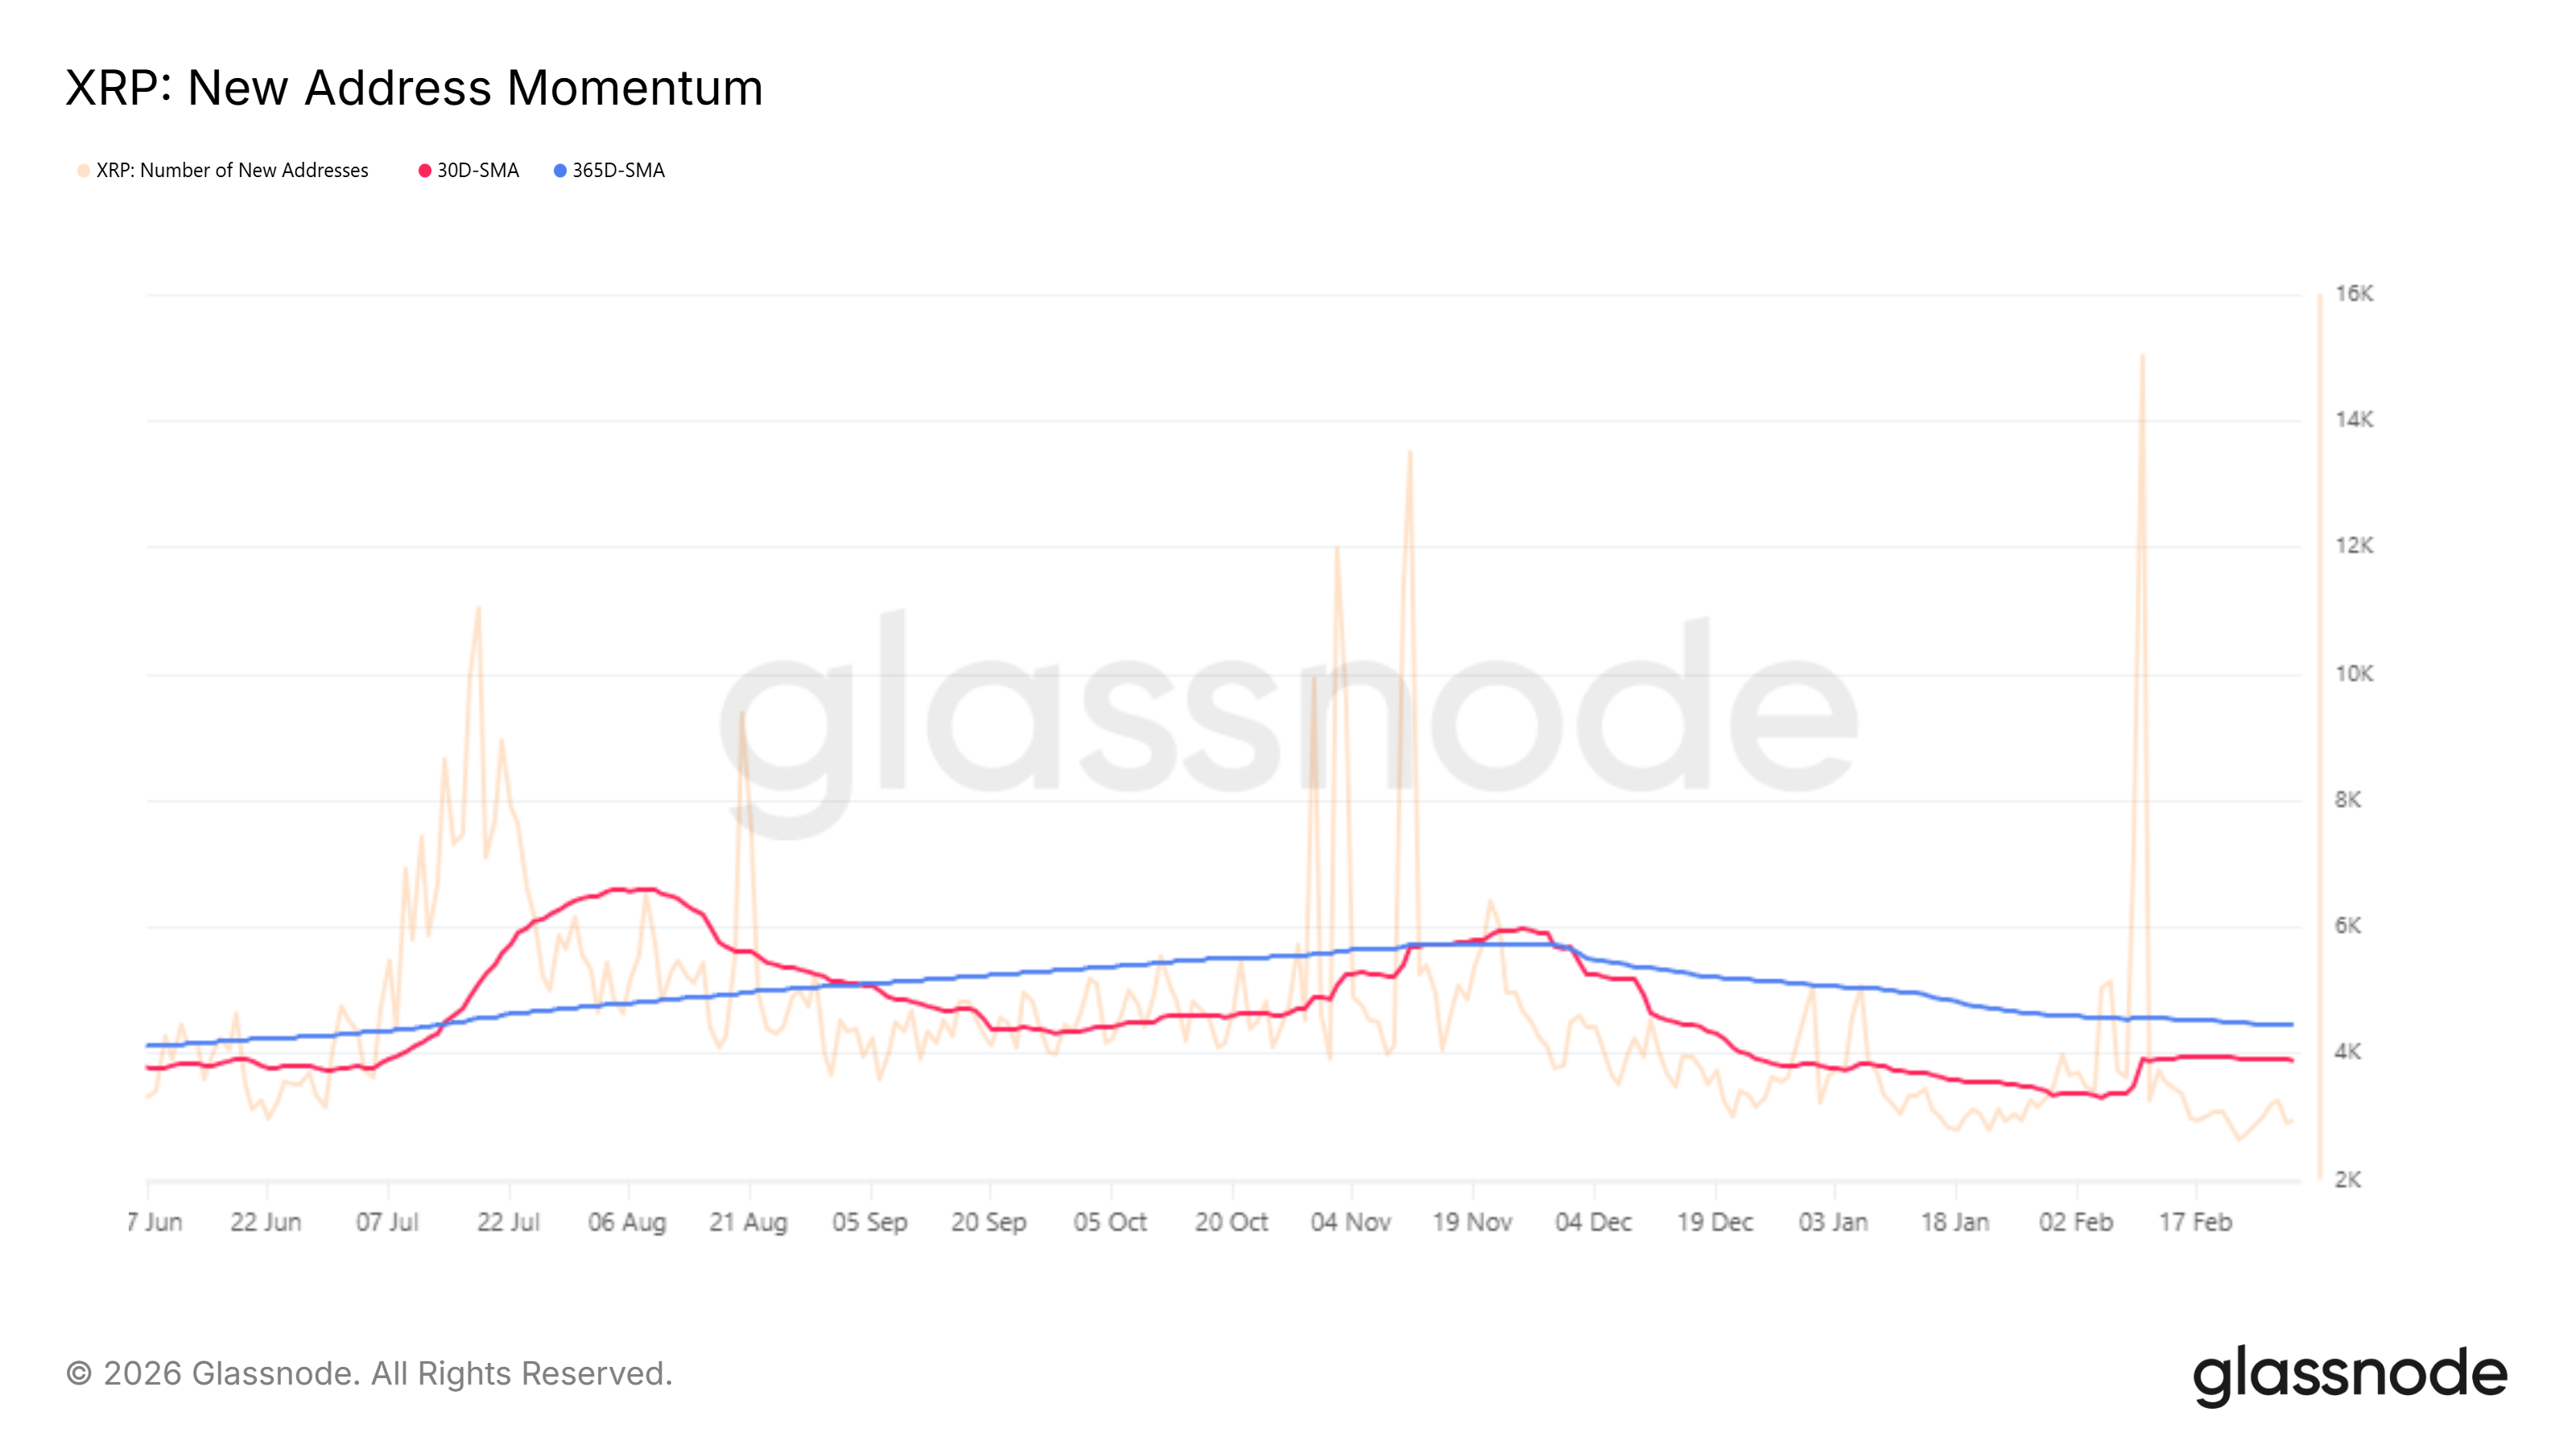
Persistent contraction limits organic demand. Without consistent expansion in active addresses, price recovery becomes dependent on existing holders rather than new participants. Historical data show that prolonged divergence can suppress rallies until growth normalizes.
Reversal of this trend would signal improving fundamentals. A rise in monthly new addresses above yearly averages would indicate renewed adoption. Until that shift occurs, macro fundamentals remain fragile despite whale optimism.
XRP Price Downtrend Persists
XRP is trading at $1.34 at the time of writing, hovering directly above critical support at the same level. The altcoin remains capped below $1.47 resistance. A descending trendline active since early 2026 continues to restrict upward movement.
If bearish momentum strengthens, XRP could lose the $1.34 support. Combined with increasing profit-taking, such a breakdown may push the price toward $1.28. Further weakness could extend losses to $1.21, reinforcing the prevailing downtrend structure.
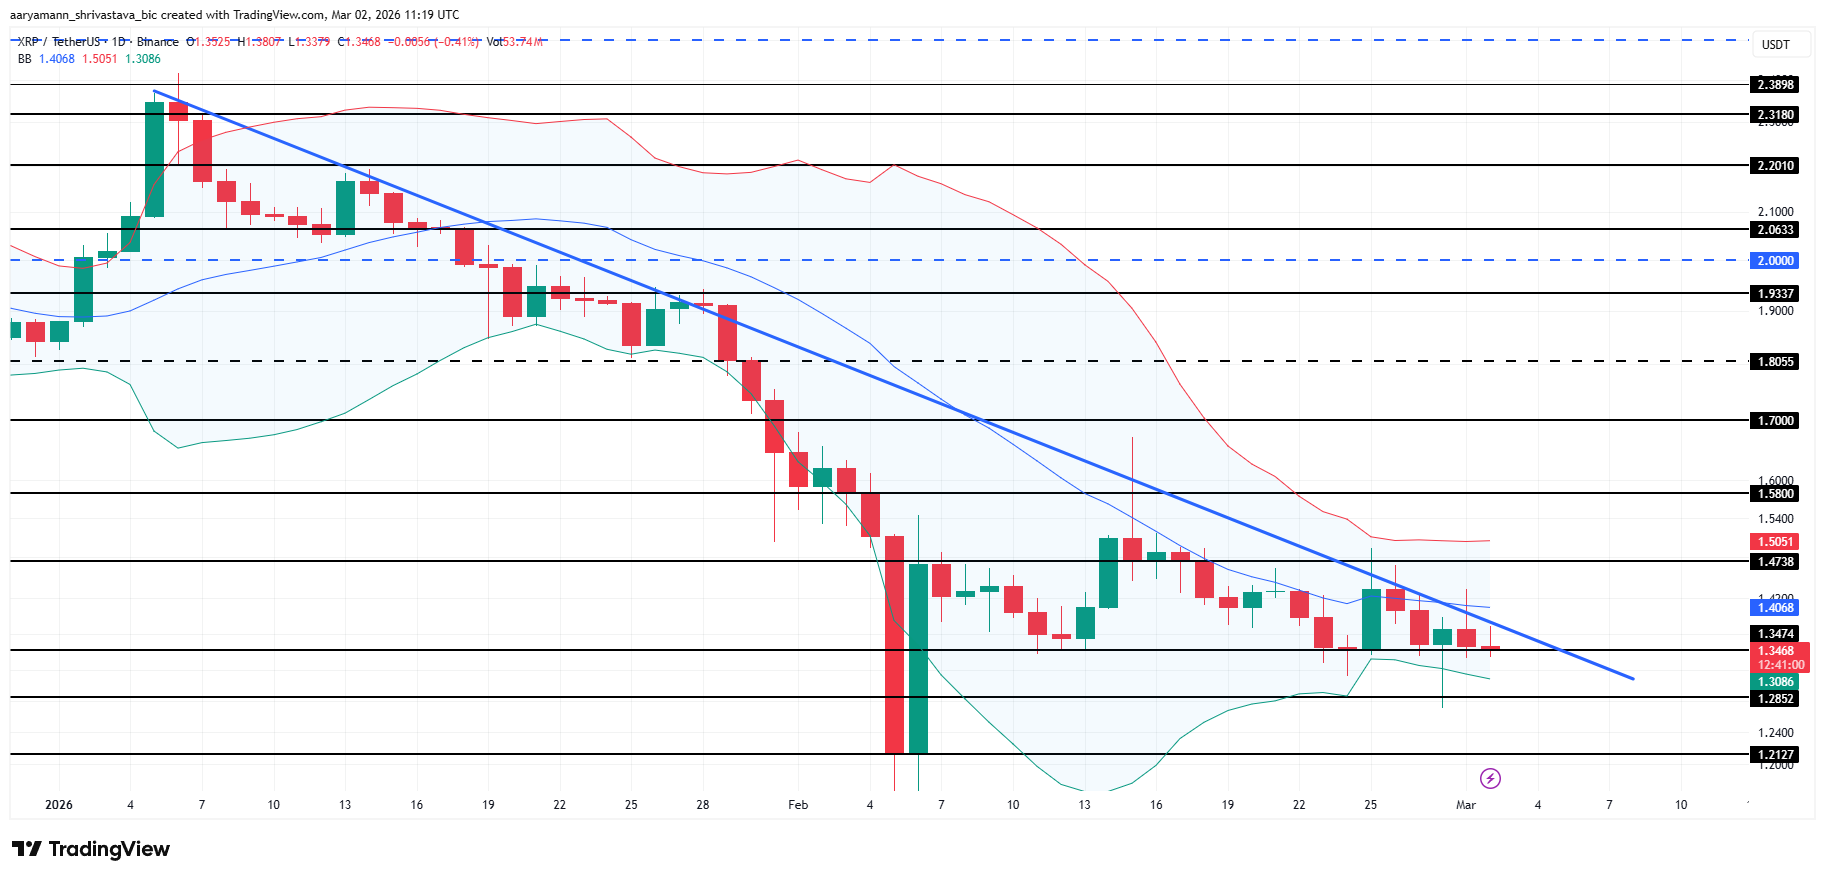
Conversely, stabilization in realized profits would support consolidation above $1.34. Holding this level may weaken the descending resistance line. A decisive breakout above $1.47 would invalidate the bearish thesis. Sustained momentum could then propel XRP toward $1.58, marking a structural shift in market sentiment.


Bitmine Immersion Technologies has increased its Ether holdings again as chairman Tom Lee said the token’s recent weakness may be nearing an end. The company disclosed a fresh purchase of 65,341 ETH worth about $139 million, lifting its total holdings to more than 4.6 million Ether.
Summary
- Bitmine bought 65,341 ETH, lifting total holdings above 4.6 million tokens this week.
- Tom Lee said Ether’s mini-crypto winter may be nearing its final stage now.
- Bitmine is nearing its goal of owning 5% of Ether’s circulating supply.
Bitmine said it has raised its buying pace over the past three weeks. Lee said the company’s base case is that Ether is in the final stages of a “mini-crypto winter” after several months of pressure across digital asset markets.
The latest purchase added 65,341 ETH to the company’s balance sheet. That brought Bitmine’s holdings to about 4.661 million Ether as of March 23, according to the company’s update.
Lee also pointed to policy and market signals that he said support a better outlook for crypto. In the company statement, he linked that view to progress on the CLARITY Act and to the way Ether and other digital assets have held up during recent geopolitical stress.
Bitmine’s total Ether position now equals about 3.86% of the circulating supply, based on Ethereum’s circulating supply of about 120.69 million tokens. The company has said it wants to accumulate 5% of the circulating supply over time.
To reach that goal at the current supply level, Bitmine would still need roughly 1.37 million more ETH. At prices near $2,156, that would require close to $3 billion in additional purchases.
Ether’s supply is not fixed. The total can rise or fall depending on issuance and token burning, so the amount needed to reach 5% can change over time.
Staking remains part of the strategy
Bitmine said more than 3 million of its Ether is now staked. That means the company is not only building a treasury position but also using the assets within Ethereum’s proof-of-stake system.
The company also reported other holdings on its balance sheet. These include about $1.1 billion in cash, 196 Bitcoin, a $200 million stake in Beast Industries, and a $95 million stake in Eightco Holdings.
Moreover, Bitmine is now one of the largest corporate Ether holders in the market. Strategic ETH Reserve data cited in public reports shows Bitmine ahead of other treasury firms, with SharpLink Gaming and Ether Machine trailing by a wide margin.
The company’s latest move also reflects a wider trend that grew across 2025 as more firms shifted capital into crypto treasury strategies.

Fraud networks work by using X accounts
ZachXBT determined that there was a group of X accounts on the network that shared updates related to war to gain some credibility and an audience. Most of these accounts would frequently post about the political happenings to become known to active users, and they also had the benefit of reposting similar content that would assist in increasing their reach as well as ensuring constant exposure.
The accounts later started to promote fraud involving crypto after gaining a following. They involved bogus giveaways and organized pump-and-dump operations on unsuspecting participants. As a result, the users, who interacted with content about the war, were exposed to false promises of easy returns with the help of digital assets.
The research revealed that operators used to switch usernames and account identities to minimize chances of detection. They also purchased older accounts that were already followed to sound more believable. In addition to that, the network employed the same message being sent repeatedly on a number of profiles, which enabled them to push scam campaigns within a short period and successfully.
Major Profits on Organized Plans
According to on-chain data, such synchronized operations brought a lot of money to the operators. One instance was the report by ZachXBT that a campaign generated six-figure profits during short-term token promotions. There was also one case where multiple accounts promoted the token known as ORAMAMA in a single day and then never promoted it again.
The emergence of the scams is a part of a bigger story with scammers exploiting major international events to target online audiences to trick them. The presence of fear and uncertainty in the current conflict has empowered purported scammers to integrate misinformation into financial frauds, although the social media platforms continue to be at the center of the operation plans. The results mention how scammers can use geopolitical tension to organize coordinated campaigns of financial frauds, whereas the social media platforms remain central to their operational strategies.
Bitcoin is experiencing a sharp sell-off, even as the U.S.-Iran war de-escalates, trading at the $71,000 level, and still is 4% lower than a week ago. The broader crypto market has underperformed significantly this week despite a bullish Bitcoin price prediction.
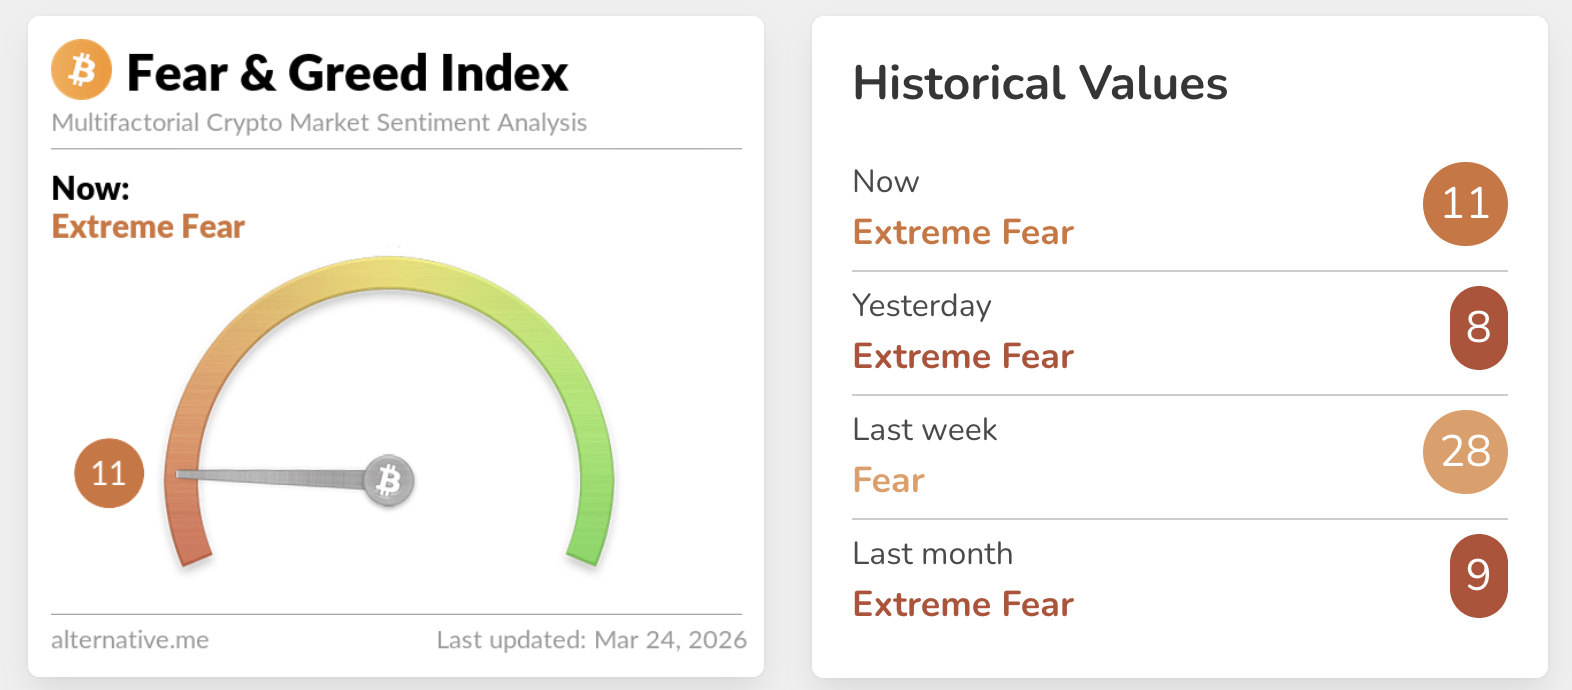
This retreat places BTC below its critical 20-day EMA of $70,515, signaling renewed bearish momentum in the short term. Amid the volatility, macro factors are heavily influencing price discovery, pushing the Fear & Greed Index down to a reading of 11, or extreme fear.

While the immediate outlook appears grim, a major catalyst looms: the SEC decision on 91 crypto ETF applications due by March 27. Market participants are bracing for extreme volatility; an approval could trigger a swift rebound, while rejection may force a deeper capitulation.
Can Bitcoin Price Reclaim $73,000 Before the Weekly Close? Here’s Our Prediction.
Bitcoin’s failure to hold the $69,000–$71,000 consolidation zone has exposed lower support levels. Currently, BTC is struggling against resistance at $71,500, blocked by the falling 20-day and 50-day EMAs.
The MACD histogram remains positive but is trading below the signal line, indicating that while selling pressure has eased slightly, bullish momentum is nonexistent. A critical defense line sits at $65,500; losing this level could validate a prolonged correction. Conversely, a successful breakout above immediate upper resistance at $73,600 could invalidate the bearish thesis.

For now, we should watch the $73,600 level closely; a clean break here is required to shift the 14-day RSI from its neutral 50.20 stance into bullish territory. This cycle, Bitcoin price prediction focuses more on sentiment than chart structures.
Discover: The best pre-launch token sales
LiquidChain Targets Early Mover Upside as Bitcoin Consolidates
While Bitcoin struggles to maintain the $67,000 floor, capital is beginning to rotate into infrastructure plays that solve the market’s fragmentation issues. The current bearish sentiment provides a pivotal moment for “pick-and-shovel” assets, or projects that gain utility regardless of whether the market trends up or down. As BTC dominates headlines, smart money often hunts for asymmetric returns in presale markets.
Enter LiquidChain ($LIQUID), a Layer 3 (L3) infrastructure project designed to fuse Bitcoin, Ethereum, and Solana liquidity into a single execution environment. The project has raised more than $600K in its ongoing presale, with tokens priced at $0.0143 at a very early stage.
LiquidChain’s “Deploy-Once Architecture” allows developers to write code once and access users across three major chains, eliminating the friction of bridging while giving more than 1700% APY on staking rewards.
It acts as “The Cross-Chain Liquidity Layer,” offering sub-second unified settlement. However, early-stage infrastructure carries development risk; the roadmap must be executed flawlessly to compete with established L2s. Investors looking for a hedge against BTC stagnation can research the presale below.
Disclaimer: Crypto is a high-risk asset class. This article is provided for informational purposes and does not constitute investment advice. You could lose all of your capital.
The post Bitcoin Price Prediction: War De-escalates, But Still Underperforming appeared first on Cryptonews.

Key Highlights
- Alibaba introduced the XuanTie C950, a cutting-edge 5nm RISC-V processor developed by its DAMO Academy division
- The processor operates at 3.2 GHz with performance exceeding its predecessor, the XuanTie C920, by over 300%
- Target applications include cloud infrastructure, AI inference operations, and agentic AI systems
- The company plans a separate public listing for T-Head, its semiconductor division
- BABA shares gained 2.98%, finishing at $126.06 on March 23
Alibaba’s semiconductor ambitions took center stage this week. During an internal DAMO Academy conference held Tuesday, the tech giant revealed its XuanTie C950 processor, claiming it represents “the highest performing RISC-V CPU in the world.”
The processor features 5-nanometer manufacturing technology and operates at 3.2 GHz, utilizing the open-source RISC-V architecture. This open framework enables chip developers to adapt instruction sets for specialized AI applications without incurring licensing costs — a strategic benefit for organizations deploying AI agents across large-scale operations.
Alibaba Group Holding Limited, BABA
Performance metrics show the C950 delivering over three times the speed of the earlier XuanTie C920 model. The company has not disclosed which manufacturing partner produced the silicon.
According to Alibaba’s announcement, the processor targets cloud computing environments and AI inference tasks. End users will have the flexibility to configure the chip for specialized inference requirements.
Building a Complete AI Ecosystem
CEO Eddie Wu articulated his strategy last year: positioning Alibaba as an end-to-end AI technology company spanning both hardware and software layers. That vision is now materializing.
During last week’s quarterly earnings discussion, Wu confirmed that Alibaba’s custom AI accelerators have transitioned into volume production. The T-Head semiconductor division is now competing directly with Nvidia and Huawei in China’s domestic marketplace.
T-Head has already onboarded significant enterprise clients, and Alibaba continues advancing preparations for the unit’s independent stock market debut. That initiative remains in progress.
The company maintains two distinct chip product families. The Zhenwu 810E lineup focuses on AI model training and inference capabilities. Meanwhile, the XuanTie portfolio, now including the C950, targets high-performance cloud environments and agentic AI deployments.
RISC-V Emerges as Strategic Architecture
RISC-V has gained substantial traction among Chinese technology firms as geopolitical friction restricts access to Western semiconductor intellectual property. Alibaba ranks among the architecture’s earliest and most committed advocates domestically.
The standard directly challenges offerings from Arm Holdings and Intel. When Arm encountered limitations conducting business with Huawei following US export restrictions, RISC-V partially addressed that market void.
The C950 debut caps an active period for Alibaba’s artificial intelligence product portfolio. Last week witnessed the introduction of Wukong, an enterprise-grade platform engineered for AI agent orchestration.
Monday brought the global launch of Accio Work, the international edition of that platform. Targeting small and mid-market enterprises, it promises autonomous execution of sophisticated operational workflows.
Earlier this month, Alibaba consolidated certain AI development teams into a newly formed division called Alibaba Token Hub, concentrating on enterprise-focused AI workplace solutions.
The competitive landscape: Token pricing for Chinese AI models has plummeted amid intense domestic rivalry, compelling firms like Alibaba to pursue margin protection and competitive differentiation through hardware and infrastructure innovation.
BABA finished trading at $126.06 on March 23, advancing $3.65 or 2.98% for the session. Pre-market activity on March 24 showed shares retreating to $124.94, declining 0.90%.


Nasdaq will integrate its Calypso risk and collateral platform and trade surveillance system with digital asset infrastructure firm Talos’s institutional trading tools.
The integration announced Monday aims to offer institutional clients a “unified” workflow for managing tokenized collateral and monitoring crypto and traditional assets for market abuse. It aims to ease a bottleneck in institutional tokenization, with Nasdaq citing internal research that roughly $35 billion in collateral sits tied up in “corrective and non-interest-bearing measures.”
Nasdaq’s integration of its trade surveillance tools means that Talos clients will be able to run alerts for opaque tactics such as wash trading, spoofing and layering across the venues they access.
The companies said the partnership is intended to bring “institutional-grade” compliance standards to digital asset markets.
Crypto’s recent history offers reasons for caution
Crypto’s history is laced with examples of the practices Nasdaq and Talos seek to address, despite previous claims of institutional-grade compliance and tooling.
In 2020, Canada’s Coinsquare exchange admitted to running artificial wash trades that accounted for more than 90% of its reported volume, leading to a settlement with the Ontario Securities Commission and the ouster of senior executives.
In 2022, the collapse of US-based crypto exchange FTX revealed how an exchange touting sophisticated risk management gave a company associated with it what regulators described as an unlimited line of credit and exemptions from key controls.
In January 2025, blockchain analytics firm Chainalysis found that suspected wash trading and pump-and-dump schemes still accounted for significant volumes across decentralized finance pools, and illicit crypto volumes reached almost $51 billion in 2024.
Part of a broader tokenization push
Talos, whose clients range from hedge funds to brokers, extended its Series B round by $45 million in January to a total of $150 million at a roughly $1.5 billion valuation, with backers including Robinhood Markets and BNY.

The Nasdaq deal comes as BlackRock CEO Larry Fink told shareholders in his 2026 annual letter that tokenization is “updating the plumbing of the financial system” and may be at a similar stage to the internet in 1996, arguing that blockchain‑based representations of assets could broaden access and cut costs across markets.
Nasdaq and Talos are not alone in chasing that opportunity, with the New York Stock Exchange (NYSE) owner Intercontinental Exchange developing a blockchain‑based platform for 24/7 trading of tokenized stocks and ETFs, and global asset manager Franklin Templeton expanding tokenized US government money market funds and collateral programs for institutions.

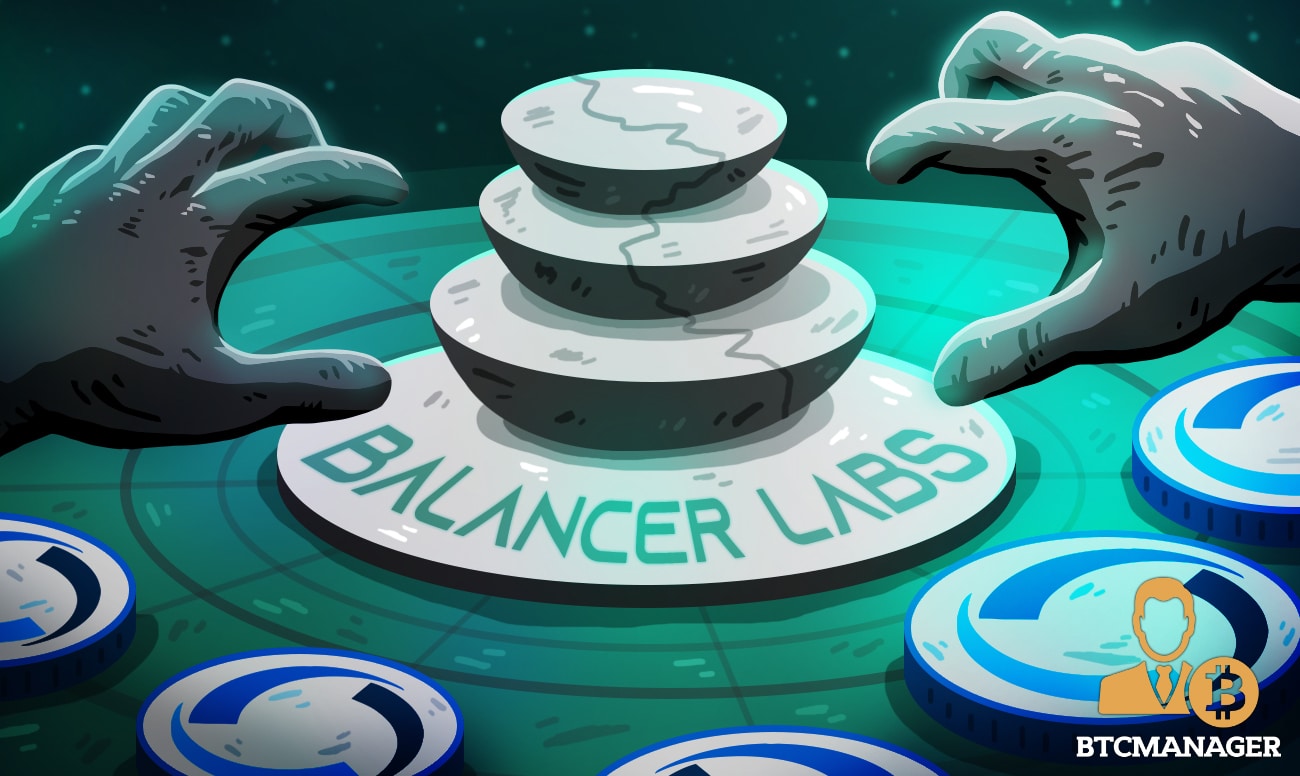
Balancer Labs is preparing to shut down as the team behind the DeFi protocol moves to cut costs after months of financial strain. The plan would leave the protocol running under a leaner structure led by the Balancer Foundation and the DAO while the corporate entity winds down.
Summary
- Balancer Labs will shut down as the protocol shifts toward DAO and foundation management.
- The November hack and falling TVL increased financial pressure across the Balancer ecosystem.
- Executives want lower costs, zero BAL emissions, and more revenue flowing to the DAO.
Balancer co-founder Fernando Martinelli said he had decided to wind down Balancer Labs after reviewing the project’s position. He said the company had become a “liability rather than an asset to the protocol” and linked that decision to legal exposure tied to the November 2025 exploit.
Balancer Labs chief executive Marcus Hardt also said the business was spending too much to attract liquidity compared with the revenue the protocol was generating. He said that approach came with dilution for BAL token holders and could not continue in its current form.
Balancer was one of the better-known DeFi protocols during the 2020 and 2021 market cycle. Its total value locked reached about $3.3 billion in November 2021 before falling sharply over the following years.
The pressure increased after the November 2025 exploit, which reports said totaled more than $100 million. Balancer’s TVL had already dropped to about $800 million by October 2025, then fell by another $500 million in thetwo weeks after the hack. Recent reporting placed the protocol’s TVL near $158 million.
Furthermore, Hardt and Martinelli said they want the Balancer Foundation and the DAO to guide the protocol from here. Their plan calls for a lean continuation model with lower operating costs and fewer people involved in day-to-day work.
Martinelli also backed changes to tokenomics and treasury flow. Those include cutting BAL emissions to zero and adjusting fees so the DAO can keep more of the revenue generated by the protocol. DAO members have been asked to vote on proposals tied to the restructuring and BAL token design.
Protocol revenue remains part of the case
Even with the current pressure, Martinelli said Balancer is still producing revenue. He said the protocol brought in more than $1 million over the past three months and described it as a working system weighed down by weak economics and a heavy cost base.
That position now forms the core of the restructuring push. The protocol is expected to continue operating, but under a smaller and less expensive setup built around the DAO and foundation rather than Balancer Labs.

Ethereum price is trading at $2,160, caught in a high-stakes consolidation zone with a neutral prediction behind it. While recent price action marks a 55% recovery from cycle lows, on-chain data signals caution: whale wallets distributed heavily into the March peak of $2,370.
Volatility is the only certainty this week. Despite persistent energy-driven inflation data keeping pressure on risk assets, institutional interest remains sticky, evidenced by ongoing inflows into BlackRock’s staked ETH ETF. However, the distribution pattern suggests smart money is de-risking ahead of the Glamesterdam hard fork. A break in either direction seems imminent.
— BSCN (@BSCNews) March 21, 2026
 MARKETS: BLACKROCK'S $ETH STAKING ETF IS ON FIRE!
Launched last week, @Blackrock's $ETHB staking ETF has already reached an AUM of more than $250 million.
Blackrock is not the first to launch an @Ethereum staking ETF but the weight carried by the firm puts it on a fast-track… pic.twitter.com/3OgLtTc513
The technical posture is mixed. While the Layer-2 ecosystem boasts more than $30 billion TVL, the immediate price action on the daily chart is testing trader resolve. Can the bulls defend the $2,000 level?
Ethereum Price Prediction: Can ETH Hold Support at $2,000?
As of this morning, Ethereum (ETH) sits at $2,160, posting a healthy +4.5% gain over the last 24 hours. The asset is currently respecting the 52-week range midpoint, utilizing the DEMA 9 at approximately $2,100 as dynamic support. This level is critical; a daily close below could trigger a slide toward the next major liquidity pool at $2,000.
Momentum indicators are flashing warning signs while the RSI hovers in neutral territory at 52 on the daily. This structure often precedes a volatility contraction before a violent expansion. Analysts note that a decisive reclaiming of $2,350 is required to invalidate the bearish distribution thesis.

Should broader market sentiment improve, perhaps tailored by a dovish FOMC dot plot, ETH could target the psychological $2,500 barrier. Conversely, if the projected +10.88% monthly forecast fails to materialize, the 50-EMA near $2,050 acts as the ultimate line in the sand for the bulls.
Discover: The best crypto to diversify your portfolio with
Bitcoin Hyper Targets Early Mover Upside as Ethereum Stalls
While Ethereum battles localized resistance and macroeconomic headwinds, capital is beginning to rotate (as it often does during consolidation phases) into high-beta infrastructure plays. Sophisticated traders are eyeing the emerging Bitcoin Layer 2 narrative, which promises to unlock trillions in dormant BTC capital.
Leading this charge is Bitcoin Hyper ($HYPER), the first-ever Bitcoin Layer 2 solution to integrate the Solana Virtual Machine (SVM). While Ethereum struggles with gas revenue issues, Bitcoin Hyper claims to deliver transaction speeds faster than Solana itself, directly on the Bitcoin network.
The market appetite for this utility is quantifiable. The project has already raised an amount of more than $32 million in its ongoing presale. Priced currently at just $0.0136, the token offers an entry point significantly lower than established L2s with 36% APY rewards.
The protocol features a Decentralized Canonical Bridge for seamless BTC transfers and supports high-speed smart contracts that break Bitcoin’s historical limitation of non-programmability.
Disclaimer: Crypto is a high-risk asset class. This article is provided for informational purposes and does not constitute investment advice. You could lose all of your capital.
The post Ethereum Price Prediction: Will Critical Support Break? appeared first on Cryptonews.


- TRON DAO announced the expansion of its AI Fund from $100 million to $1 billion.
- The fund targets identity, payments, RWAs & autonomous finance.
- What does this mean for agentic economy and TRX price?
TRON DAO has dramatically escalated its commitment to artificial intelligence by expanding its AI Fund from $100 million to $1 billion.
According to an announcement, the newly scaled fund will target early‑stage companies building core infrastructure for the “agentic economy.”
But what does this mean for TRX as the crypto project eyes AI‑driven payment systems, tokenized assets, and decentralized applications on the TRON blockchain?
TRON DAO expands AI Fund to $1 billion
The scaled‑up AI Fund marks a strategic pivot from a moderate development pool into a major capital‑allocation vehicle for AI‑native infrastructure.
TRON announced the expansion of its AI Fund from $100 million to $1 billion. The fund will target investments in and acquisitions of early-stage companies building core infrastructure for the agentic economy.
The fund will prioritize the development and consolidation of agent… pic.twitter.com/5K7shMrFDp
— TRON DAO (@trondao) March 23, 2026
TRON DAO has stated that the fund will focus on investments and acquisitions in early‑stage companies that build foundational tools for agent‑to‑agent interactions.
These include AI‑driven smart contracts, identity protocols, and machine‑to‑machine payment rails.
By concentrating on “core infrastructure,” Tron aims to deepen its integration with the emerging agentic economy, where AI systems execute financial and contractual operations autonomously on‑chain.
From a network‑level perspective, this expansion is designed to accelerate the development of AI‑centric decentralized applications (dApps) on TRON.
Significantly, it could also increase the utility of USDT‑based flows that already dominate the ecosystem.
Analysts note that TRON’s emphasis on low‑fee transactions and high‑ throughput makes it a natural environment for AI agents that need to perform frequent, low‑value operations at scale.
The AI Fund’s $1B war chest is expected to attract more developers, startups, and institutional partners to build and deploy AI‑enhanced products directly on the TRON network.
What does this mean for TRX price?
The expansion of the AI Fund does not directly alter TRX’s supply‑demand mechanics. It doesn’t outline buy‑backs or burns.
However, potential implications for TRX’s long‑term price trajectory are likely.
AI and blockchain convergence is a dominant narrative, and this move can only reinforce TRON’s positioning.
The multi‑year commitment can attract more developers, capital, and transaction volume to the ecosystem.
In this case, it would mean higher on‑chain activity and transaction fees. Automated trading bots, yield‑harvesting systems, and cross‑chain payment routers could all bolster this outlook.
TRX, as the native utility and gas‑payment token, could benefit in such an environment where AI‑funded projects drive adoption and demand.
The price of TRX has hovered near $0.30 over the past few weeks, largely under pressure alongside the broader market.
However, long-term bullish sentiment remains, with the token about 29% off its all-time high of $0.44 reached in December 2024.
Recent resilience has come amid increased buying from Tron Inc.

TLDR:
- Hostplus manages over A$150 billion and is now exploring Bitcoin access for self-managed retirement accounts.
- CIO Sam Sicilia confirmed member demand is driving the fund’s renewed interest in digital currency options.
- Any crypto offering through Choiceplus requires full regulatory approval before launching in the next financial year.
- Australia’s pension sector holds little crypto exposure, making Hostplus a potential industry trailblazer here.
Australia’s Hostplus pension fund, managing over A$150 billion, is exploring cryptocurrency investment options for its members.
Chief Investment Officer Sam Sicilia confirmed the fund is reviewing Bitcoin and other digital assets. This move could make Hostplus one of the first major Australian pension funds to offer crypto access. Any rollout depends on regulatory approval and remains in the design phase.
Hostplus Eyes Bitcoin Access Through Choiceplus Platform
The fund is looking at offering crypto through its Choiceplus investment option. This platform allows members to self-manage their retirement savings portfolios. Currently, Choiceplus accounts for roughly 1% of the fund’s total assets under management.
Member demand is a key driver behind this consideration. Sicilia pointed directly to member correspondence as evidence of that interest.
“There’s certainly a demand from some of our members who write in and say ‘why can’t I have access to cryptocurrency?’” he said.
Digital asset products could potentially be available as early as next financial year. However, consumer protections and regulatory compliance must come first. Several design and structural questions still need to be resolved before any launch.
Sicilia also noted that crypto has matured considerably since Hostplus first evaluated it nearly a decade ago. “We’re now at the stage where we’re revisiting digital currencies, not just Bitcoin, but just the broader range of digital currencies,” he said.
That broader scope reportedly includes assets such as music rights alongside traditional cryptocurrencies.
Regulatory Approval Remains Central to Any Crypto Rollout
Australia’s pension sector, worth A$4.5 trillion, has largely avoided cryptocurrency exposure. AMP became the first major fund to announce a Bitcoin futures investment back in 2024. Hostplus taking a similar step would mark a notable shift in industry posture.
The fund has been firm that it will not move forward without full regulatory clearance. Sicilia made the fund’s position clear on timing.
“We’d love to get regulatory tick off, even if it means waiting another six months,” he said. That patience reflects the fund’s broader investment philosophy.
“We are long-term investors. Six months doesn’t really move the dial for us,” Sicilia added. The fund is prioritizing a compliant and well-structured rollout over a rushed launch. Member protections remain at the center of that approach.
Outside major pension funds, Australia’s self-managed super funds hold around A$3 billion in crypto. These SMSFs represent about A$1.2 trillion of the broader pension system.
That existing exposure shows retail appetite for crypto within retirement structures is already present. Once approvals are secured, a structured crypto offering could follow within the next financial year.


Opinion by: Dr Corey Petty, chief evangelist at Logos
When early cryptocurrencies were conceptualized, the vision was not one of complex leverage strategies, celebrity rugpulls and government treasuries. Rather, cypherpunks sought, through cryptographic tools, to empower people through the privacy-given freedom to exchange goods and services without the threat of government overreach and mass corporate surveillance
The crypto landscape is turning from one of decentralized networks into an extension of traditional finance. Centralized exchanges regularly account for over 80% of daily crypto transactions. If crypto is to hold onto its original ethos, privacy cannot be optional.
Privacy is a tool for carving out the most important properties that support individual freedom in the digital realm: permissionlessness and censorship resistance.
Privacy as a principle to surveillance capitalism
In this era of regulation, blockchain’s peer-to-peer value proposition means little to institutions. With a pro-crypto administration in the United States, institutions have poured billions into decentralized finance (DeFi). This liberatory technology is quickly becoming a backend for institutional finance, complete with surveillance architecture and walled gardens.
A recent report by Samsung showed that nine out of 10 Europeans are worried about their online privacy while remaining unaware of the options available to them, like the potential of blockchain to safeguard this privacy. Policies like the UK’s push for crypto firms to report customer data have been accepted across industries. Protocols are hardwiring surveillance architecture and compliance-heavy frameworks that mandate data tracking into their offerings — all in an effort to secure institutional validation and large-scale inflows.
Prioritizing profit over purpose by design, perpetuates inequality. The unique properties of blockchain allowed for censorship-resistant solutions that have more recently been used to leverage highly lucrative airdrops, memecoins and casino-style trading strategies, as flagship cryptocurrencies have grown in value.
Products have begun to alienate the very people that crypto was designed to uplift. Instead of get-rich-quick schemes and institutional lobbying, DeFi should be prioritizing accessible financial tools: low-cost layer-2 solutions that reduce transaction fees to pennies, intuitive user interfaces that don’t require technical expertise and products that address real-world needs with the end goal of enabling financial freedom for millions of people.
From a lost cause to a brighter future
If DeFi will not advocate for crypto’s potential for self-sovereignty, then it is up to the remaining cypherpunks to find other avenues to apply it. Self-governance is perhaps the most comprehensive example of such an application, offering freedom of choice for people over how they wish to be governed and by whom, providing an exit from financial institutions and state-corporate surveillance.
In blockchain governance, the same ledger that supports transparent financial transactions ensures open and immutable voting systems. Tokenized citizenship models can enable fluid participation and serve as an anonymous yet functional digital ID, ensuring access to services.
Using smart contracts, cyberstates — also called network states — enable communities to form voluntary associations based on shared values rather than geographic boundaries. Citizens can exit oppressive jurisdictions and opt into governance systems that align with their principles, creating competitive markets for governance where the best systems attract the most participants.
Rather than being subject to the surveillance and control of traditional nation-states through cryptographically secured systems that take privacy as a cornerstone principle, individuals can organize in decentralized communities, govern themselves through direct democracy, and return sovereignty to the individual, fulfilling the original cypherpunk vision.
Related: Network states will one day compete with nation-states
Early visions are already being built. Charter cities and projects are pioneering experiments that combine blockchain governance with physical communities. Meanwhile, decentralized physical infrastructure networks are demonstrating that blockchain has transformative functions far beyond finance, enabling communities to collectively own and operate real-world infrastructure from agricultural supply chains to computing power.
As blockchain technology reaches the masses and institutional adoption becomes inevitable, it is time to reclaim the founding mission. The technology that was built to free individuals from centralized control must not become another tool of that control.
Opinion by: Dr Corey Petty, chief evangelist at Logos.
This opinion article presents the author’s expert view, and it may not reflect the views of Cointelegraph.com. This content has undergone editorial review to ensure clarity and relevance. Cointelegraph remains committed to transparent reporting and upholding the highest standards of journalism. Readers are encouraged to conduct their own research before taking any actions related to the company.

Bitmine buys $139M in ETH as Tom Lee sees winter ending

How the abortion lobby lost the plot
All-Time Sweet 16 Appearances by Schools in West


![BITCOIN: 24 HOURS LEFT!!!! [I WENT LONG]](https://wordupnews.com/wp-content/uploads/2026/03/1774346399_maxresdefault-80x80.jpg)


-
 Crypto World3 days ago
NIO (NIO) Stock Plunges 6.5% as Shelf Registration Sparks Dilution Worries
-

 Fashion4 days ago
Weekend Open Thread: Adidas – Corporette.com
-

 Politics4 days ago
Jenni Murray, Long-Serving Woman’s Hour Presenter, Dies Aged 75
-
 Tech7 days ago
Are Split Spacebars the Next Big Gaming Keyboard Trend?
-

 Crypto World2 days ago
Best Crypto to Buy Now: Strategy Just Spent $1.57 Billion on Bitcoin During Fear While Early Investors Quietly Enter Pepeto for 150x Potential
-

 News Videos6 days ago
RBA board divided on rate cut, unusually buoyant share market | Finance Report | ABC NEWS
-

 Crypto World3 days ago
Bitcoin Price News: Bhutan Sells $72 Million in BTC Under Fiscal Pressure, but the Smart Money Entering Pepeto Sees What the Market Does Not
-

 Politics6 days ago
The House | The new register to protect children from their abusers shows Parliament at its best
-

 Tech4 days ago
inKONBINI Lets You Spend Summer Days Behind the Register
-
 Politics7 days ago
Real-time pollution monitoring calls after boy nearly dies
-

 Crypto World6 days ago
Canada’s FINTRAC revokes registrations of 23 crypto MSBs in AML crackdown
-

 Sports22 hours ago
Remo Stars and Kano Pillars Strengthen Survival Hopes in NPFL
-
 NewsBeat6 days ago
Residents in North Lanarkshire reminded to register to vote in Scottish Parliament Election
-

 News Videos6 days ago
PARLIAMENT OF MALAWI – PAC MEETING WITH REGISTRAR OF FINANCIAL ON AMARYLLIS HOTEL – INQUIRY LIVE
-

 Politics5 days ago
Gender equality discussions at UN face pushbacks and US resistance
-

 Business2 days ago
No Winner in March 21 Drawing as Prize Rolls to $133 Million for Next
-

 Business6 days ago
Who Was Alex Pretti? 5 Key Facts About the ICU Nurse Killed by Federal Agents in Minneapolis
-

 Sports21 hours ago
Gary Kirsten Accuses Pakistan Cricket Board Of ‘Interference’, Mohsin Naqvi Responds
-

 Tech2 days ago
Give Your Phone a Huge (and Free) Upgrade by Switching to Another Keyboard
-

 Sports4 days ago
2026 Kentucky Derby horses, odds, futures, preview, date: Expert who nailed 12 Derby-Oaks Doubles enters picks
You must be logged in to post a comment Login