Crypto World
Litecoin price nears $75 as a golden cross tests the strength of its rally

Litecoin price has climbed above $74 after breaking through the $64–$65 resistance area, while a golden cross on the daily chart has given traders another reason to watch whether the rally can clear $75.
Summary
- Litecoin price reached about $74.77 on Sep. 24 after opening near $61.85.
- The daily 50-day moving average has crossed above the 200-day average near $51.
- The 4-hour chart places immediate resistance at $75, followed by $78.13.
- CoinGlass’s three-day heatmap shows potential liquidation leverage around $75–$77.
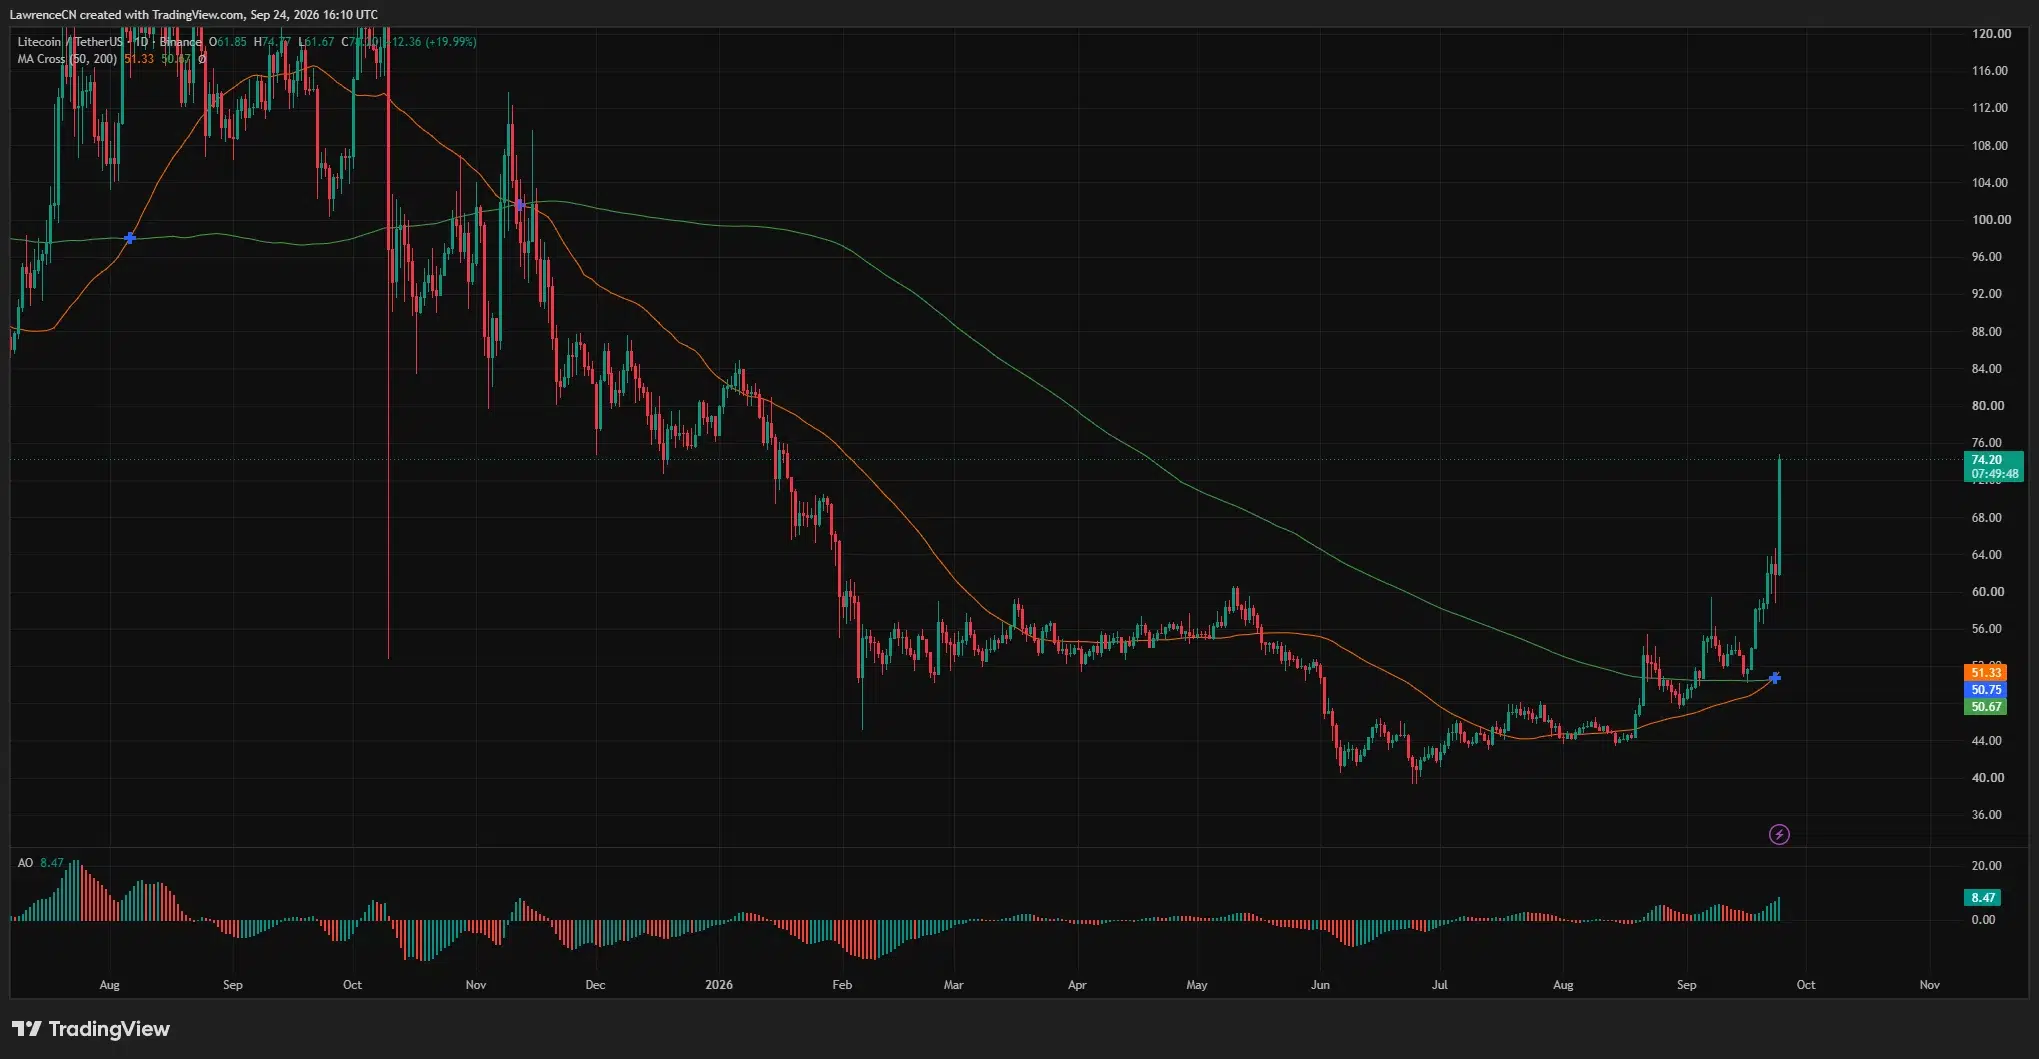
Litecoin (LTC) price traded near $74.20 when the daily LTC/USDT chart was captured, up about 20% from its daily open. The price had briefly reached $74.77, extending a recovery from the mid-September lows and pushing well beyond the $64–$65 area that had held back earlier gains.
The daily chart also shows the 50-day moving average at about $51.33, above the 200-day average near $50.67. Traders call that crossing a golden cross. Both averages sit far below the current price, so the immediate question is whether buyers can hold the breakout near $70 and push through $75.

Litecoin Foundation data added to the activity surrounding the move. The organization reported on Sep. 23 that more than 17 million LTC, worth over $1 billion, had moved across the network within 24 hours. The measure tracks blockchain transfers rather than purchases on exchanges, so it does not establish how much of the price gain came from spot demand.
Litecoin’s $75 test comes after a sharp 4-hour advance
The 4-hour chart shows LTC moving rapidly through several marked price levels. After trading below $65 earlier in the session, it cleared the $65.63 trading-range boundary, moved above the $68.75 pivot and passed $71.88.
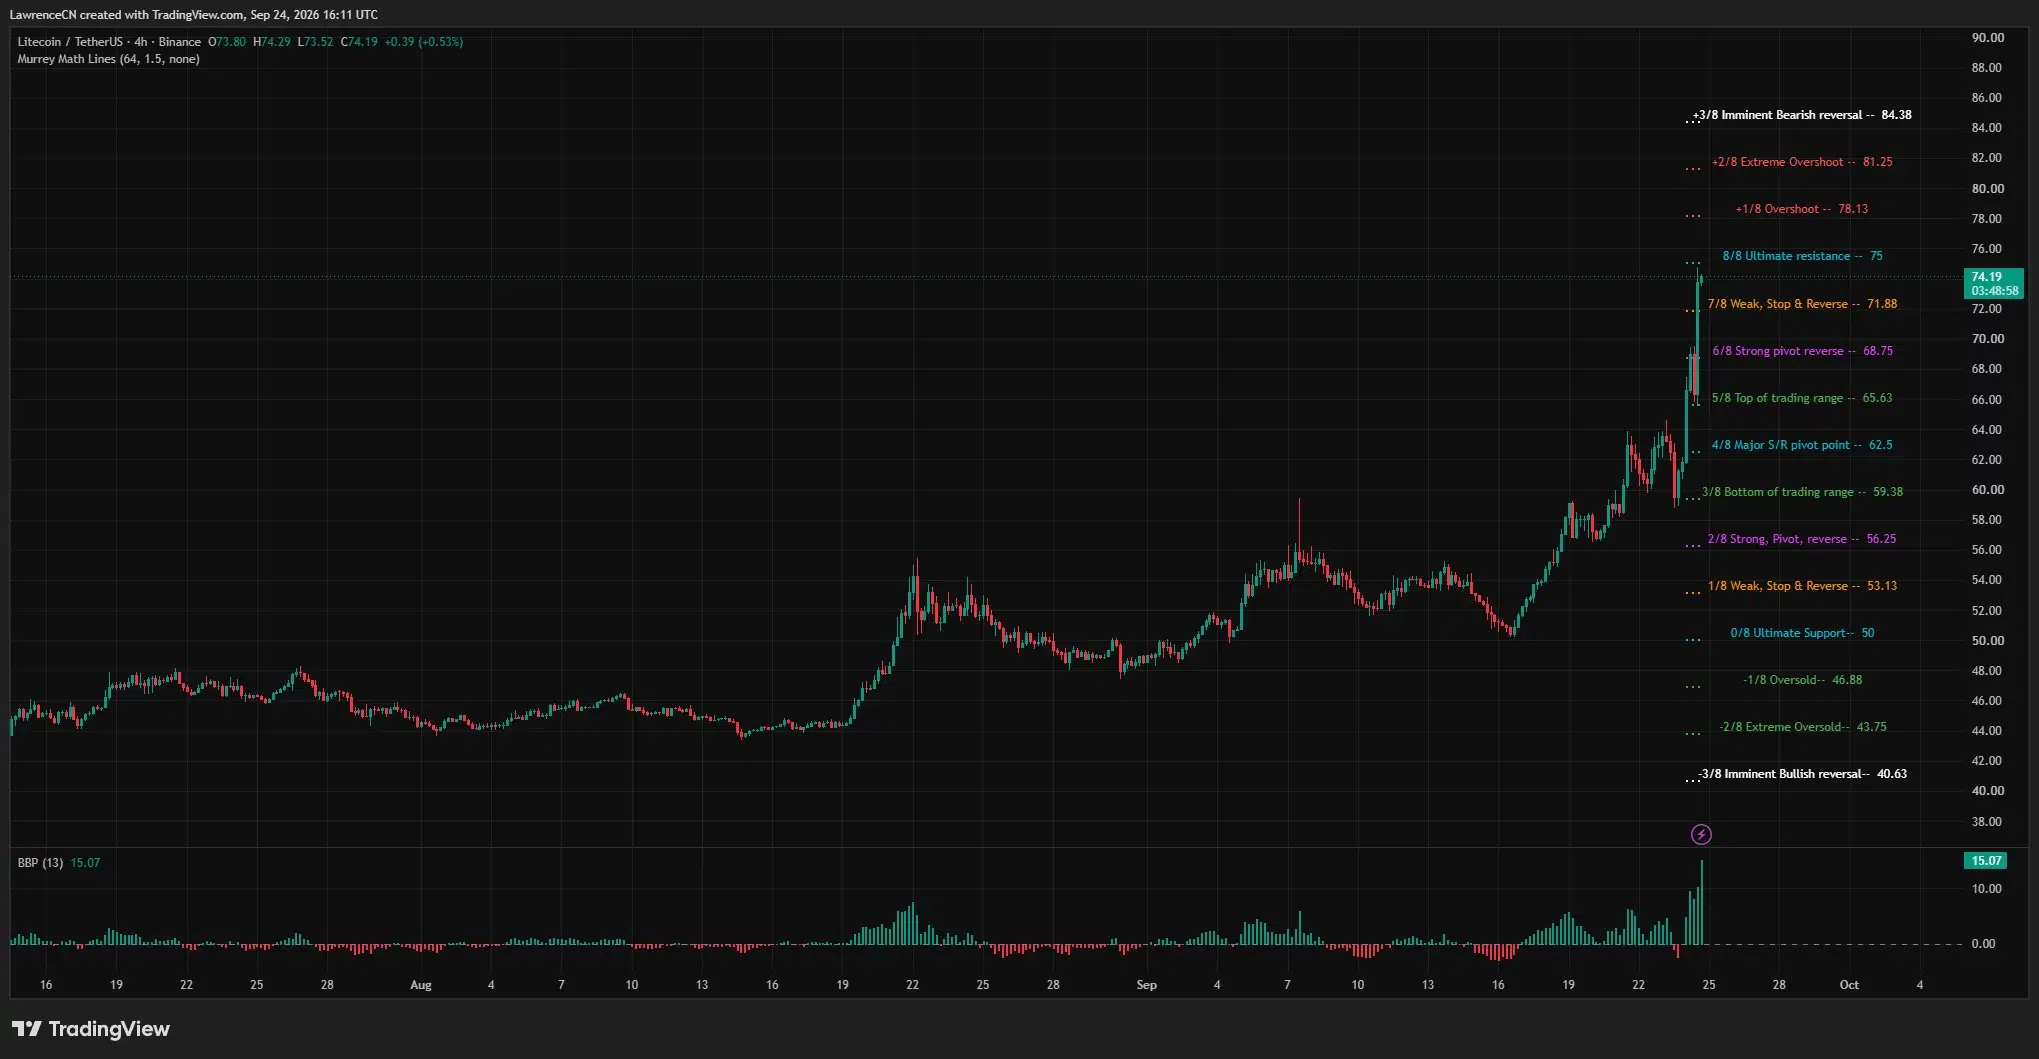
The latest 4-hour candle reached about $74.29 and stood near $74.19 when the chart was captured. Price was therefore close to $75, the next resistance marked by the chart’s Murrey Math levels. A move above $75 that holds could bring $78.13 into focus.
The pace of the climb matters for that test. The 4-hour BBP momentum reading rose to 15.07 as LTC approached $75, reflecting how far and how quickly the price had moved above its recent range. Strong momentum can carry a breakout further, but buyers would still need to defend the levels cleared during the rise.
The daily AO indicator also climbed to 8.47, one of its highest visible readings in months. Its rise supports the change in momentum shown by the price candles, while the golden cross reflects a slower shift in the daily trend. Neither signal confirms that $75 has been broken.
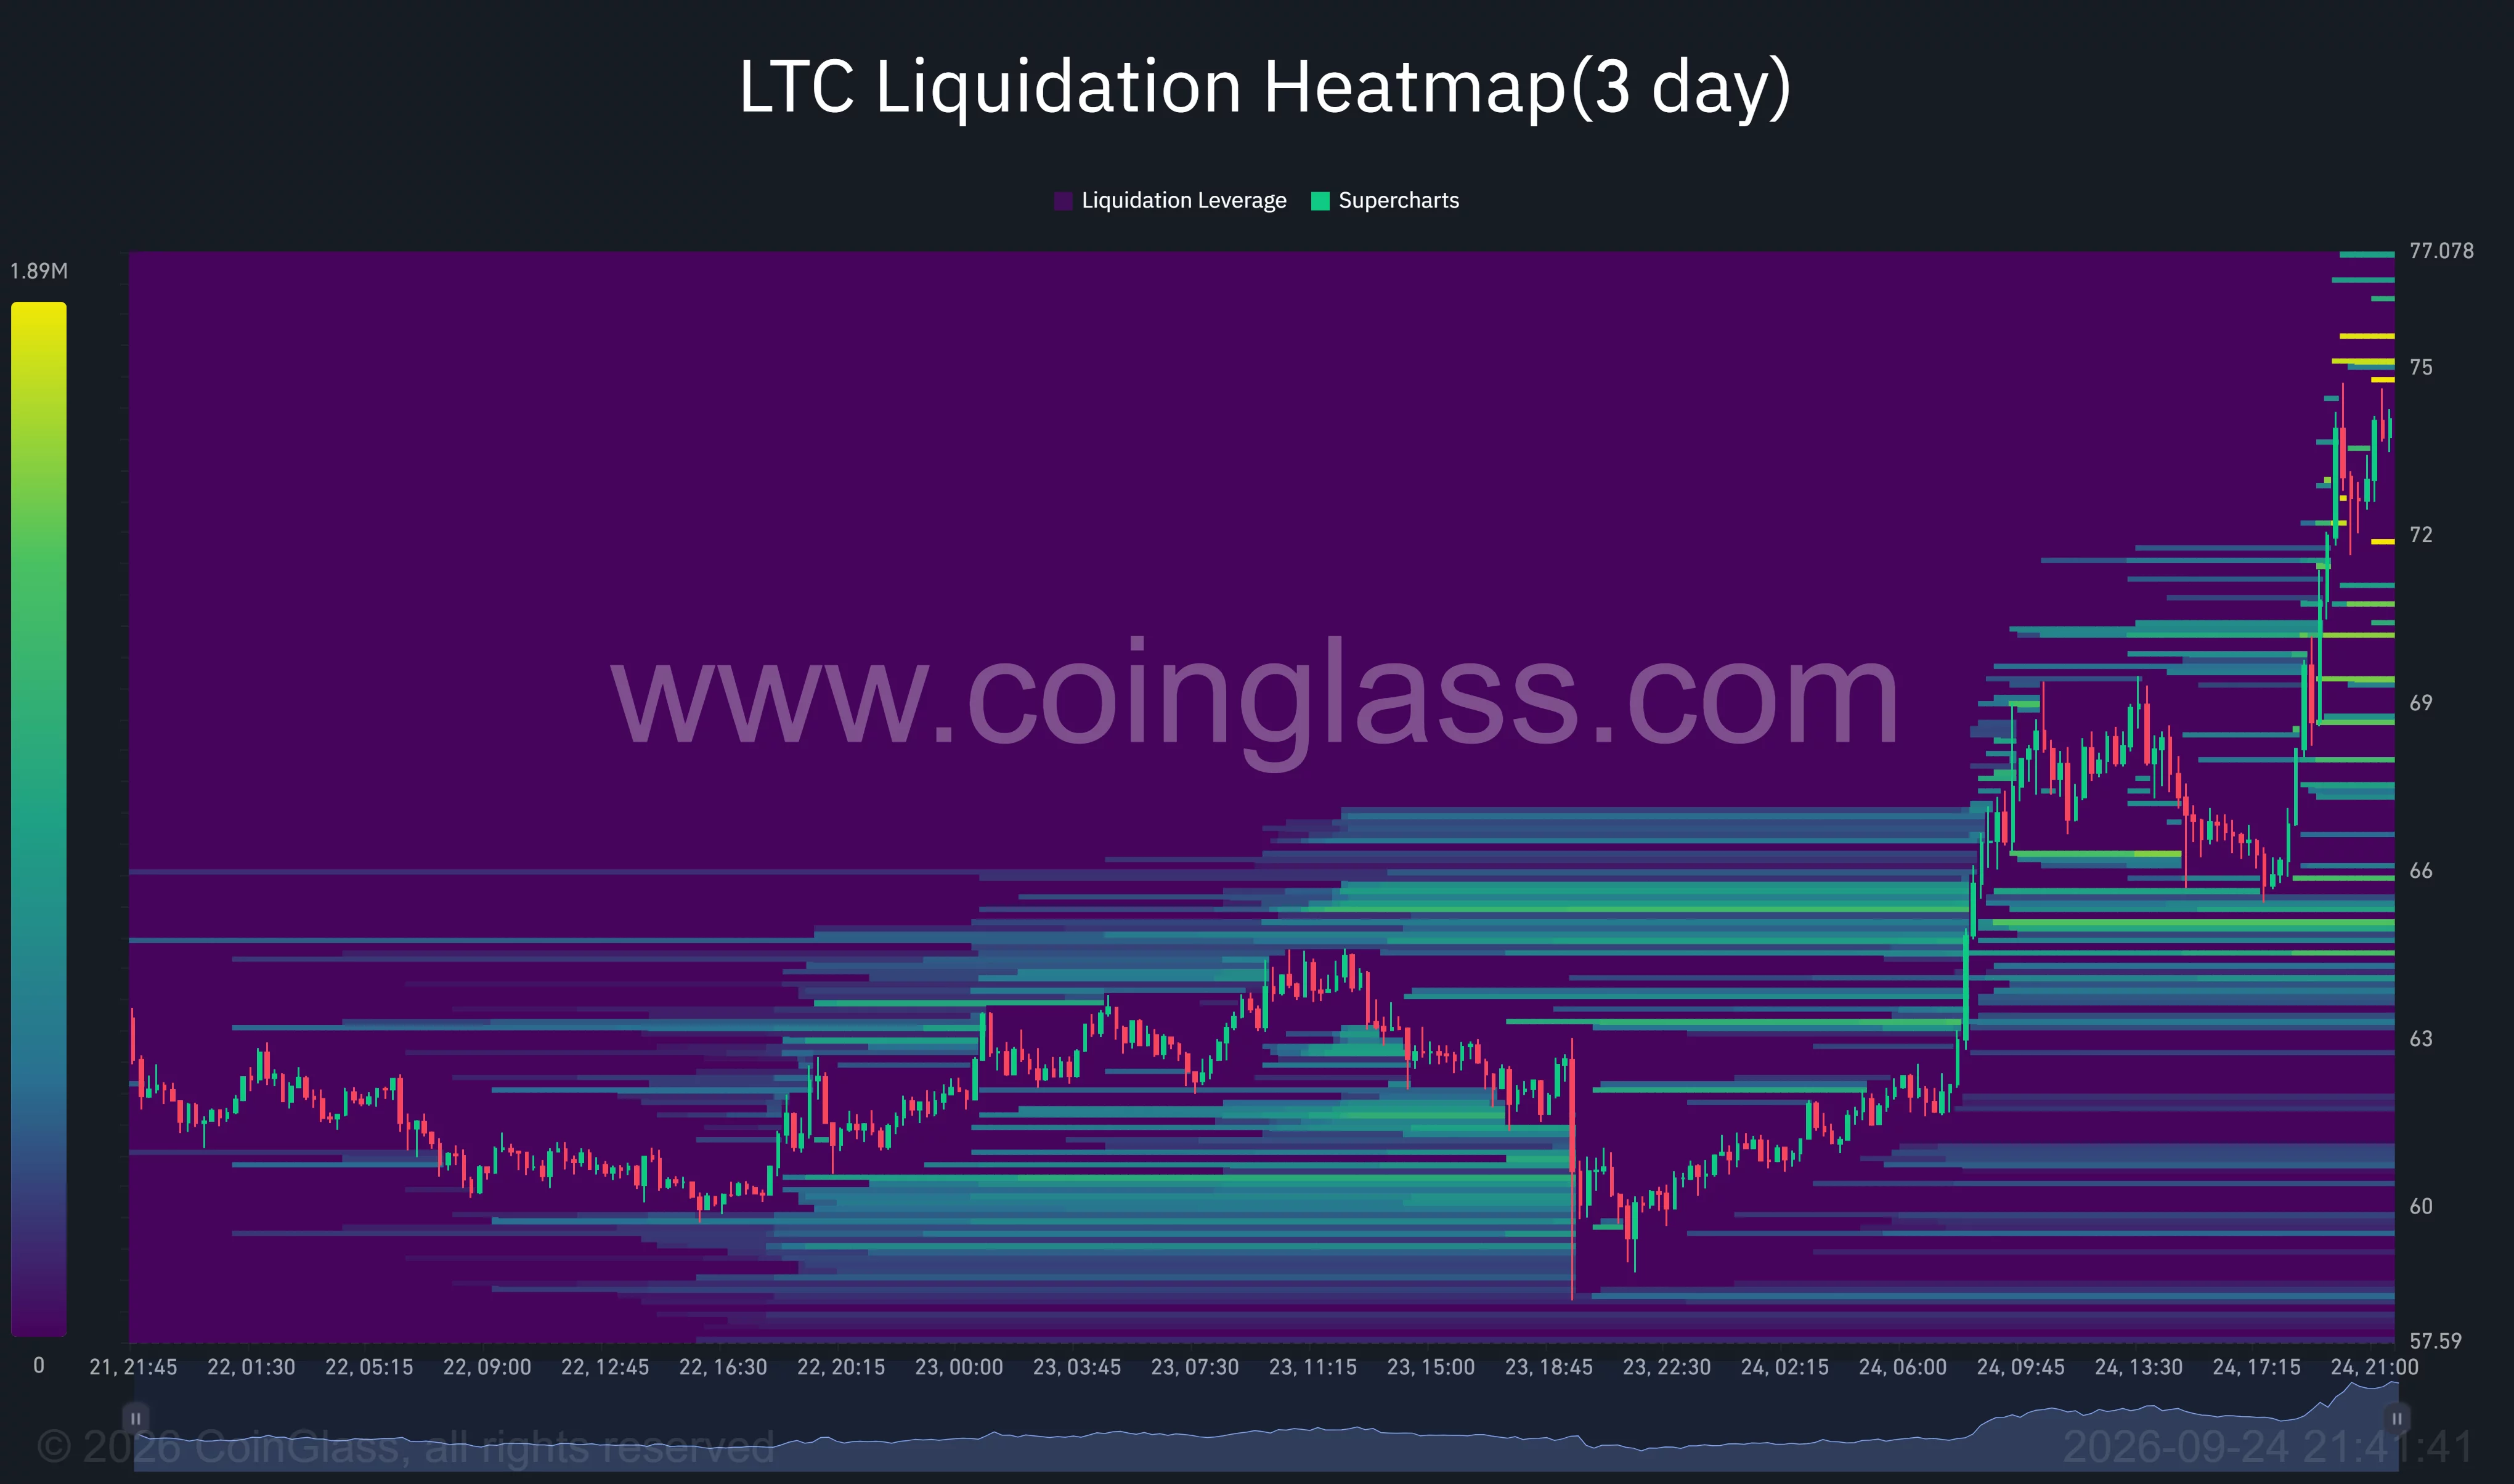
CoinGlass’s three-day liquidation heatmap shows bands of potential liquidation leverage near $75 and higher toward $77. If LTC rises into those bands, short positions may face pressure to close. The bands mark possible liquidation levels, however, rather than liquidations that have already occurred.

Earlier trading showed how quickly short covering could affect LTC. A one-hour rise from roughly $61.92 to $66.36 early on Sep. 24 coincided with reported short liquidations across major exchanges. CoinGlass data also showed Litecoin futures open interest above $500 million, pointing to substantial outstanding positions as the rally developed. Open interest does not reveal whether those traders expect a rise or fall.
What happens if LTC cannot hold the breakout?
If LTC turns lower before clearing $75, the 4-hour chart puts $71.88 at the first marked level below the current price. A drop through it would shift attention to the $68.75 pivot, followed by the former trading-range boundary at $65.63.
The heatmap shows potential liquidation leverage below price as well, with bands around $69–$71 and $64–$66. A decline into those areas could add to volatility. Their presence does not mean LTC must revisit them.
The $64–$65 area is especially relevant because it capped the previous advance before the Sep. 24 surge. Holding above it on a pullback would show that buyers continue to defend the breakout. Falling back below it would put LTC inside its old range, even though the daily moving averages have crossed.
Coinbase’s U.S. lending service provides a separate use for Litecoin. The exchange lists LTC as eligible collateral for USDC loans through Morpho on Base for qualifying customers, excluding residents of New York. That availability does not establish a link to Sep. 24 buying, leaving the $75 price test and the levels beneath it as the clearer near-term measures of the rally.
Disclosure: This article does not represent investment advice. The content and materials featured on this page are for educational purposes only.
You must be logged in to post a comment Login