

Crypto World
Market Turbulence: Key Inflation Reports and Oracle (ORCL) Earnings on Deck as Crude Soars

TLDR
- Crude oil prices rocketed more than 36% in one week, surpassing $91 per barrel following Iran conflict disrupting critical Strait of Hormuz routes
- Major indexes suffer losses: S&P 500 down 1.5% year-to-date; Nasdaq off 3.7% since the start of January
- February payrolls shocked markets with a loss of 92,000 positions versus expectations for 55,000 additions
- Key earnings releases: Oracle (ORCL) Tuesday; Adobe and Hewlett Packard Enterprise follow later in the week
- Critical inflation metrics arrive Wednesday (CPI) and Friday (PCE), setting the stage for the Federal Reserve’s upcoming policy meeting
Wall Street concluded Friday’s trading session sharply lower, marking the conclusion of one of 2026’s most challenging weeks for equities. The S&P 500 declined 1.3% during Friday’s session, bringing year-to-date losses to 1.5%. Tech-heavy Nasdaq tumbled 1.6% on the day, extending its 2026 decline to 3.7%. The Dow Jones Industrial Average shed approximately 450 points.
The primary catalyst for market distress stems from escalating conflict in Iran, severely restricting petroleum shipments through the strategically vital Strait of Hormuz. Under normal circumstances, this critical waterway facilitates approximately 20% of global seaborne crude oil transport.
The disruption has effectively stranded roughly 16 million barrels without viable routes to market, based on analytics from Vortexa. Storage facilities have reached capacity. Production cutbacks are underway. Oil prices have exploded upward by more than 36% over seven days, breaking through $91 per barrel — representing the steepest weekly increase recorded since at least 1985.
Macquarie’s global energy strategist Vikas Dwivedi cautioned that “several weeks of Hormuz disruption will trigger cascading consequences potentially propelling crude toward $150 or beyond.” Market analysts increasingly view such levels as within the realm of possibility.
Inflation Concerns and Central Bank Policy
The dramatic surge in petroleum prices arrives at a particularly challenging moment for Federal Reserve policymakers. San Francisco Fed President Mary Daly acknowledged to CNBC Friday that “the oil shock represents a genuine concern, with duration being the critical factor.”
Analysis from Goldman Sachs suggests that sustained elevated crude prices over multiple months could push annual headline inflation back toward the 3% range. This stands notably above the Federal Reserve’s established 2% objective.
Ten-year Treasury yields have advanced past 4.14%. Market expectations for interest rate reductions have moderated as participants evaluate the potential for rising energy costs to impede inflation normalization. Fed policymakers including Neel Kashkari and John Williams indicated it remains premature to fully gauge the impact.
Wednesday’s February Consumer Price Index release and Friday’s January Personal Consumption Expenditures data will provide crucial insights into price pressures before next week’s Federal Reserve policy announcement.
Employment Data Compounds Market Anxiety
The February employment situation report intensified investor concerns. American employers shed 92,000 positions, a stark reversal from analyst projections calling for 55,000 job additions. The unemployment rate climbed to 4.4% from January’s 4.3% reading.
BREAKING: The US economy unexpectedly LOSES -92,000 jobs in February, below expectations of a +58,000 gain.
The unemployment rate was 4.4%, above expectations of 4.3%.
This marks just the 2nd monthly job loss since the 2020 pandemic.
The US labor market is clearly weakening.
— The Kobeissi Letter (@KobeissiLetter) March 6, 2026
Certain economists attributed the weakness to temporary distortions, notably a Kaiser Permanente labor action that eliminated 37,000 positions from the tally. BNP Paribas economist Andrew Husby characterized the outcome as influenced by “exceptional circumstances.”
Alternative perspectives emerged. Bolvin Wealth Management’s Gina Bolvin identified “a divided economy — decelerating overall expansion combined with rapid technological disruption.” Block, helmed by Jack Dorsey, eliminated 4,000 positions in February, with company leadership directly citing artificial intelligence implementation as the driver.
#earnings for the week of March 9, 2026 https://t.co/hLn2sKQhEY $ORCL $ADBE $NIO $PATH $RBRK $S $KSS $AVAV $CASY $HPE $ZIM $VOYG $NKTR $DDD $BETA $ZVRA $SERV $FCEL $CPB $ULTA $NSK $CXM $TTAN $ACCO $MTN $YEXT $AUNA $DKS $KFY $SFIX $GNS $NYAX $KRO $LFMD $UMAC $SPRY $STXS $SBET… pic.twitter.com/No54dcR5hZ
— Earnings Whispers (@eWhispers) March 6, 2026
Oracle delivers quarterly results Tuesday. Shares have plummeted more than 50% from September peak levels. The enterprise software giant recently unveiled ambitions to secure $50 billion in financing for artificial intelligence infrastructure expansion. Adobe and Hewlett Packard Enterprise also report results this week, joined by Dollar General, Li Auto, and Nio.


Hyperliquid (HYPE) may hit $150 by August, according to BitMEX co-founder Arthur Hayes.
Key takeaways:
-
CEX volume rotation and demand for macro-linked markets, including oil, are boosting HYPE’s bull case.
-
A cup-and-handle setup is hinting at an initial breakout toward $50.
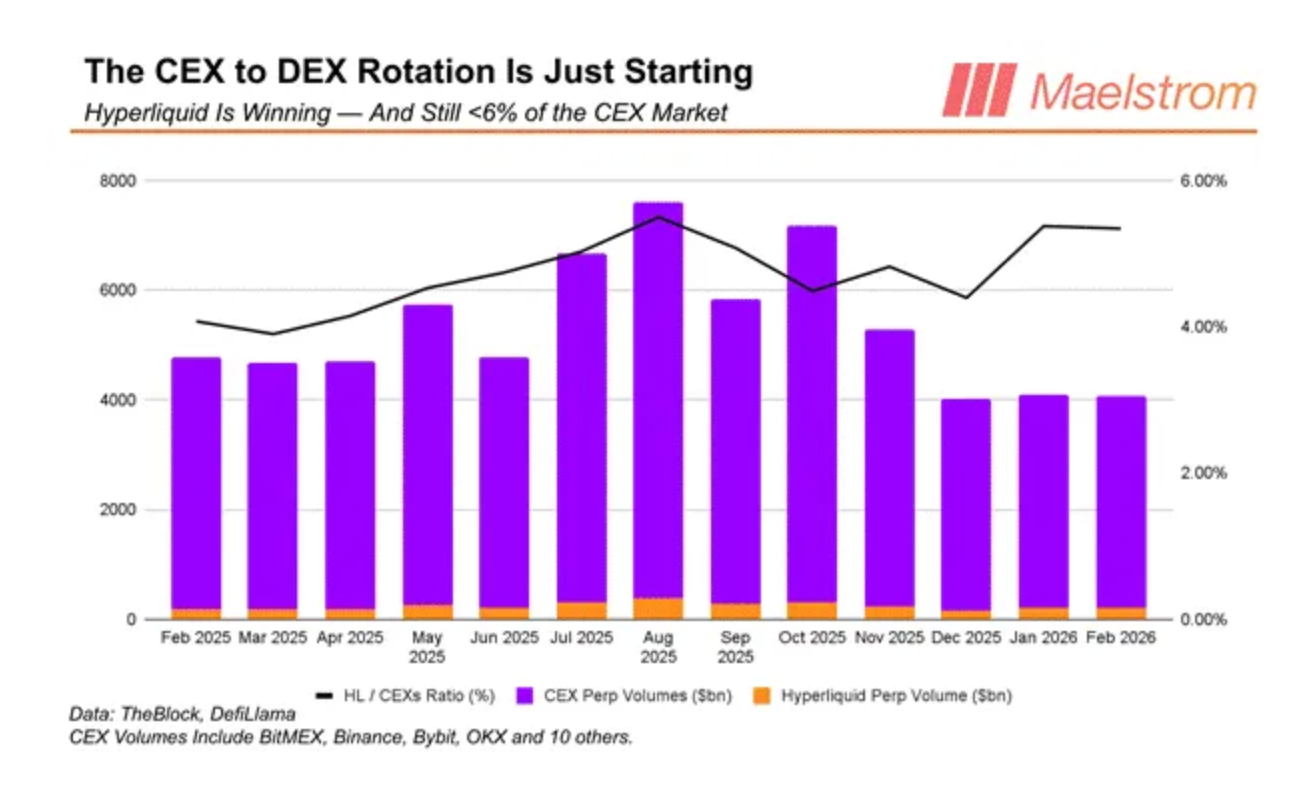
CEX to DEX rotation can grow HYPE prices fivefold
In a post published on Monday, Hayes said that if Hyperliquid keeps pulling derivatives volume away from centralized exchanges (CEX) and expands its product suite, HYPE could climb roughly fivefold from around $30.
To make it happen, Hyperliquid’s 30-day annualized revenue run rate must rise to $1.40 billion by August from $843 million in March.

Such growth is achievable if the platform captures another 3.96% share of derivatives volume from centralized exchanges after already absorbing roughly 6% as of March.
Hyperliquid uses about 97% of its revenue to buy HYPE tokens from the open market. Therefore, most of the money the platform makes is used to buy its own token, which can support the price if trading activity keeps rising.
That structure, Hayes said, boosts HYPE’s odds of rising toward $150.
Tokenized oil boom: Hyperliquid’s bull case
Hayes’s bullish call came as the US–Iran war turned oil into Hyperliquid’s top-traded assets.
On Tuesday, CL-USDC, its crude oil-linked perpetual pair, reached about $1.29 billion in 24-hour volume, overtaking ETH-USDC at roughly $1.24 billion, showing traders are increasingly using the platform to bet on traditional assets, not just crypto.

The trend also supports Hayes’s broader HIP-3 thesis. HIP-3 lets users launch perpetual markets permissionlessly by staking HYPE, and Hayes said newer listings tied to oil, gold, silver and major US indexes are already gaining traction.
Related: Oil retreats from 25% surge as G7 weighs emergency reserve release
He argued that HIP-3 now contributes nearly 10% of Hyperliquid’s revenue and could grow revenue by 160% in the coming months if the DEX keeps offering macro assets like gold and oil.

Last year, Maelstrom, a family office fund tied to Arthur Hayes, predicted declines in HYPE prices due to $11.90 billion in token unlocks. Since then, the Hyperliquid token has fallen by roughly 40%.

Still, Hayes has also made several high-profile calls that did not play out.
That includes Bitcoin targets of $250,000 by the end of 2025 and $200,000 by March 2026, as well as a January 2025 call for TRUMP memecoin to hit a $100 billion market cap by inauguration.
HYPE technicals hint at initial breakout toward $50
From a technical perspective, HYPE may rally toward $50 in March or by April, based on a cup-and-handle pattern.
A cup-and-handle forms after a rounded recovery and a brief consolidation. It confirms when price breaks above the neckline resistance, with upside typically measured by the pattern’s maximum height.

Applying the technical rule to HYPE gives a measured upside target of around $50 if the price breaks decisively above the $35.50 neckline resistance. If the pattern plays out, it will result in gains of more than 40% from current levels.
Conversely, a pullback from $35.50 could push the HYPE price initially toward $30, a level aligning with the 0.236 Fibonacci retracement line and the 50-day exponential moving average (50-day EMA, the red wave).
This article does not contain investment advice or recommendations. Every investment and trading move involves risk, and readers should conduct their own research when making a decision. While we strive to provide accurate and timely information, Cointelegraph does not guarantee the accuracy, completeness, or reliability of any information in this article. This article may contain forward-looking statements that are subject to risks and uncertainties. Cointelegraph will not be liable for any loss or damage arising from your reliance on this information.


A policy paper from the UK government’s Home Office said that “vulnerabilities remain” in authorities’ attempts to fight fraud in emerging payments, including digital assets.
The UK government has issued a policy paper on how to combat fraud against individuals and businesses from 2026 to 2029, specifically noting that its strategy would consider digital assets.
In a paper published on Monday, the UK’s Home Office identified cryptocurrencies as one medium of exchange “where victims are deceived into willingly transferring money” through scams on social media platforms and messaging. According to authorities, “vulnerabilities remain” in their attempts to fight fraud in emerging payments like crypto, and the technology posed “growing risks” for consumers.
“The [National Crime Agency] launched a nationwide campaign in 2025 to help consumers spot fraud, and the Government is also supporting law enforcement, including the Serious Fraud Office (SFO), to enhance cryptoasset investigation capabilities,” said the UK government.
Measures already taken by the government include the Financial Conduct Authority’s (FCA) crackdown on crypto companies marketing tokens to UK consumers that began in 2023, and HM Treasury introducing a comprehensive regulatory framework for digital assets set to be implemented in October 2027. The paper said that requiring crypto companies “to obtain FCA authorization and comply with its rules” would help fight related fraud.
Related: French couple robbed of $1M in Bitcoin by criminals posing as police
“This is not just about reducing crime; it is about restoring confidence,” said Home Secretary Shabana Mahmood and Minister of State at the Home Office, Lord Hanson of Flint. “Every pound stolen through fraud is a pound not reinvested in our economy. Every victim is a reminder of why we must act. By delivering this Strategy, we will make the UK a safer place to live, work, and do business, and send a clear message to criminals: there is nowhere you can hide.”
Scrutiny over crypto contributions to UK politicians
While the policy paper focused on fraud, it did not explicitly mention an ongoing debate in the UK over whether political parties and candidates should be allowed to accept contributions in digital assets, given potential conflicts of interest. The UK government has reportedly been considering a ban on such contributions as part of an Elections Bill.
At the Bitcoin 2025 conference last year, UK Reform leader Nigel Farage said that the party would begin accepting donations in crypto. Early crypto investor Christopher Harborne sent a combined $16 million to Reform through donations in 2025.
Magazine: The debate over Bitcoin’s four-year cycle is over: Benjamin Cowen
Bitcoin’s (BTC) recent recovery above $71,000 suggests that the price bottom is officially in, and bullish momentum can be seen across the crypto market. TOTAL2, which tracks the market cap of all crypto assets excluding Bitcoin, has held support at its 200-week moving average, but is an altcoin season in the making?
The divergence between Bitcoin’s rally and the muted altcoin price action is beginning to draw attention to altseason indicators, raising the question of whether the broader market may soon follow BTC’s lead.
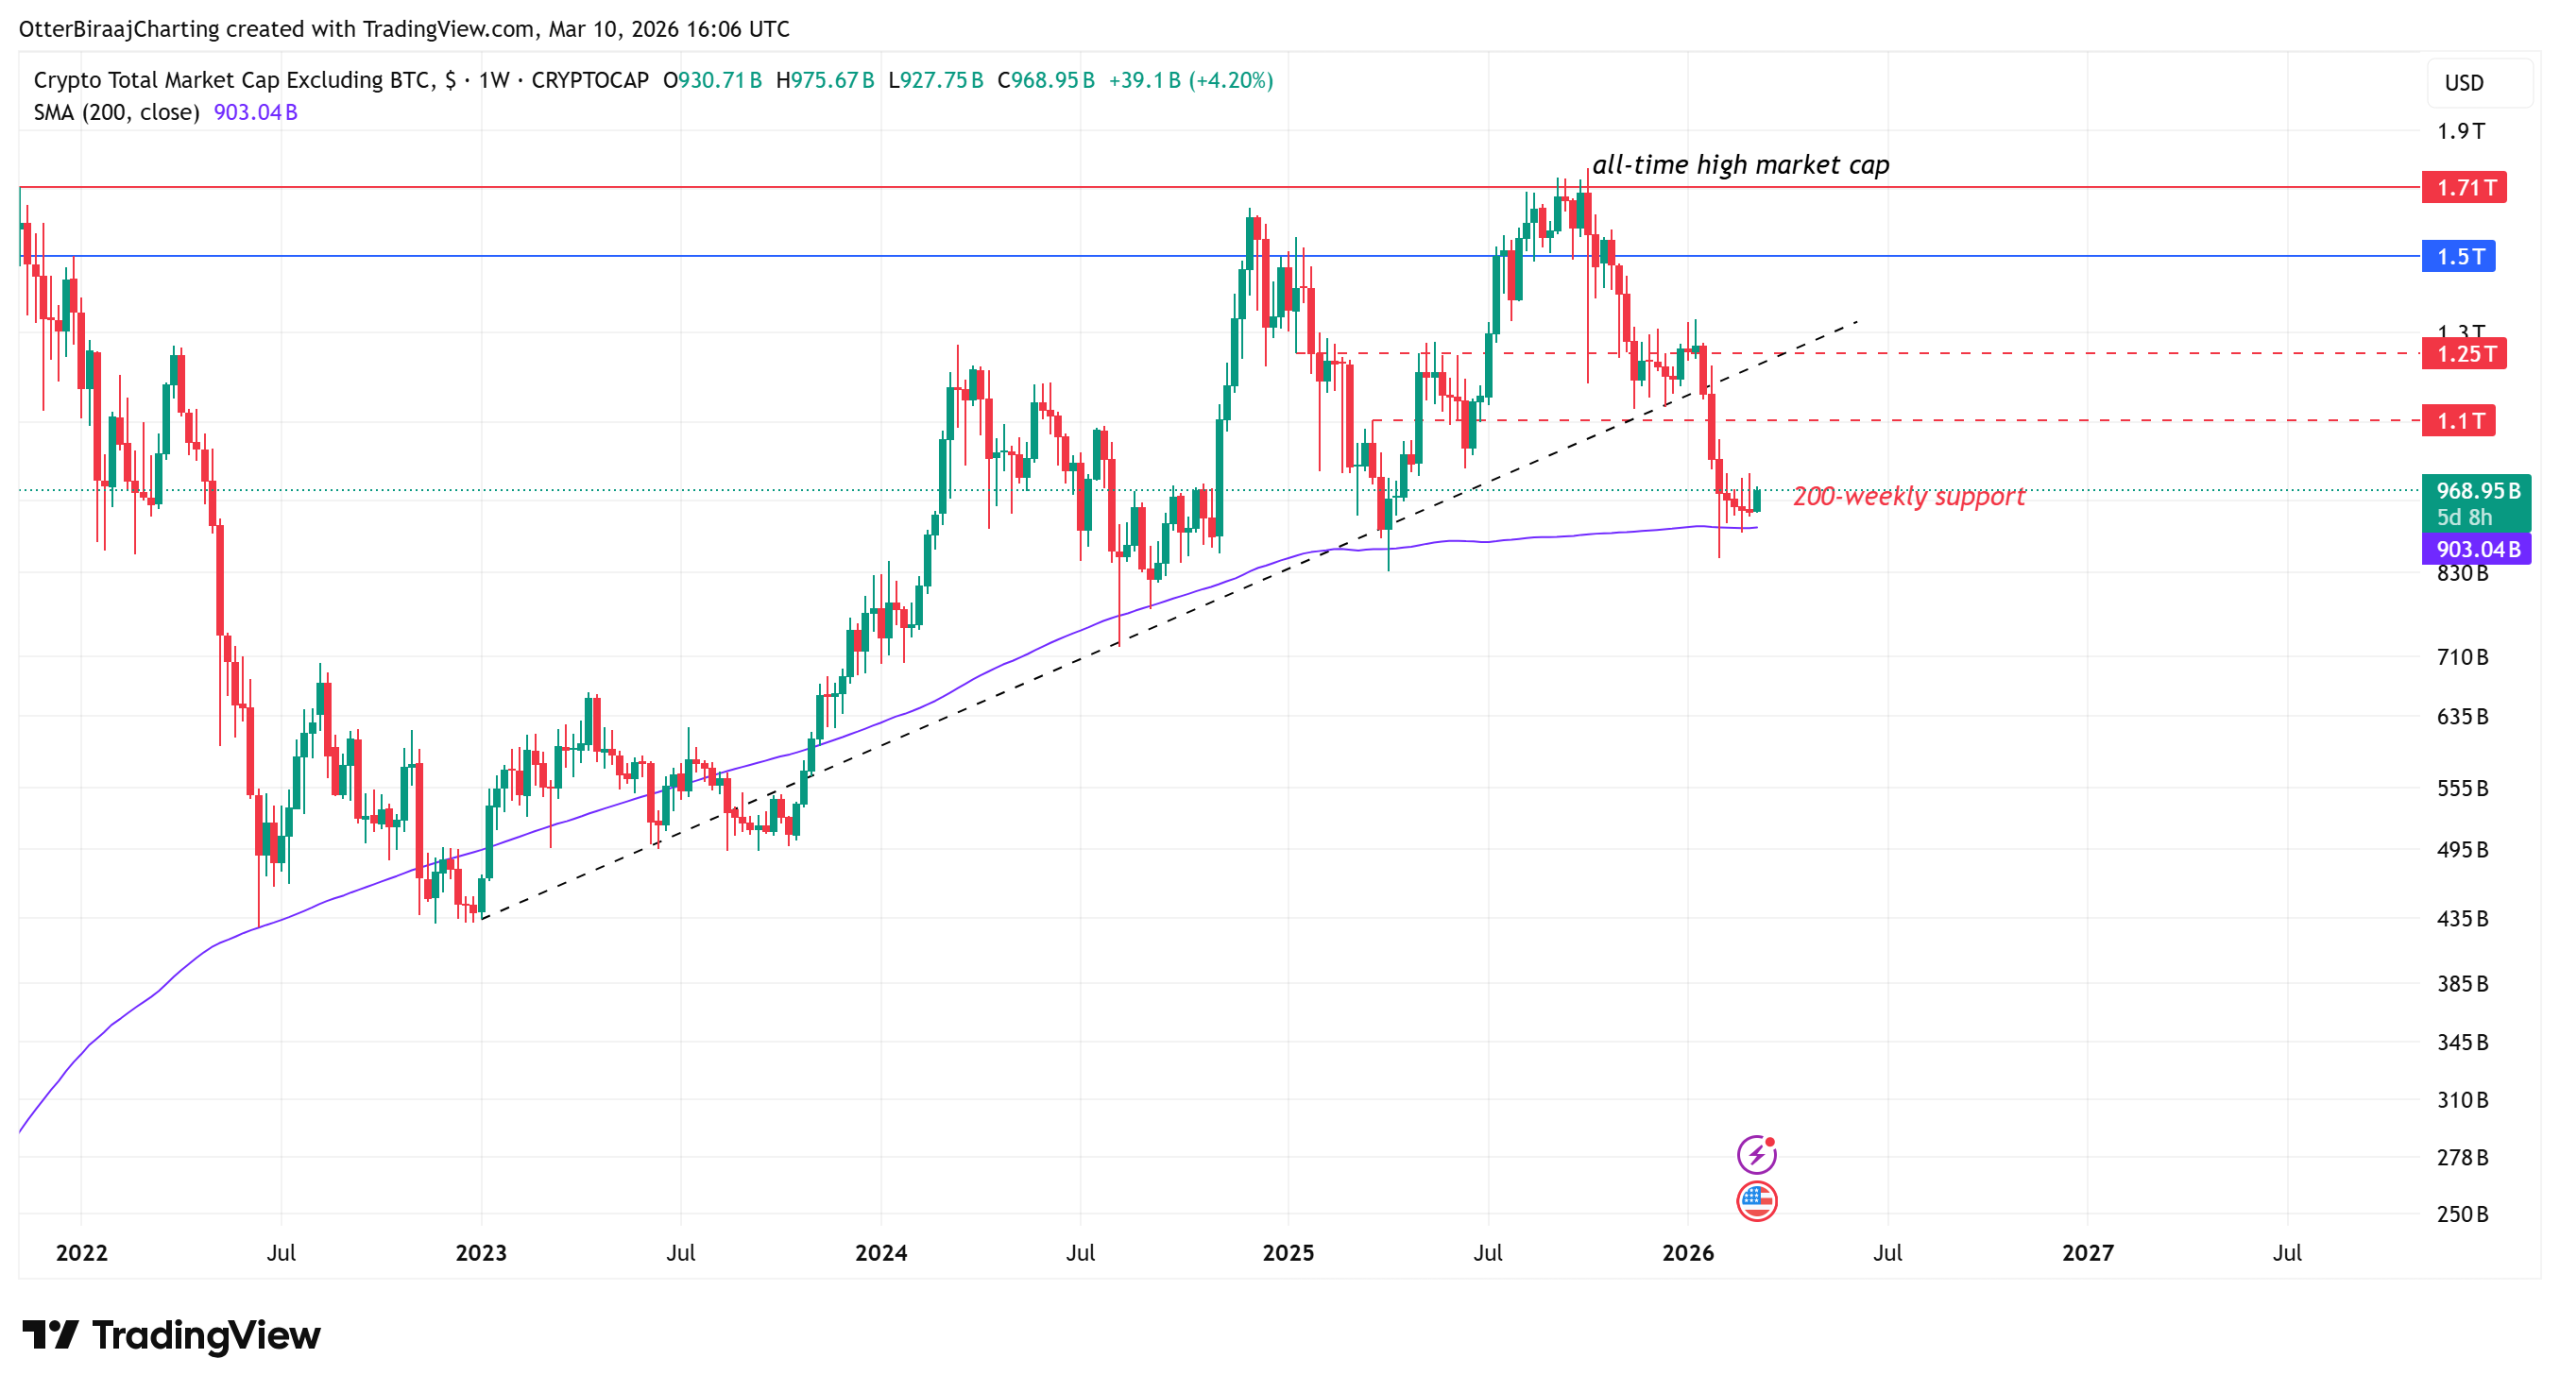
TOTAL2 tests long-term support just below $1 trillion
The TOTAL2 market cap peaked near $1.7 trillion in October 2025 but currently sits at $970 billion, a drawdown of roughly 43%. The decline accelerated in January after the market cap broke a three-year ascending trendline near $1.15 trillion.
Market attention has now shifted to the higher-timeframe support. On the weekly chart, the TOTAL2 market cap trades close to its 200-week moving average near $900 billion, a level that held during market corrections in September 2024 and April 2025.

The daily chart shows consolidation beneath the former trendline and the $1.1 trillion to $1.25 trillion resistance band, a zone that previously held large liquidity clusters.
The altcoin positioning metrics align with the drop in TOTAL2. CryptoQuant data highlighted that 36.8% of altcoins are trading near their historical lows, excluding Bitcoin, Ether (ETH), and stablecoins.

These elevated readings appear when capital concentrates in larger assets. XWIN Research said that spot Bitcoin ETF inflows and the growing number of tokens have intensified competition for liquidity across smaller assets over the past year.
Related: Hyperliquid’s HYPE price will hit $150 by August, predicts Arthur Hayes
Average altcoin performances near cycle lows
Data from CryptoQuant outlined how deeply altcoins have underperformed Bitcoin. The average altcoin trades 44.4% below its 200-day simple moving average (SMA), a level historically seen near bear-phase bottoms.

The exchange data shows similar weakness. Only 4.59% of Binance-listed altcoins trade above their 200-day SMA, confirming a strong Bitcoin-led phase.
The altcoin expansion typically begins with Ether’s (ETH) leadership. The ETH/BTC pair has not established an uptrend and continues to trade inside a descending channel on the weekly chart.
A move above 0.036 may mark the first break of the channel’s local resistance and signal improving relative strength for ETH. A stronger shift in capital rotation could emerge if the pair reclaims 0.043, a level that previously acted as resistance before the broader decline in 2025.

Until these levels are reclaimed, Bitcoin-led momentum continues to dominate the recovering crypto market.
Market analysts are also debating whether the next altcoin cycle will resemble past rallies. Bitwise Chief Investment Officer Matt Hougan recently said that future altcoin seasons may not lift the entire market equally, arguing that the capital will most likely be concentrated in projects with stronger adoption and real-world applications.
Related: Bitcoin vs gold: ETF flows point to early capital rotation signs
This article does not contain investment advice or recommendations. Every investment and trading move involves risk, and readers should conduct their own research when making a decision. While we strive to provide accurate and timely information, Cointelegraph does not guarantee the accuracy, completeness, or reliability of any information in this article. This article may contain forward-looking statements that are subject to risks and uncertainties. Cointelegraph will not be liable for any loss or damage arising from your reliance on this information.

Paul Atkins, chair of the US Securities and Exchange Commission (SEC), said that an agreement with the Commodity Futures Trading Commission (CFTC) would lead to a new level of “coordination and collaboration,” including on enforcement.
In a Tuesday speech for the FIA Global Cleared Markets Conference in Florida, Atkins said that the SEC and CFTC were considering an updated memorandum of understanding on coordination between the two federal regulators. The SEC chair did not explicitly mention oversight of digital assets, but said “the regrettable era of duplicative enforcement actions and conflicting remedial obligations for the same conduct is over.”
“Conduct in a single operating environment means that the SEC and CFTC, within the bounds of their independent statutory authority and regulatory interests, should coordinate legal theories and remedial strategies,” said Atkins. “Fragmented, redundant enforcement does not increase deterrence—it only increases confusion.”
Atkins’s remarks followed similar statements from CFTC Chair Michael Selig striking a cooperative tone as US lawmakers worked to pass a comprehensive market structure bill expected to give the CFTC more authority in overseeing crypto. The bill, passed as the CLARITY Act in the US House of Representatives in July, has effectively been stalled in the Senate amid discussions on stablecoin yield, tokenized equities, and conflicts of interest.
Related: CFTC chair backs blockchain-based prediction markets as ‘truth machines’
The SEC, which oversees securities, and the CFTC, overseeing commodities, have sometimes overlapped in regulating cryptocurrencies that, according to many experts, do not clearly fall into a single agency’s purview. The SEC chair said the agency’s staff would be conducting joint meetings with CFTC officials on product applications, and launched a harmonization website for the two regulators.
“Firms should not be shuffled back and forth between regulators when a product touches elements of both regulatory frameworks,” said Atkins. “Nor should clarity depend on which agency happens to speak first. Where jurisdiction overlaps, the most effective response is a coordinated one.”
Leadership slots vacant after no nominations from Trump
As of Tuesday, the CFTC’s leadership consisted solely of Selig, whom the Senate confirmed in December. He replaced acting chair Caroline Pham, but remains the sole Republican-appointed commissioner in a leadership panel normally consisting of a bipartisan group of five people. Similarly, the SEC is being led by three Republican commissioners.
US President Donald Trump had not made any public statement as of Tuesday signaling that he plans to nominate additional commissioners to either agency.
Magazine: Clarity Act risks repeat of Europe’s mistakes, crypto lawyer warns
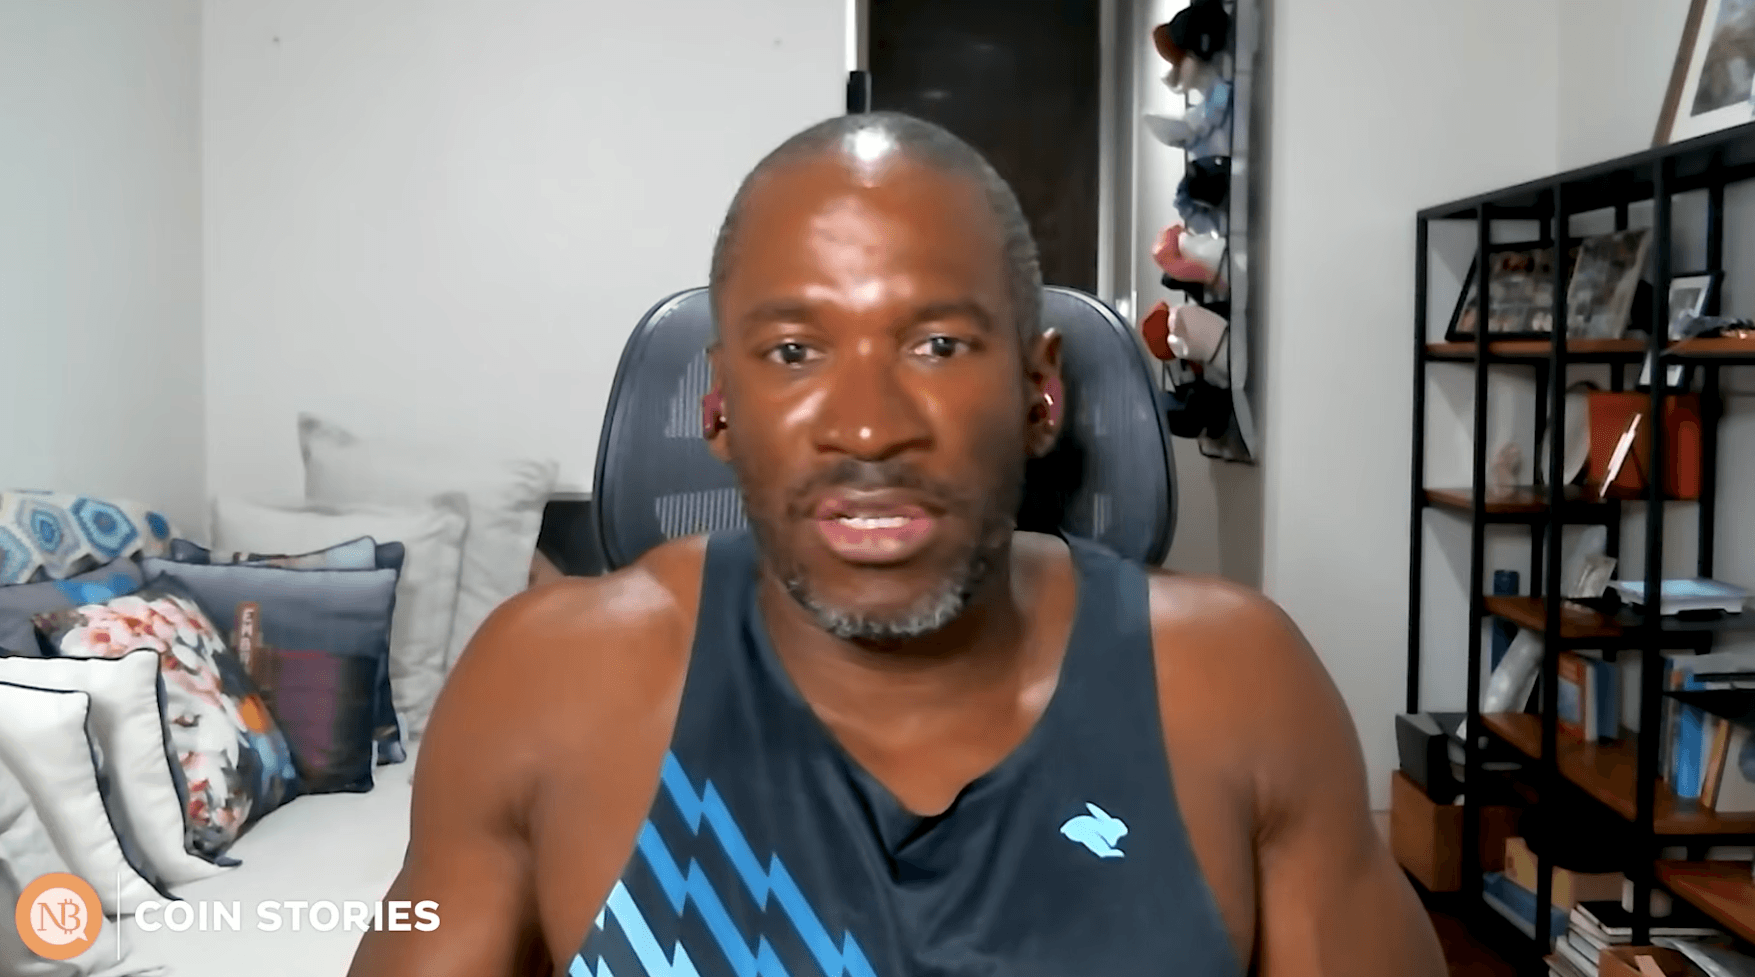
BitMEX co-founder Arthur Hayes, who has projected Bitcoin to hit $250,000 this year, says he’d rather wait-and-see than invest in Bitcoin at the moment, holding off until the US Federal Reserve loosens its monetary policy.
“If I had $1 to invest right now, would I be putting it into Bitcoin? No. I would wait,” Hayes said on the Coin Stories podcast published to YouTube on Tuesday.
“The longer this conflict goes on, the higher the likelihood that the Fed has to print money to support the American war machine,” he said. Hayes said he will start buying when the Fed begins easing monetary policy:
“That’s when I’m going to buy Bitcoin when the central banks start printing money.”
Hayes said that while some argue “war is good for Bitcoin,” the more accurate view is that “money printing is good for Bitcoin.”
Hayes added he was unsure whether Bitcoin had reached its price bottom. Bitcoin is trading at $69,926 at the time of publication, down 45% from its October all-time high of $126,000, but Hayes warned that ongoing geopolitical tensions could push the price lower.

“[With] the unfortunate war between US and Iran, I think that there is a situation where the longer that this carries on, there could be a massive sell-off in equities and Bitcoin,” he said.
Hayes predicted $250,000 Bitcoin for 2026
Hayes explained that this may lead Bitcoin to fall below $60,000 and that “could be sort of a big cascading of liquidations down.” Bitcoin briefly touched the $60,000 level on Feb. 6 before edging into a mild uptrend.
Hayes usually shares strong convictions about Bitcoin and had held onto his $250,000 year-end prediction as late as October last year.
Related: Bitcoin leads, altcoin indicators drop to intriguing lows: Time for an altseason?
Other analysts are more confident about what will happen in the short term. Michaël van de Poppe recently pointed out the benefits for Bitcoin on the back of a “strong surge” in the Nasdaq.
“There are not many arguments left for uncertainty, and in that principle, I do think we’ll see way more upside into Bitcoin & Altcoins during the coming period,” van de Poppe said.
Meanwhile, Hayes said he doesn’t anticipate there being many more years when Bitcoin will be “sub 100,000.”
Magazine: The debate over Bitcoin’s four-year cycle is over: Benjamin Cowen
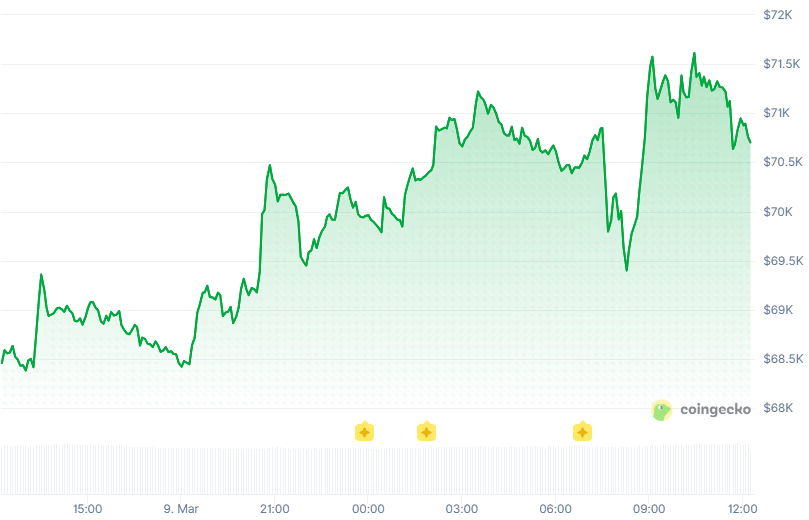
Total crypto capitalization is up another 3% to $2.49 trillion.
Crypto markets rallied for a second day as fears of an oil supply shock eased after the International Energy Agency (IEA) convened an emergency meeting to discuss the potential release of emergency reserves.
Bitcoin (BTC) is trading at around $70,700, up 3.5% over the past 24 hours. The world’s largest cryptocurrency reached as high as $71,800 earlier in the day. Meanwhile, ETH climbed 2.5% to $2,070, SOL gained 4% to $88, and XRP is up 3.6% on the day.

The overall crypto market capitalization climbed 3% to $2.49 trillion, according to Coingecko.
Crude oil (WTI) briefly fell below $80 per barrel but has since erased its losses to trade around $84. The S&P 500 and the Nasdaq posted minor gains while gold and silver were mostly unchanged.
Almost all of the Top 100 digital assets posted gains over the last 24 hours.
Today’s top gainers are RENDER, which rallied 10%, followed by Bittensor (TAO) and SKY, which climbed 7%.
Memecore (M) and Midnight (NIGHT) are the biggest losers
Around 96,000 leveraged traders were liquidated for $377 million in the past 24 hours, according to CoinGlass. Bitcoin accounted for $138 million, while ETH positions made up $73 million.
Bitcoin exchange-traded funds (ETFs) recorded inflows of $167 million on Friday, according to SoSoValue, snapping a two-day losing streak.


The crypto market is showing early signs of stabilization after months of heavy selling, though the outlook remains uncertain.
Summary
- Crypto market losses are easing as Bitcoin realized losses narrow from February capitulation levels.
- Short-term holders now control about 22% of BTC supply, indicating active participation.
- Macro pressures and liquidity conditions may keep Bitcoin trading volatile in the near term.
With daily trading volume of about $121 billion, the global crypto market capitalization is close to $2.51 trillion, up roughly 2.5% over the previous day. Bitcoin (BTC) holds roughly 57% of the market, while Ethereum (ETH) accounts for about 10%.
Investor sentiment remains weak. The Crypto Fear & Greed Index has stayed in extreme fear, with readings between 14 and 19 in early March. Such levels often appear when markets are under pressure but can also precede sharp swings.
Bitcoin has just climbed above $71,000, helping push the market slightly higher. Some altcoins moved strongly as well. Flow posted gains of more than 36%. Even with the rebound, Bitcoin still trades about 42% below its all-time high.
Market losses begin to ease
A March 10 report from CryptoQuant analyst Darkfost shows that realized losses in the Bitcoin market are starting to slow after a period of capitulation.
Recent data shows $611 million in realized losses compared with $346 million in realized profit, leaving the market with a net weekly loss of about $264 million. Losses still dominate trading, but the gap has narrowed.
The situation looked very different a month ago. On Feb. 7, weekly losses were close to $2 billion as Bitcoin briefly fell below $60,000.
Short-term holders remain the most active participants. Their share of the Bitcoin supply has grown to about 22%, compared with 12% in early 2023. That increase suggests newer investors are still entering the market despite recent volatility.
Some signs of consolidation are also appearing. Analysts say investors have started holding or accumulating again as prices stabilize.
On Binance futures markets, Bitcoin trading volume has also moved ahead of altcoin volume. Similar shifts in the past often appeared near broader market bottoms.
Macro pressure still clouds outlook
The short-term outlook remains mixed. Liquidity in global markets is tightening, the U.S. dollar has strengthened, and bond yields are rising. These factors often weigh on risk assets, including crypto.
Because of that, Bitcoin may continue trading in a $60,000 to $70,000 range for now. Following the recent surge, short-term indicators have also moved higher, which may encourage profit-taking.
Future economic data could increase volatility. CPI reports and other inflation statistics may have an impact on interest rate expectations.
Despite the decline, some investors continue to see value. Pantera Capital’s Dan Morehead recently pointed out that cryptocurrency prices are significantly below long-term trend levels.
Other institutions share cautious optimism. Coinbase Institutional has pointed to improving regulation and deeper financial integration as supportive factors, while analysts at Bybit say options markets still price a small chance of Bitcoin reaching $150,000 this year.
For now, the market appears to be moving away from the most intense phase of selling. Whether the recovery continues will depend on Bitcoin’s ability to hold momentum in the weeks ahead.


The foundation behind Solana liquid staking protocol Jito acquired SolanaFloor just two weeks after the media outlet announced it was shutting down.
The Jito Foundation has acquired SolanaFloor, a media outlet focused on the Solana ecosystem.
SolanaFloor reported the acquisition and that it’s resuming operations today, March 10, just over two weeks after the media outlet announced it was shutting down, “effective immediately.”
Jito Foundation develops Jito, the second-largest liquid staking protocol on Solana, per DefiLlama data. Jito Liquid Staking boasts a total value locked of $1.1 billion.
Per the announcement, SolanaFloor will retain editorial independence after the acquisition, clarifying that its “mission and editorial processes will remain unchanged under Jito Foundation’s stewardship.”
On the foundation’s motivations for the deal, Brian Smith, president of Jito Foundation, reiterated the foundation’s commitment to SolanaFloor’s editorial independence, explaining:
“Jito has a long-term stake in the health of the Solana ecosystem, and that means investing in the infrastructure and public goods that keeps the community informed.”
Second Acquisition
SolanaFloor was originally launched in 2021 with a focus on NFT analytics. The company was acquired by now defunct Solana DeFi portfolio management app Step Finance in 2022. SolanaFloor pivoted to become a Solana-focused news media outlet soon after, as the peak NFT frenzy and interest in the sector continued to wane.
Step Finanace suffered a major exploit in late January that resulted in the loss of nearly $30 million in SOL. Soon after, it announced that the platform was shutting down operations, along with the two companies it had acquired, SolanaFloor and Remora Markets.
Solana currently has a TVL of over $8 billion, down from nearly $14.5 billion in September, per DefiLlama.
The acquisition marks an important moment for crypto media, which has seen multiple outlets shutter their newsrooms in recent months.
This article was generated with the assistance of AI workflows.


Circle has launched Nanopayments on testnet, offering developers a new infrastructure layer for ultra-small, gas-free USDC transactions.
The product is built on Circle Gateway and designed to serve the emerging agentic economy, where AI agents and autonomous software need to make rapid, sub-cent payments for services such as pay-per-call APIs, usage-based billing, and machine-to-machine marketplaces.
The core challenge Nanopayments aims to solve is an economic one. Traditional payment rails carry fixed fees and overhead that make sub-cent transactions impractical, while even low-cost blockchain transactions can impose fees that dwarf the payment itself.
Circle’s approach sidesteps this by aggregating transactions off-chain and settling them on-chain in batches, effectively reducing the per-transaction gas cost to zero for developers, with Circle absorbing the settlement costs at the batch layer.
The system follows the x402 open standard, allowing any agent to pay any merchant without creating an account or adding a credit card. When an agent initiates a payment, it signs an authorization that’s validated by the Nanopayments API, the merchant gets instant confirmation, and actual on-chain settlement happens periodically in the background.
In a blog post, Circle highlighted an early proof of concept in which an autonomous robot dog used Nanopayments to pay for its own recharging in USDC, a glimpse at what fully autonomous economic actors might look like.
The testnet supports multiple blockchains, including Arbitrum, Base, Ethereum, Optimism, Polygon, and Sonic.
The launch comes amid explosive growth in the stablecoin sector, whose market capitalization now exceeds $314 billion, up 37% from $228 billion a year ago, according to DeFiLlama.
Circle’s USDC is the second-largest stablecoin with nearly $79 billion in circulation, according to Coingecko.
The company has been steadily building out its platform beyond USDC issuance. In spring 2025, it launched the Circle Payments Network, a platform for real-time, low-cost cross-border payments using stablecoins. It later unveiled Gateway, a chain abstraction tool that lets USDC holders access a unified balance across supported blockchains, and introduced Arc, a Layer-1 blockchain purpose-built for USDC transactions.


Starknet is returning privacy to the center of blockchain development as new tools attempt to balance confidentiality with regulatory oversight.
Summary
- Starknet introduced STRK20, adding private balances and transfers to ERC-20 tokens.
- The system allows selective disclosure for regulators, auditors, or compliance checks.
- The technology could enable private DeFi activity for assets like Bitcoin, ETH, and stablecoins.
On March 10, Starknet announced STRK20, a new privacy capability designed to give ERC‑20 tokens confidential balances and private transfers while keeping the option for regulatory disclosure when required.
The feature allows developers to deploy tokens on Starknet (STRK) with built-in privacy controls. Users can shield assets, hold balances privately, and transfer tokens without revealing transaction details on public block explorers.
At the same time, records can still be disclosed to auditors, regulators, or accountants if legally necessary.
Private balances and transfers for tokens
Blockchains such as Bitcoin and Ethereum operate with full transparency, meaning wallet balances and transactions can usually be viewed by anyone. While this design improves auditability, it can also limit institutional participation and certain financial use cases.
STRK20 attempts to address that issue. The system introduces what Starknet calls transaction-layer privacy, where asset ownership can remain hidden while the execution of transactions still occurs on a public network.
Once deployed, users can shield tokens into a private state, transfer them confidentially, or return them to a public state when needed. These functions remain tied to the same asset and liquidity pools, which avoids splitting tokens into separate public and private versions.
The first integrations are already planned within the Starknet ecosystem. Privacy-enabled swaps are expected to be available on Ekubo Protocol, while private staking options are also being explored for assets including Bitcoin and the Starknet token.
Privacy with compliance controls
The project also focuses on regulatory compatibility, an area that has historically limited privacy tools in crypto.
Instead of fully anonymous systems, STRK20 allows selective disclosure. Transaction details can be revealed to approved parties such as regulators or auditors when required. This approach attempts to give institutions privacy in daily activity while maintaining an audit trail for compliance purposes.
Starknet has already been experimenting with privacy-focused Bitcoin use cases. Earlier this year, the network introduced strkBTC, which allows optional shielding for Bitcoin balances while still enabling participation in decentralized finance applications.
Interest in privacy tools is growing in the crypto world. Every year, trillions of dollars move on public blockchains, but anyone can see transaction details and wallet balances.
Privacy tokens could let people pay, trade, and lend without exposing their financial activity. Starknet says this could make blockchain easier to use while still maintaining compliance.
Ravens fans rip into GM Eric DeCosta over Maxx Crosby disaster

Office.eu and the hope for a digitally sovereign Europe
How driverless vehicles can be made safer for deaf and hard of hearing people


-
Business5 days ago
Form 8K Entergy Mississippi LLC For: 6 March
-

 News Videos2 days ago
10th Algebra | Financial Planning | Question Bank Solution | Board Exam 2026
-

 Tech6 days ago
Bitwarden adds support for passkey login on Windows 11
-

 Fashion4 days ago
Weekend Open Thread: Ann Taylor
-

 Crypto World1 day ago
Paradigm, a16z, Winklevoss Capital, Balaji Srinivasan among investors in ZODL
-
 Sports5 days ago
499 runs and 34 sixes later, India beat England to enter T20 World Cup final | Cricket News
-

 Sports3 days ago
Three share 2-shot lead entering final round in Hong Kong
-

 Sports3 days ago
Braveheart Lakshya downs Lai in epic battle to enter All England Open final | Other Sports News
-

 Politics5 days ago
Top Mamdani aide takes progressive project to the UK
-

 Business11 hours ago
ExxonMobil seeks to move corporate registration from New Jersey to Texas
-

 NewsBeat5 days ago
Piccadilly Circus just unveiled ‘London’s newest tourist attraction’ and it only costs 80p to enter
-

 Entertainment4 days ago
Hailey Bieber Poses For Sexy Selfies In New Luscious Lip Thirst Traps
-

 Business2 days ago
Search for Nancy Guthrie Enters 37th Day as FBI Probes Wi-Fi Jammer Theory
-
 NewsBeat1 day ago
Pagazzi Lighting enters administration as 70 jobs lost and 11 stores close across Scotland
-

 Tech2 days ago
Despite challenges, Ireland sixth in EU for board gender diversity
-
Entertainment6 days ago
Harry Styles Has ‘Struggled’ to Discuss Liam Payne’s Death
-

 Crypto World6 days ago
New Crypto Mutuum Finance (MUTM) Reports V1 Protocol Progress as Roadmap Enters Phase 3
-

 Tech6 days ago
ACIP To Discuss COVID ‘Vaccine Injuries’ Next Month, Despite That Not Being In Its Purview
-

 Business1 day ago
Search Enters 39th Day with FBI Tip Line Developments and No Major Breakthroughs
-
 NewsBeat6 days ago
Good Morning Britain fans delighted as Welsh presenter returns to host ITV show