Crypto World
Meta Analysis: Breakout Holds, but Unusual Volume Leaves the Move in Question

Meta announced on 26 August that it had reached an agreement with a bipartisan group comprising 52 state and territorial attorneys general, together with the Attorney General of the District of Columbia. Under the terms of the agreement, the company is expected to pay approximately $18 billion over ten years and introduce tighter protections for underage users of Facebook and Instagram. These measures include a two-hour daily usage cap and an overnight restriction blocking access to the apps between midnight and 6:00 am.
Of the total amount, around $5.3 billion would only become payable if TikTok and YouTube adopt comparable measures and make equivalent payments. Meta also anticipates recording roughly $10 billion in legal expenses during Q3 2026 as a result of the agreement.
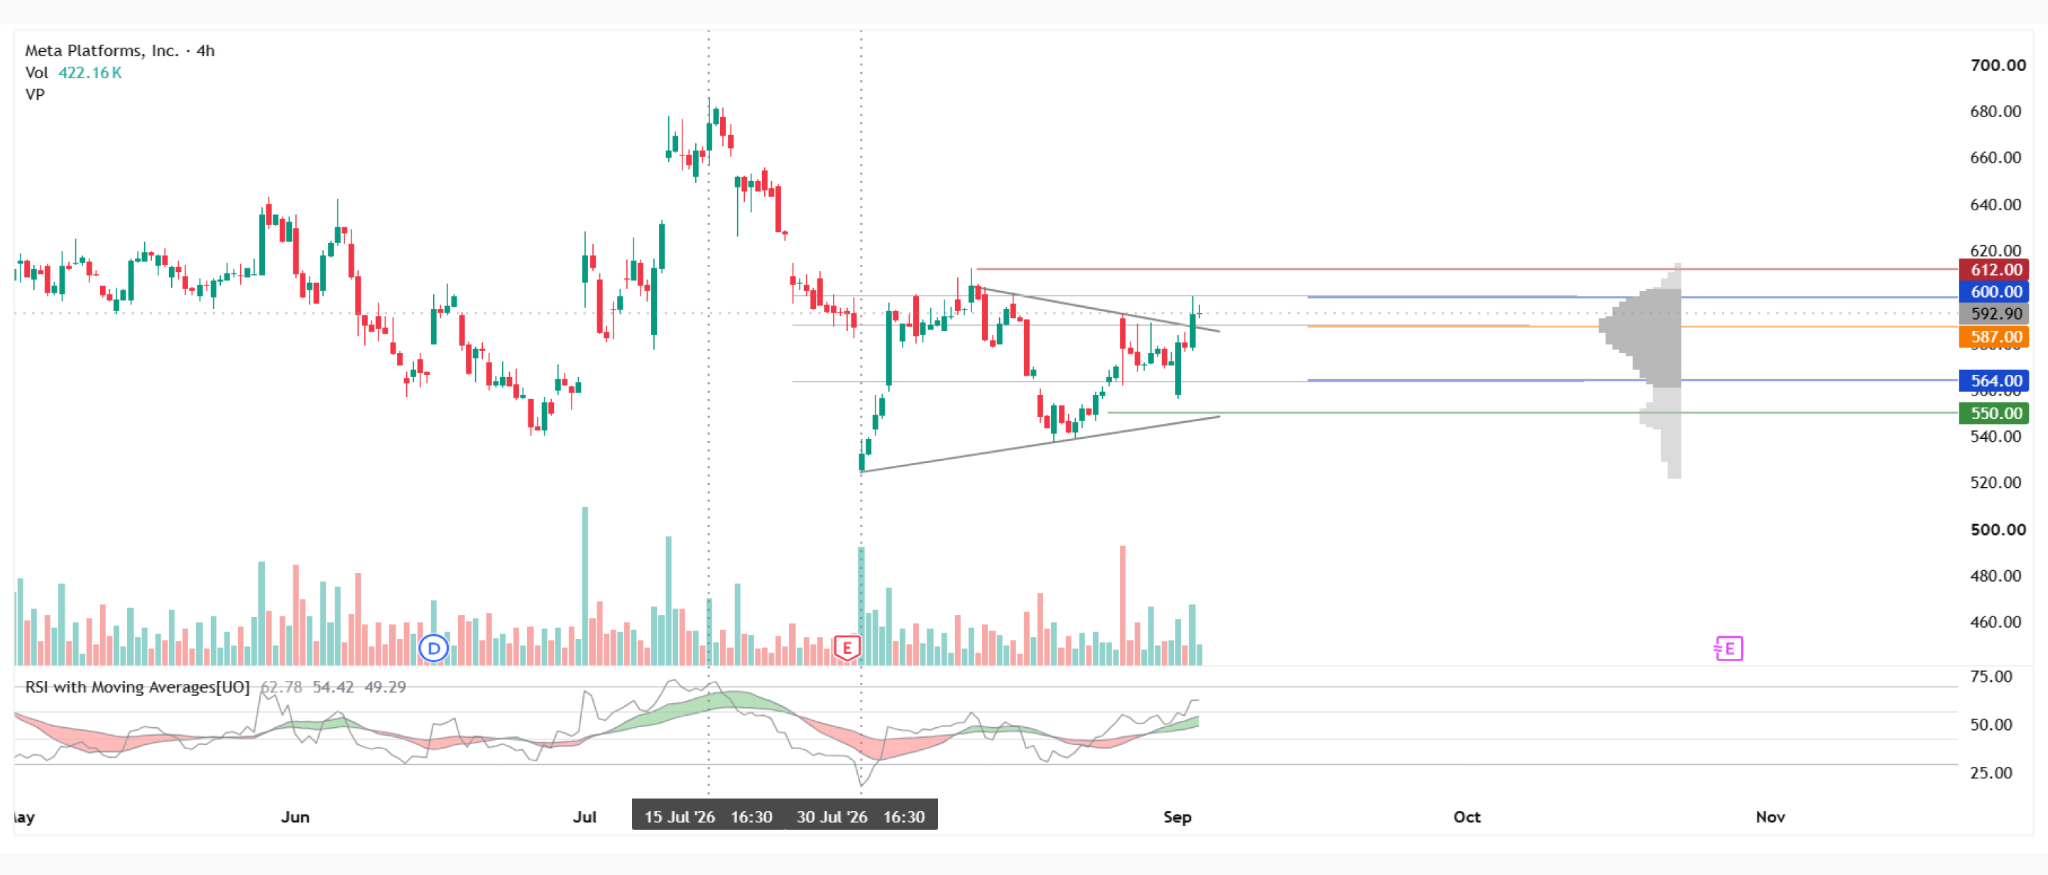

On the four-hour META chart, the medium-term structure remains broadly range-bound, with price continuing to fluctuate between the 690 and 540 areas. During the decline from 15 to 30 July, a converging triangle-like formation developed close to the lower portion of the broader range. Its boundaries gradually contracted as the amplitude of price movements narrowed.
However, the volume profile accompanying the formation is not particularly characteristic of this type of consolidation. This unusual volume behaviour raises some doubt over the reliability of the pattern and whether the subsequent move should be interpreted as a fully confirmed technical breakout.
Following the move above the upper boundary, Meta remains inside the current market profile and is now trading in the relatively narrow zone between the Point of Control (POC) at $587.00 and the profile’s upper boundary at $600.00. Price is effectively attempting to hold above the former pattern.
The next red resistance area sits near $612.00, only a short distance above the profile ceiling. Conversely, a return into the previous structure would become more concerning if price establishes itself below the profile’s lower boundary at $564.00. In that scenario, attention could shift towards the green support around $550.00, which is also positioned relatively close to the profile.
The RSI + MAs indicator currently reads 62, 54 and 49. The oscillator has moved above the neutral area, while the moving averages remain around the neutral zone. As a result, the technical picture has improved, but there is not yet enough confirmation to treat the breakout as firmly established.
Key Takeaways
Meta has managed to remain above the converging structure, but the unusual volume behaviour during the pattern’s development weakens the conviction behind the move. The RSI + MAs readings are also not sufficiently aligned to confirm a decisive change in momentum.
The outlook therefore remains dependent on whether price can sustain itself above the current structure and move through the $600.00–$612.00 area. A failure to hold the breakout zone, particularly a move below $564.00, would increase the risk of a return towards $550.00.
The legal settlement also adds a separate layer of uncertainty, as part of the financial commitment remains conditional on whether Meta’s competitors adopt comparable measures. This leaves both the technical breakout and the broader fundamental backdrop subject to further confirmation.
This article represents the opinion of the Companies operating under the FXOpen brand only. It is not to be construed as an offer, solicitation, or recommendation with respect to products and services provided by the Companies operating under the FXOpen brand, nor is it to be considered financial advice.
You must be logged in to post a comment Login