Crypto World
Meta Analysis: Price Attempts to Hold Above the Pattern Amid Mixed Volume Signals

On 26 August, Meta announced an agreement with a bipartisan group of 52 state and territorial attorneys general and the Attorney General of the District of Columbia. Under the agreement, the company will pay around $18 billion over ten years and introduce additional restrictions for underage Facebook and Instagram users, including a two-hour daily usage limit and an overnight app block from midnight to 6:00 am. Around $5.3 billion of this amount will only be payable if TikTok and YouTube implement similar measures and each pay a corresponding amount. Meta also expects to recognise around $10 billion in legal expenses in Q3 2026 in connection with the agreement.
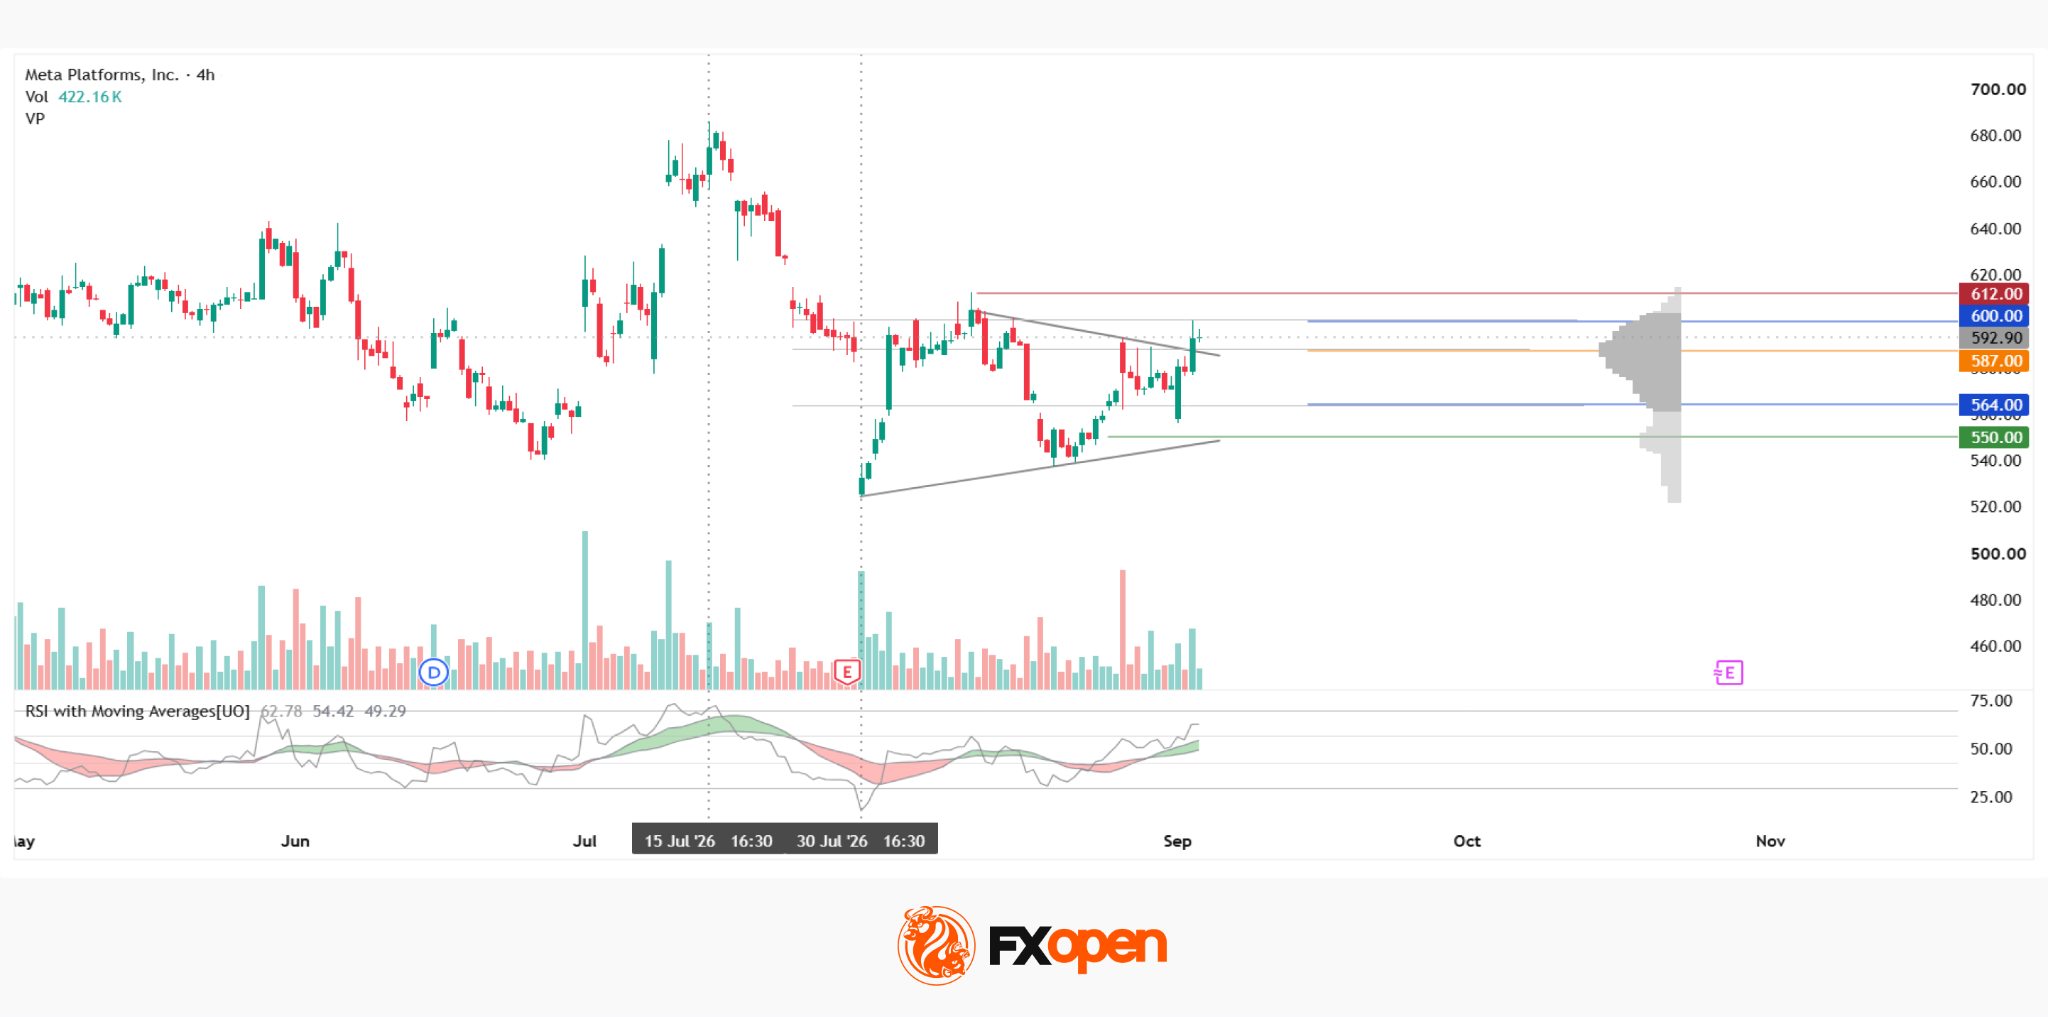

On the four-hour META chart, the medium-term picture remains range-bound, with the price continuing to move within a broad range between the 690 and 540 areas. Within this range, a short-term decline occurred between 15 and 30 July, during which a pattern resembling a converging triangle formed near the lower end of the move. The pattern’s boundaries progressively narrowed the amplitude of price fluctuations. However, the vertical volume profile throughout the pattern’s formation does not appear typical of this type of consolidation, raising questions about the technical integrity of the structure.
After breaking above the pattern’s upper boundary, the price remains within the current market profile and is now squeezed between the Point of Control (POC) at $587.00 and the upper boundary of the profile at $600.00, attempting to establish itself above the pattern. Red resistance is located around $612.00 and is relatively close to the profile. If the price returns to the pattern’s range and establishes itself below the lower boundary of the profile at $564.00, a green support level around $550.00 could come into play. This level is also relatively close to the profile.
The RSI + MAs indicator is showing readings of 62, 54 and 49. The oscillator is above the neutral zone, while the moving averages remain within the zone, meaning that it is still too early to speak of a confirmed breakout.
Key Takeaways
The atypical volume pattern within the formation, combined with the incomplete RSI + MAs signal, leaves open the question of how sustainable the price’s move above the established structure will prove to be. An additional source of uncertainty is that part of the litigation settlement remains conditional on decisions by Meta’s competitors across the industry.
Buy and sell stocks of the world’s biggest publicly-listed companies with CFDs on FXOpen’s trading platform. Open your FXOpen account now or learn more about trading share CFDs with FXOpen.
This article represents the opinion of the Companies operating under the FXOpen brand only. It is not to be construed as an offer, solicitation, or recommendation with respect to products and services provided by the Companies operating under the FXOpen brand, nor is it to be considered financial advice.
You must be logged in to post a comment Login