Crypto World
Meta: One Trendline Away From Reversing an Eight-Month Downtrend

Meta just delivered a genuinely strange quarter: revenue beat, earnings missed, and the market couldn’t quite decide how to feel about it. Q2 revenue came in at $60.8 billion, above the $60.22 billion consensus and up 28% year-over-year, yet EPS landed at $6.18 against $7.19 expected, sending shares down roughly 3.4% in the immediate aftermath.
The real story sits beneath the headline numbers. Free cash flow collapsed 91% year-over-year to just $784 million, a direct consequence of Zuckerberg’s aggressive AI buildout, with capex alone hitting $31.1 billion in the quarter as part of a planned $130-145 billion for the full year. The company is betting big on what it calls “personal superintelligence,” recently launching new Muse AI models to back that ambition, while its Family of Apps still reached 3.6 billion daily active people in June, proof the core business remains formidable.
Adding to the pressure, fresh privacy scrutiny in Europe and mounting US legal challenges around youth safety have kept sentiment cautious. With shares down roughly 11% year-to-date and trading well below their 52-week high near $796, the market is clearly still weighing whether this AI bet will pay off.
Technical Analysis of Meta Platforms

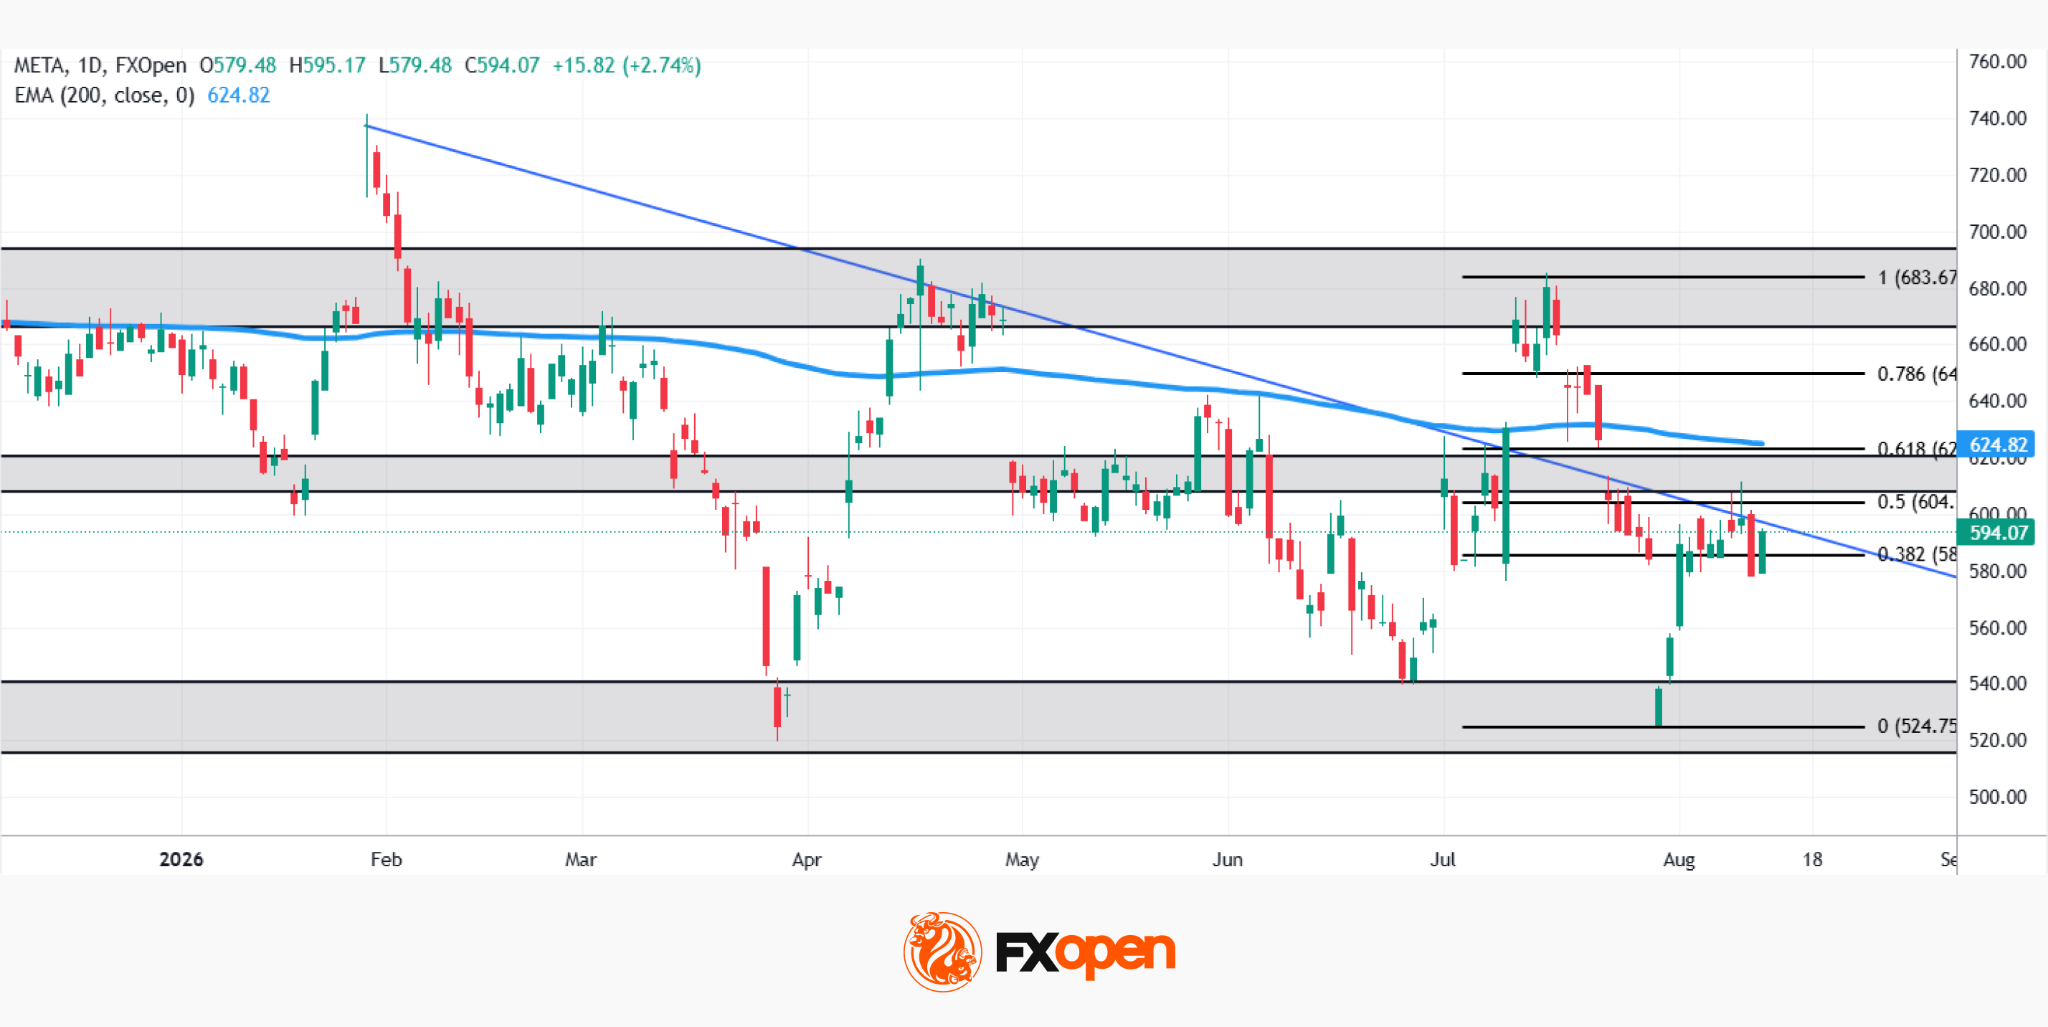
As the daily chart shows, META has been trading within a broader descending trendline since January’s highs near $740, with price recently rebounding sharply off the post-earnings low near $524.75 before running into a wall of resistance at the confluence of the 200-day EMA, the 0.618 Fibonacci retracement near $622.96, and the descending trendline itself around $600. That rejection has since pulled price back toward the 0.382 retracement near $585.46.
Bullish Scenario
Should buyers defend the 0.382 support and stage another push higher, the real test remains that same trendline-EMA-Fibonacci confluence near $605-$625. A confirmed break above this zone would be a genuinely significant technical shift, opening the path toward the 0.786 retracement near $649.66, and eventually the 1.0 level at $683.67.
Bearish Scenario
Conversely, a break below the 0.382 support at $585.46 would signal renewed weakness, exposing the 0.5 retracement near $604 as a lesser hurdle already cleared, but more importantly risking a full retest of the $524.75 low that marked the post-earnings capitulation.
With price wedged between a defended support and a stubborn multi-month trendline, META’s next move looks set to determine whether this rebound has real legs, or whether the broader downtrend since January is still very much in control.
Buy and sell stocks of the world’s biggest publicly-listed companies with CFDs on FXOpen’s trading platform. Open your FXOpen account now or learn more about trading share CFDs with FXOpen.
This article represents the opinion of the Companies operating under the FXOpen brand only. It is not to be construed as an offer, solicitation, or recommendation with respect to products and services provided by the Companies operating under the FXOpen brand, nor is it to be considered financial advice.
You must be logged in to post a comment Login