
Crypto World
Michael Saylor’s Strategy dominates DAT BTC buying as treasury demand collapses
Corporate bitcoin buying has narrowed to a single company, and the trade that was supposed to broaden the asset’s institutional base is now a concentration risk.
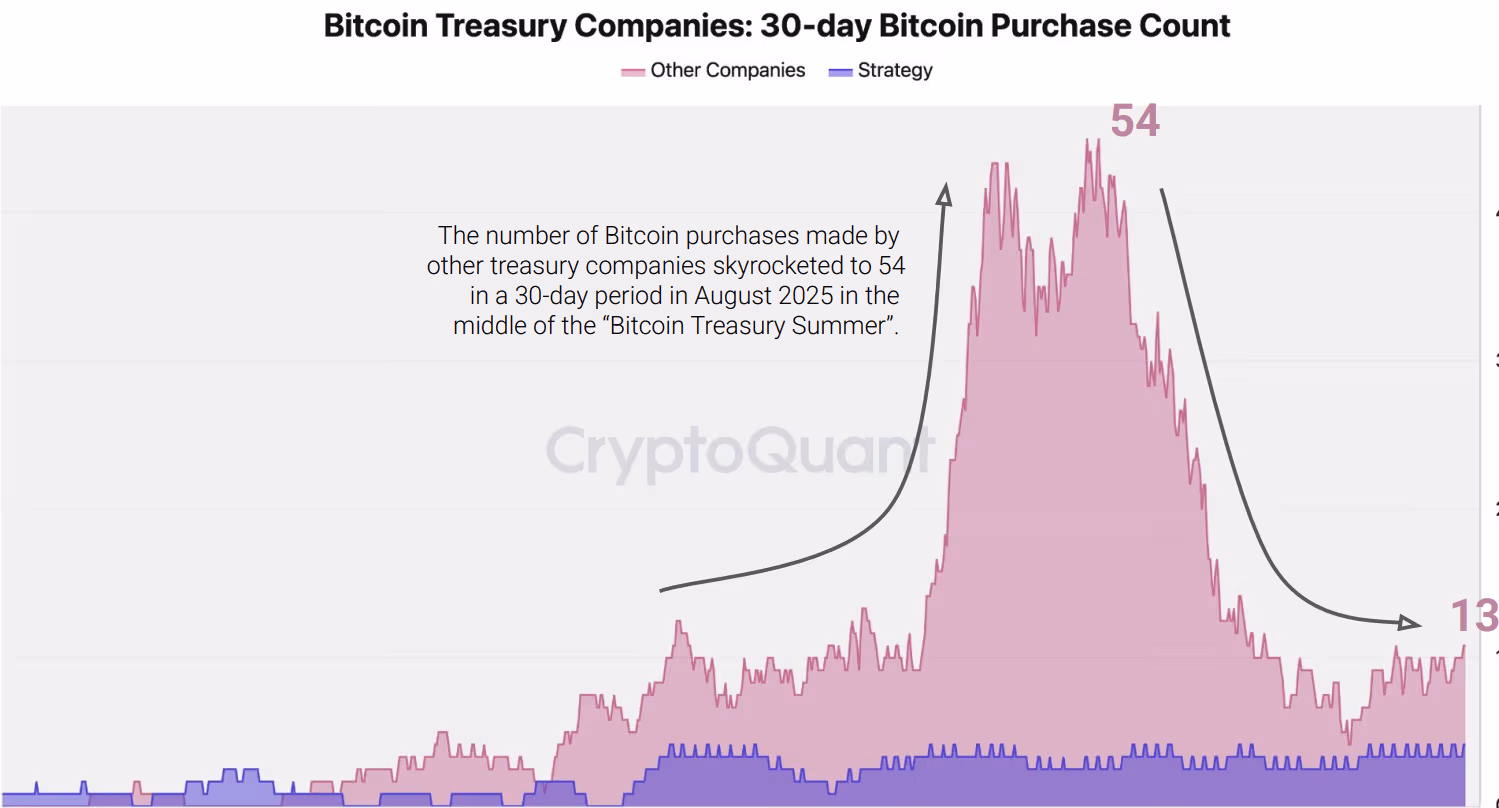
Strategy, the largest corporate bitcoin holder in the world, purchased roughly 45,000 BTC over the past 30 days, its fastest accumulation pace since April 2025, according to a CryptoQuant report published this week.

Every other treasury company combined bought approximately 1,000 BTC in the same period, a 99% decline from a peak of 69,000 BTC in August last year. Their share of total purchases has collapsed to 2%, from 95% at the height of the trade.

Michael Saylor’s Strategy now holds roughly 76% of all bitcoin held by treasury companies, according to CryptoQuant data.
The numbers confirm what Galaxy Digital warned about last summer. In a July report, Galaxy argued that the digital asset treasury company model was fundamentally a liquidity derivative that worked only as long as equities traded at a premium to their underlying bitcoin holdings.
Once those premiums compressed, the flywheel would reverse: lower prices would shrink net asset values, squeeze out the equity premium, and make share issuance dilutive rather than accretive.
That scenario has played out almost exactly as described.
In July and August of 2025, the DATCO summer when these companies were accumulating, BTC was trading north of $110,000. Now, it’s trading under $70,000, according to CoinDesk market data, as it slowly recovers from the crash of October 10.
Companies that bought aggressively near the cycle top, including Metaplanet and Nakamoto Holdings, carried average costs above $107,000 as of December, according to Galaxy’s analysis, putting them deep underwater at current prices.
Strategy has moved to insulate itself, disclosing in December a $1.44 Billion cash reserve with the goal to eventually build this up to a point to cover 24 months of dividend and interest obligations.
That defensive posture has not slowed its buying. But the CryptoQuant data makes clear that no other firm is keeping pace, and most have stopped trying.
The result is a far more concentrated demand profile than the market was promised.
At Bitcoin Asia in Hong Kong last summer, treasury firms pitched themselves as a scalable new class of corporate buyers that could absorb bitcoin supply and outperform passive exposure.
For now, that vision has narrowed to a single balance sheet.

Bitcoin (BTC) faces a new macro test as markets increasingly bet on the US entering recession in 2026.
Key points:
-
Bitcoin could face a new challenge in the form of its first recession after the COVID-19 crash.
-
US recession odds surge as BlackRock CEO Larry Fink warns over oil prices.
-
Bitcoin’s high correlation with “extremely oversold” stocks continues.
Moody’s puts 12-month recession odds near 50%
Data highlighted this week by Axel Adler Jr., a contributor to onchain analytics platform CryptoQuant, shows recession odds nearing 50%.
Bitcoin’s next bull run could come courtesy of a US economic downturn, and market participants see the latter as more and more likely this year.
“Moody’s Analytics raised the probability of a U.S. recession over the next 12 months to 48.6%, while Goldman Sachs increased its estimate to 30%,” Adler noted on X.
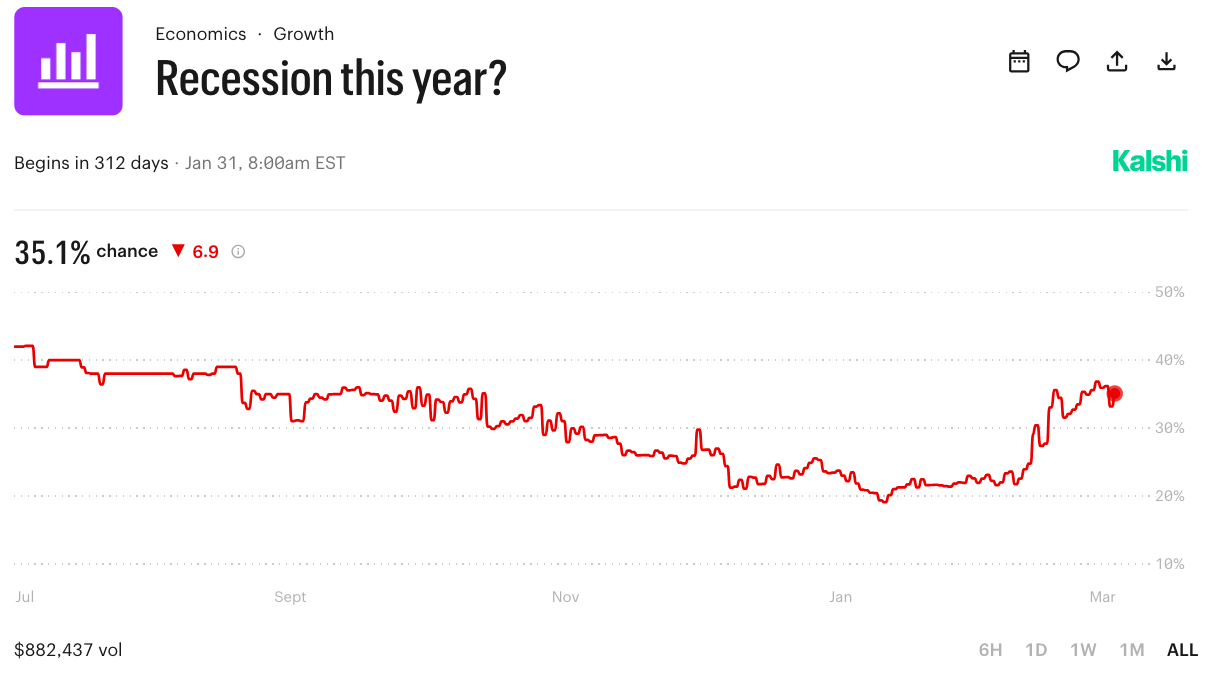
Prediction traders agree, with US recession odds reaching 36% on Kalshi — the highest reading since September 2025.

The US-Iran war and its impact on global oil prices lie at the heart of the surge. Recent claims by both sides about dialogue to end hostilities and fully reopen the Strait of Hormuz have caused confusion throughout risk-asset markets.
“That’s keeping upside pressure on oil prices, which is recently crossing a key threshold historically associated with recession,” trading resource Mosaic Asset Company commented in the latest edition of its regular newsletter, “The Market Mosaic.”
Mosaic said that oil jumping 50% above its long-term trend, a phenomenon now playing out, “has been seen before or during nearly every recession over the past 50 years.”
“Oil prices are directly correlated to headline inflation, where a $10 increase per barrel can push inflation higher by 0.20% or more,” it added.

Major players echo those concerns, including Larry Fink, CEO of the world’s largest asset manager, BlackRock.
“We’ll have a global recession,” he told the BBC this week about the consequences of Iran staying a “threat” to the global economy, even if the war itself ended.
Bitcoin stays tied to “extremely oversold” stocks
Bitcoin has had little experience of recession in its lifespan of less than 20 years.
Related: Gold slides as traders eye sub-$50K BTC: Five things to know in Bitcoin this week
In 2020, a US recession from February to April preceded a period of major BTC price upside after BTC/USD initially joined risk assets in a global crash in March.

As Cointelegraph reported, Bitcoin’s correlation to US stocks has become stronger this year, potentially increasing the potential for a relief bounce.
“While the uncertainty over inflation and the outlook for monetary are broadly weighing across the market, conditions are very favorable to see at least a short-term rally unfold,” Mosaic commented.
“Various measures of investor sentiment and positioning are pointing to excessive bearishness in the market while breadth metrics are extending to extremely oversold levels.”

This article does not contain investment advice or recommendations. Every investment and trading move involves risk, and readers should conduct their own research when making a decision. While we strive to provide accurate and timely information, Cointelegraph does not guarantee the accuracy, completeness, or reliability of any information in this article. This article may contain forward-looking statements that are subject to risks and uncertainties. Cointelegraph will not be liable for any loss or damage arising from your reliance on this information.
Crypto World
Altcoins lead losses as bitcoin slips and derivatives signal bearish turn: Crypto Markets Today


The crypto market is reeling from an overnight selloff, with bitcoin trading lower at $69,400 having lost 2.6% since midnight UTC and ether (ETH) heading back toward $2,000 after tumbling by 4.1%.
The declines come alongside a sharp drop in U.S. equities and precious metals. Nasdaq 100 futures are down by around 1% while gold has lost 1.8%.
Oil, meanwhile, spiked back above $100 per barrel as supposed peace talks between the U.S. and Iran stalled.
The altcoin market was the worst hit, with the CoinDesk Computing Select Index (CPUS) and the CoinDesk DeFi Select Index (DFX) tumbling by 4.3% and 3.9%, respectively, during the Asia session.
Zooming out, bitcoin and the broader crypto market are still locked in a price range that has persisted since early February despite multiple attempts to break out to the upside.
Derivatives positioning
- Deadlock in the Iran-U.S. negotiations seems to have triggered renewed risk aversion, leading to capital outflows from crypto derivatives. The cumulative crypto futures open interest (OI) has declined by 3.5% to $108.30 billion.
- OI in PAXG fell nearly 11% in 24 hours, with the gold price falling 1.8% to $4,423 an ounce. DOGE, ZEC and TAO are other major OI losers.
- Some traders may have shorted BTC futures on major exchanges as prices dropped below $70,000 during European hours. That’s evident from the slight uptick in OI in major dollar- and USDT-denominated exchanges to 232K BTC from 229K BTC.
- ETH, BNB, XPR, SOL, TRX and DOGE are seeing negative fund rates, a sign of increased bias for bearish, short positions.
- Meanwhile, CC, TRX and BCH stand out with positive cumulative volume deltas pointing to positive positioning while other majors including BTC see seller dominance.
- In the options market, some traders are chasing downside protection in ether by purchasing risk reversals, a position that involves selling calls to fund put option buys, TDX Strategies said in a market note.
- On Deribit, BTC and ETH puts remain more expensive than calls across all tenors. At the front end, ether puts are pricier than BTC’s, a sign traders are bracing for a bigger downside in ether in the short-term.
Token talk
- The crypto market is red across the board on Thursday, but some tokens fared worse than others; AI-focused FET is down by 7.7% while ETHFI and RENDER have given back much of the past week’s gains, dropping by 6.3% and 5.9%, respectively.
- The “Altcoin Season” index is still at 48/100, suggesting a bullish recovery could be on the cards if the market can find support and consolidate.
- Around half a dozen tokens out of the top 100 remain in the black over the past 24 hours, these include ethena (ENA), up 2.2%, and layer-1 network tokens XDC, NIGHT and TRX, all between 1% and 2% higher.
- Overall, worryingly low liquidity that has failed to recover since the tail end of 2025, coupled with the fickle nature of crypto retail traders, could create the perfect storm across the altcoin market, producing an exaggerated downturn.
Crypto World
Pepeto Price Prediction Targets 200x as Pepe Coin Made Millionaires With Zero Products While TAO and APT Struggle
Pepe coin turned early buyers into millionaires. A trader who put $250 into Pepe at the 2023 launch walked away with $1.8 million when the token hit $11 billion on nothing but meme energy and a 420 trillion token supply. Another wallet turned $27 into $2.3 million with zero products behind it.
The pepeto price prediction starts with those numbers because the same cofounder is now behind Pepeto, and this time there is a working exchange, a SolidProof audit, and more than $8 million raised with the Binance listing approaching.
Pepeto Price Prediction Gets Context as Trump Iran Threats Drop BTC to $68K and Altcoins Bleed
President Trump threatened to destroy Iran’s power plants if the Strait of Hormuz stayed closed, Bitcoin dropped to $68,000, and most altcoins fell harder, according to CoinDesk.
Trump has since postponed the strike and BTC recovered above $70,000, but the Fear and Greed Index hit 8, according to CoinMarketCap.
The Pepeto forecast does not depend on the market recovering because the returns come from the listing, not from sentiment calming down.
Crypto Picks for 2026: Where the Pepeto Price Prediction Meets Pepe Coin History and Real Exchange Utility
Pepeto
Pepe coin reached a market cap of $11 billion with the same 420 trillion supply and zero products. Matching that price from the current presale entry is over 150x, and Pepeto has a full exchange that Pepe never had. That is the floor of the Pepeto outlook, not the ceiling, because more utility logically reaches more than what zero utility reached.
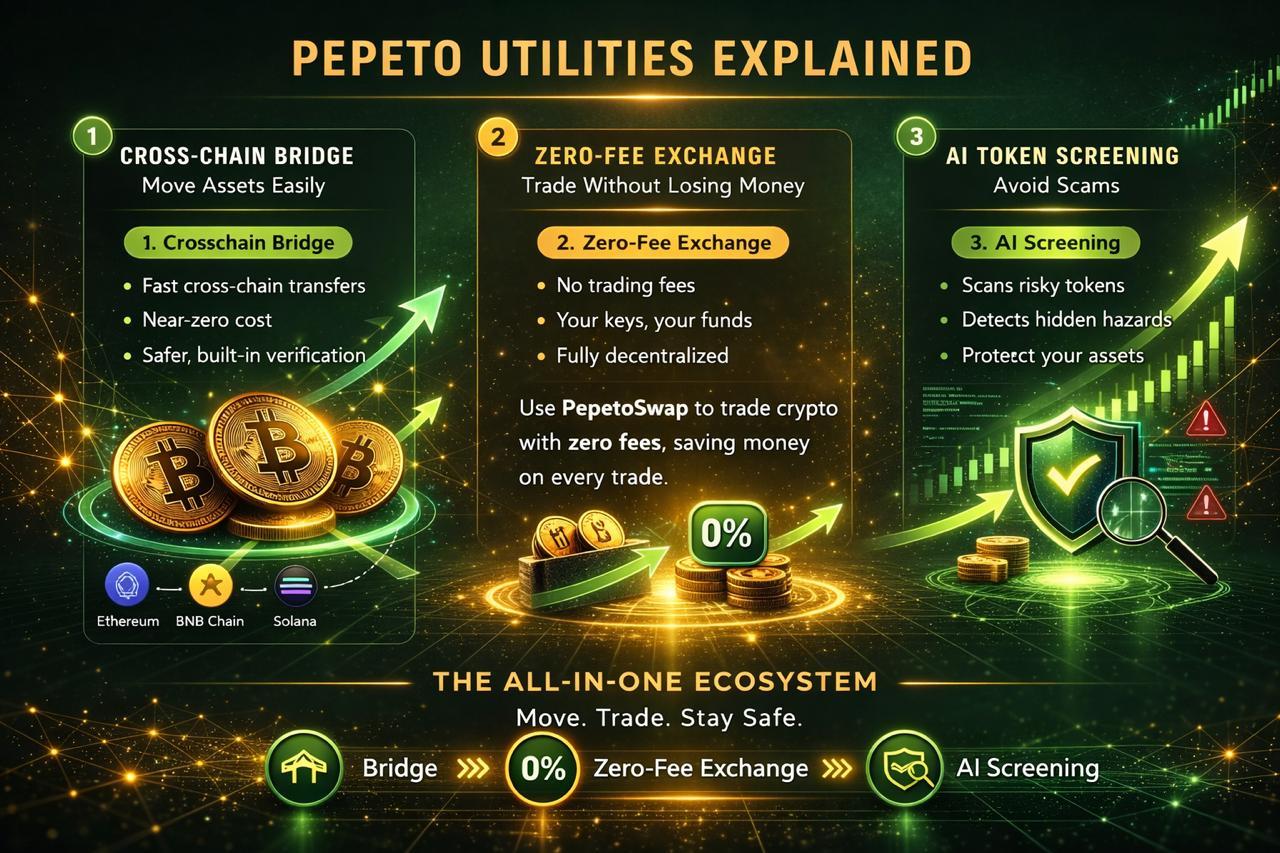
Pepeto was built for retail investors who came to crypto because they do not want to wait for a stock portfolio to double over years. The risk scorer checks every contract for hidden drains and honeypot functions before your money goes near them, and explains what it found so you enter positions with real information instead of trust.

PepetoSwap runs zero fee trades so your capital keeps full value, and the cross chain bridge moves tokens at zero cost. A former Binance expert is on the dev team, the SolidProof audit cleared every contract, and 194% APY staking compounds in wallets that entered early while the stages fill faster each week.
Pepeto is at $0.000000186 with analysts projecting 200x from the current entry once the Binance listing opens public trading. The Pepeto forecast is built on math that anyone can check: same supply as Pepe, same cofounder, but this time there is an exchange making the price floor real instead of relying on hype alone.
With the listing days away and the gap between presale pricing and what the exchange is actually worth closing fast, waiting any longer risks missing the most favorable entry the Pepeto outlook will ever offer.
TAO
Bittensor trades near $332 as of March 24 after climbing 66% from March lows as Grayscale opened a private TAO trust, according to CoinMarketCap.
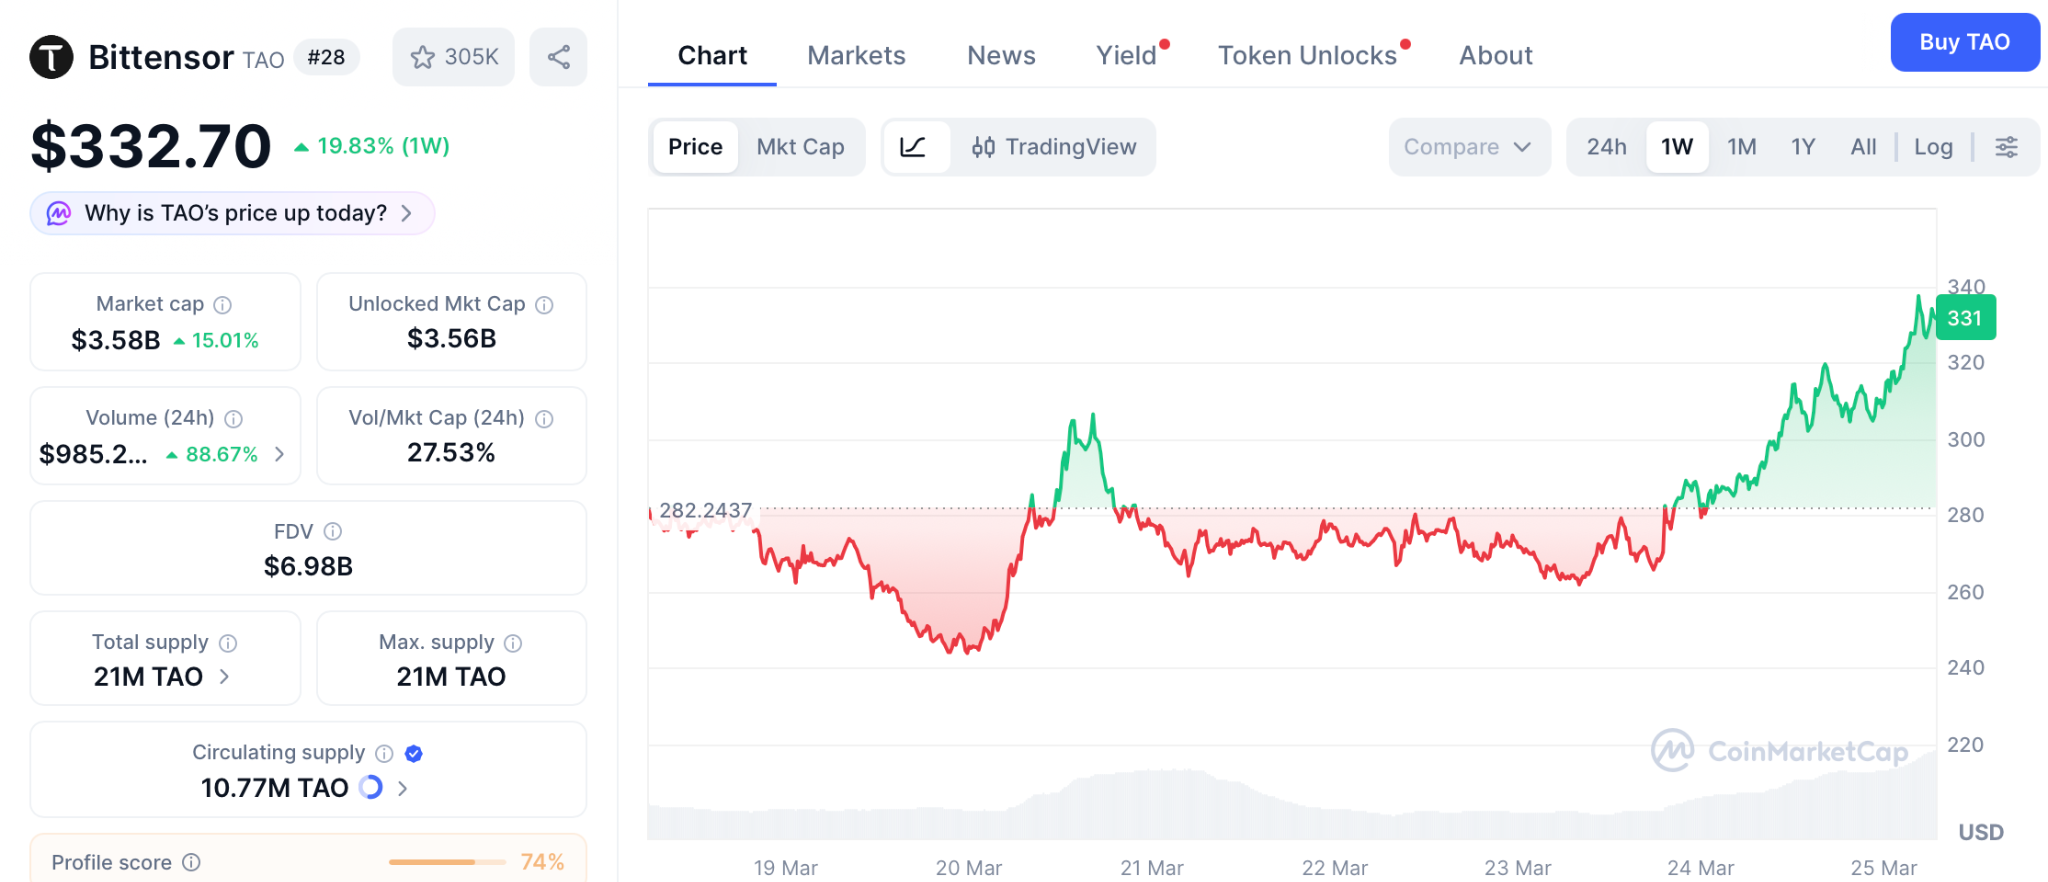
The $302 to $340 zone has rejected the price multiple times. Break $350 and $400 opens, fail and $240 comes first. Strong AI narrative, but the Pepeto forecast offers more room from one listing at a fraction of the price.
APT
Aptos trades near $1.08 as of March 24 after climbing 12% on a 180% volume jump, according to CoinMarketCap. Transaction throughput and active addresses trend lower despite the price rise, questioning whether the rally lasts.
Break $1.08 and $1.25 opens, reject here and $0.95 comes first. A speculative bounce, not the return that changes how your portfolio looks the way the Pepeto forecast delivers from one listing.
Pepeto Price Prediction Confirms That the Returns That Reshape Portfolios Never Come From Large Cap Recovery
The Pepeto outlook is not built on hope. It is built on the fact that Pepe reached $11 billion with nothing and the same cofounder built Pepeto with a full exchange this time. TAO is testing $300 and APT bounced 12%, but the biggest catalysts for both are priced in.
The returns that reshape a portfolio never come from large cap recovery, they come from being early in what the market discovers after the listing. Meme energy from the Pepe cofounder plus exchange utility plus a Binance listing at the same time is the rarest setup crypto produces.
Being one stage earlier is the difference that lasts a lifetime, and the pepeto price prediction needs only the listing. The Pepeto official website is where that entry is still open.
Pepe made millionaires with zero products. The pepeto price prediction has more behind it. Visit Pepeto before the listing closes the entry.
Click To Visit Pepeto Website To Enter The Presale

FAQ:
What is the pepeto price prediction analysts are projecting as the listing approaches?
Analysts project 200x from the current entry based on matching Pepe coin’s market cap with more utility behind it. The Pepeto official website is where entries are secured before listing day.
What does the pepeto price prediction look like compared to TAO and APT?
The pepeto price prediction offers more room because the token sits at presale pricing while TAO and APT already priced in their biggest catalysts.
What drives the pepeto price prediction beyond the presale?
The same cofounder who built Pepe to $11 billion is behind a working exchange with verified contracts, zero fee trading, and the Binance listing days away.
Disclaimer: This is a Press Release provided by a third party who is responsible for the content. Please conduct your own research before taking any action based on the content.

Crypto World
Porsche SE (PSHG) Reports 9% Profit Decline as Volkswagen Struggles Weigh on 2025 Results

Key Highlights
- Porsche SE’s adjusted after-tax earnings totaled €2.9 billion in 2025, representing a ~9% decline versus the previous year
- Performance suffered due to operational challenges and elevated expenses at both Volkswagen and Porsche AG
- Net debt decreased modestly to €5.1 billion compared to €5.2 billion previously
- Portfolio investments delivered €193 million in earnings, with significant contributions from Quantum Systems and Celestial AI
- Management committed €100 million to a newly established European defence technology investment vehicle
Shares of Porsche SE declined 2.7% during morning trading Thursday, trailing behind broader equity benchmarks.
Porsche Automobil Holding SE, PAH3.DE
The Stuttgart-based holding company posted adjusted after-tax profit of €2.9 billion for the full 2025 fiscal year, marking approximately a 9% contraction compared to the year-ago period. The disappointing performance stems primarily from operational difficulties throughout the Volkswagen Group, where Porsche SE maintains a 31.9% equity stake along with 53.3% of voting control.
Volkswagen continues to navigate significant headwinds including tariff pressures, intensifying competitive threats from Chinese automotive manufacturers, and substantial capital requirements associated with its electric vehicle transformation strategy. Making matters worse, Porsche AG—the premium sports car manufacturer in which Porsche SE holds a 12.5% interest—paused its electric vehicle expansion program in September, triggering additional financial burdens.
The holding company’s net debt position improved marginally, declining to €5.1 billion from €5.2 billion year-over-year—representing only incremental progress against a substantial debt burden.
Venture Portfolio Delivers Positive Contribution
Amid the challenges in core automotive holdings, Porsche SE found some relief from its venture investment portfolio. These smaller strategic investments generated €193 million in profit contributions, led by a €114 million gain from drone manufacturer Quantum Systems and a €47 million contribution from AI chip developer Celestial AI.
The aggregate carrying value of the portfolio investments has roughly doubled to approximately €535 million since the close of fiscal 2024—a metric management emphasized in its results presentation.
Chairman Hans Dieter Poetsch characterized the investment portfolio as “a key strategic asset” for the organization.
Strategic Pivot Toward Defence Technology
Reflecting broader shifts in German industrial strategy, Porsche SE disclosed a €100 million capital commitment to a new defence-focused investment fund managed by DTCP.
The vehicle will deploy capital into European technology companies developing solutions across cybersecurity, artificial intelligence, and related defence applications. Institutional interest in defence and security sectors has accelerated substantially as geopolitical tensions stemming from conflicts in Ukraine and the Middle East have elevated the strategic importance of these industries.
Poetsch reaffirmed the company’s long-term commitment to Volkswagen, highlighting €1 billion in cost reductions executed across the group during the past year.
“We expect the management of both Volkswagen AG and Porsche AG to view the challenging situation as an opportunity to implement the strategic adjustments,” Poetsch stated.
Looking to fiscal 2026, Porsche SE provided guidance calling for adjusted group profit after tax in the range of €1.5 billion to €3.5 billion—an unusually broad forecast range that underscores the considerable uncertainty surrounding its primary automotive investments. Net debt is anticipated to finish between €4.7 billion and €5.2 billion.
The substantial variance in forward guidance clearly illustrates management’s limited visibility into near-term operating conditions.
Porsche SE stock traded down 2.99% at publication time.

TLDR:
- The Solana Foundation reports 15 million on-chain agent payments already processed on its network
- Stablecoins are emerging as the default payment rail for AI agents buying computational resources.
- Vibhu Norby says 95 to 99% of future crypto transactions will originate directly from AI agents.
- Solana developers are building machine-readable skill files and AI-first platforms for agents.
Solana is positioning itself as core infrastructure for an emerging “agentic” internet. The Solana Foundation reports the network has already processed 15 million on-chain agent payments.
Stablecoins are emerging as the default payment rail for AI-driven compute and services. Vibhu Norby, the foundation’s chief product officer, shared these updates at the Digital Asset Summit in New York on March 25, 2026. This shift, he said, could change how the internet is monetized at its core.
Solana Emerges as the Default Payment Layer for AI Agents
The Solana Foundation is making a strong case for the network’s role in machine-to-machine commerce. Norby confirmed the network has already “processed 15 million payments onchain from agents,” pointing to real and measurable activity.
He added that “the programmatic aspect of crypto payments is what is making it interesting for agents.” Stablecoins, he noted, are “going to be the default thing that agents use to pay for any computational resource.”
Traditional payment systems are not built to handle sub-cent, pay-per-use transactions at scale. Norby pointed to this gap directly, stating that agentic payments support low-cost, high-frequency activity that “traditional rails cannot handle.”
Solana’s performance-focused design addresses this need efficiently. This gives the network a clear edge as AI-driven commerce continues to grow across industries.
Norby described AI agents as logical and performance-driven systems that prioritize results over loyalty. “Agents are cold, calculated machines… they don’t subscribe to crypto religiosity,” he told panelists at the summit.
He went further, noting that “if you ask an agent what’s the best way to pay for something with crypto, most of the time, Solana is showing up at the top.” This positions Solana not by preference, but by performance.
The 15 million on-chain agent payments already processed reflect steady, measurable real-world activity on the network. This figure confirms that machine-to-machine commerce is gaining ground on Solana.
As AI systems scale globally, transaction volumes from agents are expected to increase substantially over time.
Agentic Payments Signal a Broader Shift in Internet Monetization
Beyond payments, the Solana Foundation is watching a wider platform transformation take shape across the tech sector.
Norby stated that “AI is not really a vertical. It’s a platform shift… affecting everything across every industry, including crypto.”
He argued that “agentic payments are probably going to change the entire way that the internet is monetized.” This framing sets the stage for entirely new internet business models built around autonomous agents.
Developers on Solana are already building tools designed directly for AI systems to use. Norby noted that “what agents like is APIs and documentation and skills,” pointing to machine-readable skill files and AI-first developer platforms.
The aim is to make Solana more accessible for agents through clean, structured tooling. This active development effort reflects a deliberate shift in how the ecosystem is being built.
Advances in AI are also removing long-standing technical barriers for developers working across ecosystems. Machines and developers can now build cross-platform tools more easily than before.
This opens room for more AI-native applications and cross-chain solutions to take hold on Solana. The result is a more open and developer-friendly network overall.
Looking ahead, Norby expects AI agents to become the standard interface through which people interact with crypto.
He projected that “the default way people will interact with crypto is going to be through their agent… 95 to 99% of all transactions… will be coming from LLMs.” Agentic payments, in his assessment, are set to transform the entire way the internet operates financially.


- Ondo price hovered around $0.26 on Thursday.
- A partnership with Franklin Templeton brings $1.7 trillion AUM ETFs on-chain.
- The real-world assets market continues to attract institutional adoption.
The Ondo token traded higher after Ondo Finance announced a key partnership with Franklin Templeton, the global asset manager overseeing $1.7 trillion in assets under management (AUM).
According to the Ondo Finance team, this collaboration is about tokenizing Franklin Templeton’s ETFs to bolster adoption via on-chain access.
The move comes as traditional investment products get increased attention through real-world assets (RWA).
Franklin Templeton’s tokenized ETFs now live on Ondo Global Markets, including the Growth ETF, Income Equity focus ETF and High Yield Corporate ETF.
This launch sees Ondo, a leading RWA protocol, continue to expand its ecosystem. It’s attracting institutional interest amid rising demand for tokenized securities.
“Franklin is partnering with Ondo to have all their ETFs be tokenized so people on-chain can enjoy the awesomeness of cheap beta,” Bloomberg senior ETF analyst Eric Balchunas noted via X.
“Like I’ve been saying, tokenization isn’t a threat to ETFs, on the contrary, it’s a distribution mechanism.”
Ondo, Chainlink and Avalanche are some of the coins riding high on the tokenized assets narrative.
Adoption trends across the globe, with major banks and other top financial institutions keen on a piece of the cake, mean notable long-term gains for ONDO among others.
“Financial assets are becoming software. And as more assets move into the digital wallet-based ecosystem, there’s endless potential for their on-chain utility,” Franklin Templeton’s Robert Crossley said at a tokenization summit in London.
Ondo price analysis
Ondo (ONDO) price reacted bullishly to the announcement, climbing to highs of $0.273.
Despite the optimism around tokenization and real-world assets, RWA ecosystem tokens mirror the broader market in terms of recent performance.
Ondo has traded lower since hitting resistance around $2.00 in late 2024.
The downtrend accelerated below $1.00 in September 2025, with Ondo hitting multi-year lows as cryptocurrencies fell in February this year.
From a technical perspective, key support holds at $0.24 (recent swing low) and $0.21. The latter provides a solid reload zone amid broader market volatility.
Meanwhile, resistance looms at $0.28, with a breakout potentially targeting $0.50.
If Bitcoin maintains stability above $70,000, the next leg up could see ONDO test the $1 mark. Hurdles above this psychological level would be around $1.20 and $1.50.
However, macroeconomic risks like US Federal Reserve rate decisions could combine with geopolitical shocks to cap gains.
BTC is eyeing the $75,000 mark, but an escalation in the Iran war could plunge prices to lows of $50,000.

Cardano just dropped to $0.257, down 5%, as one of the worst performers today, even after a landmark regulatory ruling just hit the tape that is pushing its price prediction to bullish. The SEC and CFTC officially classified ADA as a “digital commodity” earlier this week, stripping away the securities ambiguity that has shadowed the asset for years.
The joint SEC/CFTC designation covers 16 cryptocurrencies in total, meaning Cardano shares the regulatory tailwind with a crowded field of competitors. Still, the ruling carries specific implications for ADA: staking services that previously operated in a legal grey zone are now on firmer ground, and airdrop distributions across the Cardano ecosystem are no longer treated as securities offerings under most standard conditions.
— Our Crypto Talk (@ourcryptotalk) March 17, 2026
 The SEC and CFTC Just Named
16 Crypto Assets as "Digital Commodities”
• Aptos (APT)
• Avalanche (AVAX)
• Bitcoin (BTC)
• Bitcoin Cash (BCH)
• Cardano (ADA)
• Chainlink (LINK)
• Dogecoin (DOGE)
• Ethereum (ETH)
• Hedera (HBAR)
• Litecoin (LTC)
• Polkadot (DOT)
•… pic.twitter.com/GFiJmlQOJr
Discover: The best pre-launch token sales
Cardano Price Prediction: Can ADA Price Recover to $0.30 Soon?
Institutional capital that sat on the sidelines over compliance concerns now has fewer excuses. Meanwhile, network-level catalysts are stacking, the van Rossum hard fork is slated for April, the Midnight privacy sidechain mainnet approaches, and whale wallets accumulated $161M in ADA over the past 48 hours while TVL crossed $1.1B.
The macro backdrop remains a headwind. US CPI data and a March Fed meeting have kept risk appetite compressed across the broader crypto market, and ADA’s chart still sits in a defined downtrend below key moving averages. The regulatory win is real, but price action doesn’t always care about fundamentals on a short timeframe.
ADA is consolidating in a tight band between $0.24 and $0.3, with neutral daily RSI at 47, neither oversold enough to trigger aggressive dip-buying nor strong enough to signal momentum.

Motley Fool analyst Dominic Basulto has floated a $1.00 ADA target for 2026, a 250% return from here, contingent on spot ETF approvals and sustained institutional inflows. That’s a compelling long-term thesis. Short-term, the chart needs to clear $0.30 to confirm any trend reversal is actually underway.
Discover: The best crypto to diversify your portfolio with
LiquidChain Targets Early-Mover Upside as Cardano Tests Key Resistance
ADA’s regulatory clarity is a step forward, but a commodity classification at a $0.27 price point still leaves investors waiting for a catalyst chain to actually fire. For traders unwilling to sit through months of SMA compression, early-stage infrastructure plays offer a different risk-reward geometry altogether.
LiquidChain ($LIQUID) is a Layer 3 infrastructure project positioning itself as the cross-chain liquidity layer, fusing Bitcoin, Ethereum, and Solana liquidity into a single execution environment. The core proposition: developers deploy once and access all three ecosystems simultaneously via a Unified Liquidity Layer, Single-Step Execution, and Verifiable Settlement architecture.
Things are heating up.
The Order grows.⟁https://t.co/vqvBcdSQYC pic.twitter.com/2vIhIFSyKX
— LiquidChain (@getliquidchain) March 26, 2026

The presale is live at $0.014 per $LIQUID, with more than $600K raised to date. The deploy-once architecture addresses one of DeFi’s most persistent friction points, fragmented liquidity across siloed chains, which gives the project a use case that extends well beyond the current market cycle.
Research LiquidChain’s presale here.
This article is for informational purposes only and does not constitute financial advice. Crypto assets are highly volatile. Always conduct your own research before investing.
The post Cardano Price Prediction: Time to Buy ADA Right Now? appeared first on Cryptonews.

Gold price just broke its own mythology, and this is somewhat resulting in a bearish analysis. The metal that traders have leaned on through wars, recessions, and currency crises dropped 14% this month, not because the world got safer, but because a de-escalation headline was enough to trigger a mass exit.
Meanwhile, Bitcoin is trading just below $70,000, posting a 10% gain in a month while Gold bled. That divergence is the story. Donald Trump announced a five-day delay to military strikes on Iran following what he described as “very good and productive” talks, with discussion of joint Strait of Hormuz management and Iran’s potential agreement to halt nuclear pursuits 2 days ago.
Iran subsequently denied negotiations, triggering a partial recovery in gold, but the damage was done. Oil markets reacted similarly, with risk-on flows rotating out of traditional safe havens at speed. The broader question now: is gold’s safe-haven status structurally impaired, or just temporarily out of fashion?
Discover: The best crypto to diversify your portfolio with
Gold Price Analysis: Can XAU Reclaim $5,000, Or Is the Safe-Haven Trade Broken?
Gold’s price mechanics have changed. After surging to an all-time high near $5,600 per ounce in late January, effectively double its level from a year prior, XAU has shed roughly 20% from its peak. The Iran de-escalation headlines accelerated the decline, pulling gold down nearly 15% since early March alone before Iran’s denial softened the drop. Intraday losses mostly recovered after that denial, but the pattern is telling.
The core issue is financialization. Derivatives exposure and ETF flows now dominate gold’s price action more than physical demand or genuine crisis hedging. When risk-on sentiment flips, institutional desks unwind paper gold positions fast, faster than any geopolitical nuance can absorb. That’s not a bug in modern markets; it’s the feature.
Gold is still up almost 300% over the past decade by historical measure. But Santiment data notes Bitcoin is outpacing traditional assets including the S&P 500 and gold amid the current Middle East conflict cycle. The correlation is breaking. That matters for portfolio allocation decisions made this week.
Discover: The best pre-launch token sales
LiquidChain Targets Early-Mover Upside as Gold Tests Key Levels
Gold’s 10% drawdown in three weeks is a useful reminder: even “safe” assets carry rotation risk when macro narratives shift overnight. Traders watching XAU underperform Bitcoin by more than five percentage points since March 4 are already asking where early-stage upside lives, before a narrative becomes consensus. Historical macro dislocations have repeatedly front-run crypto allocation shifts, and the current setup is no different.
A new layer emerges. Only a few see it first. — LiquidChain (@getliquidchain) March 24, 2026
The future is LiquidChain ⟁https://t.co/vqvBcdSj94 pic.twitter.com/R7ZeZ0NPGl
LiquidChain ($LIQUID) is a Layer 3 infrastructure project positioning itself as the cross-chain liquidity layer — fusing Bitcoin, Ethereum, and Solana liquidity into a single execution environment. The architecture is built around four pillars: a Unified Liquidity Layer, Single-Step Execution, Verifiable Settlement, and a Deploy-Once Architecture that lets developers ship once and access all three ecosystems simultaneously.
The presale is currently priced at $0.01435, with more than $600K raised to date. LiquidChain has drawn attention as cross-chain infrastructure demand grows alongside multi-ecosystem trading activity. The presale also rewards stakers with more than 1700% APY in staking rewards, and is audited by Certik for safety.
Review the LiquidChain presale details here.
This article is not financial advice. Crypto assets are highly volatile. Always conduct your own research before making investment decisions.
The post Gold Price Analysis: Why US-Iran Tension Drops XAU Price appeared first on Cryptonews.
Key Takeaways
- Reflection AI is pursuing funding that would value the Nvidia-backed company at $25 billion
- The AI startup aims to secure $2.5 billion, representing over three times its prior $8 billion assessment
- JPMorgan Chase may participate via its security-oriented investment division
- Founded by former Google DeepMind team members, Reflection AI develops open-source AI systems and developer tools
- The company focuses on sovereign AI collaborations with U.S. partner nations to challenge China’s AI advancement
Reflection AI, an artificial intelligence startup with Nvidia backing, is pursuing $2.5 billion in fresh capital at a $25 billion valuation, the Wall Street Journal reports. This represents more than a threefold increase from its approximately $8 billion valuation in its previous funding round.
Launched in 2024 by alumni of Google DeepMind, the venture specializes in creating AI solutions for software developers, such as coding assistance platforms. In collaboration with Nvidia, the company produces open-source artificial intelligence frameworks accessible to enterprises, governmental bodies, and academic institutions at no cost.
Nvidia has committed approximately $800 million to Reflection AI thus far. Beyond capital, the semiconductor giant actively facilitates customer introductions, including foreign governments seeking to establish independent AI infrastructure.
Reports indicate JPMorgan Chase is evaluating participation in this funding initiative through its security-centered investment arm. Disruptive, an existing backer, is anticipated to contribute additional capital as well.
Reflection AI has accumulated over $2 billion in total funding to date. However, the organization remains in early revenue generation stages.
National AI Infrastructure Strategy
Among Reflection AI’s most significant recent achievements is a partnership with South Korea’s Shinsegae Group to develop Korean-language artificial intelligence frameworks. This initiative will operate on thousands of Nvidia processors.
The startup intends to replicate this model across global markets. Its objective centers on becoming a leading provider of “sovereign AI” — artificial intelligence infrastructure developed and governed by individual nations or American allies.
This approach directly addresses competition with China’s accelerating AI development. U.S. policymakers have prioritized establishing a domestic AI infrastructure, with Reflection AI positioned as a central component of this initiative.
Open-Source Models and Nvidia’s Ecosystem Play
Reflection AI represents one of multiple startups working intimately with Nvidia to develop sophisticated AI frameworks optimized for its hardware architecture. These open frameworks offer flexibility for deployment across diverse sectors.
Nvidia’s engagement extends well beyond financial investment. The chipmaker proactively connects Reflection AI with prospective clients and assists in expanding its partnership ecosystem.
Financial analysts maintain optimistic projections for Nvidia. TipRanks shows the stock carries a Strong Buy consensus rating, supported by 41 buy recommendations and a single hold rating across the last three months. Analysts’ average price target of $273.34 suggests approximately 53% potential upside from present trading levels.
JPMorgan Chase’s prospective involvement creates an intriguing dynamic, connecting two influential financial sector participants — a banking institution and a chip manufacturer — to a single AI company’s expansion trajectory.
Despite being established less than two years ago, Reflection AI has secured billions in investment commitments and forged partnerships spanning multiple nations.


- Ethereum (ETH) price shows early signs of a potential bullish trend reversal.
- On-chain data suggests accumulation and weakening selling pressure.
- A break above $2,300 could trigger further upside momentum.
Ethereum has slipped below the $2,200 mark, but the broader picture suggests something more interesting is unfolding beneath the surface.
The recent dip reflects short-term weakness, although it does not fully capture the growing signals pointing toward a potential shift in trend.
While the price action over the past week shows mild selling pressure, zooming out reveals that Ethereum is still holding onto gains built over the last month.
This creates a mixed environment where caution and optimism exist side by side.
On-chain signals a possible rebound
One of the most notable indicators is the MVRV ratio, which recently dipped into a zone that has historically marked undervaluation.
This level often appears when investors are sitting on losses, a condition that tends to precede accumulation.
In simple terms, weaker hands exit while stronger hands quietly step in.
Momentum indicators are also starting to shift in favour of buyers.
A key trend-following signal has flipped bullish for the first time in months, suggesting that selling pressure may be losing strength.
This does not guarantee an immediate rally, but it does indicate that the balance between buyers and sellers is beginning to change.
At the same time, Ethereum has been trading within an ascending triangle on the weekly chart, a structure that often leads to a breakout.
As Ethereum $ETH recovers, these are the MVRV Pricing Bands that could act as resistance:
• $2,356
• $2,647
• $3,639
• $4,632
• $5,624https://t.co/DSj59wXjWE— Ali Charts (@alicharts) March 25, 2026
Such patterns do not always resolve upward, but when combined with improving on-chain data, the probability of a bullish outcome increases.
Bitcoin’s quantum-resistance lag supports a rebound
Beyond technicals, a longer-term narrative is quietly gaining traction in the background.
Concerns around quantum computing and its potential impact on blockchain security are starting to enter the conversation.
In a recent post on X, Nic Carter, the founding partner at Castle Island Ventures, stated, “The only thing that matters is how quickly blockchain developers recognise that they need to bake in cryptographic mutability into their networks.”
While this threat remains distant, it is serious enough to influence how investors think about the future.
The key difference lies in how networks are preparing for it.
Ethereum appears to be moving toward adapting its cryptographic systems over time, with plans that acknowledge the need for future upgrades.
Bitcoin, on the other hand, faces a more complex path due to its conservative approach to change.
This contrast could eventually shape investor perception.
If Ethereum is seen as more adaptable, it may gain an edge in long-term positioning.
Narratives like this do not move markets overnight, but they often build slowly before having a powerful impact.
In this case, the idea of being “future-ready” could become a meaningful driver of demand.
The targets in case of a bullish reversal
For now, price levels remain the clearest guide for what happens next.
Ethereum is currently trading below a key resistance zone that sits just above $2,355.

A clean break above this level would be the first strong sign that buyers are regaining control.
If that happens, analysts note that the next target to watch lies around $$2,525.
These levels have previously acted as barriers and are likely to attract attention again.
Beyond that, the path opens toward the higher ranges last seen during previous rallies.
However, none of this unfolds unless the market confirms the shift.
On the downside, support around $1,939 remains critical.
A drop below that level would weaken the bullish case and suggest that more time is needed before any sustained recovery.

Sourav Ganguly Ends Debate On ‘India’s Greatest Ever Captain’, Chooses Between Himself And MS Dhoni

AAA video games regularly cost over $300,000,000 to make reveals insider

Co-op boss quits after ‘toxic culture’ claims reported by BBC

Smart energy pays enters the US market, targeting scalable financial infrastructure

Why Israel is blocking foreign journalists from entering

Bitcoin: We’re Entering The Most Dangerous Phase

Truth About Marriage and Financial Burden | #marriageandfinance #financialfreedom #ytshorts #shorts

ONLY THE XRP PRICE GLITCHES – DTCC $100 TRILLION IN 50 WEEKS! – PARITY ACT VS CLARITY ACT – XRP NEWS

STOP WASTING Money on Photography!
-
 Crypto World5 days ago
NIO (NIO) Stock Plunges 6.5% as Shelf Registration Sparks Dilution Worries
-

 Fashion6 days ago
Weekend Open Thread: Adidas – Corporette.com
-
 NewsBeat1 day ago
Manchester United reach agreement with Casemiro over contract clause amid transfer speculation
-

 Politics6 days ago
Jenni Murray, Long-Serving Woman’s Hour Presenter, Dies Aged 75
-

 Crypto World4 days ago
Best Crypto to Buy Now: Strategy Just Spent $1.57 Billion on Bitcoin During Fear While Early Investors Quietly Enter Pepeto for 150x Potential
-

 Crypto World5 days ago
Bitcoin Price News: Bhutan Sells $72 Million in BTC Under Fiscal Pressure, but the Smart Money Entering Pepeto Sees What the Market Does Not
-

 Tech6 days ago
inKONBINI Lets You Spend Summer Days Behind the Register
-

 News Videos9 hours ago
Parliament publishes latest register of MPs’ financial interests
-

 Sports3 days ago
Remo Stars and Kano Pillars Strengthen Survival Hopes in NPFL
-

 Politics7 days ago
Gender equality discussions at UN face pushbacks and US resistance
-

 Business4 days ago
No Winner in March 21 Drawing as Prize Rolls to $133 Million for Next
-

 Sports3 days ago
Gary Kirsten Accuses Pakistan Cricket Board Of ‘Interference’, Mohsin Naqvi Responds
-

 Tech4 days ago
Give Your Phone a Huge (and Free) Upgrade by Switching to Another Keyboard
-

 Sports6 days ago
2026 Kentucky Derby horses, odds, futures, preview, date: Expert who nailed 12 Derby-Oaks Doubles enters picks
-

 Tech4 days ago
AI enters the chat: New Seattle dating app relies on tech to facilitate meaningful human connections
-

 Politics7 days ago
Scotland’s rejection of assisted dying is a victory for humanity
-

 Business7 days ago
DLocal: Entering 2026 At Escape Velocity
-
Business5 days ago
Columbia Sportswear enters $500 million credit agreement with JPMorgan Chase
-

 NewsBeat7 days ago
Missile lands next to presenter during live report
-

 Tech4 days ago
Today’s NYT Connections Hints, Answers for March 22 #1015
You must be logged in to post a comment Login