
Crypto World
More than 95% of all bitcoin has already been mined, rest will take more than a century

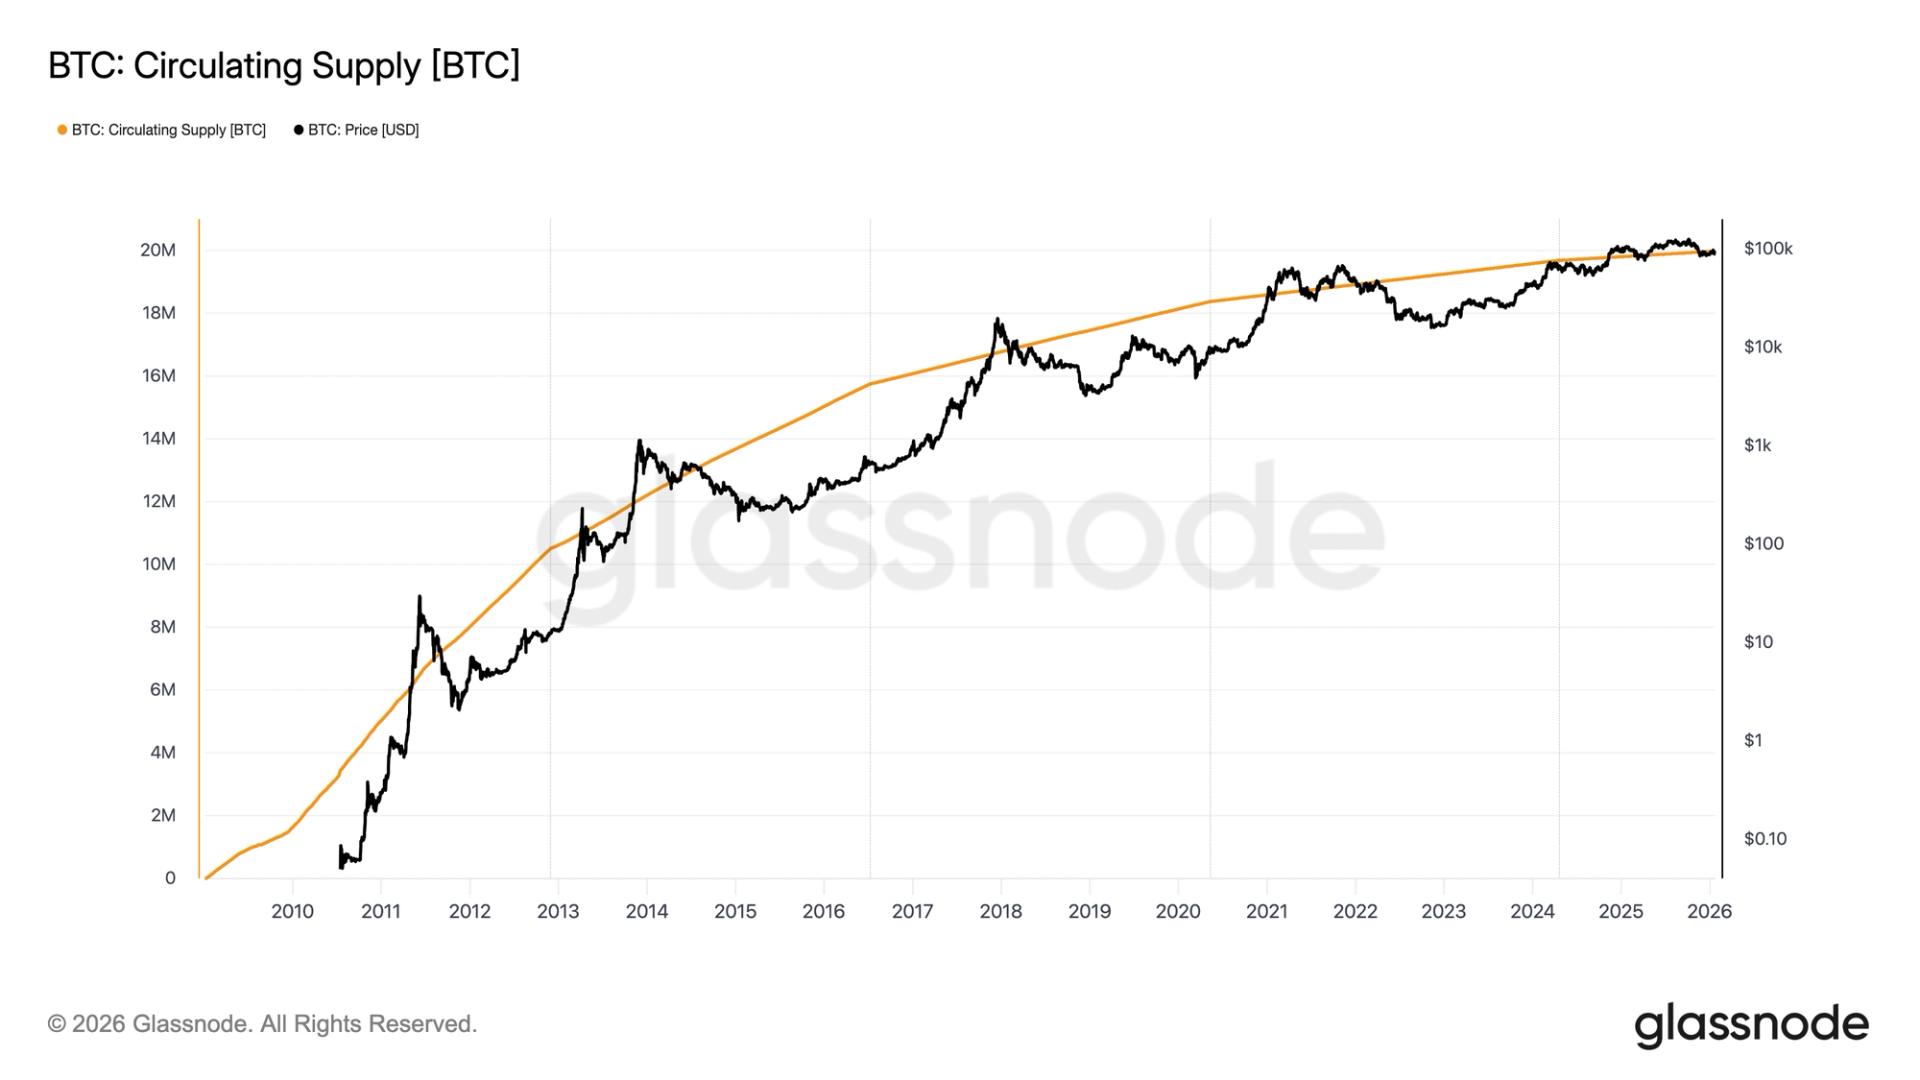
Bitcoin is on the brink of reaching a major symbolic milestone with the issuance of its 20 millionth coin.
According to the Clark Moody Dashboard, 19,996,979 BTC have been mined, leaving just roughly 3,000 BTC remaining before the 20 millionth bitcoin is reached, roughly seven days away at current issuance rates. Once that threshold is crossed, more than 95% of the fixed 21 million supply will be in circulation, with just 1 million coins left to be mined over the next century.
Satoshi Nakamoto hard coded the 21 million cap into bitcoin’s protocol to create a form of money with absolute scarcity, contrasting sharply with fiat currencies that can be expanded by central banks. Although Satoshi never fully explained the specific number, the fixed limit established credibility around predictable supply. For bitcoin maximalists, the cap is foundational. Any suggestion of changing it is seen as undermining Bitcoin’s core value proposition as “hard money.”
Bitcoin’s scarcity is often compared to gold or oil. But while commodity supply can respond to higher prices through increased production or new discoveries, bitcoin’s issuance cannot accelerate. Its supply curve is transparent and immutable.
Issuance has slowed through halvings, which cut miner rewards roughly every four years, pushing inflation below 1%, with about 450 BTC mined daily. At this pace, 99% of supply will be mined by January 2035. The final full bitcoin is expected around 2105, with fractional issuance continuing until about 2140.
After that, miners will rely entirely on transaction fees. For supporters, the 20 million milestone reinforces bitcoin’s scarcity narrative as new supply dwindles. While for miners it underscores the long term shift toward a fee driven revenue model that will ultimately determine the network’s security and economics.


Cardano price is currently trading under heavy suppression near the $0.25–$0.27 range, marking a continuation of a brutal trend prediction that has seen the asset shed more than 20% since January. While the chart paints a grim picture of capitulation, data suggests the market is reaching a mathematical inflection point.
Santiment analytics reveal that the average active wallet on the network now sits at a staggered -43% return, a level of widespread pain that historically precedes trend reversals.
— Santiment (@santimentfeed) March 24, 2026
 Average wallets that have been active on the Cardano network over the past year are netting a return of -43% on their investments. Memes aside about the altcoin's major -71% price decline since September, this extreme negative MVRV value is generally an indicator of $ADA being… pic.twitter.com/LzQRKhobQe
The on-chain reality is stark. This -43% MVRV (Market Value to Realized Value) places ADA deep within an “opportunity zone,” where selling pressure naturally evaporates because participants refuse to realize such deep losses.
Simultaneously, Binance funding rates show the highest concentration of short positions since mid-2023. When the crowd unanimously bets on further downside (with no one left to sell), the market often brutally liquidates the bears.
This creates a coiled spring dynamic. While retail traders panic over the Cardano price prediction, institutional algorithms are eyeing the liquidity mismatch. However, waiting for legacy altcoins to pivot can be an agonizingly slow process, leading capital to rotate toward higher-beta assets in the interim.
Discover: The best crypto to diversify your portfolio with
Cardano Price Prediction: ADA to Trigger a Short Squeeze to $0.33?
Technically, ADA is clinging to critical support at $0.25. A breakdown here would invalidate the bullish divergence thesis, potentially opening the floor to $0.22 based on long-term forecast data. However, the derivative setup favors the bulls. The imbalance in funding rates suggests that a minor price uptick could trigger a cascade of short liquidations, rapidly forcing price back toward the 200-day moving average.
Volume profiles indicate apathy rather than aggression, a typical bear market bottom signal. If the bulls can defend the $0.25 line, the first target is the $0.30 psychological resistance, followed by a liquidity grab at $0.33. Conversely, sustained trading below $0.24 would confirm the weakness projected by some analysts expecting further consolidation through 2026.

The risk-to-reward ratio for a long entry here is high, but so is the time cost. Cardano has become a “heavy” trade, safe, perhaps, but slow.
This lethargy is precisely why active traders are diversifying into emerging narratives that promise volatility and immediate price discovery.
Discover: The best pre-launch token sales
Maxi Doge Brings Leverage Culture to Meme Markets
While Cardano tests the patience of its holders, the meme coin sector continues to command the lion’s share of speculative volume. Traders fatigued by ADA’s slow grind are rotating into Maxi Doge ($MAXI), a new ERC-20 project that has already raised more than $4,7 Million in its presale phase.
Maxi Doge differentiates itself from potential competitors by targeting a specific subculture: the leverage addict. Branded as a 240-lb canine juggernaut, the project’s USP revolves around its “Leverage King” culture and holder-only trading competitions. The roadmap avoids vague promises, focusing instead on a “Maxi Fund” treasury designed to inject liquidity and sustain market operations.
The entry price represents a specific opportunity for early movers. Currently priced at $0.000281, the token offers an accessible entry point compared to established caps. The platform also boasts 66% APY rewards, incentivizing holders to lock supply (reducing sell pressure) while participation in the ecosystem grows.
Check out the Maxi Doge Presale
Disclaimer: Crypto is a high-risk asset class. This article is provided for informational purposes only and does not constitute investment advice.
The post Cardano Price Prediction: Is The Chart Bottoming? appeared first on Cryptonews.

- Balancer Labs shuts down after legal and economic pressure.
- BAL token model shifts to zero emissions and buybacks.
- BAL price outlook hinges on execution of the overhaul.
Balancer Labs is set to take a sharp turn after its founder, Fernando Martinelli, proposed a radical overhaul, stating that maintaining a corporate entity tied to past incidents had become a liability.
The decision to shut down Balancer Labs follows months of pressure after a major exploit in November 2025 that drained over $100 million from the protocol and exposed both technical and structural weaknesses.
While the protocol continues to operate, the changes signal a clear break from the past.
At the centre of this shift is the BAL token, whose outlook now depends on whether the proposed overhaul can restore confidence in the once leading DeFi platform.
A full reset of Balancer’s economic model
The proposed changes leave very little of the old system intact as all BAL emissions are set to be halted completely.
The veBAL governance system is also being scrapped.
Incentive programs that once drove liquidity are being shut down across the board, including partner fee splits and vote market mechanisms, which were once considered core pillars of growth but are now viewed as sources of inefficiency and value leakage.
Under the proposal, all protocol fees will be redirected to the DAO treasury, marking a major shift from the previous structure, where only a small portion was captured.
Liquidity providers are also being prioritised differently.
Swap fees in V3 will be reduced to make the platform more competitive to attract organic liquidity rather than relying on token rewards.
At the same time, a large buyback and burn plan is being introduced.
Up to 35% of the BAL token supply could be removed over time. This is paired with compensation for former veBAL participants.
The goal is to reset both supply dynamics and user confidence.
Why Balancer is making this move now
The timing of this overhaul is not random.
The numbers behind the protocol tell a clear story. Despite generating over a million dollars in annual fees, very little value was being retained.
At the same time, emissions were creating constant sales pressure. This imbalance made long-term growth nearly impossible.
Another issue was governance concentration.
Large players, including Aura Finance, had significant influence over decisions. This created misaligned incentives within the ecosystem.
The exploit in November 2025 only made things worse as it introduced ongoing legal risks tied to the existence of a corporate entity.
According to Fernando Martinelli, this made the structure unsustainable and shutting down Balancer Labs removes that liability and pushes the protocol closer to a fully decentralised model.
Meanwhile, operations are expected to continue under a new structure to ensure development and maintenance do not come to a halt.
Balancer (BAL) price forecast
At press time, the BAL token was currently trading near $0.15, just slightly above its recent lows.
This places it in a critical zone where sentiment can shift quickly. The first key level to watch is the recent support around $0.126.
A break below this level could signal further downside and loss of confidence.

On the upside, resistance sits near $0.1785, which has capped price movements in recent weeks.
A sustained move above this level would suggest improving sentiment as the market reacts to the overhaul. Beyond that, the $0.20 level becomes an important psychological barrier.
Traders should watch how the price behaves relative to the proposed buyback zone. If buybacks are executed effectively, they could provide a strong floor for price action.
However, the biggest factor remains execution.
The success of the overhaul will determine whether the Balancer (BAL) price stabilises or continues to struggle.

Regulation is poised to reshape Decentralized Finance into a tightly interconnected network of ecosystems, each with its own risk, compliance and access profile. It won’t carve DeFi into two isolated camps—one fully compliant and the other entirely open—but rather will knit together multiple lanes that can interoperate at the contract level. This perspective, offered by Mitchell Amador, founder and CEO of Immunefi, suggests a future where regulatory pressure in 2026 accelerates a layered DeFi world that embraces both permissionless innovation and regulated access.
Amador argues that DeFi has never operated as a single monolith. Instead, it has always lived in parallel lanes that cater to different risk appetites and user bases. The first lane remains permissionless: anyone can deploy, provide liquidity or use leverage without identity verification. This is where price discovery and stress testing occur in public view, and where the sector has historically moved faster than traditional financial players. A second lane includes protocols with built-in safeguards—liquidation rules, governance structures and oracle protections—yet without identity requirements. The newest tier adds a heavily controlled access point, with KYC, geofencing and compliance filters at the gateway. Yet the same underlying smart contracts can be reached through various entry points.
Key takeaways
- DeFi operates across multiple compliance lanes today. Permissionless networks coexist with guarded but non-identifying protocols, creating a spectrum of risk management and liquidity options.
- Liquidity drives cross-lane interoperability. Capital seeks onchain liquidity, 24/7 global access and rapid settlement, pushing regulated sectors to engage with permissionless infrastructures.
- The GENIUS Act and institutional appetite for yield push activity into DeFi. By limiting yield-bearing stablecoins, regulators redirect capital toward DeFi protocols that offer attractive, onchain returns.
- Security innovation begins in open markets and travels downstream. Lessons from permissionless ecosystems—bug bounties, real-time monitoring and AI threat detection—will inform institutional-grade defenses once proven effective.
Liquidity as the bridge between lanes
One of the central premises is that complete isolation of compliant DeFi is unlikely. Institutional participants will demand the liquidity and depth that onchain markets provide, including 24/7 access and fast settlement that traditional venues struggle to match. This dynamic means regulated platforms will increasingly ride on top of permissionless liquidity pools, rather than exist in a vacuum separate from the open sector. The GENIUS Act—widely discussed for its stance on yield-bearing stablecoins—illustrates a regulatory nudge that redirects capital toward onchain protocols in search of reliable returns.
Amador notes that the incentive to access deep liquidity is powerful enough to tolerate some complexity and risk, at least in the near term. If the onchain liquidity proposition remains compelling, the market will continue to push for more integrated frameworks where regulated actors can participate meaningfully without sacrificing core advantages of permissionless markets.
Security as an arena-driven evolution
Despite a recent history of high-profile exploits, Amador emphasizes that the center of gravity for robust security innovation will continue to sit in permissionless DeFi. The sector has produced a suite of defensive tools—bug bounty programs, real-time monitoring, and increasingly sophisticated AI-driven threat detection—that mature and then migrate to institutional environments as confidence in these approaches grows. The article notes that even as losses from hacks and exploits have topped billions in recent periods, the onchain security playbook developed in the open market remains the most effective proving ground for new defenses, which can later be standardized for broader adoption.
As part of this evolutionary cycle, onchain “firewalling” and automated vulnerability scanning are likely to become standard in open DeFi and subsequently form a core part of institutional risk management. The broader message is that adversarial conditions—where security is truly stress-tested—drive the best defenses, and those defenses can lift the entire ecosystem as they are adopted across lanes.
Regulation as a catalyst for a connected DeFi future
The overarching forecast is not a fracturing of DeFi into incompatible silos but a maturation toward a set of interoperable layers that remain deeply linked through onchain architecture. Regulation is expected to mold the ecosystem into tiers with varying compliance and access permissions, while preserving the composability that makes DeFi uniquely powerful. For investors and builders alike, the implication is clear: regulatory clarity will invite more institutions to participate, not by abandoning innovation, but by plugging into a broader, more liquid and efficient network.
In this view, TradFi’s distance to DeFi shortens as institutions seek the efficiency and scale of decentralized markets. The structural advantages of onchain liquidity—nonstop operation, settlement speed and depth—remain compelling enough to motivate regulatory models that accommodate both innovation and risk controls. As Amador frames it, the future of DeFi is not a binary choice between compliant and permissionless worlds; it is a layered, networked ecosystem where governance, access and security evolve in tandem with regulatory expectations.
“The future of DeFi hinges on interoperability,” Amador writes, a sentiment echoed by observers who view regulation as a unifying force rather than a dividing line. As policymakers refine frameworks, the industry will continue to test and standardize security innovations in the open, with the expectation that these advances become the backbone of institutional adoption as well.
Related commentary notes the growing interest in onchain alpha for sophisticated trading firms, underscoring how traditional finance is increasingly looking to open markets for liquidity and efficiency. For further context, see discussions around onchain opportunities for Wall Street’s advanced traders and the ongoing regulatory debates shaping yield and custody models in crypto markets.
Readers should keep an eye on how regulators define access gates and risk controls across different DeFi lanes, and which platforms prove most adept at maintaining liquidity while safeguarding users. The next set of policy decisions could determine which lanes become the default rails for institutional participation and which remain vibrant, experimental corridors that continue to push innovation forward.

XRP (XRP) stayed under pressure as traders watched resistance near the upper end of its recent range.
Summary
- XRP traded near $1.40 as a supply wall between $1.57 and $1.59 capped recovery attempts.
- Binance whale outflows fell to the lowest level since February, pointing to slower large-holder activity.
- Analysts tracked breakout retest signals, while exchange reserve trends continued showing unusual XRP behavior patterns.
The token traded at about $1.40, while market data showed a supply wall between $1.57 and $1.59. That zone has limited the pace of recovery after the losses seen in February.
XRP traded near $1.42 at the time of reporting, with a 24-hour trading volume of about $2.46 billion. The token posted a small daily gain of 0.42%, but it remained down 5.95% over the last seven days. Its market cap stood at about $87.09 billion, based on a circulating supply of 61 billion XRP.
Price action has stayed weak as XRP struggles to move back above nearby resistance. Market data points to heavy supply between $1.57 and $1.59, and that area has capped recent upside attempts. As long as XRP stays below that band, traders may keep watching for more range-bound movement.
Crypto analyst Javon Marks said XRP is showing strength on lower time frames after “what looks to be a macro breakout retest.” He added that this retest could support a continuation move if buyers keep defending the current zone.
Marks also repeated his long-term target of $15 or higher for XRP. That call remains far above the current market price, but his view has added to the debate around whether XRP is forming a base after the recent pullback. For now, the chart still shows a market trying to stabilize below a major supply zone.
Exchange reserve data shows unusual pattern
CryptoQuant analyst APTRekt said XRP has shown a different pattern from many other crypto assets. In many markets, price gains often come with falling exchange reserves as investors move coins off exchanges. In XRP’s case, reserve balances on Binance have often risen alongside price increases.
The analyst also said exchange inflows and outflows tend to rise before strong price moves, with inflows usually higher than outflows. That pattern suggests that selling activity remains active even before rallies begin. It also shows that XRP’s price behavior may not follow the usual spot accumulation model seen in other assets.
In addition, another CryptoQuant analyst, Arab Chain, said Binance whale outflows for XRP over 30 days dropped to about 1.285 billion XRP, the lowest level since early February. The reading points to slower withdrawal activity from large holders.
Lower whale outflows may mean more XRP is staying on exchanges instead of moving into long-term storage. That could reflect a cautious stance among large investors as they wait for a clearer market direction. If this trend continues, traders may keep watching exchange activity closely for signs of renewed demand or added selling pressure.

Tether, the crypto company behind the most popular stablecoin USDT, said Tuesday it has selected a “Big Four” auditing firm to conduct its first full financial statement audit.
“The Big Four Firm was selected through a competitive process because the organisation is already operating at Big Four audit standard,” said Simon McWilliams, Chief Financial Officer of Tether. “The audit will be delivered.”
The company has long published periodic attestations of the assets backing the value of its $184 billion U.S. dollar stablecoin USDT. A full audit goes further: It requires a detailed review of assets, liabilities, controls and reporting systems.
Tether did not name the firm that will complete the audit. The Big Four term is used for top accounting firms Deloitte, EY, KPMG, and PwC.
The move follows years of criticism over whether Tether has fully demonstrated that USDT is fully backed by reserves. The company says its holdings consist largely of U.S. Treasury bills, along with smaller allocations to gold, bitcoin and a range of loans. That mix has drawn scrutiny from critics who question the liquidity and risk profile of some assets, especially during periods of market stress.
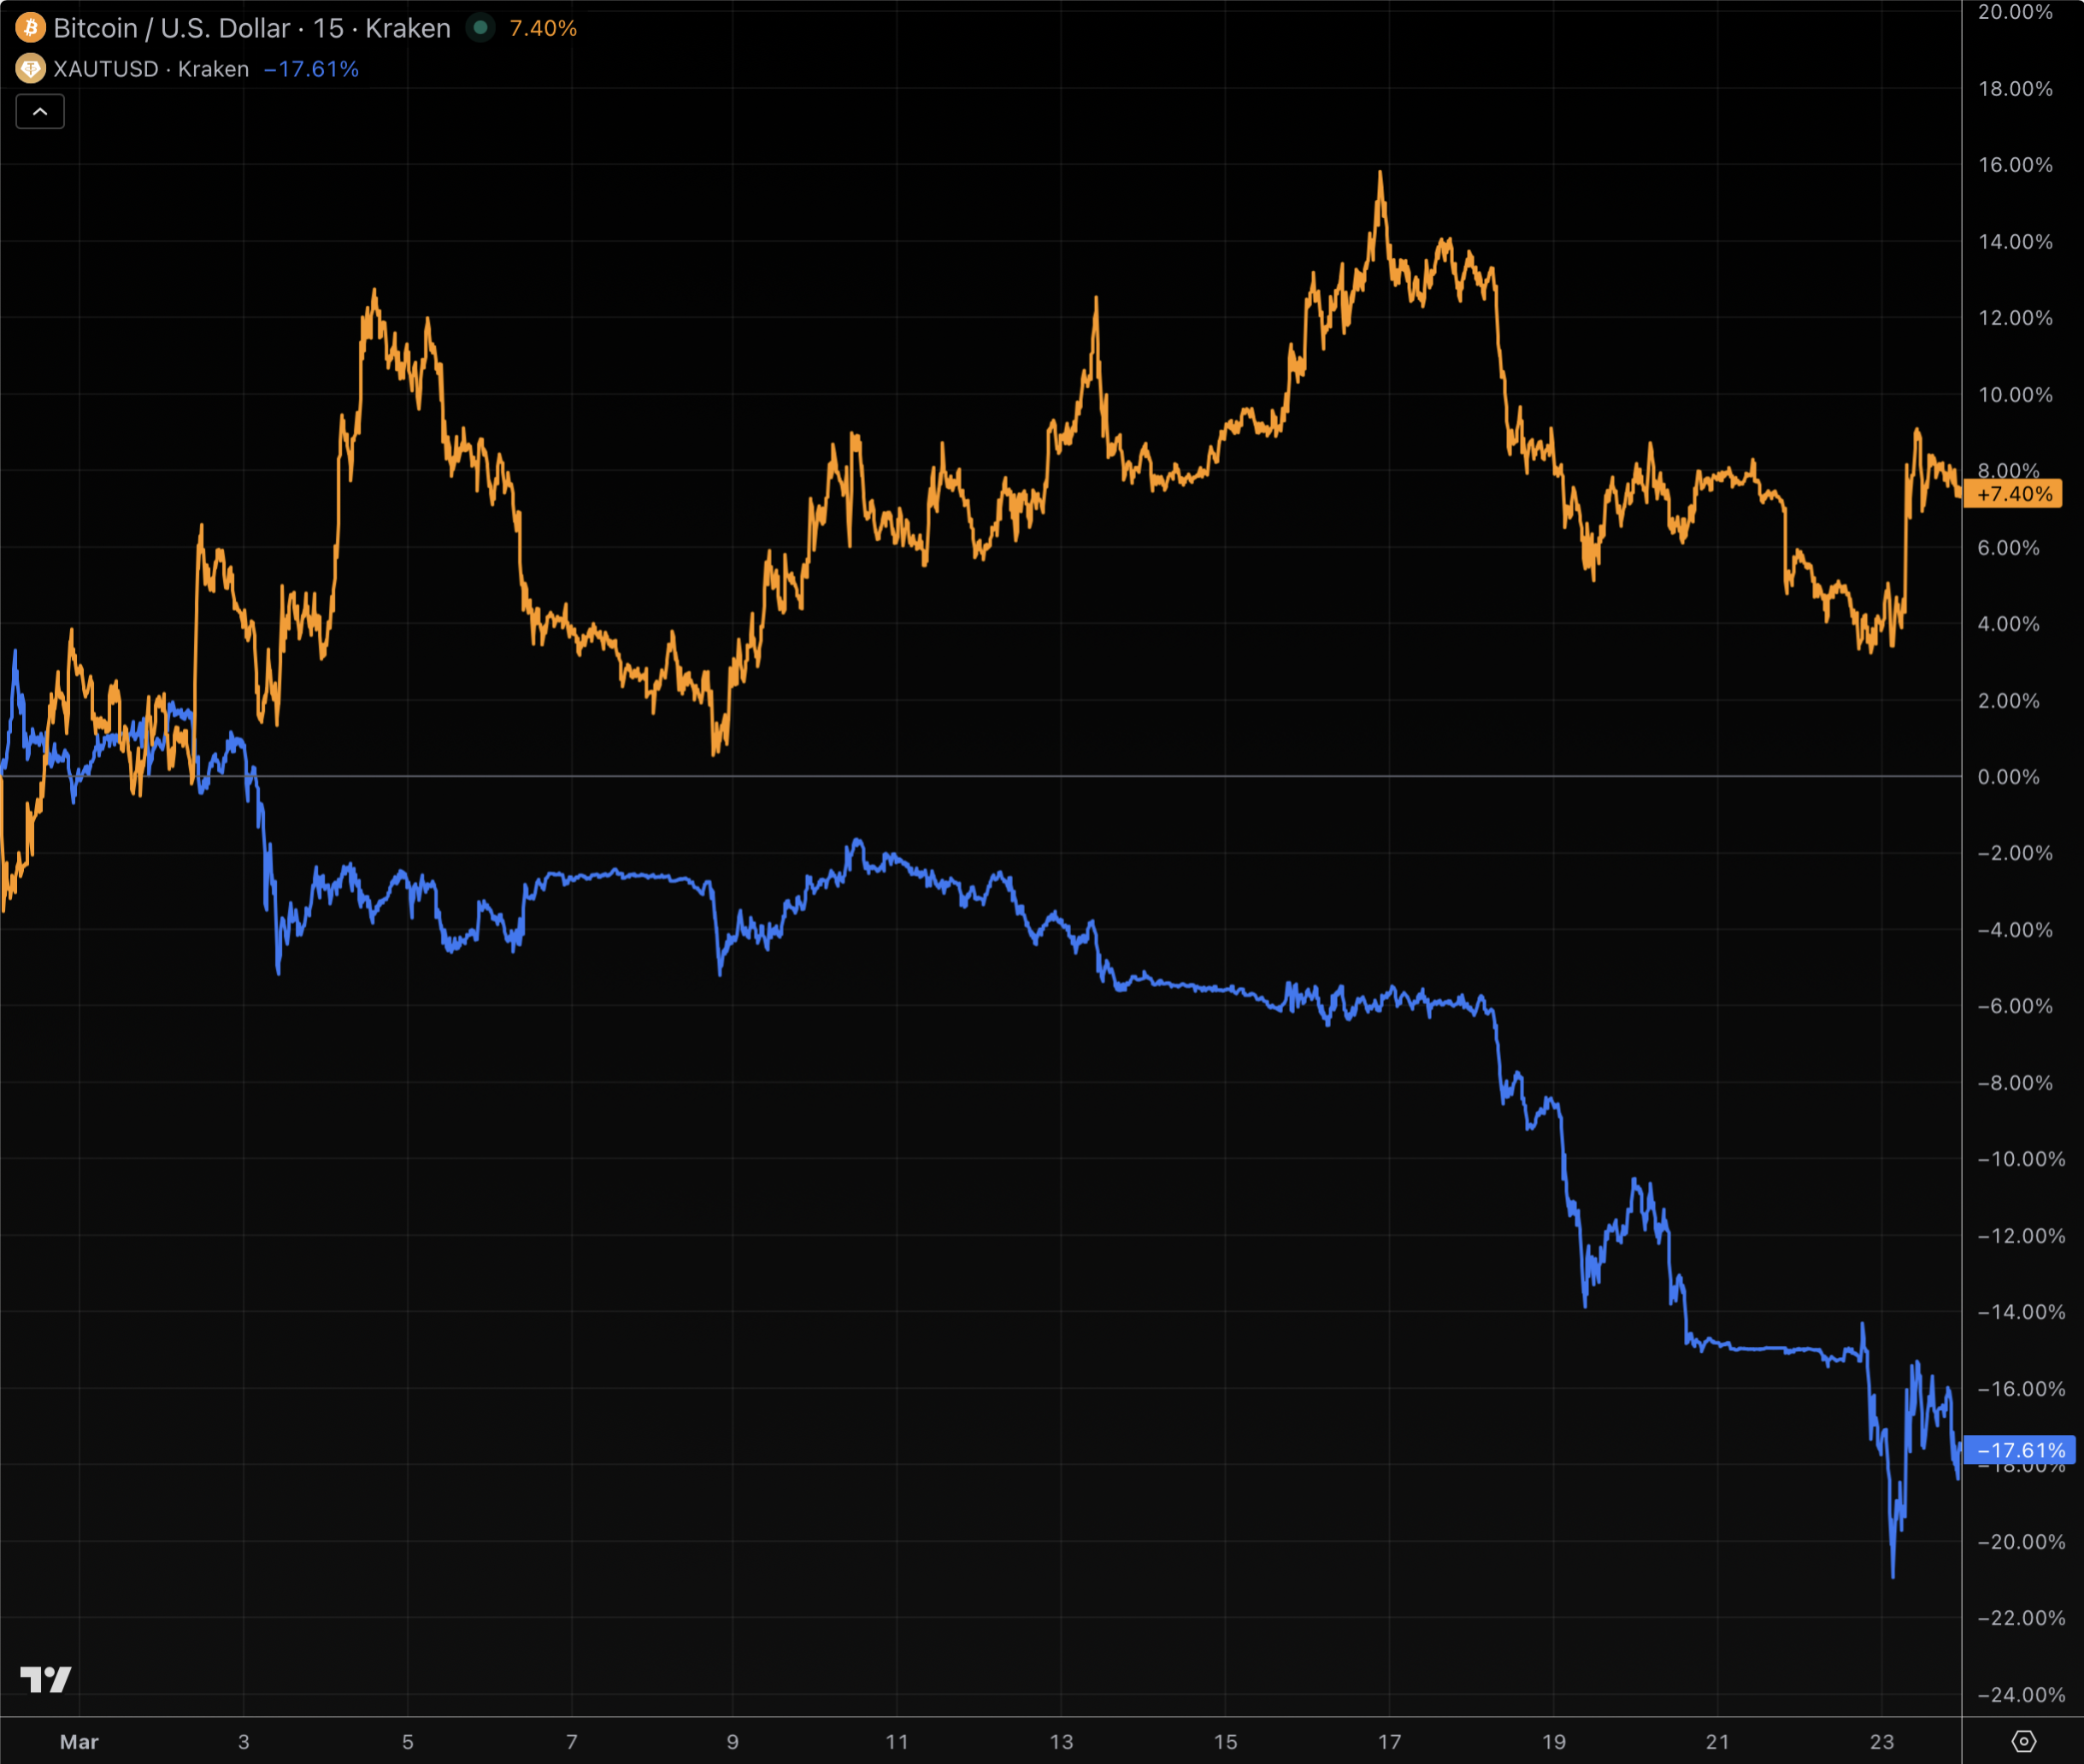
Since Donald Trump joined Israel’s war with Iran at 1:15am New York time on February 28, bitcoin (BTC) has rallied 8% while gold has fallen 18%.
At the onset of war, BTC was trading at $65,492 and gold was at $5,279 per ounce. By Monday evening, however, BTC had jumped to $70,700 while gold had tumbled to $4,300.
All this means that BTC now buys 32% more gold than it did on the morning of Operation Epic Fury.
Indeed, the world’s most valuable precious metal shed 12% in a single week, its worst seven-day stretch since 1983. Investors who bought gold as war insurance watched their policy lose a fifth of its value in four weeks.

Safe haven investors get a margin call
Gold’s initial move on the start of the conflict was a fakeout. It spiked higher after the Strait of Hormuz oil tanker shipping lane closure but reversed hard.
US Treasury yields climbed and the dollar strengthened, two forces that typically dampen the price of gold regardless of how many warships are in the Persian Gulf.
The sizable SPDR Gold Shares ETF hemorrhaged $4.2 billion in the first week of the war, breaking the record for weekly outflows in the fund’s history.
Investors pulled 25 tonnes of physical gold backing from the world’s biggest gold ETF within seven days.
Bitcoin absorbed the same shock yet held onto its gain. It even outperformed the S&P 500 Index which has fallen over 3% since the war began.
Read more: How bombing Iran shifted oil and bitcoin prices
Bridgewater Associates founder Ray Dalio advised on the popular All-In podcast on March 3 that central banks are never going to want to buy BTC. “There is only one gold,” he claimed.
Since Dalio’s prediction, gold has dropped more than 15%. BTC, the asset Dalio dismissed, rallied.
Although BTC has performed well since the US authorized the bombing of Iran, it hasn’t outperformed gold over longer recent time periods. Year-to-date, the gold price is flat versus the 20% loss for BTC. Over the past 12 months, gold is up 44% versus a 17% loss for BTC.
Got a tip? Send us an email securely via Protos Leaks. For more informed news, follow us on X, Bluesky, and Google News, or subscribe to our YouTube channel.
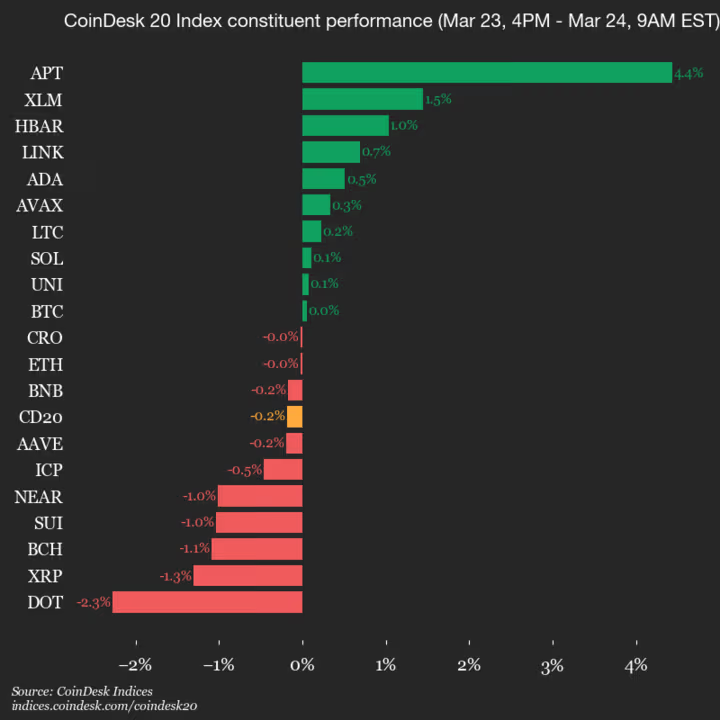
CoinDesk Indices presents its daily market update, highlighting the performance of leaders and laggards in the CoinDesk 20 Index.
The CoinDesk 20 is currently trading at 2044.07, down 0.2% (-3.83) since 4 p.m. ET on Monday.
Ten of 20 assets are trading higher.

Leaders: APT (+4.4%) and XLM (+1.5%).
Laggards: DOT (-2.3%) and XRP (-1.3%).
The CoinDesk 20 is a broad-based index traded on multiple platforms in several regions globally.
Kooc Media, a specialist PR distribution agency serving the crypto, fintech and iGaming industries, has announced the launch of dedicated PR services designed specifically for online casino and sportsbook brands. The new offering gives gambling operators, affiliates and iGaming startups access to guaranteed media placements across a network of high-authority news websites, combined with full newswire distribution to hundreds of partner outlets.
The iGaming industry continues to grow rapidly worldwide. New online casinos, sportsbook platforms and betting apps launch every month, all competing for visibility in a crowded market. For many of these brands, getting meaningful press coverage has been a persistent challenge. Traditional PR agencies often lack the specialist knowledge needed to work with gambling companies, and many mainstream publications refuse to cover iGaming content altogether.
Kooc Media has built its gambling PR services to address this gap directly. The agency operates its own network of in-house news websites, which means it can guarantee publication rather than relying on pitching journalists who may never respond. This model removes the uncertainty that has frustrated gambling brands working with conventional PR firms for years.
“Online casino and sportsbook brands face unique challenges when it comes to public relations,” said Michelle De Gouveia, spokesperson for Kooc Media. “Many agencies either don’t understand the iGaming space or won’t work with gambling companies at all. We built these services because we saw a real need for reliable, guaranteed PR distribution that actually delivers results for this industry.”
What the New iGaming PR Services Include
Kooc Media’s gambling PR packages cover everything an online casino or sportsbook brand needs to build media presence quickly. Services include press release writing, sponsored article creation, homepage feature placements on in-house websites, and distribution through partner news networks.
The agency’s in-house editorial team can handle the entire process from start to finish. Clients provide the key details about their brand, product launch or announcement, and Kooc Media writes the press release, publishes it across its owned media network, and distributes it through its newswire partners. Every campaign comes with full reporting and live links to each placement.
For brands that need wider reach, Kooc Media also offers distribution through major financial and business news networks. Depending on the package selected, press releases can appear on sites such as Business Insider, Bloomberg, Benzinga, MarketWatch and other well-known platforms. This gives iGaming companies access to the same calibre of media coverage that mainstream businesses receive.
All articles are published on Google News indexed websites, which means they can appear in Google News results and gain organic search visibility. For online casino and sportsbook brands competing in a market where search engine rankings matter enormously, this is a significant advantage.

Why Online Casinos and Sportsbooks Need Specialist PR
The online gambling industry operates under heavy regulation in most markets. Advertising restrictions, licensing requirements and compliance rules make it difficult for casino and sportsbook brands to promote themselves through standard marketing channels. Many social media platforms restrict gambling advertising, and paid search options are limited in several jurisdictions.
This makes earned media and PR coverage more important than ever for iGaming companies. A well-placed press release on a respected news website can drive brand awareness, build trust with potential players, and improve search engine rankings through high-quality backlinks. For new online casinos entering the market, PR coverage can be the difference between getting noticed and getting lost in the noise.
Kooc Media’s approach works well for iGaming brands because the agency already operates in this space. Its network of in-house websites includes publications that regularly cover finance, technology and digital entertainment topics. This means gambling-related content fits naturally within the editorial environment, rather than being forced into publications where it looks out of place.
The agency also understands the compliance side of iGaming PR. Press releases for online casinos and sportsbooks need to meet specific standards around responsible gambling messaging and regulatory accuracy. Kooc Media’s team is familiar with these requirements and ensures all content meets industry standards before publication.
Serving a Growing Market
The global online gambling market is projected to continue its strong growth over the coming years, driven by ongoing legalisation in new markets, the rise of mobile betting, and increasing consumer interest in live casino games and sports wagering. As more operators enter the market, the competition for player attention will only intensify.
Kooc Media sees its iGaming PR services as a long-term commitment to serving this sector. The agency already works with crypto projects, fintech companies and technology brands through its crypto PR services, and the expansion into dedicated gambling PR is a natural extension of its existing capabilities.
“The iGaming industry is moving fast, and the brands that succeed will be the ones that invest in building their public profile early,” said De Gouveia. “We offer same-day distribution, guaranteed placements, and access to major news networks. That combination is hard to find anywhere else, especially for gambling companies that have traditionally been underserved by the PR industry.”

How Kooc Media’s Model Differs from Traditional PR
Most traditional PR agencies work on a pitch-based model. They write a press release, send it to a list of journalists, and hope for coverage. There are no guarantees, and many campaigns result in little or no published coverage despite significant spend.
Kooc Media takes a different approach. Because the agency owns and operates its own media brands, it can guarantee that every press release will be published. Clients know exactly where their content will appear before they commit to a campaign. This performance-driven model has made the agency popular with crypto and fintech brands, and the company expects the same appeal among online casino and sportsbook operators.
The agency’s packages are designed to be straightforward. Clients choose a package based on the level of distribution they need, from in-house website placements through to full newswire distribution across hundreds of outlets. There are no hidden fees and no waiting weeks for results. Most campaigns are completed within 24 hours of approval.
About Kooc Media
Kooc Media is a specialist PR distribution agency founded in 2017. The company operates a network of in-house news websites including Blockonomi, CoinCentral, MoneyCheck, Parameter, Beanstalk and Computing. The agency provides PR services for the crypto, fintech, technology and iGaming industries, offering guaranteed media placements, newswire distribution and managed PR creation. Kooc Media serves clients worldwide from its UK headquarters.
Kooc Media’s gambling PR packages are available now through the company’s website at https://kooc.co.uk.
Disclaimer: This is a Press Release provided by a third party who is responsible for the content. Please conduct your own research before taking any action based on the content.


Omnes and Apex Group have announced plans to launch a tokenized debt note tied to Bitcoin mining activity on Base. The product will package Bitcoin hashrate exposure into an onchain financial instrument aimed at professional investors outside the United States.
Summary
- Omnes and Apex will issue OMN on Base, bringing Bitcoin hashrate exposure to approved investors.
- The secured debt note targets institutions seeking Bitcoin mining exposure without managing hardware or facilities exposure without managing hardware or facilities.
- The launch comes as tokenized real-world assets remain near $23 billion across public blockchains.
Meanwhile, financial technology firm Omnes and financial services provider Apex Group said they will tokenize the Omnes Mining Note, or OMN, on Base. Base is Coinbase’s Ethereum layer-2 network, and the companies said the note will be issued and managed there.
The OMN is structured as a secured debt note backed by Bitcoin hashrate. The product is designed to give approved investors exposure to new Bitcoin production without requiring them to operate mining machines or manage mining sites.
Apex said the note offers institutional investors “direct economic exposure to new Bitcoin production measured in hashrate.” The structure is meant to remove the need to handle hardware, power sourcing, and facility management.
The companies said the product will use hashrate as its core reference point. Hashrate refers to the computing power used to secure the Bitcoin network and generate new coins through mining activity.
Moreover, the OMN applies a familiar debt note structure while adding blockchain-based transfer features. According to the announcement, approved investors will be able to transfer the note onchain within a regulated framework. Omnes CEO Emmanuel Montero said,
“Bitcoin mining is the only mechanism that creates new Bitcoin through protocol issuance.”
He added that this model differs from yield strategies that depend on existing Bitcoin already in circulation.
While the structure expands access to Bitcoin mining exposure, some parts of the product remain unclear. The announcement did not fully explain how hashrate performance will convert into investor returns.
The companies also did not provide full details on the note’s liquidity terms or its risk profile. Those details may matter for investors assessing how the product would perform under changing mining and market conditions.
Additionally, the launch comes as tokenized real-world assets keep expanding in 2026. Data from DefiLlama showed on March 11 that tokenized RWAs on public blockchains reached about $23.6 billion, up 66% since the start of the year.
At the time of reporting, the onchain market cap for tokenized RWAs stood near $23 billion. The OMN adds another category to that market by linking a structured note to Bitcoin mining output.
Crypto World
Foundation launches developer platform for institutions, taps Mastercard, Western Union and Worldpay

The Solana Foundation is launching a new developer platform aimed at making it easier for financial institutions to build blockchain-based products, with early users including Mastercard, Western Union and Worldpay.
The Solana Developer Platform (SDP), currently available for developers to test, is a toolkit that enables enterprises to create and scale financial applications on Solana without deep crypto infrastructure expertise. The SDP will also integrate AI tools such as Anthropic’s Claude Code and OpenAI’s Codex.
The platform bundles services from more than 20 infrastructure providers — spanning custody, compliance, wallets and payments — into a single interface, streamlining what has traditionally been a fragmented process for institutions entering the space.
At launch, SDP includes two live modules. The issuance module enables companies to create tokenized deposits, stablecoins and tokenized real-world assets, while the payments module supports fiat and stablecoin flows, including on- and off-ramps and onchain transactions. A trading module is expected later in 2026.
The involvement of traditional payments firms underscores growing institutional interest in blockchain-based settlement. Mastercard is exploring stablecoin settlement on Solana, while Western Union is testing cross-border payments on the platform. Worldpay is focusing on merchant settlement and tokenized assets.
“As Solana continues to be the most trusted and innovative infrastructure for payments and financial companies worldwide, SDP provides an accessible and familiar experience for institutions and enterprises to start building products on Solana today,” the Solana Foundation wrote in a press release shared with CoinDesk.
Read more: Solana Foundation’s Liu: Focus on finance, not gaming ‘misadventures’

October success creates fresh opportunity as Blue Jays return home

Afghan Taliban government frees American held since January 2025
RBC Capital maintains Outperform on Karyopharm stock after trial data

Smart energy pays enters the US market, targeting scalable financial infrastructure

Why Israel is blocking foreign journalists from entering

Bitcoin: We’re Entering The Most Dangerous Phase

**RIPPLE/XRP REPRICING AFTER CLARITY ACT** GARLINGHOUSE PREDICTS CLARITY BY APRIL… $10 IMMINENT

Australian Financial Review cartoon sparks controversy in Jewish community

money counting machine #shortsfeed #shorts #money #cash
-
 Crypto World4 days ago
NIO (NIO) Stock Plunges 6.5% as Shelf Registration Sparks Dilution Worries
-

 Fashion4 days ago
Weekend Open Thread: Adidas – Corporette.com
-

 Politics4 days ago
Jenni Murray, Long-Serving Woman’s Hour Presenter, Dies Aged 75
-
 Tech7 days ago
Are Split Spacebars the Next Big Gaming Keyboard Trend?
-

 Crypto World3 days ago
Best Crypto to Buy Now: Strategy Just Spent $1.57 Billion on Bitcoin During Fear While Early Investors Quietly Enter Pepeto for 150x Potential
-

 News Videos6 days ago
RBA board divided on rate cut, unusually buoyant share market | Finance Report | ABC NEWS
-

 Crypto World3 days ago
Bitcoin Price News: Bhutan Sells $72 Million in BTC Under Fiscal Pressure, but the Smart Money Entering Pepeto Sees What the Market Does Not
-

 Politics6 days ago
The House | The new register to protect children from their abusers shows Parliament at its best
-

 Tech4 days ago
inKONBINI Lets You Spend Summer Days Behind the Register
-
 Politics7 days ago
Real-time pollution monitoring calls after boy nearly dies
-

 Crypto World6 days ago
Canada’s FINTRAC revokes registrations of 23 crypto MSBs in AML crackdown
-

 Sports1 day ago
Remo Stars and Kano Pillars Strengthen Survival Hopes in NPFL
-
 NewsBeat6 days ago
Residents in North Lanarkshire reminded to register to vote in Scottish Parliament Election
-

 News Videos6 days ago
PARLIAMENT OF MALAWI – PAC MEETING WITH REGISTRAR OF FINANCIAL ON AMARYLLIS HOTEL – INQUIRY LIVE
-

 Politics5 days ago
Gender equality discussions at UN face pushbacks and US resistance
-

 Business2 days ago
No Winner in March 21 Drawing as Prize Rolls to $133 Million for Next
-

 Business6 days ago
Who Was Alex Pretti? 5 Key Facts About the ICU Nurse Killed by Federal Agents in Minneapolis
-

 Sports1 day ago
Gary Kirsten Accuses Pakistan Cricket Board Of ‘Interference’, Mohsin Naqvi Responds
-

 Tech2 days ago
Give Your Phone a Huge (and Free) Upgrade by Switching to Another Keyboard
-

 Sports4 days ago
2026 Kentucky Derby horses, odds, futures, preview, date: Expert who nailed 12 Derby-Oaks Doubles enters picks
You must be logged in to post a comment Login