
Crypto World
MSBT’s 0.14% fee shakes market


The bitcoin ETF fee war reached its lowest point ever today as Morgan Stanley’s MSBT launched at 0.14% annually on NYSE Arca, directly undercutting every competing spot bitcoin fund in the US market, from BlackRock’s IBIT at 0.25% to Fidelity’s FBTC at 0.25% to Grayscale’s Bitcoin Mini Trust at 0.15%.
Summary
- MSBT’s 0.14% is the lowest fee ever set by a US spot bitcoin ETF; for every $10,000 invested, holders save $11 annually versus IBIT — a gap that reaches $110,000 per year at a $100 million institutional allocation
- Morgan Stanley’s 16,000 financial advisors, who previously could only recommend third-party bitcoin ETFs from BlackRock or Fidelity, now have a house-branded product that redirects management fee revenue back to the bank
- IBIT retains a significant structural advantage with approximately $70.6 billion in assets and the deepest liquidity in the spot bitcoin ETF market; for active institutional traders, IBIT’s tight bid-ask spreads likely outweigh the 11-basis-point fee gap
The bitcoin ETF market entered a new competitive phase today as Morgan Stanley’s MSBT set a fee floor that every existing fund now sits above. As Unchained Crypto reported, the full fee ranking now stands: MSBT at 0.14%, Grayscale Bitcoin Mini Trust at 0.15%, Bitwise BITB at 0.20%, ARK 21Shares ARKB at 0.21%, and both BlackRock’s IBIT and Fidelity’s FBTC at 0.25%. Grayscale’s Bitcoin Mini Trust, previously the cheapest option since it launched in July 2024, now sits in second place.
Phong Le, CEO of Strategy, publicly dubbed MSBT “Monster Bitcoin” following the launch announcement — a reflection of how the market views the combination of Morgan Stanley’s distribution reach and the lowest cost in the category.
The fee difference between MSBT and IBIT is 11 basis points. At the retail level, that translates to $11 per year on every $10,000 invested. At a $10 million institutional allocation, the annual saving is $11,000. At $100 million, the gap is $110,000 per year. Over a five-year horizon at that scale, the difference reaches $550,000 before accounting for any divergence in performance tracking or liquidity costs.
The question for existing IBIT holders is whether switching is financially rational. IBIT’s $70.6 billion in assets and dominant options trading volume give it liquidity advantages that support large trades at tighter spreads. For institutions that trade frequently, those execution savings likely outweigh the fee gap. For long-term, infrequent allocators, MSBT’s lower cost compounds meaningfully over time.
Why This Is Structurally Different From Prior Fee Competition
Every fee reduction in the spot bitcoin ETF market until today came from asset managers competing against each other. MSBT is the first fee reduction driven by a bank issuing directly under its own name. That distinction matters for distribution. Since 2024, Morgan Stanley’s 16,000 advisors have been permitted to recommend third-party ETFs, with management fees flowing to BlackRock or Fidelity. MSBT redirects that revenue stream in-house for the first time.
As crypto.news reported, MSBT enters a market where IBIT and FBTC have collectively drawn over $74.3 billion in net inflows. The arrival of a bank-issued, lower-cost option with a captive advisor network introduces a competitive dynamic the spot bitcoin ETF market has not previously seen.
As crypto.news noted, Bitwise advisor Jeff Park argued at the time of the S-1 filing that Morgan Stanley building a branded product confirms the total addressable market is larger than the industry anticipated — because a bank with $9.3 trillion in client assets would not build proprietary infrastructure for a market it did not believe would grow.
Early MSBT flow data over the coming sessions will be the first real signal of whether fee leadership alone can drive meaningful adoption in a market where BlackRock’s first-mover liquidity advantage has proven resilient for over two years.


SBI Holdings has begun talks to acquire the Bitbank exchange, expanding its crypto footprint in Japan amid strategic sector consolidation. The move would strengthen Ripple-linked infrastructure as SBI deepens its digital asset strategy across institutional and retail channels. Regulatory changes in Japan are supporting broader institutional participation in crypto markets, contributing to financial modernization of the economy.
Ripple Affiliate SBI Holdings Advances Bitbank Acquisition Plans
SBI Holdings confirmed talks with Bitbank after signing a letter of intent to advance potential acquisition discussions in the Japanese market. The company aims to make Bitbank a consolidated subsidiary after completion of due diligence and regulatory approvals. Final structure and timing depend on approvals and ongoing assessments by relevant authorities in Japan.
SBI says it seeks greater control over Bitbank to strengthen group integration and operational efficiency across subsidiaries. The firm plans to leverage synergies across its crypto-related units to support expansion and market penetration, boosting scalability. It notes Bitbank’s strong security record as a key factor in its evaluation of the competitive exchange landscape.
By welcoming Bitbank into its group, SBI aims to build domestic dominance in the crypto sector over the coming years. SBI also notes potential regulatory shifts under the Financial Instruments and Exchange Act framework reform direction for risk management. The company expects greater market consolidation as rules evolve and compliance standards tighten across ecosystems.
Metaplanet Expands Bitcoin Strategy Through Bond Financing
Metaplanet continues expanding its Bitcoin holdings through capital-market fundraising strategies in response to growing institutional demand and momentum. The firm recently issued fifty million dollars in bonds to purchase more Bitcoin through a structured debt-financing process. This move reflects rising corporate interest in Bitcoin accumulation strategies in Japan amid global treasury diversification trends.
Metaplanet strengthens its position as institutional adoption of Bitcoin grows globally on corporate balance sheets. The company aligns its treasury strategy with digital-asset diversification trends in a competitive, efficiently managed financial environment. Market participants view this as part of a broader corporate crypto shift driven by macroeconomic uncertainty.
Bond issuance allows Metaplanet to expand Bitcoin exposure without immediate equity dilution for existing shareholders. The firm continues to build a long-term digital-asset reserve strategy with disciplined capital allocation. Japan’s corporate sector shows growing interest in Bitcoin-based financial structures and structured investment vehicles.
SBI Broadens Crypto Ecosystem Through Partnerships and Acquisitions
SBI has partnered with Visa to develop crypto-linked payment card services to expand digital payments adoption across Japan. The program lets users convert rewards into major digital assets through an integrated fintech infrastructure and rewards system. The initiative connects traditional payments with blockchain-based settlement systems, supporting faster transaction processing and cross-border payment efficiency.
SBI previously acquired BitPoint Japan to expand its domestic crypto footprint and strengthen its exchange-network presence. The group continues consolidating operations to improve efficiency across subsidiaries and reduce operational redundancy. It seeks a stronger position in regulated digital-asset markets under evolving compliance frameworks.
Japan’s evolving regulations create opportunities for large financial conglomerates in the digital finance sector. SBI positions itself for long-term growth in the crypto sector through strategic investment alignment. The company expects integration across exchanges and payment systems to accelerate as the ecosystem matures.
Crypto World
Berkshire Hathaway’s shopping extravaganza draws lighter crowds as spotlight shifts to Greg Abel

Squishmallow display the Berkshire Hathaway Annual Shareholders Meeting in Omaha, NE on May 1, 2026.
Sarah Min | CNBC
OMAHA, Nebraska — At the cavernous exhibit hall inside CHI Health Center Omaha, the annual “Berkshire Bazaar of Bargains” is still stocked with fan-favorite deals, just with a bit more breathing room this year.
The 20,000-square-foot shopping event tied to Berkshire Hathaway‘s annual meeting features its usual lineup: Warren Buffett-themed gear from Brooks Sports and chocolate coins from See’s Candies, alongside merchandise from dozens of subsidiaries. But unlike past years, lines were shorter and the crowds noticeably thinner.
The event came as Buffett, the 95-year-old chairman who has defined the gathering for decades, is no longer expected to headline the marquee Q&A session in the same way, ceding the spotlight to Greg Abel, who took over as CEO at the beginning of 2026.
Abel made a point of stopping by every booth in the hall, greeting employees and shaking hands with shareholders. Lines of shareholders formed as he made his way through the hall.
Greg Abel, CEO of Berkshire Hathaway, meets with shareholders at the Berkshire Hathaway Annual Shareholders Meeting in Omaha, NE on May 1, 2026.
David A. Grogan | CNBC
Squishmallows — the plush toy phenomenon owned by Jazwares that Berkshire gained through its 2022 acquisition of Alleghany Corporation — once again pulled in crowds, including for a new Abel-themed plush.
Adam Padawer, president of Jazwares, told CNBC that Abel was “engaged, interested and involved,” noting the CEO helped design his own Squishmallow. The company also partnered with other Berkshire brands including BNSF Railway, NetJets, GEICO and See’s Candies on special-edition versions.
Squishmallow display the Berkshire Hathaway Annual Shareholders Meeting in Omaha, NE on May 1, 2026.
Sarah Min | CNBC
Squishmallows on display at the Berkshire Hathaway Annual Shareholders Meeting in Omaha, NE on May 1, 2026.
Yun Li | CNBC
Squishmallows on display at the Berkshire Hathaway Annual Shareholders Meeting in Omaha, NE on May 1, 2026.
Yun Li | CNBC
Squishmallows on display at the Berkshire Hathaway Annual Shareholders Meeting in Omaha, NE on May 1, 2026.
Yun Li | CNBC
See’s Candies — one of Berkshire’s most iconic brands — leaned into the moment with shelves of themed chocolate treats and cardboard cutouts of Buffett and Abel playing hockey, a nod to Abel’s Canadian roots and well-known love of the sport.
See’s Candies display at the Berkshire Hathaway Annual Shareholders Meeting in Omaha, NE on May 1, 2026.
Yun Li | CNBC
See’s Candies display at the Berkshire Hathaway Annual Shareholders Meeting in Omaha, NE on May 1, 2026.
Yun Li | CNBC
Brooks Running was also leaning into the Berkshire fandom, selling a 2026 special edition of its running shoes featuring “Berkshire Hathaway” branding along the side and on the insoles.
Nearly 2,000 shareholders are expected to take part in the Brooks “Invest in Yourself” 5K fun run and walk on Sunday morning following the annual meeting, with participants set to tackle a new course this year.
A Brooks show on display at the Berkshire Hathaway Annual Shareholders Meeting in Omaha, NE on May 1, 2026.
Yun Li | CNBC
Justin Boots display at the Berkshire Hathaway Annual Shareholders Meeting in Omaha, NE on May 1, 2026.
Yun Li | CNBC
A Pilot display at the Berkshire Hathaway Annual Shareholders Meeting in Omaha, NE on May 1, 2026.
Yun Li | CNBC
Signage for Marmon Holdings on display at the Berkshire Hathaway Annual Shareholders Meeting in Omaha, NE on May 1, 2026.
Sarah Min | CNBC

XRP’s social sentiment has surged in recent days, even as the token remains largely consolidating below a key price barrier. Aggregated social data points to heightened optimism, while developers and traders parse how new real-world use could translate into price upside.
Key takeaways:
- XRP’s social sentiment has risen about 240% over the past 30 days, reaching a two-year high.
- Rocketing adoption signals emerged after Ripple announced XRP integration with Rakuten Pay, enabling loyalty points worth over $23 billion to be converted into XRP and used across millions of merchants.
- Technically, XRP faces immediate resistance around $1.40, with a potential breakout needing to clear the $1.40–$1.45 zone to target roughly $2.10.
- On-chain and cost-basis data point to near-term selling pressure near a cost area of roughly $1.40–$1.45, potentially creating a supply wall ahead of a bullish move.
- Market sentiment from Santiment notes XRP’s bullish discourse remains elevated, even as price actions show a measured, cautious tilt rather than an immediate breakout.
Rakuten Pay tie-up fuels XRP optimism
The latest wave of enthusiasm derives from XRP’s integration with Rakuten Wallet, a prominent Japanese payments ecosystem. Rakuten’s platform serves more than 44 million users, and the partnership allows loyalty points—valued at over $23 billion—to be converted directly into XRP, traded within Rakuten’s in-app environment, and spent at more than 5 million merchant locations via Rakuten Pay. Ripple described the rollout as “one of the largest retail deployments of XRP as a payment method to date,” highlighting a practical bridge between loyalty programs, payments, and crypto utility in a major economy.
Industry observers immediately flagged the potential ripple effects. Santiment noted XRP’s sentiment metrics spiked in response, citing that the Positive/Negative sentiment ratio now sits at about 3.9—levels not seen since early 2024. The data point aligns with the firm’s observation that the market is increasingly pricing in broader adoption rather than mere speculative chatter. In a separate note, Santiment explained that while news-driven hype doesn’t guarantee an instant price breakout, the accumulation of adoption signals often precedes more persistent bullish momentum once fear of missing out cools off.
Market participants also highlighted the broader narrative: as an established payments rails integration becomes visible in a major economy, XRP could transition from a speculative asset into a practical utility token for everyday spending. Traders who have watched the Ripple ecosystem emphasize that this is a different kind of catalyst—one tied to real-world spend and customer engagement rather than purely macro-driven flows.
Price action and the technical backdrop
Following a recent rally that lifted XRP about 18% from a local low near $1.27, the price stalled near $1.48, which sits at the upper boundary of a symmetrical triangle that has framed price action since February. To spark a sustained up-leg, bulls must push through the $1.40–$1.45 resistance corridor, an area that also encompasses the 50-day exponential moving average and the 100-day simple moving average. The alignment of these moving averages around that zone adds to its significance as a potential turning point.
From a supply-demand perspective, Glassnode’s cost-basis distribution heatmap points to roughly 2 billion XRP held at an average cost between $1.40 and $1.45. This concentration implies a sizable cluster of holders could place selling pressure near break-even, potentially tempering near-term upside unless fresh buyers step in to absorb that supply.
If the price can clear this supply zone, the measured target of the existing triangle lies near $2.10, about 50% above current levels. Several technicians have signaled that a move above $1.40 would not only invalidate the current consolidation but also set up a faster run toward the upper echelons of the recent trading range.
Market commentary from peers echoed a cautious anticipation. ChartNerd, in a Friday X post, suggested a substantial move could be brewing once resistance above $1.40 is cleared. This view dovetails with broader coverage that notes XRP would need to sustain a move beyond $1.40 to shift the trend from consolidation to a sustained uptrend.
Meanwhile, the price context remains clear: XRP has retraced a portion of its late-2024/early-2025 run, with a long-term high near $3.66 set in July 2025. The current price level sits well below that peak, underscoring the distance to the prior highs even as adoption stories intensify. This dynamic helps frame why the market is paying attention to the Rakuten Pay development—because it could alter the typical risk/reward calculus for XRP holders if real-world usage compounds over time.
What to watch next in XRP’s evolution
Investors should monitor whether the Rakuten Pay integration translates into measurable activity in XRP on-ramps and spend velocity across Japan’s ecosystems. If the price can push decisively through the $1.40–$1.45 zone, a path toward the $2.10 target could materialize, yielding a roughly 50% uplift from current quotes. Conversely, a failure to clear this resistance with robust volume may extend the current consolidation, especially if cost-basis holders defend that $1.40–$1.45 band.
Beyond pure price action, the broader adoption signal is crucial. A sustained uptick in XRP-use cases would shift the narrative from speculative sentiment to tangible utilization, potentially supporting a more durable uptrend should retail and merchant uptake continue to grow. Conversely, if the Rakuten integration encounters friction or a slower-than-expected uptake, the rally could be tempered, reinforcing the view that the early enthusiasm may fade into a longer, sideways phase before any decisive breakout.
Analysts caution that sentiment data, while informative, does not guarantee immediate price moves. As Santiment observers noted, the current bullish chatter often accompanies a wave that subsides after the initial euphoria. Still, the combination of a major payments ecosystem integration and a favorable technical setup could set the stage for a noteworthy shift in XRP’s trajectory if buyers sustain the bid above the critical resistance band.
Readers should keep an eye on how liquidity evolves around the $1.40–$1.45 range, whether further utility-driven catalysts emerge, and how the macro environment influences risk appetite in cross-asset crypto markets. The next few weeks will be telling for whether XRP can convert social and on-chain optimism into a durable price breakout or if the market lapses into a longer period of accumulation below the high-water marks seen in 2025.

TLDR:
- McLaren joins Hedera Council, expanding governance reach and fan-driven digital collectibles rollout
- Agent Lab enables no-code AI agents on Hedera, integrating LangChain and Stablecoin tools
- FRNT stablecoin and tokenized RWAs push enterprise adoption across regulated blockchain systems
- Hedera surpasses 70B transactions as institutional players expand usage across finance and AI stacks
The HBAR Hedera ecosystem has progressed notably across governance, AI development, and enterprise adoption during 2026.
The recent McLaren joining of the council, Agent Lab launches, and tokenization activity expand across regulated finance, stablecoins, and global enterprise infrastructure networks in the 2026 period
Governance Expansion and McLaren Entry
McLaren Racing joined the Hedera Governing Council in 2026, expanding governance participation across global enterprise members and reinforcing institutional coordination within the network.
McLaren introduced digital collectibles across Formula 1 and IndyCar race weekends during the 2026 season, linking fan engagement to on-chain interactions through simplified access systems.
Council membership includes firms such as Google, IBM, NVIDIA, Deutsche Telekom, and Standard Bank, expanding enterprise representation across governance decisions.
McLaren’s participation aligns with the network’s focus on consumer engagement, digital assets, and data integrity across enterprise-grade infrastructure.
HederaCon 2026 is scheduled in Miami Beach alongside major industry events, including the Formula 1 Miami Grand Prix and Consensus 2026 discussions.
Simplified onboarding through Web2 social sign-in systems allows users without blockchain wallets to interact with Hedera-based applications and collectibles.
Sustained council expansion supports protocol governance, enterprise adoption, and integration of real-world applications across multiple sectors.
Network coordination continues through enterprise validators and governance participants who contribute to system reliability.
McLaren-branded collectibles expand consumer-facing blockchain interaction across seasonal racing events and digital ecosystems supported by Hedera infrastructure.
Such sustained participation from global enterprises reinforces operational scalability across Hedera. This is as governance coordination maintains alignment between consumer applications, tokenization frameworks, and regulated digital asset infrastructure throughout the 2026 development network growth cycle
Agent Lab and Enterprise AI Stack
Agent Lab launched in March 2026 as a browser-based environment for building on-chain AI agents across simplified development modes.
It integrates frameworks such as LangChain and Vercel AI SDK, enabling developers to deploy AI agents with reduced technical complexity.
Agent Lab connects to Hedera Agent Kit, enabling streamlined deployment of AI-driven applications across blockchain infrastructure systems.
Planned updates introduce Stablecoin Studio plugins, supporting token swaps, lending operations, and automated financial workflows within enterprise systems.
Verifiable Compute collaboration with NVIDIA and Deloitte enhances AI auditability, providing structured logs for regulated enterprise environments requiring transparency.
These developments align enterprise infrastructure with automation, compliance, and real-world asset interaction across financial and industrial use cases.
Developer adoption increases through low-code interfaces that reduce complexity for blockchain application creation and integration workflows.
Enterprise participants use these tools to support scalable deployments across regulated environments and tokenized financial systems.
Hedera-based infrastructure continues supporting interoperability across enterprise networks, enabling coordinated data processing, digital asset settlement, and AI-driven automation across multiple industry sectors.
Integration between AI tooling and blockchain infrastructure strengthens enterprise workflows, while supporting verifiable computation, tokenized settlement processes, and scalable application deployment across regulated digital ecosystems within enterprise technology governance frameworks and systems

Crypto World
Riot’s stock rises after AMD boosts data center capacity to a potential 150 megawatts power
Riot Platforms (RIOT) shares jumped about 8% on Friday after Advanced Micro Devices (AMD) expanded its capacity at the company’s Rockdale, Texas campus, highlighting Riot’s continued pivot from bitcoin mining into AI and high-performance computing.
According to the Q1 financial results, AMD exercised an option to double its contracted capacity to 50 megawatts (MW), with the potential to upsize to 150MW. According to the earnings transcript, Riot said the agreement could generate roughly $636 million over a 10-year term.
Riot also secured improved terms on its $200 million bitcoin-backed credit facility with Coinbase, lowering the rate to a fixed 6.15% from 8.3% and releasing 1,544 of pledged collateral bitcoin, signaling growing lender confidence in its expanding data center business.
Together with the AMD deal and improved credit terms, investors are paying a premium for the stock. “Market pricing in lower cost of capital as the expanded AMD deal drives lender confidence,” said Matthew Sigel, head of digital assets research at VanEck.
Riot was one of the last few ‘pure play’ mining companies left that didn’t get into hosting AI computing, while others opened up their data centers to move away from mining. Until recently, activist investor Starboard started to urge the management to accelerate its transition from bitcoin mining to an AI infrastructure provider.

The move to expand its data center business to host AI computers appears to be paying off for the Castle Rock, Colorado-based company.
The firm reported total revenue of $167.2 million for the quarter ended March 31, up from $161.4 million a year earlier, supported by $33.2 million in initial data center revenue. However, bitcoin mining revenue fell to $111.9 million from $142.9 million, mainly due to lower bitcoin prices and increased mining competition. The mining company’s shares are up about 147% over the last 12 months, while bitcoin fell nearly 17%.
The company, which previously held onto all its mined bitcoin, is also accelerating its bitcoin sales. According to Bitcoin Treasuries data, the company sold 3,688 BTC during Q1. The company ended March with 15,679 BTC and $282.5 million in cash.
Read more: The bitcoin treasury boom is unwinding as some companies and governments sell holdings
TLDR:
- Bitcoin holds near $78.4K as ETF inflows return, signaling stabilizing institutional demand.
- BlackRock and Fidelity lead Bitcoin ETF inflows while smaller funds see mixed outflow pressure.
- Ethereum ETF outflows persist for four days, reflecting weaker institutional risk appetite.
- Bitcoin ETF inflow rebound follows prior outflows, reinforcing selective institutional accumulation.
Bitcoin trades at $78,423.77 as of writing with $38,674,613,465 in 24-hour volume, rising 2.75% daily and 1.05% weekly amid ETF flow shifts.
Spot Bitcoin ETF net inflow of $23.5M signals renewed institutional demand. In the meantime, Ethereum ETFs have extended outflows, reinforcing divergence and supporting cautious accumulation trends around Bitcoin.
Bitcoin ETF Flow Reversal After Outflow Streak
According to SosoValue, Bitcoin spot ETF flows reversed after three days of outflows, recording a $23.5 million net inflow across issuers on April 30.
BlackRock IBIT and Fidelity FBTC led inflows, offsetting weaker performance from smaller competing ETF products and alternative providers.
Grayscale continued outflows due to higher fees, while Bitcoin price remained stable near key trading support levels during the session today. Trading data also showed concentrated activity among large asset managers during the rebound session.
Institutional participation increased modestly as ETF trading volumes rose alongside improved sentiment following Bitcoin price stabilization near support.
Macro expectations around interest rates also influenced ETF allocation decisions across regulated crypto investment products globally.
Market analysts noted ETF flows remain sensitive to short-term volatility, especially during uncertain geopolitical and economic conditions. ETF inflow patterns continue correlating with broader crypto market stabilization signals across trading venues.
Recent ETF flow behavior suggests selective accumulation of Bitcoin during consolidation phases across the market cycle.
Investor positioning data shows sustained interest in Bitcoin ETFs despite short-term volatility and mixed macro signals.
This pattern reinforces Bitcoin’s role as the primary digital asset exposure within regulated ETF investment frameworks globally. Such allocation behavior reflects ongoing preference for established liquidity pools within crypto ETF structures.
Ethereum ETF Outflows Signal Diverging Sentiment
Ethereum spot ETFs recorded four consecutive days of net outflows across major issuers, reflecting weaker institutional demand.
Investor rotation toward Bitcoin continued as Ethereum faced reduced near-term catalysts and weaker risk appetite exposure.
This divergence between Bitcoin inflows and Ethereum outflows widened across ETF markets during recent trading sessions. Liquidity concentration remains highest across top-tier Bitcoin ETF issuers in current market conditions.
Data indicate Ethereum ETFs are experiencing sustained redemption pressure compared with Bitcoin, which shows stabilizing capital inflows. Fee structures and liquidity depth continue influencing investor allocation across competing spot ETF products in crypto markets.
Market participants remain cautious as Ethereum flows suggest reduced conviction relative to Bitcoin dominance trends. Market observers continue monitoring Ethereum ETF performance for signs of sustained capital recovery.
Ongoing Ethereum ETF outflows reflect cautious positioning among institutional investors awaiting stronger ecosystem catalysts. Reduced allocation may indicate rotation toward assets with deeper liquidity and stronger historical ETF demand profiles.
ETF data continues to show divergence between Ethereum and Bitcoin allocation trends across regulated markets. These patterns continue shaping short-term allocation strategies among institutional crypto investors.
TLDR:
- LINK trades at $9.20, gaining 1.13% daily despite a 1.75% weekly pullback in a weak market structure
- Whale activity shows phased redistribution of LINK holdings, signaling steady supply rotation
- 24-hour volume near $179M reflects active participation amid ongoing consolidation phase
- Market structure remains range-bound as liquidity shifts between exchanges and private wallets
Chainlink (LINK) trades at $9.20 with $179,867,749 in 24-hour volume, reflecting a 1.13% daily gain despite a -1.75% weekly decline.
Chainlink whale activity continues to shape market structure as large holders redistribute millions of tokens during consolidation.
This mix of price recovery and ongoing supply shifts keeps liquidity dynamics tightly watched across the market.
Staggered Redistribution Across Whale Wallets
On-chain data tracking Chainlink whale activity indicates a gradual reduction in large wallet balances as nearly 18.94 million LINK moved across addresses over recent weeks during a structured redistribution phase.
Unlike abrupt sell-offs, the movement appears phased, suggesting deliberate liquidity release rather than panic-driven exits from major holders. Market observers note that such patterns often emerge during consolidation cycles.
This is where price direction remains range-bound while liquidity deepens across exchanges and OTC desks. It allows whales to distribute holdings in stages without causing sharp volatility spikes across the broader market structure over time. It also helps maintain steady liquidity conditions across the overall structure.
Recent exchange flows reinforce the view of redistribution within Chainlink whale activity as wallets linked to Binance recorded significant LINK withdrawals.
These transfers reduce exchange supply and shift tokens into private custody or long-term storage, lowering immediate sell pressure in spot markets.
On-chain trackers show accumulation behavior despite muted price action, indicating positioning ahead of ecosystem expansion and broader adoption across decentralized financial networks within the current market cycle phase.
Consolidation Phase and Shifting Supply Structure
Chainlink price action remains confined within a narrow consolidation range, with LINK trading near $9 after extended sideways movement between $8 and $10.
Despite subdued volatility, on-chain metrics indicate steady network engagement. This includes rising total value locked across Chainlink-enabled protocols and growing infrastructure usage.
Market participants continue monitoring the divergence between flat price movement and sustained ecosystem activity.
The ongoing development across data feeds, interoperability tools, and real-world asset integrations is linked to Chainlink’s infrastructure role in decentralized markets.
These conditions are aligned with reduced exchange supply and continued whale repositioning across market cycles. This is without immediate directional price expansion signals emerging.
Large wallet behavior continues to show gradual accumulation and redistribution patterns, reflecting strategic positioning among Chainlink whale participants.
These movements often coincide with extended consolidation phases where liquidity conditions remain stable, and exchange order books absorb distributed supply over time.
Tracking data suggests ongoing wallet dispersion across multiple addresses among top holders, indicating a gradual redistribution within the broader Chainlink ecosystem structure phase.
Market structure has remained influenced by reduced exchange balances and continued off-exchange movement of LINK.
Participants are observing wallet-level shifts across both retail and institutional segments as consolidation persists across broader crypto markets.
Crypto World
AI and blockchain infrastructure company Gency AI today announced it has raised $20 million in a new funding round
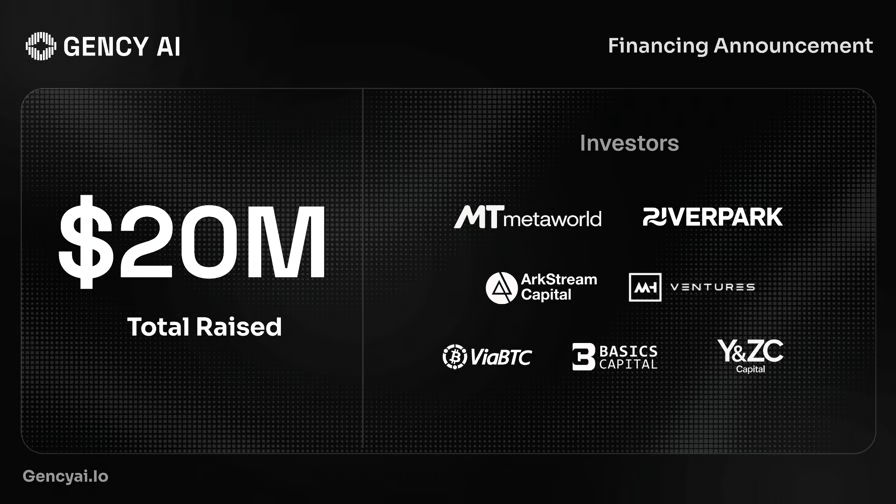
San Francisco, U.S.A., March 17, 2026 — AI and blockchain infrastructure company Gency AI today announced it has raised $20 million in a new funding round. The round saw participation from several institutions, including Y&ZC Capital, MTmetaworld Holdings, Riverpark, ArkStream, MH Ventures, ViaBTC and Basics Capital.
The fresh capital is earmarked for scaling Gency AI’s decentralized advertising execution and settlement network, hardening its privacy-preserving computing stack, and accelerating product deployment and ecosystem partnerships across North America, Asia, and Europe.
Building verifiable infrastructure for the advertising economy
The global digital advertising market continues to grow rapidly, but many execution and settlement processes still rely on centralized platforms. Industry participants have highlighted ongoing challenges related to attribution transparency, data ownership, and reconciliation cycles between advertisers, publishers, and agencies.

Gency AI aims to shift the industry from a model of “platform trust” to “protocol trust” by introducing on-chain verifiable credentials and automated revenue distribution mechanisms. Leveraging smart contracts and privacy-preserving computing technologies, ad impressions, conversion outcomes, and revenue allocation can be independently verified and settled automatically.
According to the company, the system is designed to automate reconciliation processes through smart contracts, with the goal of reducing settlement times and improving transparency in cross-border advertising transactions.
AI and blockchain–integrated technical architecture
Gency AI’s network architecture is built around four core modules:
Policy identity
Creates on-chain permission identities and usage boundaries for data, enabling transparent and traceable data authorization management.
ESQ privacy computing layer
Integrates technologies such as TEE, PSI, and MPC to support encrypted computation and privacy-preserving processing of advertising data.
PSG clearing and settlement protocol
Converts advertising actions and conversion outcomes into on-chain verifiable credentials and automatically executes revenue distribution through smart contracts.
AI optimization engine
Operates in an anonymous and encrypted environment to power advertising strategy prediction, audience matching, and campaign optimization. It also enables model training and attribution analysis without exposing raw user data, balancing privacy protection with operational efficiency.
Investor perspectives
Investors participating in the round said the convergence of AI automation and verifiable computing has the potential to reshape the core infrastructure of digital advertising, gradually shifting the industry from a model driven by closed data platforms to one powered by open protocols.
They also noted that as global privacy regulations tighten and demand for AI-powered automated advertising continues to grow, building a trusted, verifiable, and autonomously operating advertising network is likely to become a key direction for the industry.
About Gency AI
Gency AI is a sovereign advertising network purpose-built for the agentic economy — an environment where data ownership, permissions, execution, and settlement are designed to be programmable, verifiable, and controlled by users by default.
Unlike traditional adtech systems that depend on opaque data aggregation and trust-based reporting, Gency AI reimagines advertising as a verifiable coordination system. By combining cryptographic guarantees, on-chain policy enforcement, and measurable outcomes, it enables coordinated interactions among advertisers, publishers, AI agents, and users.
Media contact:

Ethereum (ETH) is coiling under a $2,300 while Bitcoin Dominance approaches a monthly death cross seen only twice in history, the kind of pairing that historically sets up an altseason.
The two charts move as mirrors. Ether is the largest altcoin, so sustained strength in ETH against bitcoin pulls capital away from BTC and pushes the dominance index lower, the textbook setup that has previously marked the start of an altcoin rotation.
Ethereum Price Targets $3,430
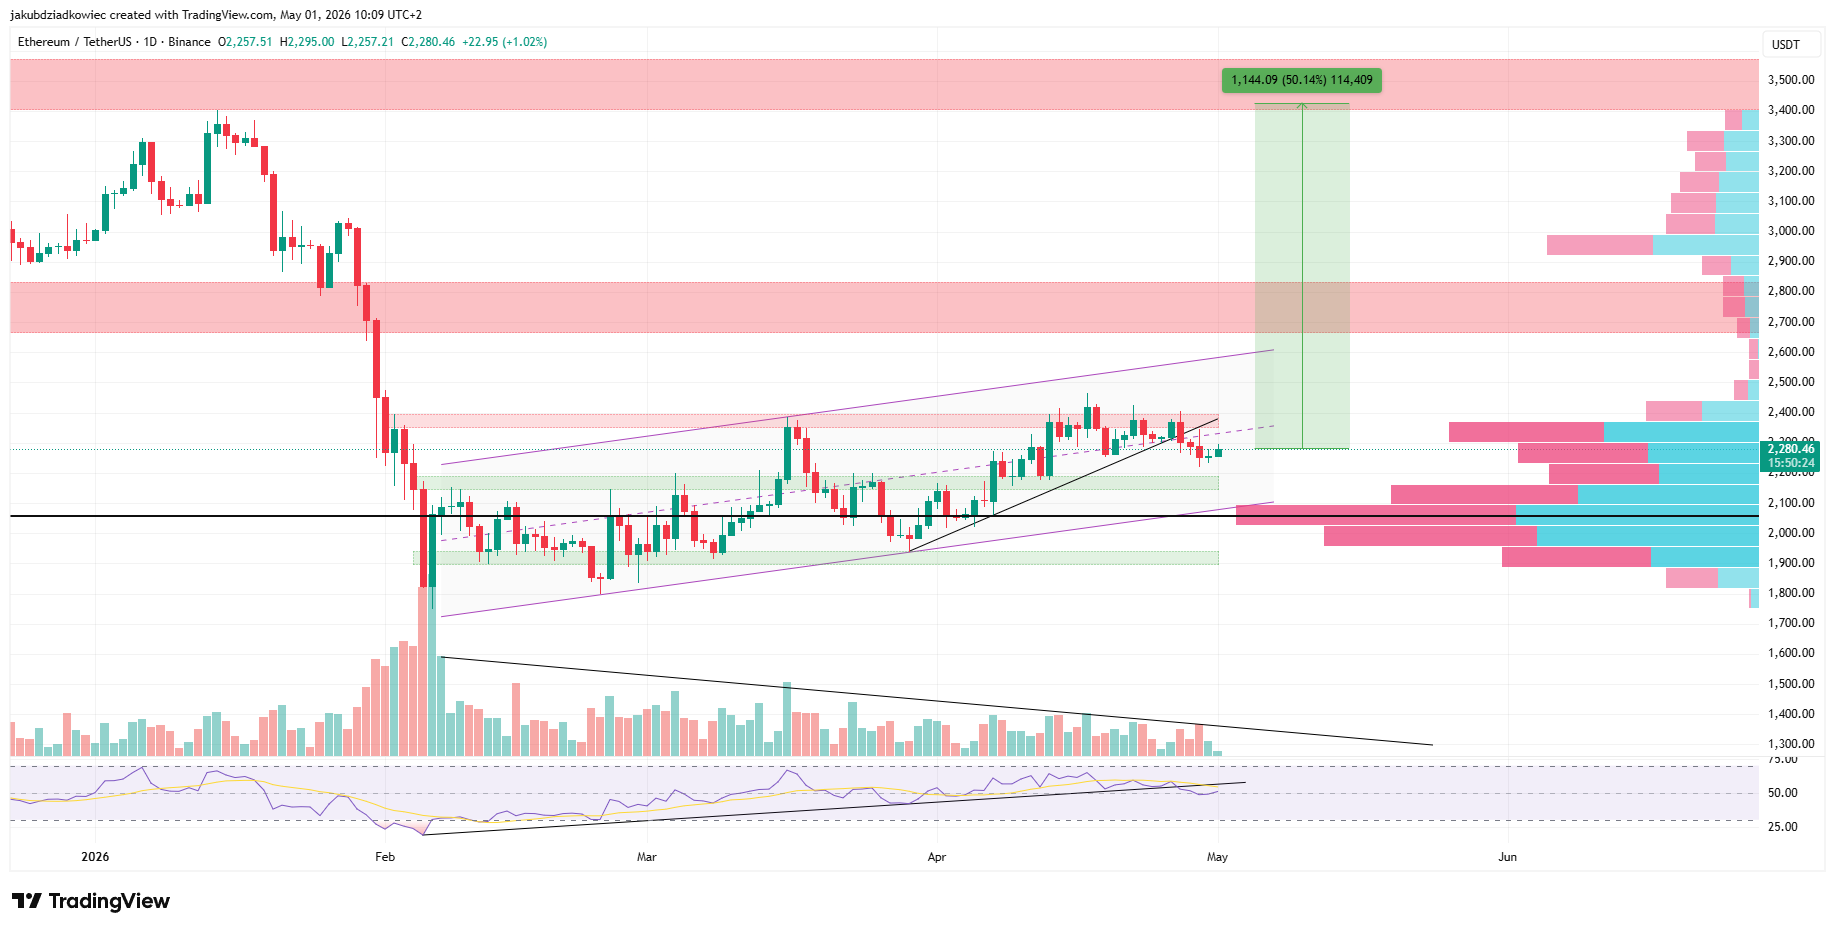
Ethereum trades at $2,280, inside an ascending parallel channel that has guided price action since February. The token broke below the channel midline on April 27, a structural shift that put bears in temporary control.
That breakdown coincided with the daily Relative Strength Index (RSI) breaking through its own ascending trendline. The double trendline failure is a bearish confluence that often precedes deeper retracements.
However, the breakdown volume contracted rather than expanded. The Visible Range Volume Profile (VRVP) on the right side of the chart shows heavy accumulation around $2,050, which now overlaps with the lower band of the rising channel and serves as the primary downside target if sellers press the move.
A clean reclaim of the channel midline opens the door to a 50% measured move toward $3,430. Closer overhead resistance sits at $2,750, the prior swing high that bulls would need to clear before the long-range target comes into view.
Trader Fractal Points to the Same $3,430 Magnet
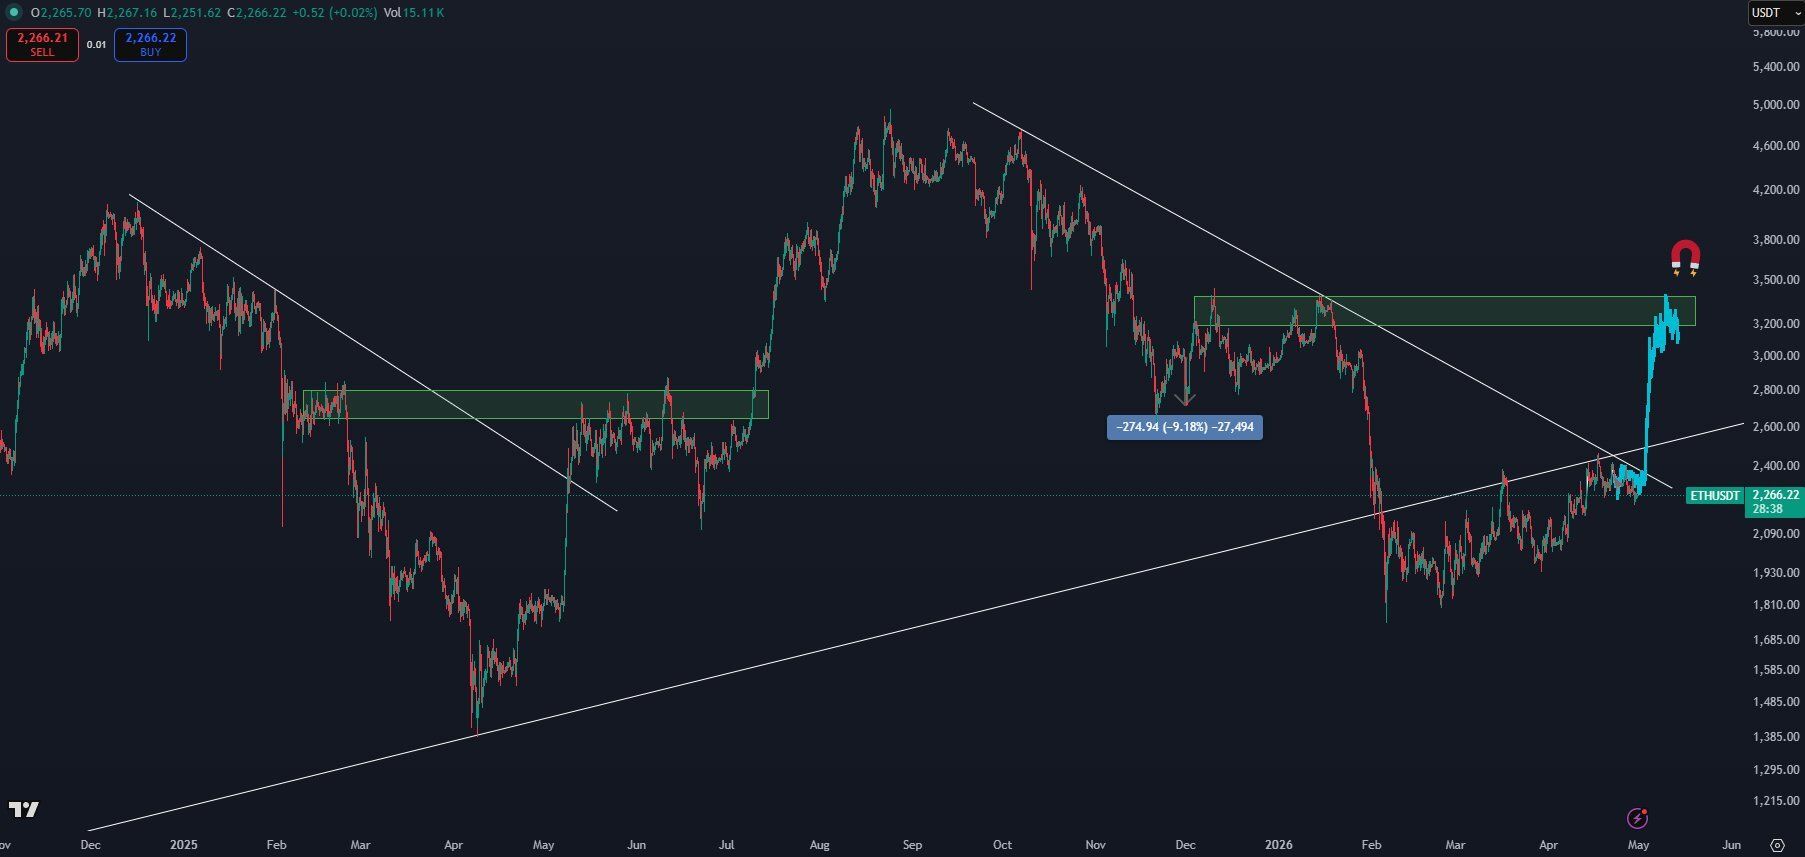
Trader CryptoKaleo published a daily Ether chart on X that arrives at the same $3,430 zone from a different angle. He marks two falling trendlines that the price has already started to break through, a pattern he says mirrors a similar fractal from earlier in 2025.
The earlier setup resolved with a fast move higher after consolidation under resistance. Kaleo treats the prior move as the template for what could follow this base.
His drawn target zone overlaps cleanly with the long-range resistance from the channel chart. Two independent technical reads landing on the same $3,430 area strengthen the case that ether bulls have a defined upside objective if the breakdown fails to extend.
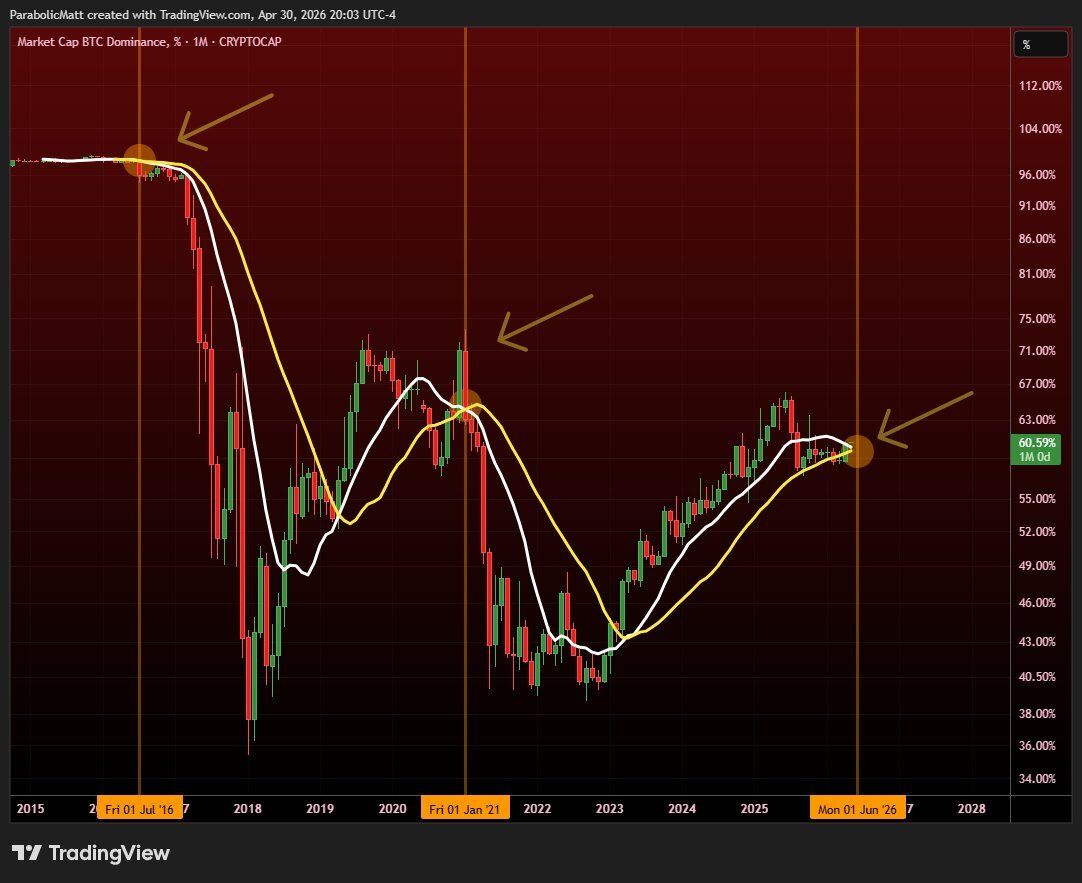
Bitcoin Dominance Approaches Its Third Monthly Death Cross Ever
Analyst Matthew Hyland flagged a monthly death cross brewing on the Bitcoin dominance chart, with the slower yellow moving average set to cross below the faster white moving average around June 2026.
The signal has appeared only twice before in the asset’s history. The first cross arrived in July 2016, and the second in January 2021. Both events were followed by sharp drops in dominance and aggressive rotations into altcoins.
BTC.D currently prints a 60.59% monthly close. Even with dominance still elevated near multi-year highs, the structural setup behind the chart suggests the path of least resistance over the coming months may be lower, not higher.
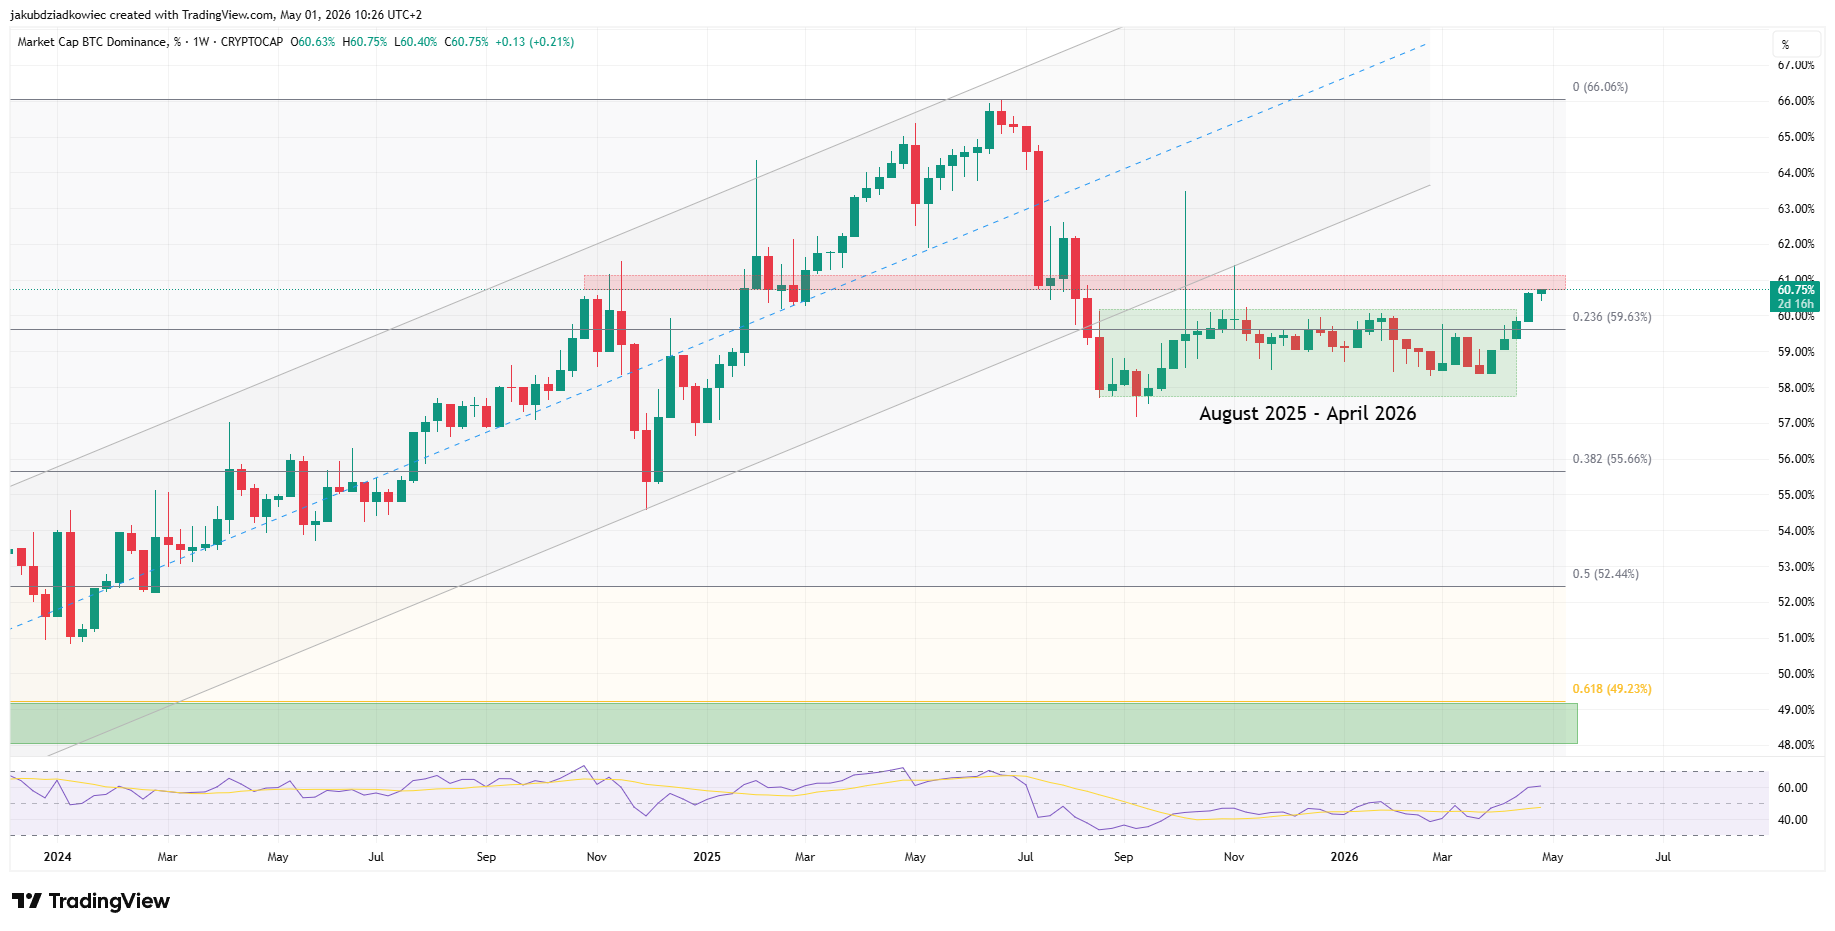
BTC Dominance Tests 61% Resistance That Decides Altseason
The weekly chart adds precision that the monthly view cannot. Bitcoin Dominance climbed inside an ascending channel for years before breaking down in August 2025, then traded sideways inside an accumulation box from August 2025 through April 2026.
Over the past two weeks, BTC.D pushed out of that range and is now stalling at 60.75%, just below resistance at 61%. That level is the line that decides the next macro move.
A clean break above 61% would open the door to 62% and the 66% June high. A rejection lines up with the monthly death cross thesis and points price action down toward the 0.618 Fibonacci retracement at 49.23%.
Ethereum’s $3,430 breakout and Bitcoin Dominance’s drop toward 49% are two sides of the same altcoin trade. The 61% level on dominance and the channel midline on ETH are the binary triggers to watch over the coming weeks.
The post Bitcoin Dominance Nears Death Cross, Ethereum Could Trigger Altcoin Season appeared first on BeInCrypto.
Key points:
- Bitcoin will have to flip the $80,000 level into support to continue its up move to $84,000.
- Several major altcoins are finding buyers at lower levels, but they will have to overcome the overhead resistance to start a new up move.
Bitcoin (BTC) has risen above $78,000, extending upon its 11.87% rally in April, per CoinGlass data. The recovery in April was supported by solid buying in the US spot BTC exchange-traded funds, which saw $1.97 billion in inflows, according to SoSoValue data.
The rally is expected to encounter selling in the zone between the True Market Mean at $78,000 and the Short-Term Holder (STH) cost basis at $79,000. Analysts are closely monitoring the $80,000 level, which needs to be flipped into support for confirmation that bulls remain in control.

Crypto market data daily view. Source: TradingView
CryptoQuant is not convinced that BTC’s rally could extend further. In a recent report, the crypto analytics firm said that BTC’s up move in April was fuelled mainly by futures traders, while spot demand contracted. That suggests “the market’s marginal buyer was speculative, not fundamental.” CryptoQuant warned in an X post that the exact setup had “preceded the next leg down” in 2022.
Could BTC and the major altcoins break above their overhead resistance levels? Let’s analyze the charts of the top 10 cryptocurrencies to find out.
Bitcoin price prediction
BTC turned up from the 20-day exponential moving average ($75,814) on Thursday, indicating buying on dips.

BTC/USDT daily chart. Source: Cointelegraph/TradingView
The relief rally is expected to face selling pressure at $79,500, but if buyers pierce the overhead resistance, the uptrend is expected to gain momentum, and the BTC/USDT pair may rally to $84,000.
The 20-day EMA is the crucial support to watch out for on the downside. If the BTC price turns down from the current level or the overhead resistance and breaks below the 20-day EMA, it may start a deeper correction to the 50-day simple moving average ($72,362) and then the support line.
Ether price prediction
Ether (ETH) is finding support near the 50-day SMA ($2,207), indicating that bulls are viewing the dips as a buying opportunity.

ETH/USDT daily chart. Source: Cointelegraph/TradingView
The flattening 20-day EMA and the relative strength index (RSI) just above the midpoint suggest weakening momentum. If the ETH price turns down and breaks below the 50-day SMA, the next stop is likely to be the support line.
Instead, if the price remains above the 20-day EMA, the bulls will attempt to drive the ETH/USDT pair to $2,465 and then to the ascending channel’s resistance. The next trending move is expected to begin on a close above the resistance line or below the support line. Until then, the pair may remain inside the channel.
XRP price prediction
XRP (XRP) remains stuck inside the $1.27 to $1.61 range, signaling buying on dips and selling on rallies.

XRP/USDT daily chart. Source: Cointelegraph/TradingView
The 20-day EMA ($1.39) has started to turn down gradually, and the RSI is near the midpoint, indicating a slight edge to the bears. If the XRP price remains below the moving averages, the likelihood of a drop to the $1.27 support increases.
Buyers are likely to have other plans. They will attempt to thrust the price above the moving averages. If they succeed, the XRP/USDT pair may rally to the downtrend line of the descending channel pattern, then to the $1.61 resistance. A trend change will be signaled on a close above the $1.61 level.
BNB price prediction
BNB (BNB) slipped below the moving averages on Tuesday, but the bears have failed to build upon their advantage. That suggests demand at lower levels.

BNB/USDT daily chart. Source: Cointelegraph/TradingView
The bulls are attempting to push the BNB price back above the moving averages. If they manage to do that, the BNB/USDT pair may rise to $654 and then to the $687 overhead resistance.
On the other hand, if the price turns down and breaks below $610, it signals that the sellers remain in control. The pair may then tumble toward the $570 support, where the buyers are expected to step in.
Solana price prediction
Buyers are attempting to sustain Solana (SOL) above the $82.65 level but the bears continue to exert pressure.

SOL/USDT daily chart. Source: Cointelegraph/TradingView
If the $82.65 level cracks, the SOL/USDT pair may decline to $76. Buyers are expected to defend the $76 level with all their might, as a close below it may start the next leg of the downward move to $67.
On the contrary, if the SOL price rises above the moving averages, it suggests that the pair may remain inside the $82.65 to $90.73 range for some time. A close above $90.73 opens the gates for a retest of the $98 overhead resistance.
Dogecoin price prediction
Dogecoin (DOGE) is showing strength, as bulls prevented the pullback from dipping below the $0.10 level on Thursday.

DOGE/USDT daily chart. Source: Cointelegraph/TradingView
That increases the likelihood of a rally to the $0.12 overhead resistance, where the bears are expected to mount a strong defense. If the price turns sharply lower and breaks below the moving averages, it suggests the DOGE/USDT pair may remain within the $0.09 to $0.12 range for a while longer.
Alternatively, if buyers overcome the $0.12 obstacle, it suggests that the pair may have bottomed out in the near term. The DOGE price may rise to $0.14 and later to $0.16.
Hyperliquid price prediction
Hyperliquid (HYPE) fell below the 50-day SMA ($39.84) on Thursday but the long tail on the candlestick shows buying at lower levels.

HYPE/USDT daily chart. Source: Cointelegraph/TradingView
The bulls are striving to push the HYPE price above the 20-day EMA ($40.85). If they manage to do that, the HYPE/USDT pair may rally toward the $43.76-$45.77 overhead resistance zone. A close above the zone clears the path for a rally to $50.
Contrary to this assumption, if the price turns down and breaks below $38.70, it signals that the bears are selling on rallies. That may start a deeper pullback to $37.77 and subsequently to $34.45.
Related: Did Dogecoin bottom first? DOGE price poised for 20% gains as whales return
Cardano price prediction
Cardano (ADA) has been clinging to the moving averages, indicating that the bulls have kept up the pressure.

ADA/USDT daily chart. Source: Cointelegraph/TradingView
That improves the prospects of a break above the downtrend line. If that happens, the ADA/USDT pair may surge to $0.32 and later to $0.37, signaling a potential short-term trend change.
This bullish view will be invalidated in the near term if the ADA price turns sharply lower and breaks below $0.22. Such a move suggests that the pair may remain inside the descending channel for a few more days.
Bitcoin Cash price prediction
Bitcoin Cash (BCH) bounced off $443 again, indicating that the bulls are aggressively defending the level.

BCH/USDT daily chart. Source: Cointelegraph/TradingView
There is minor resistance at the 50-day SMA ($453), but it is likely to be crossed. The BCH/USDT pair may then soar to $486, at which point bears are expected to sell aggressively. However, if buyers overcome the barrier, the pair may rally to $520.
Contrary to this assumption, if the BCH price turns sharply lower from $486 and breaks below the moving averages, it suggests that bears remain sellers on rallies. That may keep the pair range-bound between $419 and $486 for some time.
Monero price prediction
Monero (XMR) bounced off the 20-day EMA ($366) on Wednesday, indicating a positive sentiment.

XMR/USDT daily chart. Source: Cointelegraph/TradingView
The upsloping 20-day EMA and the RSI in positive territory indicate that the path of least resistance is upward. If buyers push and maintain the XMR price above the $406 resistance, the rally may reach the $500 level.
Conversely, if the price turns sharply lower from the overhead resistance and breaks below the moving averages, it suggests that the XMR/USDT pair may remain range-bound between $302 and $406 for some time.

Miami Grand Prix: Lando Norris on pole for sprint race ahead of Kimi Antonelli

LARRY KUDLOW: Harvard-Harris poll shows America is behind Donald Trump and the GOP

SBI Holdings Moves to Acquire Bitbank Exchange in Japan Crypto Push Deal
Manchester United reach agreement with Casemiro over contract clause amid transfer speculation

US brings back mandatory military draft registration

Steven Gerrard disagrees with Gary Neville over ‘shock’ Chelsea and Arsenal claim | Football


-
 Tech4 days ago
Register Renaming | Hackaday
-
Crypto World6 days ago
Hyperliquid $HYPE Rally Builds Momentum as AI Sector Enters Prove-It Phase
-

 Politics4 days ago
Drax board avoid their own AGM, accused of greenwashing & environmental racism
-

 Tech4 days ago
Images of Samsung’s rumored smart glasses have leaked
-

 Tech5 days ago
Why Blue Badges Disappeared From Toyota Hybrids
-
 Sports5 days ago
IPL 2026: Ruturaj Gaikwad registers slowest fifty of the season, enters all-time unwanted list | Cricket News
-
 Tech3 hours ago
Trump’s 25% EU auto tariff breaches Turnberry Agreement that also covers semiconductors and digital trade
-

 NewsBeat6 days ago
LK Bennett closes all stores after entering administration
-

 Fashion3 days ago
Kylie Jenner’s KHY Enters a New Era with ‘Born in LA’
-
 Entertainment6 days ago
Mariah Carey Slams Deposition Claims In Brother’s Lawsuit
-

 Business3 days ago
Most Commercial Energy Audits Miss the Real Losses
-

 Business4 days ago
(VIDEO) Charlize Theron Climbs Times Square Billboard to Promote New Netflix Thriller ‘Apex’
-

 Crypto World3 days ago
CFTC’s AI will review U.S. crypto registration applications, chairman tells CoinDesk
-

 Business2 days ago
Barclay Brothers Avoid Bankruptcy: HSBC Drops High Court Petitions After IVA Deal
-
 Sports3 hours ago
Paul Scholes issues Marcus Rashford reality check as agreement emerges over Man United star
-

 Tech6 days ago
Microsoft to roll out Entra passkeys on Windows in late April
-

 Tech6 days ago
OpenAI’s Sam Altman apologizes for not reporting ChatGPT account of Tumbler Ridge suspect to police
-

 Tech6 days ago
OpenAI CEO apologizes to Tumbler Ridge community
-
 Business2 days ago
Tesla Officially Registers Elon Musk’s Stock: What Investors Need to Know
-

 Tech3 days ago
Get Ready for More Brain-Scanning Consumer Gadgets
You must be logged in to post a comment Login